- 1Xi’an University of Finance and Economics, Xi’an, China
- 2International College, Krirk University, Bangkok, Thailand
Introduction: In vulnerable environments, accurate and complete assessments of green water efficiency (GWE) must consider unexpected outputs.
Methods: This study employed the hyper-efficiency SBM-DEA model and SDM method to investigate the spatial heterogeneity and the determinants of GWE, respectively, in nine Chinese provinces along the Silk Road Economic Belt (SREB), which is characterized by a vulnerable ecological and economic system.
Results: Using data from 2008 to 2019, this study found that the green performance indicator varied in these provinces; GWE showed substantial spatial heterogeneity, with a negative spatial autocorrelation among the provinces with a low-to-high or high-to-low distribution. The southwest provinces had a higher GWE than the northwest, but there was no significant GWE improvement in the whole region. Both governmental engagement and environmental protection were the most influential determinants of GWE, which showed spatial spillover effects, followed by water pollution then economic growth, demonstrating that the GWE in vulnerable ecosystems may be changed by any factor depending on unexpected outputs.
Discussion: This study suggests that reducing the side effects of unexpected outputs in vulnerable environments, because the ecosystem will be redamaged by unexpected contaminants when improving the local GWE.
1 Introduction
Green water efficiency (GWE) has been extensively investigated in various ecological environments, particularly in water runoff from fields (Huang et al., 2021; Qiu et al., 2022). However, studies of GWE in vulnerable ecological environments are scarce. As such, with this study, this study contributes to filling this gap in the literature, examining the spatial heterogeneity of GWE and its determinants in the Chinese provinces along the Silk Road Economic Belt (SREB), where both economic and ecological systems are weak.
The entire SREB area is characterized by rainfall shortages and drought, and water resource shortages and poor water quality are prominent problems. Much of the land is situated in semiarid and arid regions, where the natural environment is highly vulnerable in terms of water resources (Libert et al., 2008). The water resources in the region are insufficient for agricultural irrigation, which weakens the local economy (Varis, 2014). Water quality has been worsened due to the increasing amounts human activities (Tornqvist et al., 2011). Water shortages are restraining regional economic development and exacerbating the ecological poverty in the region. Therefore, GWE in the SREB has become a crucial issue, and advanced studies addressing the issue from more perspectives will facilitate regional water conservation and sustainable development.
The environment in this area is not only ecologically vulnerable, but also economically vulnerable, because of the critical disparate economic development between the provinces. Under this complex circumstances of vulnerable economic and ecological systems, existing studies on urban, rural, and runoff did not address the GWE issues, because the majority of studies assessed GWE from the economic and resource endowment perspectives (Huang et al., 2021). This study bridges this gap. Building upon the existing literature, this study builds an updated theoretical framework considering the social efficiency of water usage to explore GWE solutions in a vulnerable environment. Social efficiency refers to civil water usage, which is measured with five factors.
Water resource conservation performance is another aspect of a comprehensive GWE assessment. The local government should be involved in water resource conservation through policy-oriented strategies. For instance, governments should restrict irrational virtual grain water flow to increase water savings and environmental benefits through rigorous trading policies (Zhai et al., 2021). Similarly, Yang and Zehnder (2002) found that the virtual water trade strategy is important for promoting water-use efficiency and decreases the pressure on local water resources. In addition, any other efficient approaches of managing water scarcity should be encouraged, such as plastic mulch practices (Ingman et al., 2015). Therefore, government engagement in water conservation is an integrated perspective from which to assess GWE.
One of this study’s contributions is the use of a novel theoretical framework to comprehensively assess GWE, which contains 23 factors from 4 decision-making units (DMUs): economy, resource endowment, social efficiency, and ecological protection. Because of the vulnerability of the environment, societal water-use efficiency and governmental involvement in ecological protection are essential for a comprehensive GWE assessment.
As a major economic and cultural channel connecting the Asia-Pacific and European economic circles, the SREB has considerable development potential. However, this area is restrained by its fragile ecological environment, and water shortages have become a barrier to the strategic development along the route, particularly in China. This study evaluated the level of GWE, and identified the most influential determinants in the Chinese area of the SREB. The findings contribute to the sustainable development of water resources in China, and provide reference values for other countries along the SREB.
2 Literature review and theoretical framework
The relationship between economic development and ecosystems has been widely examined from three aspects: economy, natural resource abundance, and environmental protection. Many researchers have investigated the interaction between economic development and green water efficiency. For instance, ecological and socioeconomic systems affect each other through socioeconomic factors (Arto et al., 2019). The over-exploitation of natural resources seriously ruins the ecological system and impacts economic sustainability (Xing et al., 2019). However, this interaction can be positive in two ways: sustainable economic development may support the ecological environment and protect the ecosystem (Vorosmarty et al., 2018), and a healthy ecosystem generates sustainable resources for human life and economic development (Chen et al., 2013). Therefore, the relationship between them is initially negative in a vulnerable environment, but may be positive if they are treated in balance.
To address this imbalance between economy and environment, local governments should become engaged by initiating environmental protection schemes for economic sustainability. In this context, the green economy has been proposed for sustainable cradle-to-cradle (C2C) economic growth (McDonough and Braungart, 2002), which involves recycling and reproducing the outputs (pollutants and waste) into new materials and energy resources. Sharma et al. (2020) argued that waste-to-energy techniques can be used to effectively solve challenges. The positive relationship between waste reproduction, recycling rate, and economic sustainability was demonstrated (Geng et al., 2012). Additionally, Zhao et al. (2021) found that industrial structure advancement strongly promotes the green economy in China. Therefore, in a vulnerable environment, this sustainable development model of a circular economy should be widely promoted to improve the economy while consuming fewer natural resources.
Resource-consuming economic development is unfeasible in vulnerable environments. This study argues that social-efficiency-related development is more efficient and cost-effective than others in terms of GWE in the fragile SREB, because economic development may improve social efficiency. For example, the growing national economy may lead to enhanced civil infrastructure (Srinivasu and Rao, 2013) and improve residential living standards. Jalali and Rabotyagov (2020) demonstrated that sound infrastructure, particularly agricultural infrastructure, can improve GWE. Additionally, some argued that social efficiency may affect environmental protection. However, few researchers have considered social efficiency.
With the aforesaid theoretical underpinning, we included social efficiency (infrastructure and living standard) in the analysis, and developed an updated framework as depicted in Figure 1.
Figure 1 demonstrates the direct (h, i, f, g) and indirect (a, b, c, d, e) effects on GWE from the perspective of four decision-making units. The plus symbols refer to the positive effects. In a fragile ecosystem, for an accurate GWE assessment, the unexpected outputs (pollutants) must be considered, which may easily damage the system (Huang et al., 2021). L1s represents the expected outputs; L2s represents the unexpected contaminants. When L1s > L2s, the expected outputs are greater than unexpected, and the economic activities will be conducted. For instance, economic development potentially contributes social efficiency (a1), but it also generates some contaminants (a2).
The green routes are acceptable and feasible solutions for water sustainability, provided outputs are substantially larger than inputs, as demonstrated in Tables 8, 9. Improved social efficiency contributes to GWE (f1), which also yields some unexpected pollution (f2), but is still worthy to promote because f1>f2. This is a crucial viewpoint but has not been fully discussed in fragile ecosystems, because the population growth and the associated growth in consumption exert an ever-increasing pressure on supply sources (Levova and Hauschild, 2011), which consequently generates a wide range of social and environmental problems (Falkenmark, 2008). Additionally, with economic growth in water-consuming industries, the government and enterprises should invest more in managing water pollutants (Cucek et al., 2012), namely, water resource preservation (c), which is not only beneficial for natural endowment (e), but also improves GWE provided g1>g2 in an efficient way.
The minus symbols refer to a negative effect and are not encouraged in the long term. For instance, h1>h2 indicates unsustainable development sacrificing water resources for economic growth in the short term, such as in water-consuming industries (Cucek et al., 2012). Conversely, optimizing the industrial structure and developing technologies may improve the ecosystem, such as through the application of remote sensing technology (Zhao et al., 2017). However, economic growth resulting from natural resource exploitation (b) along the red route should be discouraged or prohibited because of its negative effects, regardless of the outputs. Audirac (2014) named the “shrinking cities” in Latin America; here, the natural resources are insufficient to support local economy, so serious problems, such as economic recession, population loss, and environmental degradation, will occur.
The letter i represents higher natural resource endowments, higher GWE, and vice versa. Zhao et al. (2021) suggested that insufficient water resource endowments have restrained the green development of the Yellow River Basin. The vast literature demonstrates the interaction between natural resources and water efficiency. For instance, stream flow in the western United States depends on the abundance and timing of snow melt that occurs months in advance (Hostetler and Alder, 2016); vegetation production is closely related to water deficits (Littell et al., 2008). Restricted by natural resources, social efficiency is more feasible and cost-effective in vulnerable environments, although other DMUs influence the GWE, such as technology innovation for water conservation and irrigation. Therefore, this study hypothesized that an association exists between social efficiency and GWE.
As reviewed above, although the related literature has laid a theoretical foundation for GWE, social-efficiency-related factors have not yet been fully discussed. This study builds an updated theoretical framework to bridge this gap, considering a variety of factors indicating by the theoretical underpinning. This study adopted a hyperefficiency SBM-DEA model to investigate the input–output performance considering unexpected contaminants, and resolved the issue of excess inputs and shortfalls in outputs, to achieve the efficiency evaluation of unexpected outputs.
3 Methodology and variables
3.1 Hyperefficiency SBM–DEA model
3.1.1 Model development
Based on the hyperefficiency data enveloping analysis (DEA) and slack-based model (SBM), Tone (2001) developed a hyperefficiency SBM–DEA model to investigate input–output performance with unexpected environmental outputs (contaminants). This method has been widely used to examine GWE, because it can resolve the issue of excesses in inputs and shortfalls in outputs (called slacks), and can evaluate efficiency with unexpected outputs. Therefore, the method can accurately and comprehensively evaluate the green efficiency of water resources.
Assuming a certain number of DMUs, each one has three components: input (xik), expected output (yrk), and unexpected output (btk). Under expected output circumstances, a green efficiency value can be evaluated using a hyperefficiency SBM-DEA model group as:
where xik is the input amount (k) for DMU i, yij is the output amount (j) for DMU i, btk represents the output restraint cone of an element in row t and column k, and λ is a coefficient of a DMU linear combination. m,
Therefore, considering unexpected contaminants, this study employed the hyperefficiency SBM-DEA model with four DMUs (resource, economic, social, and ecological performance) to investigate GWE.
3.1.2 Indicator measurement
This study obtained the GWE indicators in this study from four DMUs: natural resources (A), economic performance (B), social efficiency (C), and ecological protection (D). Each DMU consisted a number of indicators in the subordinate and indicator layers.
Supplementary Appendix S1 outlines the 19 hierarchical indicators grouped into 9 subordinate layers of the 4 DMUs. This study measured the first DMU (natural resources), divided into three subordinate layers (A1-3), with six indicators. This study measured the second DMU (economic performance), which included two subordinate layers (B1-2), with six indicators as well. This study measured the third one (social efficiency), with two layers (C1-3), using five indicators. This study measured the final one (ecological prevention) with six indicators from two subordinate layers. The + symbol indicates bigger and better; the - symbol indicates less and better.
This study calculated the weight coefficients (wj) of these factors step-wise with the entropy methods in Eqs 2–7. First, this study standardized these factors to values between 0 and 1 with Eqs 2, 3 to remove their dimensional disparity, facilitating comparison with each other.
where x’ij is a standardized value; xij represents an initial value of indicator i in year j; max(xj) and min(xj) refer to the maximum and minimum value of indicator i in year j, respectively. After the step-wise calculations in Eqs 4, 5, this study obtained the discrepancy coefficients of the indicators (information efficiency values) with Eq. 6. Then, this study calculated the weight coefficients with Eq. 7.
Finally, this study calculated the total value of the indicators of all DMUs with Eq. 8.
3.2 Global spatial autocorrelation analysis
This study adopted spatial autocorrelation analysis to study the cluster and spatial heterogeneity of the GWE in the nine regions. Following Qiu et al. (2022), this study employed a global spatial autocorrelation analysis of Moran’s I to investigate the spatial clustering significance of GWE attributed to the variables in the nine provinces. It evaluated the global Moran’s I with Eq. 9, computed in the statistical software Stata.
where It is the global Moran’s I index of the whole region in period t; n is the number of spatial observation objects in the study area; xit and xjt refer to the values of the observation counterparts from regions i and j in period t, respectively;
Tobler (1970) found a negative relationship, where the autocorrelation becomes weak as the geographical distance increases; and an uncoordinated relationship, where strong economy-based cities have a more substantial impact on the neighboring cities than others in terms of water resource performance. Therefore, including economic factors, this study updated the spatial weight matrix wij as an economic spatial weight matrix evaluated with Eq. 10.
Here,
3.3 Spatial econometric model
Water resources, characterized by liquidity, have various spatial features that differ in different regions. This study employed spatial econometric models to investigate the most influential factors affecting the green efficiency of water resources in the SREB. It has been used to investigate spatial variables (Elhorst, 2014) and is expressed as below.
Here,
As the green efficiency of water resources is determined by various factors (Chen and Bai, 2013), this study included seven independent variables into the SDM to investigate the GWE, as described in Supplementary Appendix S2. Additionally, China has been undergoing further opening up, with substantial foreign capital inflows facilitating upgrades in green technology, and improvements in management practices and environmental standards; thus, the level of regional opening-up should be reflected by foreign direct investment (FDI), which potentially facilitates resource conservation and pollution control (Mielnik and Goldemberg, 2002). This factor has not been extensively discussed the literature. This study measured the level of openness in each province with the actual amount of FDI.
4 Results and analysis
4.1 Descriptive analysis of green indicators
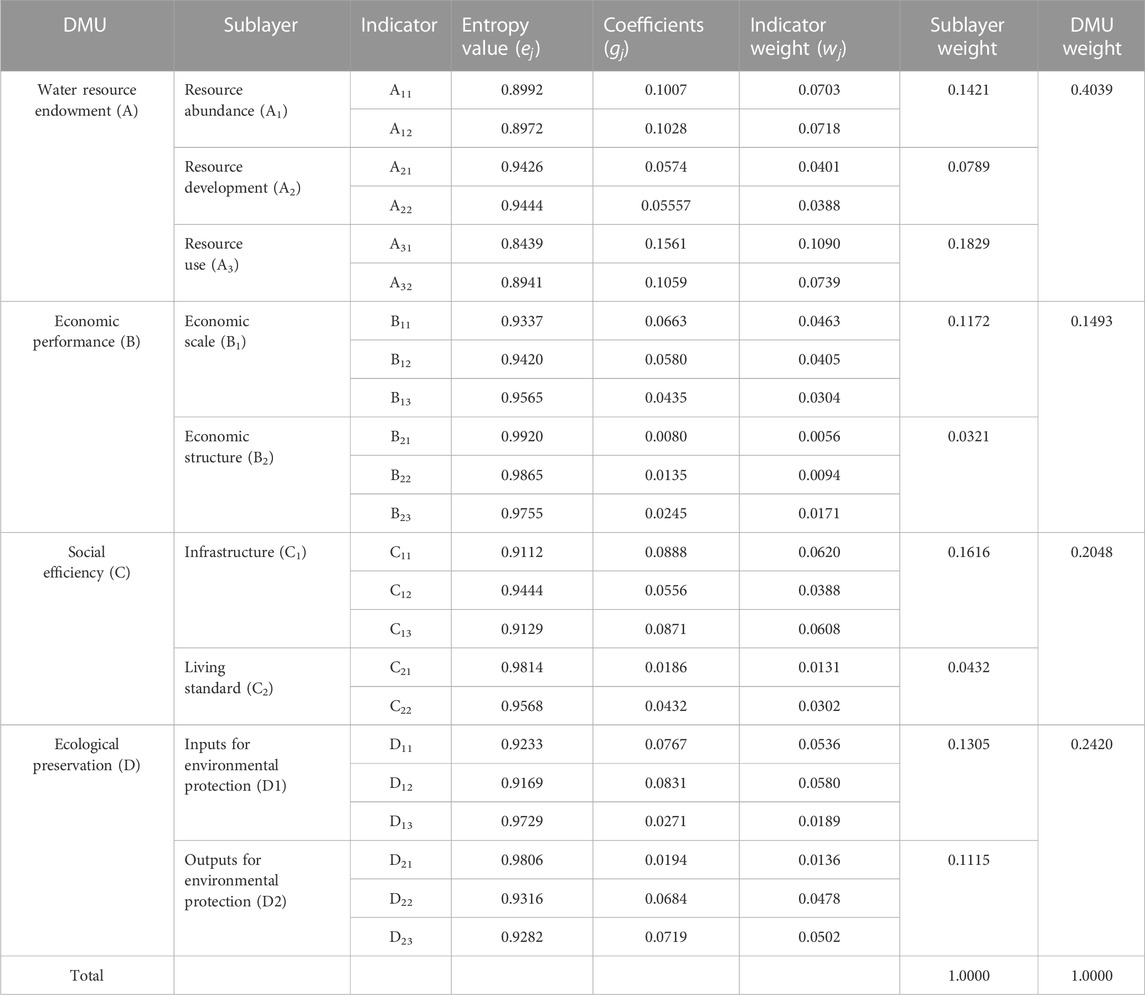
Table 1 shows the hierarchy coefficient weight of the DMUs according to Eqs 5–7. The resource-endowment-related indicators (A) were most influential, accounting for 40.39% of the total contributions, followed by ecological preservation (D) and social-efficiency-related (C) indicators, which accounted for 24.20% and 20.48%, respectively. This finding imply that these resource-weak places should enhance their ecological preservation practices, and then improve their social efficiency to achieve sustainable development, which would be more efficient than promoting economic indicators (B).
In particular, resource use (A3) was more important than others, which means that improving resource use efficiency with fewer unexpected outputs (contaminants) is crucial for GWE. This study found that water infrastructure is also critical for water sustainability.
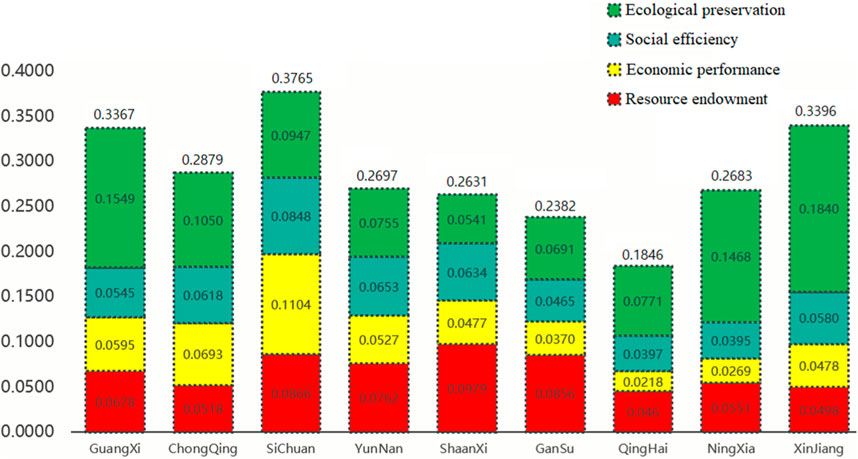
According to Eq. 8 and Figure 2 outlines the indicator values of all DMUs in the nine provinces from 2008 to 2019. Sichuan ranked first because of its outstanding performance in four aspects, particularly in economy (0.1104). Sichuan was followed by Xinjiang and Guangxi.
In terms of ecological preservation (D), Xinjiang was strongly predominant (0.1840), which may have been due to its favorable geographical location, that is, featured by a range of snow-covered mountains, including the Altai, Tianshan, Kunlun, and Karakoram Mountains. In addition, the small population in Xinjiang may have contributed to this finding. Xinjiang was followed by Guangxi (0.1549), where the water resources were insufficient, though the water-saving irrigation practices for sustainable agriculture in Guangxi have advanced (He et al., 2021). Ningxia, because of its serious water shortages, has built advanced infrastructure for water savings.
In terms of social efficiency (C), Sichuan performed well (0.0848), followed by Yunnan (0.0653) and Shaanxi (0.0634), because these provinces had a relatively strong economy, which may have contributed to the development of social infrastructure. Additionally, the economic structure of Sichuan is stronger than in other areas, so its economic performance was the best (0.1104).
Regarding water resource endowment, both Shaanxi and Gansu provinces had larger resources because the Huanghe River runs through them. The Yangtze River runs through Sichuan, which has sufficient runoff water resources as well.
4.2 Results of GWE
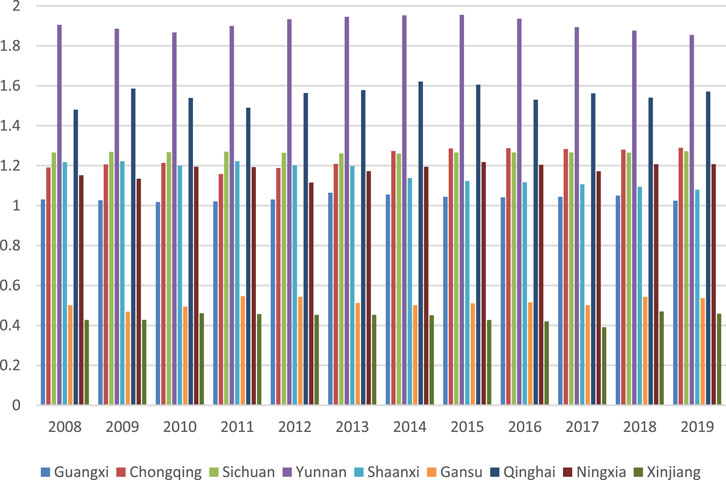
After obtaining the weight of all green indicators, this study calculated the GWE-based on input-output performance using Eq. 1. Figure 3 presents the results of the provincial GWE from 2008 to 2019. In general, the majority of values were larger than one, which indicated that the majority of provinces had achieved water green development during the study period. Particularly, Yunnan province showed the most remarkable change in green efficiency, followed by Qinghai and Sichuan. However, both Gansu and Xinjiang were farther from the green target, even though some of the green indicators in Xinjiang were outstanding (Figure 2).
As Figure 3 showed, three provinces (Chongqing, Yunnan, and Qinghai) had the largest amounts of green resources, but their green efficiency was not remarkable due to the unexpected outputs (i.e., contaminants) as measured by the hyperefficiency SBM-DEA model, which suggested that less pollution is required to increased green water efficiency. Therefore, resource abundance does not necessarily mean a high GWE, so high water-use efficiency and the production of fewer contaminants should be encouraged. Resource-insufficient regions may achieve sustainable green efficiency if they improve their water-use performance.
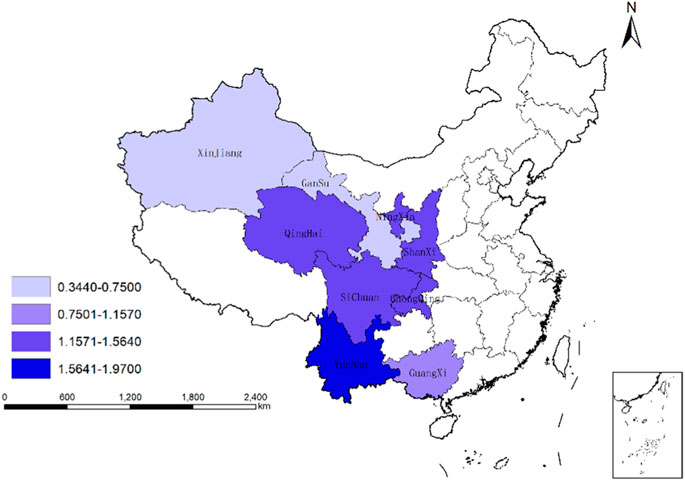
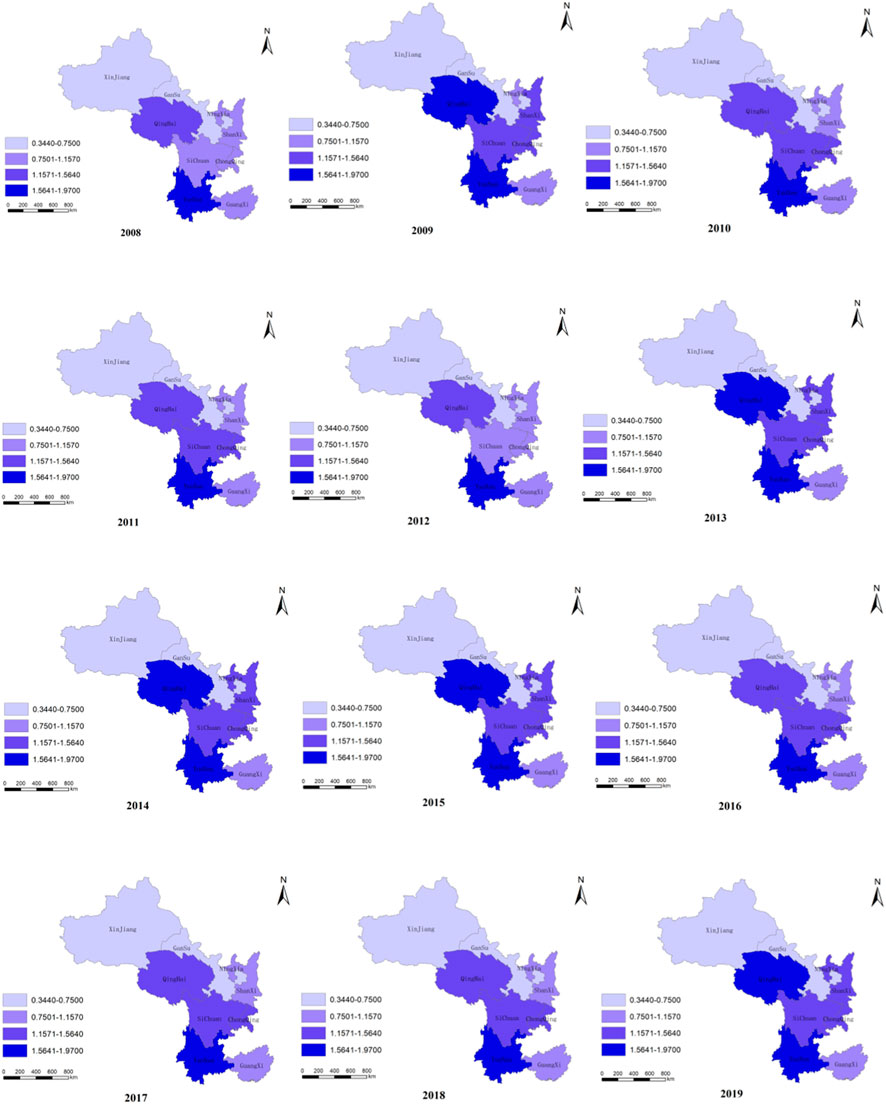
Figure 4 visualizes the spatial distribution of GWE in the nine provinces. Yunnan was dominant during the period, while both Xinjiang and Gansu underperformed.
Figure 5 shows the temporal heterogeneity of GWE from 2008 to 2019. Overall, the most notable feature is the insignificant improvement in GWE during the period. Yunnan performed well; similarly, this study found no significant improvement in GWE in Guangxi. Contrastingly, both Xingjiang and Gansu underperformed every year, and Qinghai fluctuated, performing better 2013–2015, 2009, and 2019. Another remarkable feature is the dispersion, rather than cluster, pattern that this study observed among them.
With the rapid economic growth in China during the study period, these provinces experienced economic growth as well, but this growth was partially attributed to remarkable water resource consumption, which generated tremendous amounts of pollution and decreased their GWE. Some provincial governments, such as those of Yunnan and Qinghai, implemented a range of ecological policies to protect the environment and improve water-use efficiency, which should have contributed to increasing the GWE, but others did not. Therefore, this temporal heterogeneity could be attributed to the differences in local social efficiency and ecological protection.
4.3 Global spatial autocorrelation results
To further demonstrate the spatial heterogeneity of the results, this study analyzed global Moran’s analysis to take an insight into it. Table 2 shows the results of the global Moran’s I index calculated using the nested weight matrix of economy and distance integration, which were significant at the 5% level. Negative indices indicate the dispersion of GWE in the area during the period. In other words, once a province had higher green efficiency, the efficiency of the neighboring provinces would be lower, and vice versa. This result is consistent with that in Figure 5.
4.4 SDM results
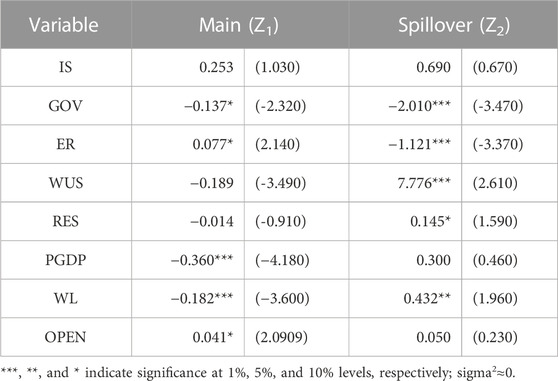
The results in column (1) in Table 3 show that three factors: GOV (−0.137), PGDP (−0.360), WL (−0.182) had a negative relationship with GWE. This means that the inappropriate involvement of the local government restrained the sustainable development of water, because more unexpected contaminants were generated (g2>g1). The local economic development also interrupted water sustainability as well, while water pollution worsened in the region partially due to the expansion of the local economy. Contrastingly, the increased openness with increasing investment may have contributed to the local GWE because of their positive relationship (0.041). However, the remaining factors did not significantly contribute to water sustainability.
The spillover column (2) shows the spillover effects of these factors on GWE. The negative effect of governmental engagement supports the theory discussed in Figure 1, which showed that government activities undertaken for improving social efficiency and protecting water resources generated large amounts of contaminants (unexpected outputs) in the vulnerable environments, which was not as expected (f1>f2, g1>g2). Similarly, the negative spillover effect of environmental protection (ER) indicated that the related policies yielded more pollution than expected. These findings account for the theoretical framework in Figure 1. Conversely, three factors (WUS, RES, and WL) had positive spillover effects on GWE: WL had a negative effect on GWE, showing spillover contributions to GWE once the polluted water had been remediated. Therefore, these contrasting results suggest that the GWE in vulnerable ecosystems may be changed by any factor, depending on the unexpected outputs.
To examine the spatial spillover effect of GWE, this study employed the partial differential method to decompose the total effect into direct and indirect effects. The direct effect demonstrates the impact of these factors on the local GWE, whereas the indirect effect demonstrates the spillover impact on the GWE of other provinces.
Table 4 shows that these factors had significant direct and indirect effects, except for IS and OPEN. This result is consistent with that in Table 3, confirming that both industrial structure and opening-up level did no contribute to the GWE in this vulnerable ecosystem. Consistently, GOV had both a significant negative effect (−1.217) and positive effect (0.623), which supports the viewpoint that appropriate government activities contributed to local GWE (f1>f2, g1>g2), and had more spillover effects on the GWE in other regions rather than on the neighboring provinces. This study obtained similar results for ER.
This result suggested that governmental engagement in water conservancy construction and pollution control have directly improved the local GWE. The investment in industrial pollution and waste-water treatment had a strongly positive effect on promoting GWE. However, extensive government intervention and inappropriate environmental regulations may result in heavy-industry enterprises transferring their contaminants to other regions, reducing the GWE in other regions.
The negative coefficient (−2.223) of the WUS indicated a low GWE in both the agricultural and industrial sectors, because the underdeveloped irrigation systems in the region led to the substantial wasting of water resources. The underdeveloped sewage treatment systems are unable to efficiently deal with industrial waste water. The negative indirect coefficient (−0.683) showed that these water contaminants had spatial spillover effects on the neighboring provinces.
The negative interaction (−0.102) between RES and GWE indicated less awareness of GWE in the regions with abundant resource, where waste water was considerable in the deficient regions. This result is inconsistent with the theory that the more abundant the natural resources, the higher the GWE in the Yellow River basin (Zhao et al., 2021). Additionally, RES had spillover effects on its neighboring regions because of the positive interaction (0.139). Therefore, efficient and effective resource use in this vulnerable environment was more crucial than in other water runoff regions.
The negative interaction (−0.948) between GDP and GWE confirmed the result in Table 3, demonstrating the curse theory where economic growth results from harming natural resources. Contrastingly, the positive indirect coefficient (0.942) indicated a spillover effect of the economic activities on neighboring regions, which could have mutually facilitated the economic growth.
The negative direct effect (−0.204) of WL is in line with the result in Table 3, showing that increased water pollution leads to a lower GWE, but polluted water had no significant spatial spillover effect on the neighboring regions.
5 Conclusion
Different from other studies of GWE in water-runoff regions, this study investigated a vulnerable ecosystem range along the SREB featuring with both fragile ecological and economic systems. Considering the unexpected outputs in an updated theoretical framework, this study employed the hyper-efficiency SBM-DEA model to investigate the spatial heterogeneity of GWE, and adopted SDM to investigate the determinants of GWE. According to the data from 2008 to 2019, this study revealed that the green indicator performance differed in the different provinces. Additionally, the green indicator structure was imbalanced; in particular, economic performance and social efficiency were weak.
This study found significant spatial heterogeneity in the GWE. The southwest provinces had higher GWE than those in the northwest, particularly Xinjiang and Gansu, but there was no significant GWE improvement in the whole region. Additionally, there was a negative interaction between GWE and governmental engagement, economic growth, and water pollution, but a positive interaction between GWE and environmental protection and the opening-up level. Environmental protection was the most significant determinant of GWE, which had spatial spillover effects, followed by water pollution and economic growth. In this vulnerable ecosystem, the GWE may be changed by any factor depending on the unexpected outputs.
Moreover, three determinants (governmental engagement, environmental protection, and water use structure) had spatial spillover side effects on the GWE of neighboring provinces, which means that unsustainable water practices generated more unexpected contaminants flowing into neighboring provinces.
Data availability statement
The raw data supporting the conclusion of this article will be made available by the authors, without undue reservation.
Author contributions
QZ: Conceptualization, methodology, formal analysis, funding acquisition, supervision, data curation, writing—original draft, investigation. HL: Conceptualization, formal analysis, visualization, writing—reviewing and editing. All authors contributed to the article and approved the submitted version.
Funding
“Research on Qinling Eco-environmental Protection, Influencing Factors and Evaluation Index System in Qinling: Based on Local Farmers’ Satisfaction” funded by 2024 General Research Project of Shaanxi Provincial Department of Science and Technology.
Conflict of interest
The authors declare that the research was conducted in the absence of any commercial or financial relationships that could be construed as a potential conflict of interest.
Publisher’s note
All claims expressed in this article are solely those of the authors and do not necessarily represent those of their affiliated organizations, or those of the publisher, the editors and the reviewers. Any product that may be evaluated in this article, or claim that may be made by its manufacturer, is not guaranteed or endorsed by the publisher.
Supplementary material
The Supplementary Material for this article can be found online at: https://www.frontiersin.org/articles/10.3389/fenvs.2023.1238175/full#supplementary-material
References
Arto, I., García-Muros, X., Cazcarro, I., González-Eguino, M., Markandya, A., and Hazra, S. (2019). The socioeconomic future of deltas in a changing environment. Sci. Total Environ. 648, 1284–1296. doi:10.1016/j.scitotenv.2018.08.139
Audirac, I. (2014). Shrinking cities in Latin America: An oxymoron? Routledge. Milton Park, UK, 9780203079768.
Chen, D. L., Peng, B. F., and Xiong, J. X. (2013). The coupling characteristics of eco-economic system in Dongting lake area. Sci. Geogr. Sin. 33 (11), 1338–1346. doi:10.13249/j.cnki.sgs.2013.011.1338
Chen, G., and Bai, Y. (2013). Regional differences in total-factor industrial water efficiency based on a stochastic frontier approach. Resour. Sci. 8 (35), 1593–1600. doi:10.1016/j.resconrec.2020.105239
Cucek, L., Klemes, J. J., and Kravanja, Z. (2012). A review of footprint analysis tools for monitoring impacts on sustainability. J. Clean. Prod. 34, 9–20. doi:10.1016/j.jclepro.2012.02.036
Elhorst, J. P. (2014). Matlab software for spatial panels. Int. Regional Sci. Rev. 37 (3), 389–405. doi:10.1177/0160017612452429
Falkenmark, M. (2008). Water and sustainability: A reappraisal. Environ. Sci. Policy Sustain. Dev. 50 (2), 4–17. doi:10.3200/envt.50.2.4-17
Gao, M., Yu, H., and Zheng, J. (2020). Study on green water resources efficiency and spatial driving factors in the Yellow River Basin. Ecol. Econ. 36 (7), 44–50. doi:10.3390/systems11020109
Geng, Y., Fu, J., Sarkis, J., and Xue, B. (2012). Towards a national circular economy indicator system in China: An evaluation and critical analysis. J. Clean. Prod. 23, 216–224. doi:10.1016/j.jclepro.2011.07.005
He, S. S., Zeng, Y., Liang, Z. X., Jing, Y., Tang, S., Zhang, B., et al. (2021). Economic evaluation of water-saving irrigation practices for sustainable sugarcane production in Guangxi province, China. Sugar Tech. 23, 1325–1331. doi:10.1007/s12355-021-00965-9
Hostetler, S. W., and Alder, J. W. (2016). Implementation and evaluation of a monthly water balance model over the US on an 800m grid. Water Resour. Res. 52, 9600–9620. doi:10.1002/2016wr018665
Ingman, M., Santelmann, M. V., and Tilt, B. (2015). Agricultural water conservation in China: Plastic mulch and traditional irrigation. Ecosyst. Health Sustain. 1 (4), 1–11. doi:10.1890/ehs14-0018.1
Jalali, P., and Rabotyagov, S. (2020). Quantifying cumulative effectiveness of green stormwater infrastructure in improving water quality. Sci. Total Environ. 731, 138953. doi:10.1016/j.scitotenv.2020.138953
Levova, T., and Hauschild, M. Z. (2011). Assessing the impacts of industrial water use in life cycle assessment. CIRP Ann. - Manuf. Technol. 60 (1), 29–32. doi:10.1016/j.cirp.2011.03.005
Libert, B., Orolbaev, E., and Steklov, Y. (2008). Water and energy crisis in central Asia. China Eurasia Forum Q. 6 (3), 9–20.
Littell, J. S., Peterson, D. L., and Tjoelker, M. (2008). Douglas-fir growth in mountain ecosystems: Water limits tree growth from stand to region. Ecol. Monogr. 78 (3), 349–368. doi:10.1890/07-0712.1
McDonough, W., and Braungart, M. (2002). Cradle to cradle: Remaking the way we make things. New York, NY, USA: North Point Press.
Mielnik, O., and Goldemberg, J. (2002). Foreign direct investment and decoupling between energy and gross domestic product in developing countries. Energy Policy 30 (2), 87–89. doi:10.1016/s0301-4215(01)00080-5
Qiu, M., Zuo, Q., Wu, Q., Yang, Z., and Zhang, J. (2022). Water ecological security assessment and spatial autocorrelation analysis of prefectural regions involved in the Yellow River Basin. Sci. Rep. 12, 5105. doi:10.1038/s41598-022-07656-9
Sharma, S., Basu, S., Shetti, N. P., and Amonabhavi, T. M. (2020). Waste-to energy nexus for circular economy and environmental protection: Recent trends in hydrogen energy. Sci. Total Environ. 713, 136633. doi:10.1016/j.scitotenv.2020.136633
Srinivasu, B., and Rao, S. (2013). Infrastructure development and economic growth: Prospects and perspective. J. Bus. Manag. Soc. Sci. Res. 2 (1), 81–91.
Su, X., Ji, D., and He, H. (2021). Study on spatial and temporal differences and affecting factors of agricultural water resources green efficiency in Huang-Huai-Hai Plain. Ecol. Econ. 3, 106–111. doi:10.3390/w14121905
Tobler, W. R. (1970). A computer movie simulating urban growth in the Detroit region. Econ. Geogr. 46 (1), 234–240. doi:10.2307/143141
Tone, K. (2001). A Slacks-based measure of efficiency in data envelopment analysis. Eur. J. Operational Res. 130, 498–509. doi:10.1016/s0377-2217(99)00407-5
Tornqvist, R., Jarsjo, J., and Karimov, B. (2011). Health risks from large-scale water pollution: Trends in Central Asia. Environ. Int. 37 (2), 435–442. doi:10.1016/j.envint.2010.11.006
Varis, O. (2014). Resources: Curb vast water use in central Asia. Nature 514, 27–29. doi:10.1038/514027a
Vorosmarty, C. J., Osuna, V. R., Cak, , Bhaduri, A., Bunn, S. E., Corsi, F., et al. (2018). Ecosystem-based water security and the sustainable development goals (SDGs). Ecohydrol. Hydrobiology 18 (4), 317–333. doi:10.1016/j.ecohyd.2018.07.004
Wang, B., and Li, X. (2022). Green efficiency of industrial wayer resource in Yangtze River economic zone based on water footprint and SBM-Malmquist model. Resour. Industries 24 (3), 21–31. doi:10.13776/j.cnki.resourcesindustries.20220527.015
Wang, X., and Zhao, L. (2008). Agricultural water use efficiency and its influencing factors in China——SFA analysis based on provincial panel data from 1997 to 2006. Issues Agric. Econ. 29 (3), 10–18. doi:10.1088/1755-1315/440/5/052008
Xing, L., Xue, M. G., and Hu, M. S. (2019). Dynamic simulation and assessment of the coupling coordination degree of the economy–resource–environment system: Case of Wuhan City in China. J. Environ. Manag. 230, 474–487. doi:10.1016/j.jenvman.2018.09.065
Yang, H., and Zehnder, A. J. B. (2002). Water scarcity and food import: A case study for southern mediterranean countries. World Dev. 30 (8), 1413–1430. doi:10.1016/s0305-750x(02)00047-5
Yue, L., Ren, W., and Yao, X. (2021). Spatiotemporal change of urban green water resources efficiency and its influencing factors in the Yellow River Basin-- Based on the perspective of river eco-hydrological regionalization. J. Industrial Technol. Econ. 40 (10), 15–22. doi:10.3390/w15112058
Zhai, Y., Bai, Y., Shen, X., Ji, C., Zhang, T., and Hong, J. (2021). Can grain virtual water flow reduce environment impacts? Evidence from China. J. Clean. Prod. 314, 127970. doi:10.1016/j.jclepro.2021.127970
Zhao, K., Zhang, R., Liu, H., Wang, G., and Sun, X. (2021). Resource endowment, industrial structure, and green development of the Yellow River Basin. Sustainability 13, 4530. doi:10.3390/su13084530
Keywords: green water efficiency, spatial heterogeneity, vulnerable environment, silk road economic belt, DEA method
Citation: Zhang Q and Long H (2023) Green water efficiency in the vulnerable silk road economic belt. Front. Environ. Sci. 11:1238175. doi: 10.3389/fenvs.2023.1238175
Received: 11 June 2023; Accepted: 24 July 2023;
Published: 01 August 2023.
Edited by:
Rui Zhao, Southwest Jiaotong University, ChinaReviewed by:
Chen Yang, Peking University, ChinaYing Zhu, Xi’an University of Architecture and Technology, China
Copyright © 2023 Zhang and Long. This is an open-access article distributed under the terms of the Creative Commons Attribution License (CC BY). The use, distribution or reproduction in other forums is permitted, provided the original author(s) and the copyright owner(s) are credited and that the original publication in this journal is cited, in accordance with accepted academic practice. No use, distribution or reproduction is permitted which does not comply with these terms.
*Correspondence: Hai Long, c29ob2xvbmdoYWlAMTYzLmNvbQ==
 Qiang Zhang1
 Hai Long
