 Yaqian Wu
 Carla Washbourne
 Muki Haklay
95% of researchers rate our articles as excellent or good
Learn more about the work of our research integrity team to safeguard the quality of each article we publish.
Find out more
ORIGINAL RESEARCH article
Front. Environ. Sci. , 01 November 2023
Sec. Environmental Citizen Science
Volume 11 - 2023 | https://doi.org/10.3389/fenvs.2023.1234966
This article is part of the Research Topic Environmental Citizen Studies in Freshwater Science View all 8 articles
Introduction: The global challenge of sustainable development is encapsulated in the 17 United Nations Sustainable Development Goals (SDGs), to which China is committed. As outlined in the UNESCO World Water Assessment Program (WWAP) report, water fundamentally impacts on sustainable development, making the achievement of SDG 6 (water and sanitation) crucial. China, as a leading manufacturing hub with extensive agriculture, grapples with challenges in monitoring SDG 6 indicators, especially concerning water quality.
Methods: In light of these challenges, this study explores the utilisation of non-traditional data sources, specifically citizen science (CS), to address aspects of SDG 6 monitoring pertaining to water quality monitoring in China. Specifically, our study employs a combination of research techniques–including a literature review, semi-structured interviews, and participant observation–to critically evaluate 13 existing CS projects focused on water quality monitoring. A modified CS assessment framework has been utilised, offering a comprehensive, structured approach to evaluation.
Results: In total, this analysis identified four key findings: 1) CS projects related to water monitoring in China predominantly focus on freshwater and drinking water; 2) Greater attention and support are needed for freshwater monitoring initiatives to align with China’s “ecological civilisation” policy; 3) Replacing “citizen science” with “public participation” may promote broader acceptance of these initiatives; 4) Training requires enhancement, particularly for participants from third- and fourth-tier cities as well as remote rural areas.
Discussion: This research delineates feasible strategies for the future expansion and integration of CS projects throughout the country. It advocates for a more participatory data-driven approach to sustainable water management in China, given the highlighted challenges and the potential solutions unearthed through the use of citizen science and public participation.
Freshwater constitutes a small proportion (2.5%) of the Earth’s total water and is of great importance for human activities (Cassardo and Jones, 2011). It plays a crucial role in sectors such as agriculture, energy production, and daily necessities like drinking and recreation (Jie, 2013; Kaiman, 2014; Jongman and Korsten, 2016). Recognising the significance of water, sustainable water management is vital and therefore there is a need to consistently monitor its availability, quantity, and quality. In a comprehensive review of papers related to sustainable development goals (SDGs), Syed Mithun Ali et al. (2023), emphasised the need for research to concentrate on innovative water management practices, especially focusing on water quality. Water quality monitoring indicators, as highlighted by Al-Omran et al. (2015) act as indispensable tools, offering a holistic view of water resources by evaluating their chemical, physical, and biological attributes, such as pH and odour.
In recognition of the importance of water quality monitoring and data collection, the United Nations (UN) has developed the Integrated Monitoring Initiative for SDG 6 (IMI-SDG 6) (Hák et al., 2016). IMI-SDG 6 serves as a comprehensive framework for monitoring indicators (e.g., indicator 6.3.2 ambient water quality) and evaluating progress towards achieving the targets outlined in SDG 6—‘Clean Water and Sanitation.’ While there are inherent challenges for IMI-SDG6 in achieving regular monitoring of every indicator at both the global and national levels (Rajapakse, 2022), one of the critical hurdles lies in ensuring the availability and quality of data necessary for effective monitoring (Ortigara et al., 2018; Bachmann et al., 2022). To elaborate, among the 11 indicators of SDG 6, five are supported by adequate national data that is needed to establish a global baseline. The remaining six indicators, however, have yet to achieve this status. These include indicators pertaining to 6.3.1 (wastewater), 6.3.2 (water quality), 6.4.1 (water-use efficiency), 6.4.2 (water stress), 6.5.1 (water resources management), 6.5.2 (transboundary basin area) and 6.6.1 (water-related ecosystems) (UN Water, 2020). To address this challenge, the UN recognises the significance of incorporating non-traditional data sources, such as citizen science (CS), into water monitoring practices.
CS involves the active participation of the public (including individuals and communities) in the scientific research and data collection process, which is expected to contribute valuable data from different regions (Vohland et al., 2019). Within the domain of water quality monitoring, CS presents a unique opportunity for engaging local communities in gathering crucial data, including the assessment of various indicators such as the existence and concentration of pollutants. For instance, the ‘Creek Watch’ app empowers individuals to contribute to the health of their local watershed. Using this application, users can snap a photo of a local stream or creek and answer three questions regarding the surface characteristics of the water (Loiselle and Europe, 2022).
According to Fraisl et al. (2020) CS projects play an important role in providing valuable data for six key indicators of SDG 6– notably 6.1.1 (drinking water), 6.2.1 (sanitation services), 6.3.1, 6.3.2, 6.4.2 and 6.6.1 at the global level. Among them, direct contributions to indicators 6.1.1, 6.2.1, 6.3.2, and 6.6.1 are made through CS data, and supplementary contributions are made to indicators 6.3.1 and 6.4.2 (Table 1).
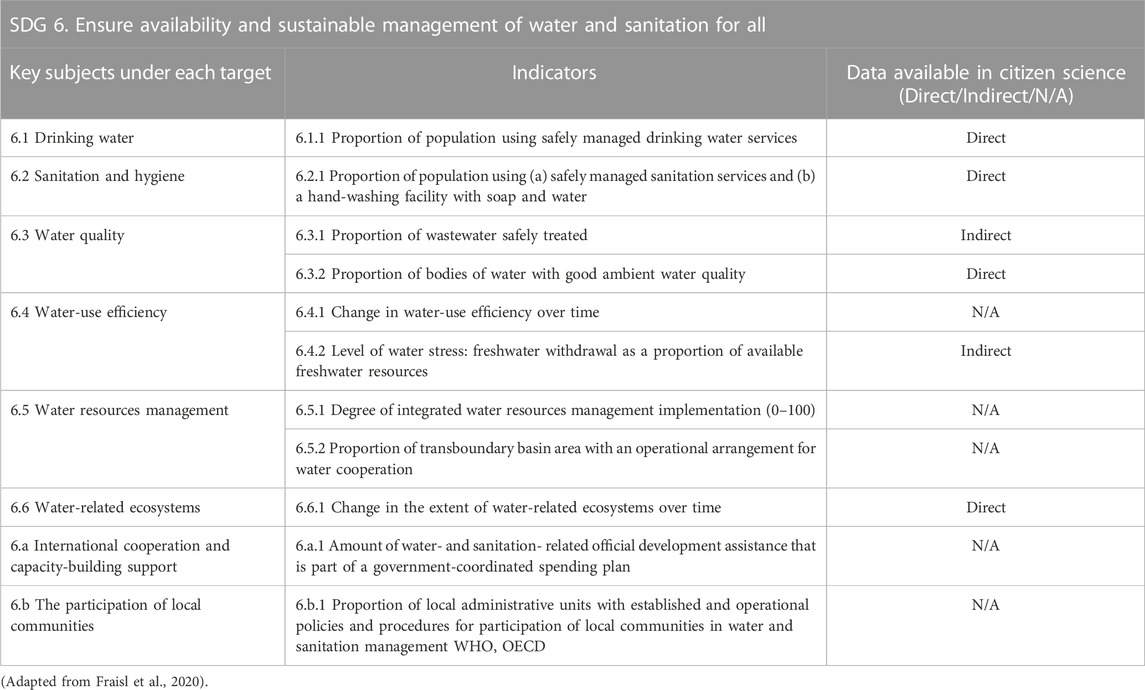
TABLE 1. Contributions from citizen science to SDG 6 indicators at the global level.
At the national level, the vast population of China, in addition to its prominent industrial and agricultural sectors (e.g., textile industry), highlights the critical need for water quality monitoring (Shi, 2020; Kumar et al., 2022). The urgency of this issue is accentuated when considering China’s progression towards SDG 6 indicators. The concern is not solely based on China’s position at only 63 out of 166 countries in the overall SDG rankings, but also the fact that over 50% of the indicators for SDG 6 are either stagnating or showing signs of decline (Sachs et al., 2023; Sheng, 2023). Several challenges persist, such as:
1) Outdated data resources, limited to the period between 2018 and 2020;
2) Insufficient advances in tackling water consumption linked to imports;
3) Continued issues surrounding the accessibility of drinking water and provision of fundamental sanitation services;
4) An absence of data concerning freshwater withdrawal patterns; and
5) The incapacity to reliably monitor the treatment of anthropogenic wastewater.
Wastewater represents one of China’s most formidable challenges at present. It is not just the lack of traceable data that’s concerning, but also the continuous severity of water pollution in China that impedes sustainable goals. Since China’s systematic approach to addressing water pollution became particularly prominent with the introduction of the Twelfth Five-Year Plan (2010–2015). Despite nearly 13 years of focused efforts to tackle water pollution and enhance water quality, around 70% of China’s freshwater bodies, encompassing its rivers and lakes, continue to be heavily polluted (Zhang et al., 2022). There are two primary reasons for this. First, the widespread geographical distribution of pollution sources renders the management of water pollution a challenging endeavour. This pollution originates from a variety of sectors, ranging from municipal to industrial, with a significant contribution from upstream agricultural sources (Shen and Yang, 2017; Ma et al., 2020). Secondly, given the expansive nature of China’s water resources, covering rivers, lakes, and underground reservoirs, a thorough monitoring framework is indispensable, especially in more remote areas like Southwest China. Yet, the diversity and vastness of China’s landscape present challenges in establishing a cohesive national water monitoring system (Shi, 2020).
As the country at the forefront of global GDP and second in total population, China wields substantial influence in the implementation of SDGs on the global stage (Center for International Knowledge on Development, 2021). Regarding SDG 6 in particular, China’s rivers, including the Yangtze, Yellow River, and the Mekong, cross multiple borders (UNESCO World Water Assessment Programme, 2023). Thus, China’s water management strategies can have implications for downstream countries. Integrating additional data is pivotal for water governance in China and for transboundary water management in neighbouring nations. Given the recognised contribution of CS initiatives to global water monitoring, and the potential that research has shown for such programmes, it is anticipated that CS could offer effective strategies for data collection for the majority of these indicators within China (Wu et al., 2022).
However, based on the previous studies, two primary research gaps emerge concerning the application of CS in water monitoring in China. First, there is a pronounced dearth of studies focused exclusively on the analysis and research of water-related citizen science projects, with a particular gap in comprehensive benefit evaluations for CS projects centred on water monitoring (Yuan et al., 2019; Wu et al., 2022). Second, the current number of CS projects in this field is considerably limited, highlighting an urgent need to broaden the scope and scale of CS initiatives in water monitoring. Such expansion should ideally encompass a greater range of locations, tackle an expanded spectrum of water-related challenges, and foster deeper engagement among participants (Schölvinck et al., 2022; Wu et al., 2022). Addressing these gaps is crucial to fully realise the potential of CS in improving water quality monitoring activities and to reinforce the commitment to achieving SDG 6 in China–the core aim of this study.
A literature review reveals that water quality monitoring, encompassing both freshwater and drinking water, is a significant focus of CS projects in China (Wu et al., 2022). In total, 13 such CS projects were identified in China, with their reach extending from global to local levels. Among these projects, seven are specifically dedicated to monitoring the quality of freshwater. Arranged chronologically based on their inception, these projects are:
• The Blue Map App
• Public Participation Network of the Environmental Impact Assessment (EIA)
• Freshwater Watch
• Tsinghua’s experiment
• Black and Smelly Waters App
• E-waste in Hong Kong
• Waste Pollutants in Hong Kong
The remaining six projects are primarily concerned with the monitoring of drinking water. Listed chronologically according to their commencement, these projects include:
• River Watcher
• Computing for Clean Water (C4CW)
• China’s water safety plan
• MyH2O
• Solving groundwater contamination with community science
• Guizhou River Day 1 + 2 Action
The need to implement an evaluation framework arises from the significance of assessing the effectiveness of CS projects. Without a systematic method of evaluation, the successes and potential areas for improvement within these projects could go unnoticed. Currently, there are three major evaluation frameworks for CS projects.
One, by Kieslinger et al. (2017) emphasises a broad and comprehensive evaluation of CS activities with the aim of informing strategic planning, assessment, and impact analysis. Another, by Liñán et al. (2022) focuses solely on engagement, underscoring the importance of both short-term and long-term participation, and integrates concepts from diverse fields to ensure robust participation in citizen science projects. The third, by D’Andrea et al. (2022) which is inspired by Kieslinger et al. (2017), offers a dual-level analysis across the cross-cutting level (CSIs) that allows for adaptability and swift decision-making based on collected data and aims to identify overarching trends across multiple citizen science initiatives.
The reason we chose to use the evaluation framework by Kieslinger et al. (2017) is based on three main factors: 1) It is more comprehensive of the three. It utilises an open evaluation framework, allowing for the monitoring of project progress and impact assessment (Hecker et al., 2018). This framework comprises three core dimensions: scientific, participant, and socio-ecological and economic. Each dimension covers key attributes for evaluation at both the process and feasibility levels, as well as the outcome and impact levels; 2) The framework by D’Andrea et al., 2022 is putting an emphasis on identifying recurrent patterns and is not pertinent to our primary research focus; and 3) In the context of the current state of citizen science development in China, which is at a very preliminary stage (as indicated by data in Section 2.1 showing that even a single stable project per year cannot be ensured), a comprehensive foundational understanding is more pressing and essential than intensifying a particular aspect.
We particularly emphasise the value derived from the implementation and monitoring of the SDGs and their indicators, as well as their local impact (Figure 1).
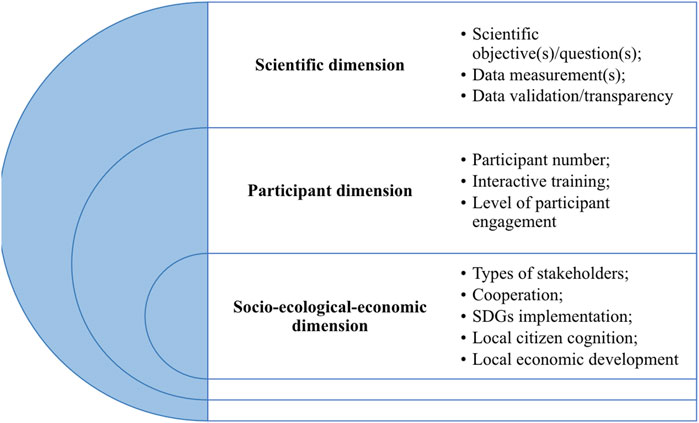
FIGURE 1. Investigated themes under each dimension.
Specifically, in terms of the scientific dimension, clearly defined research questions and objectives form the basis of meaningful science. Therefore, metrics at the ‘Process and Feasibility’ level and ‘Outcome and Impact’ level should help assess the scientific basis of CS projects. These include scientific objectives, scientific questions, data measurement, data validation, and data transparency.
In terms of the participant dimension, the enthusiasm of the participants themselves is key to the successful execution of the project. Therefore, at the ‘Process and Feasibility’ level, engagement strategies should be evaluated to facilitate successful collaboration. Indicators in this regard include the number of participants and the availability of interactive training support. On the other hand, at the ‘Outcomes and Potential Impact’ level, personal learning and development gains are vital. Indicators should include the number of levels of participant engagement and the highest level of participant engagement.
In terms of the socio-ecological-economic dimension, the transmissibility and interactive communication with the public and communities need to be considered at the ‘Process and Feasibility’ level to enhance the wider social, ecological, and economic impacts of CS projects. The joint participation of key stakeholders (e.g., entrepreneurs, social media, science communication) is crucial for the sustained success of the project. Hence, indicators in this respect include the types of stakeholders and cooperation among stakeholders. At the ‘Outcome and Impact’ level, the wider societal impact of projects should be assessed. Given that this research values the influence of collected CS projects on the SDGs, there are two corresponding indicators. One pertains to impacts on policy strategies, local citizens’ cognition, or local economic development. The other relates to impacts on the implementation of the SDGs.
Each project underwent an initial evaluation of its benefits, using information available on the internet. However, the limitations of relying solely on open online data were acknowledged, and additional data from participant observation and semi-structured interviews (conducted between November 2021 and March 2022) were incorporated to enhance the project benefit analysis. It is important to note that the data collected through these methods during this specific period may not have provided a comprehensive representation of all projects, due to factors such as the impact of the COVID-19 pandemic and the observer having personal connections.
The data collection process in this study involved conducting semi-structured interviews with stakeholders (particularly project team leaders and conveners) who held significant roles in the CS projects. The choice of semi-structured interviews as the data collection method was driven by considerations of time and resources. This approach allows for flexibility during the interviews, ensuring that key themes and questions are covered while still allowing room for participants to provide open-ended responses (Jamshed, 2014).
In total, based on the responses received to the interview invitations, there were 3 interviews (River Watcher, MyH2O and Guizhou River Day 1 + 2 Action) conducted and each of them lasted for 45–60 mins (Figure 2). The questions of each stakeholder would be designed according to the results of each project’s general evaluation through the adjusted framework along with three dimensions. Before setting up a one-to-one online interview, interviewee(s) from each project would be sent an invitation for scheduling meeting time and given a brief summary report (translated in a Chinese version) on their corresponding project. Then let them finish a feedback survey on which degree they are satisfied with those expressions on their projects according to results on each part of dimension. 10 questions will be set into each interview based on results of project evaluation and each interviewee feedback. For each dimension, 2 or 3 relevant questions will be included, and the rest of questions are more flexible to ask them about future plans for project development (detailed questions shown in the Supplementary Material).
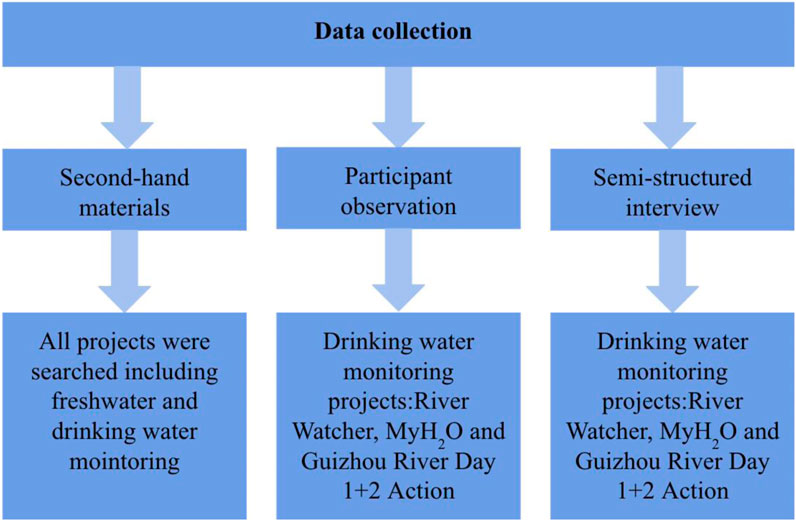
FIGURE 2. Three methods of data collection for evaluating citizen science projects in China.
Another data collection process in this study utilised participant observation. Given the actual circumstances of continuing offline activities during the epidemic, this observation centred on the same three CS projects as the interviews (Figure 2). The reason for using this method is to comprehensively evaluate and validate the results of the evaluation and interview analysis. Participant observation can serve as a valuable supplementary method through field activities and direct engagement (Hughes and Sharrock, 2006). Specifically, the observation will focus on understanding the experiences of volunteers (citizen scientists) involved in the projects, complementing the perspectives gained through semi-structured interviews with project organisers.
To ensure the participant observation process for each project effectively captured the subtleties of activities and notable events, a systematic method of taking field notes was used. These notes were later developed into a detailed diary. Consistent with the analysis conducted previously, the primary emphasis of the diary centred on the three specified dimensions. From the scientific dimension, the observation will involve examining data collection practices (e.g., volunteers’ knowledge of data collection methods, their commitment to data accuracy, and their understanding of their contributions to SDGs, particularly in relation to SDG 6 indicators). In terms of the participant dimension, the observation will centre on interactive support, exploring how volunteers collaborate and communicate with project organisers and stakeholders, and identifying any conflicts that may arise. Lastly, within the socio-ecological and economic dimension, attention will be given to social media communications related to the projects and the volunteers’ perspectives on the projects’ impacts on policy development.
According to those results from dimensions, a brief summary report would be made for each project, which is around 500 words in English version.
The data collected through semi-structured interviews and participant observation underwent thematic analysis using NVivo 12 (Zamawe, 2015).
The first phase of the analysis process involved categorising the collected project materials. These were classified in line with the three primary dimensions under investigation: scientific, participant, and social-ecological economic impacts, as per the adjusted CS evaluation framework (please refer to Section 2.2). Following this, themes were identified, and a coding guide was developed. The final step included a comprehensive review of all selected materials to ensure that the identified themes accurately encapsulated the data. Any themes that overlapped or lacked sufficient supporting evidence were subsequently eliminated from the analysis.
For China’s freshwater monitoring CS projects, the earliest can be traced back to 2006 (the Blue Map App), with the latest project started in 2018; no new projects appeared in the past 4 years between 2018 and 2022. The projects cover four different boundary levels, two at the global level (Freshwater Watch), three at the national level (the Blue Map App, EIA, Tsinghua’s experiment, Black and Smelly Waters App), and two projects (E-waste in Hong Kong and Waste Pollutants in Hong Kong) are at local level. Local level projects are mainly carried out in the Hong Kong Special Administrative Region. Due to the restrictions on travel and outdoor activities in China amid the COVID-19 pandemic in 2022, no freshwater resource monitoring projects were conducted through interviews or participant observations.
There are a range of scientific objectives, including regular water quality monitoring, public oversight of government water treatment, and water pollutant observation. Even within the same objective, different projects may focus on different research issues. For example, Freshwater Watch is a global-level project that encourages citizens to monitor their local water environment by collecting and testing water samples using accessible kits. Tsinghua’s experiment, on the other hand, is a national-level project that involves public observation and uploading water quality data via WeChat. Waste Pollutants in Hong Kong, at the local level, focuses more on detecting metal contaminants in water quality testing. Therefore, the scientific questions addressed in these projects vary accordingly.
In the aspect of data measurements, most projects require the use of crowdsourcing (a method of harnessing the collective intelligence, skills, and insights of a large group of people, such as those from online communities, to gather information, integrate ideas, or solve problems) (See, 2019), which mean providing an open call and inviting people to utilise the app or the website to share information especially at the global and national level. One of the main purposes of these projects is to build international or national databases to improve water quality, although the types of data vary. For a small number of projects at the local level, it is only necessary to manually collect water samples in specific water areas to check for pollutants, like E-waste in Hong Kong, and Waste Pollutants in Hong Kong. However, from a long-term perspective, local projects have the potential to expand into larger-level ones and introduce more crowdsourcing or sensor technology. Furthermore, for the CS projects under investigation, whether they belong to the same category (e.g., regular water monitoring) or different categories, may have different data types. This provides an opportunity to expand the participants’ population in the future, because it gives them more choices about how to participate.
Both data validation and transparency are particularly important for CS projects, especially to improve data quality and in building scientific trust. The major reason for the necessity of data validation is that citizen projects’ data are primarily collected by citizens. Since they are not professional researchers in water fields, whether the data collected by themselves is the type of geographic information in these projects or the specific indicators of water quality, professionals are required to undertake research with respect to information checking and data validation. To improve the quality of data collected by citizens, many citizen science studies will carry out personnel training before data collection. However, the current situation is that not all research projects know how to effectively design training content to achieve effective personnel training. In addition, after citizens collect data, there is sometimes a lack of data verification links, or at least these might not be explained in the project introduction. Generally, the specific operation is not known unless you ask the relevant project staff (Figure 3).
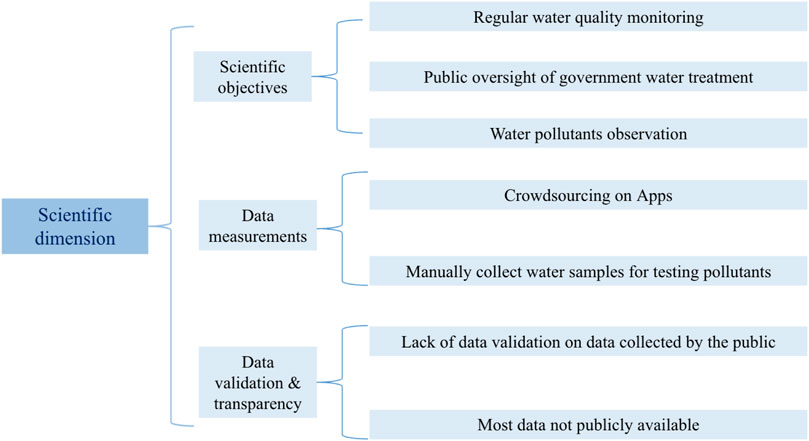
FIGURE 3. The evaluation results of freshwater quality monitoring citizen science projects within the scientific dimension.
Most projects either document the number of participants or the volume of data they contribute. The Blue Map App project is notably engaged, with over 15,000 companies, predominantly from the textile and electronics industries, actively addressing water pollution through the app (McMahon, 2017; The Crowd and The Cloud, 2017). Additionally, the app has been downloaded over 3 million times, which represents about 0.2% of China’s population.
Two projects, EIA and Waste Pollutants in Hong Kong, do not provide clear details about their participants. While the EIA platform gathers environmental data and promotes public involvement, it does not specify the exact number of participants. The Waste Pollutants project, a joint effort between organisations (such as CitizenScience.Asia) took water samples from several sites for comparison. However, the data is dispersed across various organisations, complicating the process of tallying participant numbers.
Of the remaining projects, the Black and Smelly Waters App leads in participant count, having collected over 8,500 reports between 2016 and 2018. These reports predominantly come from developed provinces and cities, including Shandong, Hunan, Guangdong, and Beijing (Walsh, 2019). China’s Freshwater Watch follows with 1,640 data points collected (Chick, 2017). Tsinghua’s experiment, through the Tsinghua Environment Monitoring Platform (TEMP), recorded 172 validated reports submitted by 121 participants spanning 29 provinces and cities in China (Zheng et al., 2017). As for the E-waste Tracking in Hong Kong project, it accumulated 69 data entries in 2017. Hong Kong contributed 54% (37 entries), while Mainland China added 16% (11 entries), which combined, constituted half the data amassed globally for the entire project (Wong, 2018; Lin et al., 2019).
Projects focusing on public scrutiny of government water treatment currently attract the most participants. This is likely because they are relatively straightforward, primarily leveraging photographic evidence. Water pollutant observation ranks second in participant engagement. In contrast, consistent water quality monitoring projects are poised to need more contributors going forward. Their participant count is not only currently the lowest, but the nature of water quality observation mandates many participants to provide data on various water bodies, especially smaller ones like ponds and rivers near residential areas.
In terms of interactive training support, many water quality monitoring projects lack multiple on-site training opportunities. For App-based projects, on-site training is not a prerequisite. For instance, when projects employ crowdsourcing, training can easily be disseminated via online instructions. Projects fitting this description include the Blue Map App from the public supervision of government category, Tsinghua’s experiment under the regular water quality monitoring category, and the Black and Smelly App as well as E-waste Tracking in Hong Kong from the water pollutants’ observation category. The data for these projects primarily rely on photographs and geographical information, negating the need for intricate training. However, a potential challenge arises when participants, spanning different age groups, need to demonstrate proficiency in utilising digital devices.
For projects observing specific water indicators, such as the Freshwater Watch within the regular water quality monitoring category, the use of instruments for on-site testing is essential. Interactive, particularly offline, training becomes invaluable in such contexts. Freshwater Watch offers both online and offline training modules for each investigation, ensuring a mature approach that both enables participant data collection and enhances data accuracy. Conversely, the project EIA, which falls under the public supervision of government water treatment category, is more centred on participants voicing water pollution concerns and subsequently tracking governmental responses. Given the behavioural nature of this project with minimal technical requirements, training does not take centre stage. The core challenge here is to facilitate effective collaboration between public participants and organisations, ensuring genuine water-related concerns are adequately communicated.
At the ‘Outcome and Impact’ level, there are two aspects: the number of levels of participant engagement and the highest level of participant engagement. Regarding the classification level of CS participants, as defined by Haklay (2012), the first level is when participants contribute only as data collectors or sensors and the highest level (4th level) is ‘Extreme CS’, where they are involved in the project as scientific collaborators. The second level is ‘distributed intelligence’, where citizens act as interpreters, essentially explaining data. And the third is ‘participatory science’, when they engage in problem definition and data collection.
From the above definitions, of the 7 freshwater monitoring projects, none is at the fourth level. The highest level for these projects is Level 3, at which 4 projects meet the criteria: EIA, Black and Smelly Waters, E-waste Tracking in Hongkong and Waste Pollutants in Hong Kong. That is to say, projects (there are two, Black and smelly waters, E-waste tracking in Hong Kong) in the category of water pollutant observation and both meet Level 3. For the remaining two projects, there is one in each category (public supervision government is for EIA and regular water quality monitoring is for Waste Pollutants in Hong Kong). More than half the projects meet the criteria of levels 1 and 2 and usually there is more than one level in a project, except for EIA, which is just Level 3. The main reason behind this is that the EIA project is designed to involve the public in discovering water pollution problems and following up the entire governance process together. Thus, EIA meets the ‘Problem Definition’ content in Level 3 of the citizen science participant scale.
Of the remaining projects, there are three under a combination of levels 1 and 2, and two projects under a combination of levels 2 and 3. Furthermore, one project is a combination of three levels (1, 2 and 3). Such combinations are in line with the general routine of participant contribution, that is, the level of participation can span the scope of citizen science activities. For instance, the ‘Black and Smelly Waters App’ encompasses three participant levels (1, 2, and 3). Within this initiative, the majority of participants, who assist in documenting polluted water bodies using the app, predominantly operate at the first level, synonymous with crowdsourcing. Yet, as participants foster deeper ties to the project and garner experience, they may transition to the second level, extending support to the project team when faced with challenges, such as technological issues or fieldwork complications.
Specifically, when a participant at the foundational level highlights a water pollution issue in a particular locale, and if the situation is assessed as particularly severe and pressing, the project team may need to conduct an on-the-ground examination. If this entails considerable travel, it becomes imperative for local individuals to first undertake preliminary investigations and subsequently relay their findings remotely. In this scenario, these local experts, responsible for this subsequent analysis and feedback, function as second-tier participants due to their role in discerning the intricacies of local water contamination. Furthermore, participants with heightened dedication might escalate their involvement by consistently updating the local government on water pollution mitigation efforts. This elevated role involves active multi-stakeholder collaboration, liaising with governmental bodies, engagement with relevant polluting industries, and dialogues with the lead water scientist overseeing the project to navigate challenges and ideate solutions. At its core, the levels at which participants engage correlate with their scientific proficiency and dedication to the initiative, as illustrated in Figure 4.
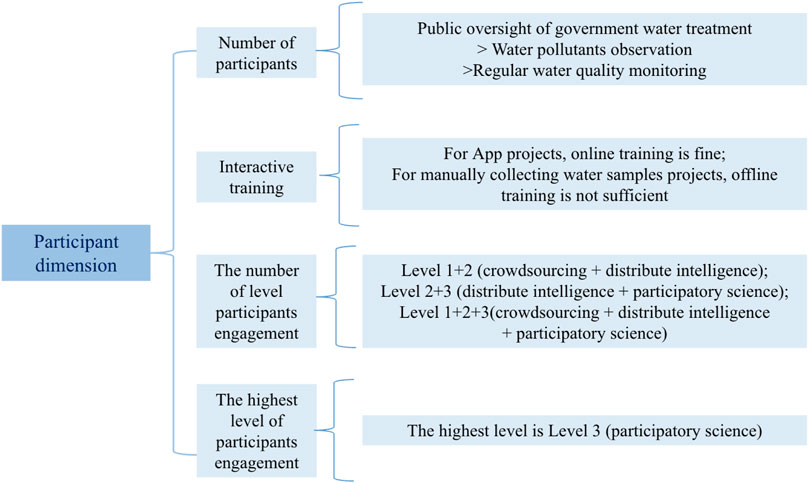
FIGURE 4. The evaluation results of freshwater quality monitoring citizen science projects within the participant dimension.
In the realm of freshwater monitoring, our analysis identifies five salient stakeholder categories: non-governmental organisations (NGOs)/non-profit organisations (NPOs), academic institutions (universities), corporate entities (enterprises), governmental bodies, and the general public. Delving deeper into the stakeholder dynamics, NGOs/NPOs and academic institutions stand out as the principal architects of these freshwater monitoring endeavours. A total of six initiatives are under the aegis of NGOs/NPOs and universities, in contrast to a solitary project championed by the Chinese government–specifically, the ‘Black and Smelly Waters App’. From a corporate perspective, whilst enterprises are recognised as stakeholders, their tangible contributions to these projects in terms of data remain limited. Instead, their involvement has been more notably in the form of financial support. For example, in the ‘Freshwater Watch’ project, HSBC’s role is chiefly that of a significant financial patron rather than as a data contributor.
In the sphere of freshwater monitoring, collaboration between various stakeholders has positioned NGOs and academic institutions as the primary coordinators of projects. While these entities occasionally oversee projects in isolation, there exists a noteworthy subset of initiatives that are co-developed, epitomising the advantages of collaborative synergy.
It is of interest to note that the Chinese government rarely initiates a project single-handedly. A case in point is the ‘Black and Smelly Water App’, which, while being a joint venture between the government and a NPO, known as the Institute of Public & Environmental Affairs (IPE), is predominantly administered by the latter. At this juncture, the modus operandi for enterprises within freshwater monitoring projects largely pivots on financial contributions, underscoring a distinct form of stakeholder collaboration.
The burgeoning role of social media cannot be overlooked, particularly when analysing stakeholder engagement in projects that foreground public oversight of governmental water treatment procedures. The general public actively utilises social media avenues for real-time tracking of sewage treatment progress. Parallel to this, NGOs/NPOs utilise these platforms to provide timely updates on their monitoring endeavours. This digital discourse invariably places the government under the lens of public scrutiny, often catalysing a more proactive approach to sewage treatment initiatives.
At the ‘outcome and impact’ level, three aspects are present. The first pertains to the impacts on the implementation of the SDGs, specifically SDG 6 at both target and indicator levels. Evidently, these freshwater monitoring projects vary in their contributions to the realisation of SDG 6, especially with regards to target 6.3 and indicators 6.3.1 and 6.3.2. Standard water quality monitoring projects, such as Freshwater Watch, Tsinghua’s experiment, and Waste Pollutants in Hong Kong, are geared towards furnishing empirical data for pollution reduction, chemical control, and wastewater recycling (target 6.3). These initiatives can enhance conventional data sources and assist in gauging indicator 6.3.2, which evaluates the proportion of water bodies of good quality.
Conversely, projects that centre on public oversight of governmental water treatment procedures, such as Blue Map and EIA, are primed to monitor water pollution treatment and can contribute to targets 6.3, 6.5, and 6.6. Such projects supply data assets that are instrumental for monitoring indicator 6.3.1 (the proportion of wastewater that is safely treated) and indicator 6.6.1 (the degree to which water-related ecosystems have changed).
Moreover, projects that specifically concentrate on observing water pollutants, such as ‘The Black and Smelly Waters App’ and ‘E-waste tracking in Hong Kong’, also support targets 6.3 and 6.6. ‘The Black and Smelly Waters App’ supplies data essential for gauging indicators 6.3.2 and 6.6.1, whereas ‘E-waste tracking in Hong Kong’ aids in identifying pertinent water bodies but does not contribute to the monitoring of specific indicator data.
The second aspect is the influence on local citizens’ perceptions. In regular water quality monitoring projects (Freshwater Watch, Tsinghua’s experiment, and Waste Pollutants in Hong Kong), public involvement in water sample collection, particularly for freshwater observations and waste contaminant testing, can increase their awareness of the local water environment and conservation efforts. Thus, these projects have the potential to promote local public awareness. However, Tsinghua’s projects have a more online focus and limited offline interaction, resulting in a relatively lower impact on local understanding.
Projects centred on public oversight of government water treatment, such as ‘Blue Map’ and ‘EIA’, predominantly engage local residents in scrutinising rivers, identifying pollutants, and liaising with governmental bodies. These oversight projects wield a more pronounced influence on local perceptions when juxtaposed against traditional water monitoring schemes. The journey from detecting pollutants to liaising with relevant agencies and tracing treatment progress can span numerous months, fostering significant participation and rapport. Conversely, routine water monitoring projects might entail only sporadic involvement. For projects emphasising water pollutants’ observation, like ‘The Black and Smelly Waters App’ and ‘E-waste tracking in Hong Kong’, the former surveys a wider range of water bodies, while the latter focuses on pollutants rather than distinct water bodies. As a result, ‘The Black and Smelly Waters App’ project exerts a more immediate sway over local perceptions.
The third aspect relates to impacts on local economic development. Within the three discussed categories, there are currently seven distinct projects. However, no concrete evidence suggests that any individual project directly relates to local economic prosperity. Paradoxically, concerns associated with freshwater monitoring, particularly when viewed through the lens of pollutant management, could impose negative economic ramifications on the community. This includes challenges such as pollution of water sources, jeopardising both potable water and food security. Especially, certain industrial activities discharge a significant volume of these water pollutants. Efforts to rehabilitate aquatic ecosystems and mitigate pollutant levels compel many such industries towards potential cessation. In the event of widespread industrial closures, the local workforce faces unemployment risks. This could precipitate a downturn in local production, adversely impacting the revenue streams of the local industrial sector and hindering the holistic growth of the regional economy (Figure 5).
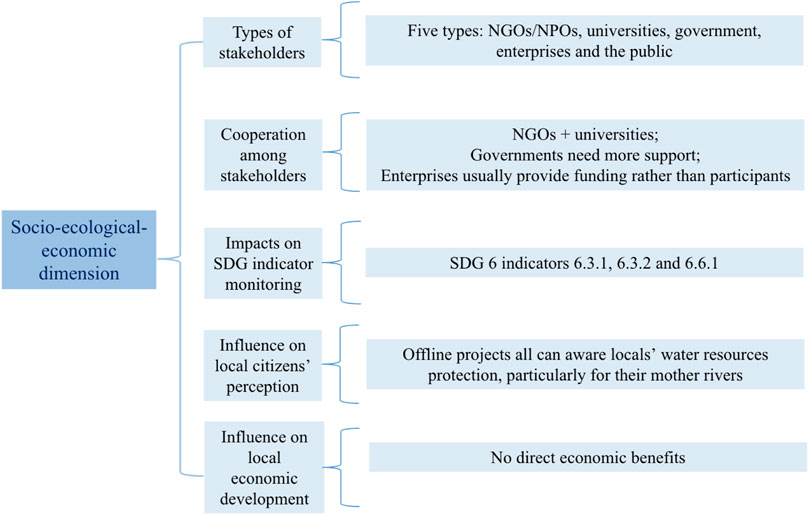
FIGURE 5. The evaluation results of freshwater quality monitoring citizen science projects within the socio-ecological-economic dimension.
For monitoring China’s drinking water, there are six projects at three levels (local, national and global). The earliest project can be traced back to 2007 (River Watcher), with the latest project having started in 2019. 2015 was the year with the most drinking water projects started (MyH2O and Solving Groundwater Contamination with Community Science), and other drinking water projects have generally been started every 2–3 years. Among them, two projects are at local level (Solving Groundwater Contamination with Community Science and Guizhou River Day 1 + 2 Action), three projects are at the national level (River Watcher, China’s Water Safety Plan and MyH2O), and one is at the global level (C4CW). Among all projects, three projects were interviewed and taken participatory observation, which are River Watcher, MyH2O and Guizhou River Day 1 + 2 Action.
There are two main research objectives for these drinking water projects, one is for drinking water resource inspection and the other is for community drinking water surveys. Correspondingly, the scientific questions for these two objectives are: What is the quality of natural resources in drinking water? And What is the current status of drinking water quality in Chinese communities?
Under the objective of drinking water resource inspection, two primary sub-objectives were identified. The first centres on the routine observation of water resources, such as rivers and streams. This is predominantly geared towards monitoring the quality of water at its source, with the aim of evaluating potential health concerns related to local water bodies, particularly the revered ‘mother’ rivers. The second sub-objective is concerned with water filtering. Three projects fall under this broad objective: ‘River Watcher’, ‘C4CW’, and ‘Guizhou River Day 1 + 2 Action’. Of these, ‘River Watcher’ and ‘Guizhou River Day 1 + 2 Action’ align with the first sub-objective, while ‘C4CW’ pertains to the latter.
Transitioning to the second objective, which revolves around community drinking water quality investigation, there are standout projects like ‘China’s Water Safety Plan’, ‘MyH2O’, and ‘Solving Groundwater Contamination with Community Science’. The aims of these projects coalesce in their consistency, with each project underscoring the importance of prompting residents to be vigilant about the safety of drinking water within their households and the broader community.
In the aspect of data measurements, four projects (excluding C4CW and China’s Water Safety Plan) delve into the investigation of drinking water resources and the quality of community drinking water, utilising participatory science. Unlike projects that rely on data uploads via smartphones through specific crowdsourcing platforms, these four projects typically involve participants recording local observations directly on-site. Such activities often lead to periodic record-keeping, collaborating with local residents to identify issues, and subsequently discussing potential solutions.
Broadly speaking, data measurement in drinking water projects harnesses conventional scientific water monitoring techniques, such as water sampling or community questionnaires. Compared to conventional freshwater monitoring endeavours, participants in these initiatives enjoy greater autonomy and contribute significantly to problem identification, drawing primarily from the principles of participatory science.
While the C4CW project employs distributed intelligence methods, advocating for individual nanomaterial data computations to identify clean water filtering solutions. When juxtaposed with purely crowdsourcing-based projects, distributed intelligence offers a deeper analytical insight into computed results. Furthermore, China’s Water Safety Plan encourages the public to broadcast their local environmental drinking water quality, tracking the resolution of related health concerns via social media platforms - a facet of distributed intelligence.
In the aspect of data validation and transparency, for the four projects that are rooted in participatory science, validation typically occurs during field visits. As most of these events involve field excursions supervised by experts, this hands-on participation ensures that data from non-professionals is rigorously examined by professionals in real-time. However, this scrutiny largely relates to ensuring the correct operation of instruments rather than evaluating the actual results from the water samples. Specifically, when water quality is assessed during these outings, maintaining consistent accuracy is challenging as various individuals conduct tests at different locations. Issues related to pollution, detected by portable instruments, typically trigger the validation process; water samples are then dispatched to reputable institutions, such as the MyH2O collaborators at the Beijing University of Technology Laboratory, for testing against national standards to confirm the identified concerns.
For the two other projects aligned with distributed intelligence (C4CW and China’s Water Safety Plan), data verification is primarily post hoc, based on expert reviews after data upload. This is mainly because the verification process transpires online, rather than in situ.
In terms of data transparency, apart from discussions pertaining to China’s water safety initiatives on public platforms like Weibo, not all project-acquired data is accessible to participants. Typically, participants can only access their contributions and potentially the associated investigative report, as illustrated in Figure 6.
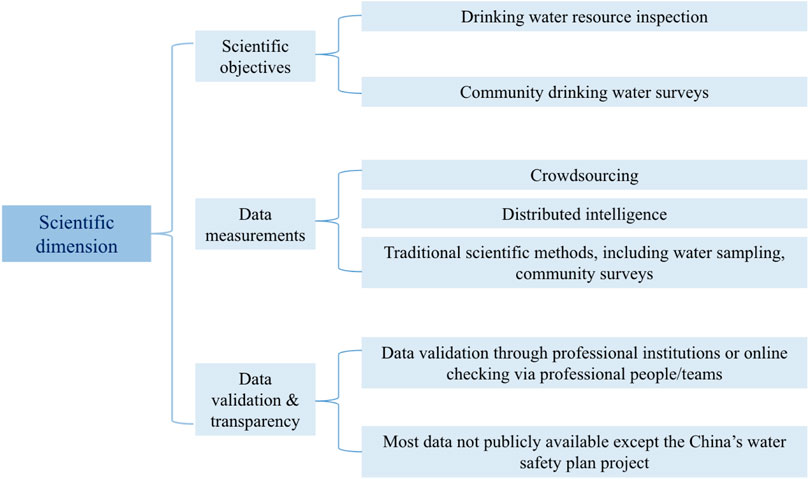
FIGURE 6. The evaluation results of drinking water monitoring citizen science projects within the scientific dimension.
Within the six projects, participant numbers exhibit significant variation, spanning from a mere few dozen to an impressive 100,000. Three projects—River Watcher (nearly 100,000), C4CW (in excess of 50,000), and Guizhou River Day 1 + 2 Action (35,000) — report participant figures exceeding tens of thousands. Concurrently, China’s Water Safety Plan and MyH2O register participant counts surpassing a thousand. However, accurate participant data for the Solving Groundwater Contamination with Community Science project remains elusive, a challenge frequently encountered with projects of a local scope. Preliminary data from the available reports suggest a count that, inclusive of professional teams and local villagers, oscillates between several dozen and one hundred. In comparison with freshwater monitoring endeavours, projects centred on drinking water consistently demonstrate higher participant engagement.
It could be found that projects with national and regional breadth command the predominant share of engagement, intimating a more expansive sphere of influence. This trend underscores a potential correlation between the magnitude of participant involvement, the overarching scope of the project, and the immediacy of its central issues to participants’ everyday experiences.
In the aspect of interactive training support, only China’s Water Safety Plan leverages digital media to document and monitor sewage locations. This digital approach obviates the need for in-depth training in water monitoring or survey techniques; participants also need only an internet connection to report observations. In contrast, other projects require preliminary orientation or training sessions.
The rest of the projects require a certain amount of training before they can be carried out. Within the scope of drinking water resource inspection initiatives, both River Watcher and Guizhou River Day 1 + 2 Action have instituted training components. However, the vastness of the projects introduces distinct training dynamics. For instance, the River Watcher, with its national outreach, grapples with the challenge of orchestrating face-to-face training for its extensive participant base, approaching 100,000 individuals. To circumvent this logistical hurdle, the initiative heavily pivots towards online modes of information dissemination, with a particular emphasis on the ‘Quhebian’ module within the Alipay App, backed by the Alibaba Group.
Nonetheless, ‘Quhebian’ primarily features instructional videos, offering scant professional insights into nuanced aspects such as water quality assays or biodiversity discernment. This pared-down training strategy aligns with the project’s current expansionary trajectory. Currently, the initiative places a premium on broadening its user base rather than on intensive, specialised training. This strategic decision potentially underpins the project’s reluctance to adopt the term ‘citizen science’, lest it deter participants who might misconstrue it as a call for elevated professional expertise.
The Guizhou River Day 1 + 2 Action operates at a local level and, with a comparatively smaller participant base than River Watcher, can readily facilitate offline training sessions. These sessions encompass logistical elements, from material sourcing to training room set-up. An illustrative example is the training approach of the Wujiang river protection team. Here, participants undergo a 30-minute training session underscores the importance of the Wujiang river and delineates the responsibilities associated with river monitoring.
In the community drinking water survey projects like MyH2O and Solving Ground Water Contamination with Community Science, there is an emphasis on hands-on interactive training. The MyH2O project requires a primary site visit for water sampling while also expecting local participants to engage with a thorough questionnaire. Within the MyH2O framework, interactive training goes beyond team collaboration and serves for both knowledge exchange and directives emanating from the central MyH2O base in Beijing.
In contrast, the Solving Ground Water Contamination with Community Science project, which is more limited to a local domain, adopts a somewhat relaxed training paradigm compared to MyH2O. However, its small scale facilitates more direct, seamless interactions within the team, fostering a sense of camaraderie and shared purpose.
In the aspect of evaluation of the number of levels of participant engagement and the highest level of this engagement, remarkably, only one project achieves the fourth level, dubbed ‘Extreme CS’: MyH2O. Extreme citizen science initiatives underscore the potential within even remote communities with rudimentary technical and educational foundations. By comprehending the local cultural and knowledge constructs it is possible to equip local inhabitants to carry out scientific inquiries autonomously, supporting sustainability in environmental stewardship (Haklay, 2012).
For other projects the top level is Level 3, with three projects fitting the bill: River Watcher, C4CW, and Guizhou River Day 1 + 2 Action. Intriguingly, all three are earmarked under the drinking water resource inspection umbrella. Both River Watcher and C4CW span three echelons of citizen science, from Level 1 through 3, whereas Guizhou River Day 1 + 2 Action straddles the Level 2 to 3 spectrum. Observations indicate that the majority of River Watcher participants are of a more mature demographic, particularly pronounced in third- and fourth-tier cities. These participants frequently correlate their learnings from citizen science endeavours with enhancing their scientific acumen. Such an acumen encapsulates a broad scientific ethos, fostering an understanding of the scientific process, the modus operandi of scientists, the contemporary research quandaries they pose, and their methods to elucidate them (Land-Zandstra et al., 2021) (Figure 7).
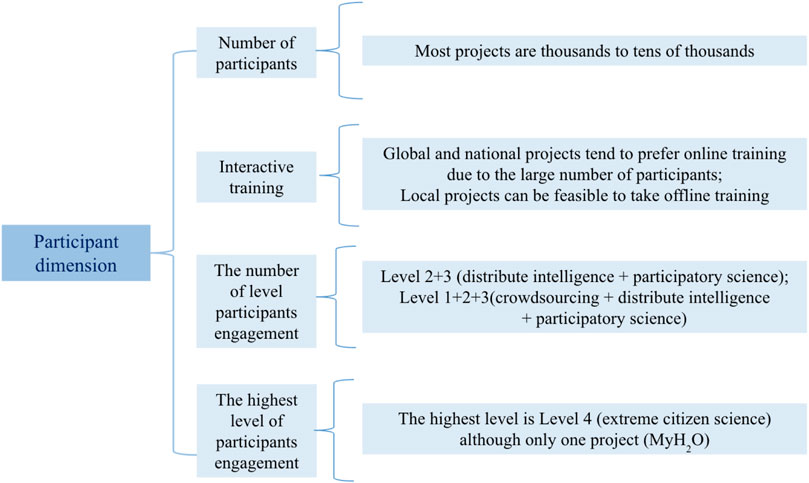
FIGURE 7. The evaluation results of drinking water monitoring citizen science projects within the participant dimension.
With stakeholders, five primary categories emerge and four of these align closely with those found in freshwater monitoring projects: non-governmental organisations (NGOs), universities, governments, and the general public. The fifth category, foundations, stands out distinctly in the context of drinking water projects. Unlike their freshwater monitoring counterparts, these projects see a marked increase in foundation-led funding (e.g., The Tencent Charity Foundation), particularly for MyH2O, River Watcher and Guizhou River Day 1 + 2 Action.
The government’s nuanced role in these projects warrants attention. Rather than serving as primary sponsors, local governmental entities often oversee administrative functions, such as the issuance of investigative permits and the subsequent assimilation of findings. This oversight is in contrast to the engagement of the public, which ranges from grassroots participation by local villagers to the tech-savvy contributions of digital enthusiasts.
Meanwhile, the academic sector, especially universities, take a leading role in these endeavours. Both faculty and students engage deeply in these initiatives, contributing to a culture of scientific collaboration. The exclusion of China’s Water Safety Plan notwithstanding, student cohorts have been instrumental in field research, as evidenced by projects such as River Watcher, MyH2O, and Guizhou River Day 1 + 2 Action. Highlighting international collaboration, a university team based in Tokyo has made significant contributions to a groundwater pollution initiative in Inner Mongolia.
Cooperation between NGOs and university groups on drinking water projects occurs most often. As mentioned before, all these projects are led by NGOs, with data research or drinking water quality test contributions made by people from universities. Despite the government’s limited involvement, public engagement is heightened, a sentiment especially evident in the MyH2O project’s tap water collection. During the observation phase, the community’s concern for safe drinking water became palpable; every household willingly provided water samples, driven by a shared desire to understand the health quality of their water. Complementing these efforts, foundations often step in to support NGOs, primarily through financial and material sponsorships, reinforcing the interconnectedness of these stakeholders in achieving common goals.
In the aspect of SDGs’ implementation, these six projects stand out for their contribution. They have significantly aided the realisation of SDG 6 targets, especially targets 6.1, 6.6, and 6. b. While the rural drinking water survey naturally aligns with 6.2 (sanitation), there is an evident gap: none of these projects yet explore the link between toilet sanitation and drinking water.
Diving deeper into the individual contributions, River Watcher, MyH2O, and Solving Groundwater Contamination with Community Science emerge as potential data providers for indicator monitoring. The River Watcher initiative, in particular, is commendable for its multifaceted health assessment of rivers. Following guidelines from the Ministry of Water Resources, it aligns closely with targets 6.3 (water quality) and 6.6 (integrated water resources management). A critical measure here, SDG indicator 6.3.2, emphasises the water bodies' ambient quality. Although River Watcher holds promise, its non-reliance on chemical values poses challenges for contributing to the monitoring of this specific indicator.
On the other hand, the MyH2O project holds considerable potential for enhancing target 6.1 (drinking water). Its unit-based investigation is promising, yet, to align more cohesively with indicator 6.1.1, its methodology could benefit from some recalibration, transitioning from selective assessments to a more exhaustive approach. Similarly, the project ‘Solving Groundwater Contamination with Community Science’ shows potential synergies with MyH2O, particularly in supporting drinking water safety and providing relevant data for indicator 6.1.1. While other projects may not directly contribute data on water quality, their emphasis on public participation is invaluable in achieving target 6. b.
Examining the broader impact on the community, most of the six projects, with the exception of C4CW and China’s Water Safety Plan, are positioned to reshape local public perceptions positively. These two exceptions leverage the Internet for outreach, making their impact more diffused and not region-specific, resonating particularly with computing enthusiasts and social media users.
Lastly, in terms of local economic implications, MyH2O stands out for its tangible benefits, forging ties with village-based water purifier companies. This collaboration not only addresses local concerns about tap water safety but also has the potential to rejuvenate the local water purifier industry. For the other projects, the long-term vision involves improving drinking water safety, which would indirectly enhance local health and, by extension, the economy. However, tangible economic benefits are currently missing. In contrast, C4CW’s ambition to innovate water filtration materials suggests future prospects, heralding potential economic growth once the material is commercialised, as illustrated in Figure 8.
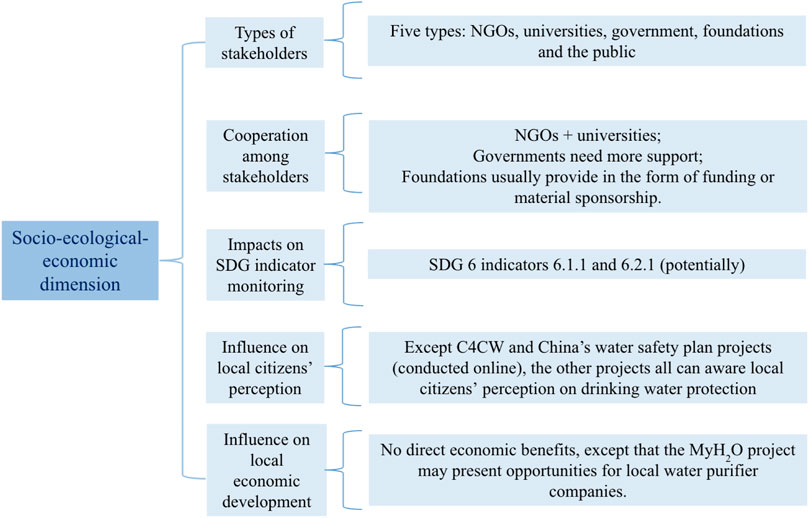
FIGURE 8. The evaluation results of drinking water monitoring citizen science projects within the socio-ecological-economic dimension.
The present contributions of CS projects towards SDG 6 in China appear to be limited. Specifically, only three indicators - 6.1.1, 6.3.2, and 6.6.1—have been identified to directly benefit from data derived from existing CS projects. Moreover, data can make indirect contributions to the monitoring of indicator 6.3.1. However, contributions to 6.2.1 are absent, revealing a gap when compared with global contributions from CS projects in water quality monitoring (as mentioned in the Introduction).
For indicator 6.1.1, representing the ‘Proportion of population using safely managed drinking water services,’ data can currently be monitored in China. An examination of data from 2000–2020 (provided by the World Health Organisation and UNICEF) shows that China has made significant progress in improving access to safe drinking water. However, a disparity persists between urban and rural areas: 95% of urban drinking water is safely managed, compared to only 90% of rural drinking water (Shi, 2020). To ensure access to safely managed drinking water services in rural areas, further data collection and targeted efforts are required. Through citizen involvement in water quality monitoring, projects can provide direct data on the safety and accessibility of drinking water sources. One notable global project is ‘mWater,’ which encourages citizens to gather water quality data from various drinking water sources (e.g., wells, springs, and piped water supplies) using the corresponding mWater mobile app (Hutchings et al., 2012). Specifically, users can map water sources, evaluate water quality, trace water usage, and oversee sanitation facilities.
Among all the drinking water CS projects evaluated in this study, MyH2O stands out for its ongoing commitment to monitoring drinking water quality in rural communities. Compared to the globally-focused ‘mWater’ project previously mentioned, MyH2O is a national-level initiative tailored specifically for China, especially its rural regions. This gives it a distinct advantage in addressing the data gaps more effectively and with greater relevance for rural areas in China. However, given that MyH2O was initiated by a NGO, it has not garnered robust support from the government. This has led to two significant challenges for data acceptance within this project. Firstly, navigating China’s intricate legal and regulatory framework proves daunting, particularly concerning data collection, sharing, and privacy. It is imperative to ensure compliance with the applicable laws and regulations to circumvent potential disputes. Secondly, fostering collaborations and synchronising efforts with government agencies, academic bodies, and other stakeholders can be intricate and demand a substantial amount of time.
For indicator 6.3.2, which relates to the ‘Proportion of bodies of water with good ambient water quality’, despite China implementing numerous policies aimed at improving water quality and introducing stricter standards, pollution continues to be a pressing issue, particularly in its rivers and lakes. At present, only Level 1 data for indicator 6.3.2 is available, with Level 2 data still requiring further elaboration.
Citizen scientists can provide invaluable contributions through their data collection efforts on water quality monitoring. This process involves taking samples and assessing parameters such as pH, temperature, dissolved oxygen, and the detection of pollutants. This information plays an important role in determining the overall water quality across various water bodies and subsequently informs decision-making in water resource management. A standout project on an international scale is the FreshWater Watch initiative, which has been operational in China and was examined in this study. This initiative mobilises individuals worldwide to collect water samples from local freshwater sources, encompassing lakes, rivers, and streams. Participants receive training to measure vital water quality indicators, such as nitrate and phosphate concentrations, turbidity, and conductivity using user-friendly test kits. The gathered data is subsequently uploaded to an online platform, contributing to a global water quality database. Shanghai, Guangzhou, and Hong Kong stand out as the main cities participating in this project (König et al., 2020).
Furthermore, The Black and Smelly App initiative is also noteworthy, presenting potential for wider growth within China and aiding contributions to indicator 6.3.2 Level 2 data. The primary reason for this assertion is the project’s commitment to monitoring water pollution, notably in urban water bodies, aligning it directly with the monitoring requirements of indicator 6.3.2 Level 2. A particular advantage of this initiative, when compared to other assessment projects discussed in this study, is its origin and consistent support from the national government. Additionally, the data produced by this initiative has secured official recognition from the government. Such achievements highlight potential pathways for similar projects to achieve government accreditation.
For indicator 6.6.1, centred on the ‘Change in the extent of water-related ecosystems over time’, existing freshwater monitoring projects in China do not sufficiently supply the comprehensive monitoring data requisite for indicator 6.6.1. However, by harnessing the water quality data garnered from relevant CS projects, we can infer the health status of the corresponding water ecosystems. It is vital to understand, though, that the assessment of ecosystem health is not solely tethered to water quality. Consequently, a holistic evaluation requires the amalgamation of data from water-related ecosystem observation CS projects in China.
Specifically, by gathering data on flora, fauna, and habitat shifts, citizen scientists can assist in pinpointing alterations within these ecosystems, which in turn can inform the development of conservation and restoration strategies. A standout project on the global scene is ‘Globe Wetlands’, which accentuates the importance of tracking changes in water-related ecosystems. This initiative encourages citizens to examine and report on the condition and extent of local wetland ecosystems. Using a mobile app, participants record data, including photographs and geolocations, to trace variances in the wetland’s extent and health over time (Amler et al., 2015). On the other hand, the majority of water-related ecosystem observation CS projects in China are managed by small teams. The absence of software to allow real-time data updates from a broader base results in a heightened reliance on these teams, who regularly analyse and relay data to the relevant departments or for academic dissemination.
China’s Biodiversity Observation Network (CBON) might prove instrumental in providing data on water-related ecosystems, such as wetlands, given its mandate to monitor and preserve China’s biodiversity. Participants can employ a dedicated App to snap pictures of plants and animals, which are then integrated into a central database. This aggregation provides crucial information for biodiversity conservation initiatives (Wei, 2022).
For indicator 6.3.1, focusing on the ‘Proportion of Wastewater Safely Treated’, the World Health Organization’s (WHO) current data for China highlights an urgent requirement for additional data. The latest figures, updated to 2020, indicate that 65% of wastewater receives safe treatment, with domestic, sewer, and septic tank systems as the predominant avenues for wastewater management (Thevenon and Shantz, 2021) in China. Looking ahead, wastewater treatment data initiatives in China should be closely monitored over extended periods, ensuring that the final treatment methods are thoroughly documented before data consolidation.
Whilst CS projects might not directly provide data on wastewater treatment, they can enhance official datasets by monitoring water quality in rivers, lakes, and other aquatic ecosystems. This additional data can help evaluate the efficacy of wastewater treatment systems and pinpoint areas for improvement. Currently, a significant proportion of global water quality monitoring initiatives are dedicated to collecting data on various water quality metrics. However, there’s a marked gap in studies specifically addressing wastewater tracking and its widespread distribution. As a result, modern research and ongoing projects offer limited insights into the overall distribution of wastewater. This sheds light on why CS is viewed as a potential Supplementary Material source for this particular indicator, especially within the Chinese context.
However, such data sets are likely to receive governmental approval in the coming years, contrasting with other types of CS data for other SDG 6 indicators. The reason being the previous establishment by the Chinese government of a monitoring and reporting system for this purpose. At the moment, the emphasis is primarily on sharing sewage-related information. Generally, citizens do not continuously monitor the government’s actions in the treatment process or the updates related to the specific results and methodologies of wastewater treatment. Additionally, the process of wastewater treatment is characteristically extensive, often taking 6 months or more. In other words, the current data on this indicator has gaps concerning detailed wastewater treatment methods. To address this shortfall, the introduction of an open platform for continuous observation and regular updates is essential, ensuring accurate recording of wastewater treatment methods and results. Historically, governments tend to be more amenable to public reporting when it aligns with effective governance (Figure 9).
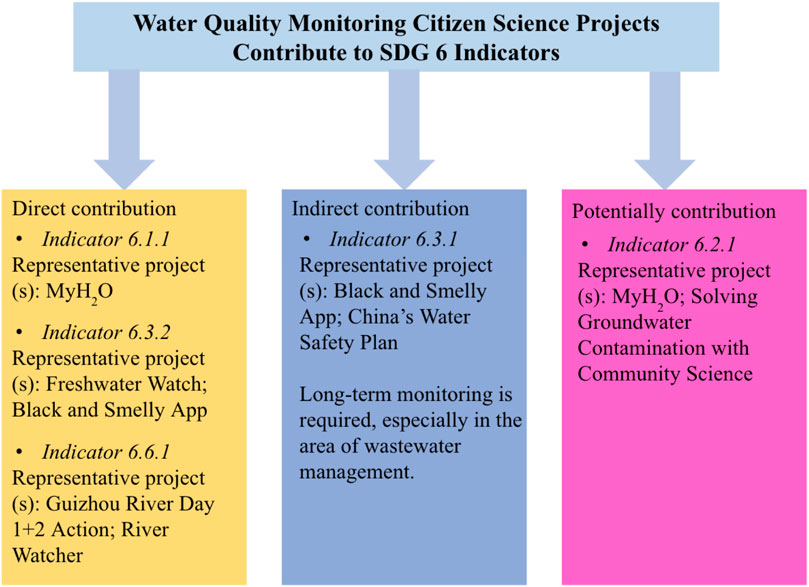
FIGURE 9. Water quality monitoring citizen science projects on the SDG 6 indicators.
As set out in Section 4.1, there is a marked deficiency in data for indicator 6.2.1, representing the ‘Proportion of population using safely managed sanitation services’, in terms of the presence of handwashing facilities, complete with soap and water, across various regions. Despite China’s laudable efforts in enhancing sanitation services, evident in the growth of sewage treatment facilities and the launch of the ‘Toilet Revolution’ initiative (Cheng et al., 2018), there remains a pronounced challenge in embedding safely managed sanitation services within rural settings. Specifically, 56% of the rural population lacks access to such essential amenities (Center for International Knowledge on Development, 2021).
CS initiatives have the potential to procure data that can shape policy decisions and boost sanitation practices. A notable global initiative in this realm is the ‘Shit Flow Diagram’ (SFD) project. Central to this endeavour is the collection of data pertaining to sanitation services, spanning elements from toilet use to the treatment, and, in the final stages, the disposal or repurposing of excreta (Komakech et al., 2019). Those data can adeptly map the movement of excreta through urban and suburban environments, acting as an invaluable resource in assessing sanitation services and pinpointing areas ripe for augmentation.
Whilst the current rural CS observation project does not gather data for indicator 6.2.1, existing CS drinking water monitoring initiatives in China might contemplate including data monitoring for indicator 6.2.1 alongside indicator 6.1.1. This suggests that there would be merit in broadening the survey criteria of the drinking-water CS project, thereby augmenting its data offering and bolstering the monitoring of indicator 6.2.1. Against this backdrop, it would be appropriate to explore the feasibility of implementing global-level SFD projects in China. MyH2O, notably, emerges as a leading contender for collaboration due to their established record, as highlighted by the studies we’ve examined. The compelling argument here is that data for both indicators 6.1.1 and 6.2.1 can be gleaned simultaneously from community households, especially given that MyH2O is already active in surveying rural areas. Consequently, the focus of the research could shift from merely examining drinking water quality to a more holistic approach that encompasses both sanitation management and drinking water safety, as illustrated in Figure 9.
However, it should be noted that projects like the one above, which have not yet produced data, face significant challenges when it comes to data acceptance, encompassing three key aspects: first, the imperative of ensuring steady and uniform data production; second, the quest to devise strategies that foster governmental participation or collaboration with analogous projects; and third, the task of fostering confidence in the data generated by these CS projects, thereby easing its assimilation by government entities.
The challenges delineated in Section 4.2.1, specifically the second and third, are not exclusive to nascent projects; they also manifest in established projects with a steady stream of data. Considering the intrinsic link between water safety issues and the development of public life, governmental involvement or leadership, particularly in nations with centralised authority such as China, could facilitate more efficient data collection. This in turn can expedite the process of water quality management. Succinctly, fostering trust in data among governments and organisations is a critical step for enhancing the depth of water quality monitoring data and advancing the progress of water management in CS projects.
As outlined in Section 4.1, various indicators grapple with a diverse array of data trust issues. Among all water-related indicators, indicator 6.3.2 receives the highest level of acceptance from the government in the context of citizen science. Despite the noticeable lack of second-tier data for this indicator, CS initiatives have stepped in to fill this gap. The ‘Black and Smelly’ project stands out due to its significance and government support. The key reason for the government’s endorsement of this project’s data is its execution under direct governmental supervision, supporting the implementation of broad water management goals at the local level. The project operates on the principle of ‘downwards accountability’, wherein collective civic action, facilitated by Information and communication technologies (ICTs), exerts external pressure on service providers (Hsu et al., 2019).
In China, water quality monitoring anchored to various indicators faces two main challenges concerning data trustworthiness. The primary challenge relates to those indicators already subjected to intensive governmental oversight. Integrating data from a multitude of sources, notably from CS projects, poses significant hurdles, particularly evident when dealing with the intricacies of indicator 6.1.1. Owing to the vast amount of data, combined with concerns about privacy and the integrity of such data, governmental endorsement of citizen science efforts can be hesitant. The MyH2O project is illustrative of this. Despite its laudable goal of tackling water-centric issues, its findings have not yet been integrated into formal government water-related policies. This situation is further complicated by the fact that a significant portion of data originates from portable devices, which might not conform to nationally approved standards. Moreover, there’s a discernible tendency among local governmental bodies to lean towards immediate problem-solving rather than delving into data intricacies, typically defaulting to established water conservancy stations for validation. Therefore, building collaborative bridges with governmental entities becomes essential for a comprehensive monitoring of indicator 6.1.1.
However, concrete actions from governments have been lacking due to the absence of shared interests between organisations and local governments. To advance the future development of such projects, recommendations revolve around two aspects. Firstly, efforts should be made to reduce data errors, such as appointing designated personnel to monitor data and providing instrumentation training in advance. Secondly, establishing stronger links between these projects and the SDGs, particularly through social media, is suggested. This approach aims to raise awareness and potentially attract funding or technical cooperation related to sustainable development initiatives.
The second type encompasses indicators for which the government currently lacks a steady stream of data. In light of considerations for social stability, there is a reluctance to accept data from other sources, including citizen science projects. This is the case for the monitoring of indicator 6.3.1. The existing sewage monitoring and reporting projects, such as Black and Smelly Waters App in China, necessitate a prolonged tracking period to provide data on the final sewage treatment method, thereby contributing to the monitoring of this indicator.
This inconsistency, coupled with concerns about upholding social stability, has resulted in a hesitancy from governments to incorporate data from alternative sources, especially CS initiatives. This reluctance is particularly evident in the monitoring of indicator 6.3.1. The primary reason stems from China’s current sewage monitoring and reporting protocol, which demands extended monitoring to determine the final sewage treatment techniques, thereby posing an inherent challenge to a holistic assessment of this specific indicator.
River Watcher and Guizhou River Day 1 + 2 Action are closely associated with the government’s River Chief System (RCS). Launched in the mid-2010s, the RCS is an innovative river and water resources management system designed to address water pollution problems across all levels in China, from provinces and cities down to counties and townships, and to protect the ecological health of its water bodies (Wu et al., 2020). Participants in these activities encompass locals and river chiefs appointed by the government. The primary rationale for maintaining data privacy is to ensure social stability, particularly in polluted areas. Staff members from the River Watcher project have explained that the rationale for not disclosing environmental data is rooted in the need for multi-stakeholder collaboration in addressing pollution issues. Premature revelation of pollution incidents by non-governmental organisations could potentially incite social panic and create substantial public pressure for government intervention. This could put a strain on the future relationship between the government and non-governmental organisations, thereby hindering cooperative efforts.
Water quality monitoring projects draw participants from a spectrum of age groups. Notably, a significant group of these participants are older individuals, more so in second and third-tier cities. In contemplating the potential of CS amongst this older or retired demographic, the imperative to maintain their ability to contribute data at the ‘crowdsourcing’ level is paramount. This viewpoint is underpinned by two main considerations. First, there’s an anticipated rise in the elderly population. By 2030, global figures will include 1 billion individuals aged 65 and over, accounting for 12% of the total population. This age bracket is expanding at a pace unmatched by any other, with an expected growth of 150% over the coming 35 years (Martin, 2015). From a recruitment perspective, the elderly demographic provides a sizable pool for engagement.
Secondly, water quality monitoring CS projects predominantly rely on community-driven observations. The younger age groups might frequently encounter their primary commitments, notably those tied to employment, as barriers to sustained involvement in routine monitoring activities. In contrast, the senior demographic, chiefly retirees, often have more discretionary time. Delving into such monitoring activities can endow them with a community-centric role, nurturing a sense of community and purpose in their post-retirement phase.
While the involvement of the elderly demographic in CS initiatives holds promise, it is not without challenges. Foremost among these are technological barriers, notably those related to internet familiarity, which might hinder their full participation in such initiatives.
The most evident manifestation of these technological barriers is observed in their interactions with mobile applications. For instance, within the River Watcher project, older participants often grapple with numerous stages, from the initial log-in processes to tasks like geo-tagging and photo uploading. Currently, many CS initiatives fall short in providing comprehensive training resources tailored for the older demographic, making their involvement more challenging, as highlighted by Chiu et al. (2019). Yet, there’s a silver lining: while specific app interfaces might be daunting for them, a significant majority of seniors are adept with social networking tools, such as WeChat (akin to WhatsApp), and remain open to face-to-face interactions. This offers a pathway for a dual-mode training approach to enhance their proficiency in digital technology use. The online facet could leverage platforms like WeChat to disseminate step-by-step tutorials, supported further by peer-assistance within group chats. Conversely, offline instruction could be channelled through dedicated sessions at community centres. A symbiotic association with local universities that offer programmes for seniors could further bridge the internet literacy gap, thereby enhancing their engagement with CS projects (Figure 10), especially in terms of knowledge and data contribution.
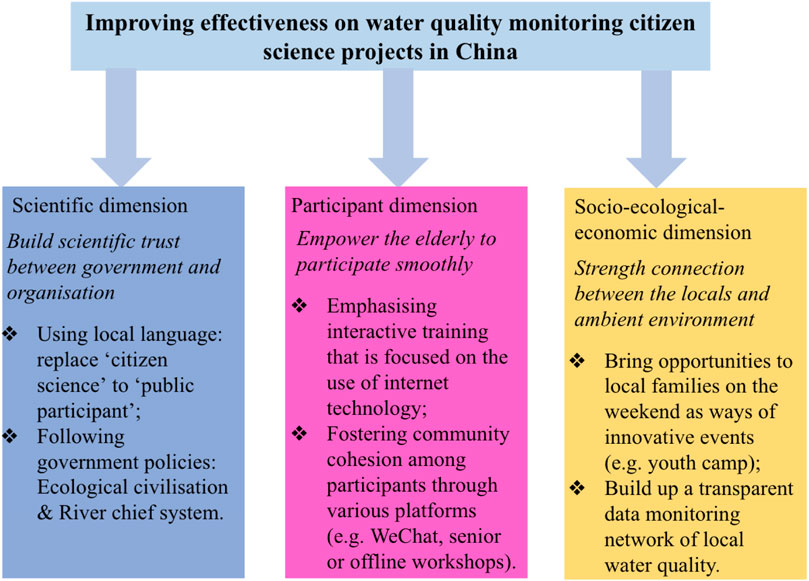
FIGURE 10. Proposals for addressing the challenges of citizen science water quality monitoring projects within three dimensions: Scientific, participant, and socio-ecological-economic.
In summary, the undertaking of water quality monitoring in China is still laden with significant challenges. Despite China’s focus on water pollution control since as early as 1979 and the introduction of more than 130 corresponding policies, numerous complexities and impediments persist. The country needs to continue refining and reinforcing its efforts on data monitoring, bearing in mind the profound significance of water quality for public health and ecological stability. The incorporation of CS into mainstream monitoring processes could provide invaluable support. Such initiatives, which foster the involvement of the general public in scientific research, can facilitate the collection of extensive and diverse datasets.
From the perspective of SDG 6 indicators, it is evident that reliable data for indicator 6.1.1 is consistently provided by official sources in China. However, for other indicators, the situation appears differently. Currently, there are 13 CS projects in China that can supplement or enhance water quality monitoring data. These projects primarily fall into two categories: freshwater resource monitoring and drinking water resource monitoring. Four indicators (6.1.1, 6.3.1, 6.3.2, and 6.6.1) have been identified as receiving direct and indirect data contributions from current CS initiatives. Specifically, projects centred on freshwater resource monitoring can contribute data to indicators 6.3.1, 6.3.2, and 6.6.1. And projects primarily aimed at drinking water quality monitoring largely help to expand data for indicator 6.1.1, particularly in rural areas. This differential focus highlights the unique capabilities of various CS initiatives in addressing disparate facets of water quality monitoring.
To enhance the likelihood of CS data acceptance for official SDG 6 indicators monitoring, two primary challenges need to be addressed. One is for government-controlled data projects, represented by indicator 6.1.1, the challenge lies in incorporating data from alternative sources (e.g., citizen science). And the second challenge pertains to indicators, such as 6.2.1, for which there has been no official government data output to date. In such cases, the consideration lies in how to enable citizen science projects to generate relevant data and make contributions for that.
Addressing the challenges can be approached from three directions: 1) Speaking local languages and aligning with local policies. It is crucial to communicate in local languages and align with local policies. The ‘River Chief System’ in China, for instance, provides an excellent opportunity for cooperation between government bodies and organisations. This strategic alignment can enhance the receptivity and applicability of the projects’ outputs; 2) Establishing effective partnerships with governments. It is key to create a well-defined collaboration framework with the government, which involves formalising data standards and protocols to foster an official and efficient process for accepting and integrating CS data; and 3) Catering to an ageing population. As China experiences an increasing trend towards an ageing population, older adults become a valuable workforce for water quality monitoring. However, given the technological requirements of many CS projects, it is important to invest in detailed technology training for this demographic, especially regarding internet technologies. Leveraging the power of social communities, particularly WeChat groups, and fostering mutual assistance between participants both online and offline, presents a highly effective strategy.
Overall, the primary contribution of this study lies in providing key insights into China’s strategic approach to monitoring SDG 6 indicators and promoting water-related citizen science. However, it is essential to recognise that there remain two challenges requiring further refinement. From a methodological perspective, the participant observations and semi-structured interviews took place shortly after China’s second lockdown, during which many activities were still recovering. Consequently, the dataset may not comprehensively capture the subtleties of all initiatives being assessed. In the future, it is imperative for research to delve more deeply into the offline activities of these projects whilst also monitoring emerging trends in water-related citizen science. Such a balanced approach promises a richer and more nuanced perspective in subsequent analyses.
Furthermore, when analysing the results, it could be known that the success of these CS initiatives is intrinsically linked to the acquisition of additional resources, particularly crucial monitoring tools and financial support. The dependency on external aid is especially evident for projects led by non-governmental organisations. Without immediate endorsement and sustained backing from key stakeholders, encompassing governmental bodies, charitable institutions, and the business sector, there’s an imminent risk of significant data gaps. This poses substantial threats to the objectives and outcomes of these initiatives. For future phases, one might consider developing citizen science projects centred on ecological civilisation and sustainable education. Such projects would align more seamlessly with China’s policies and societal ethos. This strategy not only could offer a promising avenue for garnering funds but also could address potential training shortfalls among participants for CS projects.
The original contributions presented in the study are included in the article/Supplementary Material, further inquiries can be directed to the corresponding author.
Ethical review and approval was required for the study on human participants in accordance with the local legislation and institutional requirements. Written informed consent from the participants was required to participate in this study in accordance with the national legislation and the institutional requirements. All materials were submitted and approved in 2021 by the University College London Ethics Committee.
YW, MH, and CW contributed to conception and design of the study. YW collected and analysed the data. YW wrote the first draft of the manuscript. MH and CW wrote sections of the manuscript. All authors contributed to the article and approved the submitted version.
This paper is funded by UCL Library Services’ (LCCOS) open access funding for publication.
We thank the reviewers for helping improve the manuscript.
The authors declare that the research was conducted in the absence of any commercial or financial relationships that could be construed as a potential conflict of interest.
All claims expressed in this article are solely those of the authors and do not necessarily represent those of their affiliated organizations, or those of the publisher, the editors and the reviewers. Any product that may be evaluated in this article, or claim that may be made by its manufacturer, is not guaranteed or endorsed by the publisher.
The Supplementary Material for this article can be found online at: https://www.frontiersin.org/articles/10.3389/fenvs.2023.1234966/full#supplementary-material
Ali, S. M., Appolloni, A., Cavallaro, F., D’Adamo, I., Di Vaio, A., Ferella, F., et al. (2023). Development goals towards sustainability. Sustainability 15 (12), 9443. doi:10.3390/su15129443
Al-Omran, A., Al-Barakah, F., Altuquq, A., Aly, A., and Nadeem, M. (2015). Drinking water quality assessment and water quality index of Riyadh, Saudi Arabia. Water Qual. Res. J. 50 (3), 287–296. doi:10.2166/wqrjc.2015.039
Amler, E., Schmidt, M., and Menz, G. (2015). Definitions and mapping of east african wetlands: a review. Remote Sens. 7 (5), 5256–5282. doi:10.3390/rs70505256
Bachmann, N., Tripathi, S., Brunner, M., and Jodlbauer, H. (2022). The contribution of data-driven technologies in achieving the sustainable development goals. Sustainability 14 (5), 2497. doi:10.3390/su14052497
Cassardo, C., and Jones, J. A. A. (2011). Managing water in a changing World. Water 3 (2), 618–628. doi:10.3390/w3020618
Center for International Knowledge on Development (2021). China’s progress report on implementation of the 2030 agenda for sustainable development. Available at: https://www.fmprc.gov.cn/eng/topics_665678/2030kcxfzyc/202109/P020211019152754484797.pdf.
Cheng, S., Li, Z., Uddin, S. M. N., Mang, H. P., Zhou, X., Zhang, J., et al. (2018). Toilet revolution in China. J. Environ. Manag. 216, 347–356. doi:10.1016/j.jenvman.2017.09.043
Chick, B. (2017). FreshWater Watch: citizen science at work China water risk. Available at: https://www.chinawaterrisk.org/opinions/freshwater-watch-citizen-science-at-work/ (Accessed June 5, 2023).
Chiu, C. J., Tasi, W. C., Yang, W. L., and Guo, J. L. (2019). How to help older adults learn new technology? Results from a multiple case research interviewing the internet technology instructors at the senior learning center. Comput. Educ. 129, 61–70. doi:10.1016/j.compedu.2018.10.020
D’Andrea, L., Kalpazidou Schmidt, E., Bužan, E., Vidal Merino, M., Dall, E., Colonnello, C., et al. (2022). Evaluating citizen science initiatives through a citizen science-based approach. fteval J. Res. Technol. Policy Eval. 53 (54), 43–50. doi:10.22163/fteval.2022.570
Fraisl, D., Campbell, J., See, L., Wehn, U., Wardlaw, J., Gold, M., et al. (2020). Mapping citizen science contributions to the UN sustainable development goals. Sustain. Sci. 15, 1735–1751. doi:10.1007/s11625-020-00833-7
Hák, T., Janoušková, S., and Moldan, B. (2016). Sustainable development goals: a need for relevant indicators. Ecol. Indic. 60 (2), 565–573. doi:10.1016/j.ecolind.2015.08.003
Haklay, M. (2012). “Citizen science and volunteered geographic information: overview and typology of participation,” in Crowdsourcing geographic knowledge: volunteered geographic information (VGI) in theory and practice (Dordrecht, Netherlands: Spinger), 105–122. doi:10.1007/978-94-007-4587-2_7
Hecker, S., Haklay, M., and Bowser, A. (2018). Citizen science: innovation in open science, society and policy. London: Ucl Press.
Hsu, A., Weinfurter, A., Tong, J., and Xie, Y. (2019). Black and Smelly Waters: how citizen-generated transparency is addressing gaps in China’s environmental management. J. Environ. Policy & Plan. 22 (1), 138–153. doi:10.1080/1523908x.2019.1654365
Hutchings, M., Dev, A., Palaniappan, M., Srinivasan, V., Ramanathan, N., Taylor, J., et al. (2012). mWASH: mobile phone applications for the water, sanitation, and hygiene sector mWASH: mobile phone applications for the water, sanitation, and hygiene sector. Available at: https://pacinst.org/wp-content/uploads/2012/05/mwash.pdf.
Jamshed, S. (2014). Qualitative research method-interviewing and observation. J. Basic Clin. Pharm. 5 (4), 87–88. doi:10.4103/0976-0105.141942
Jie, F. (2013). China’s groundwater scandal: the missing waste water China Dialogue. Available at: https://chinadialogue.net/en/pollution/5764-china-s-groundwater-scandal-the-missing-waste-water/.
Jongman, M., and Korsten, L. (2016). Assessment of irrigation water quality and microbiological safety of leafy greens in different production systems. J. Food Saf. 37 (3), e12324. doi:10.1111/jfs.12324
Kaiman, J. (2014). China says more than half of its groundwater is polluted the Guardian. Available at: https://www.theguardian.com/environment/2014/apr/23/china-half-groundwater-polluted.
Kieslinger, B., Schäfer, T., Heigl, F., Dörler, D., Richter, A., and Bonn, A. (2017). The challenge of evaluation: an open framework for evaluating citizen science activities SocArXiv. doi:10.31235/osf.io/enzc9
Komakech, H. C., Moyo, F., Machunda, R. L., Smith, K. M., Gautam, O. P., Cairncross, S., et al. (2019). What proportion counts? Disaggregating access to safely managed sanitation in an emerging town in Tanzania. Int. J. Environ. Res. Public Health 16 (18), 3328. doi:10.3390/ijerph16183328
König, A., Pickar, K., Stankiewicz, J., and Hondrila, K. (2020). Can citizen science complement official data sources that serve as evidence-base for policies and practice to improve water quality? Stat. J. IAOS 37 (1), 189–204. doi:10.3233/sji-200737
Kumar, L., Kamil, I., Ahmad, M., Naqvi, S. A., Deitch, M. J., Amjad, A. Q., et al. (2022). In-house resource efficiency improvements supplementing the end of pipe treatments in textile SMEs under a circular economy fashion. Front. Environ. Sci. 10, 2319. doi:10.3389/fenvs.2022.1002319
Land-Zandstra, A., Agnello, G., and Gültekin, Y. S. (2021). “Participants in citizen science,” in The science of citizen science (Cham, Switzerland: Spinger), 243–259. doi:10.1007/978-3-030-58278-4_13
Lin, S., Man, Y. B., Chow, K. L., Zheng, C., and Wong, M. H. (2019). Impacts of the influx of e-waste into Hong Kong after China has tightened up entry regulations. Crit. Rev. Environ. Sci. Technol. 50 (2), 105–134. doi:10.1080/10643389.2019.1619377
Liñán, S., Salvador, X., Álvarez, A., Comaposada, A., Sanchez, L., Aparicio, N., et al. (2022). A new theoretical engagement framework for citizen science projects: using a multi-temporal approach to address long-term public engagement challenges. Environ. Res. Lett. 17 (10), 105006. doi:10.1088/1748-9326/ac939d
Loiselle, S., and Europe, E. (2022). Citizen science - citizen data for SDG indicator 6.3.2 - one way to fill the data void UNEP - UN environment programme. Available at: https://www.unep.org/explore-topics/water/what-we-do/world-water-quality-alliance-wwqa-partnership-effort/citizen (Accessed May 29, 2023).
Ma, T., Sun, S., Fu, G., Hall, J. W., Ni, Y., He, L., et al. (2020). Pollution exacerbates China’s water scarcity and its regional inequality. Nat. Commun. 11 (1), 650–659. doi:10.1038/s41467-020-14532-5
Martin, (2015). UN projects world population to reach 8.5 billion by 2030, driven by growth in developing countries. United Nations Sustainable Development. Available at: https://www.un.org/sustainabledevelopment/blog/2015/07/un-projects-world-population-to-reach-8-5-billion-by-2030-driven-by-growth-in-developing-countries/.
McMahon, J. (2017). How an app is stopping pollution in China forbes. Available at: https://www.forbes.com/sites/jeffmcmahon/2017/11/17/how-an-app-is-stopping-pollution-in-china/ (Accessed June 4, 2023).
Ortigara, A., Kay, M., and Uhlenbrook, S. (2018). A review of the SDG 6 synthesis report 2018 from an education, training, and research perspective. Water 10 (10), 1353. doi:10.3390/w10101353
Rajapakse, J. (2022). Safe water and sanitation for a healthier world: a global view of progress towards SDG 6. Cham: Springer.
Sachs, J. D., Lafortune, G., Fuller, G., and Drumm, E. (2023). Implementing the SDG stimulus. Sustainable development report 2023. Paris: Dublin: Dublin University Press. doi:10.25546/102924
Schölvinck, A. F. M., Scholten, W., and Diederen, P. J. M. (2022). Improve water quality through meaningful, not just any, citizen science. PLOS Water 1 (12), e0000065. doi:10.1371/journal.pwat.0000065
See, L. (2019). A review of citizen science and crowdsourcing in applications of pluvial flooding. Front. Earth Sci. 7, 44. doi:10.3389/feart.2019.00044
Shen, M., and Yang, Y. (2017). The water pollution policy regime shift and boundary pollution: evidence from the change of water pollution levels in China. Sustainability 9 (8), 1469. doi:10.3390/su9081469
Sheng, W. (2023). China leads global efforts to realize UN sustainable development goals for 2030 - global Times. Available at: https://www.globaltimes.cn/page/202306/1293251.shtml.
Shi, X. (2020). The safety of drinking water in China: current status and future prospects. China CDC Wkly. 2 (13), 210–215. doi:10.46234/ccdcw2020.055
The Crowd and The Cloud (2017). The Blue map app. Available at: https://crowdandcloud.org/blue-map-app (Accessed June 4, 2023).
Thevenon, F., and Shantz, A. (2021). Progress on wastewater treatment. Available at: https://unhabitat.org/sites/default/files/2021/08/sdg6_indicator_report_631_progress_on_wastewater_treatment_2021_english_pages.pdf.
UNESCO World Water Assessment Programme (2023). The united nations World water development report 2023: partnerships and cooperation for water Unesco.org. Available at: https://unesdoc.unesco.org/ark:/48223/pf0000384655.
UN Water (2020). 2020 data drive UN-water. Available at: https://www.unwater.org/news/2020-data-drive (Accessed May 29, 2023).
Vohland, K., Sauermann, H., Antoniou, V., Balazs, B., Göbel, C., Karatzas, K., et al. (2019). Citizen science and sustainability transitions. SSRN Electron. J. 49 (5), 88. doi:10.2139/ssrn.3511088
Walsh, M. (2019). Citizen science app helping clean up China’s polluted water bodies, study says - caixin global. www.caixinglobal.com. Available at: https://www.caixinglobal.com/2019-10-09/citizen-science-app-helping-clean-up-chinas-polluted-water-bodies-study-says-101469072.html.
Wei, C. (2022). China Nature Watch: using technology for Biodiversity Information Collection and Application to facilitate biodiversity-friendly decision making panorama.solutions. Available at: https://panorama.solutions/en/solution/china-nature-watch-using-technology-biodiversity-information-collection-and-application (Accessed May 29, 2023).
Wong, N. (2018). Electronic waste governance under ‘one country, two systems’: Hong Kong and Mainland China. Int. J. Environ. Res. Public Health 15 (11), 2347. doi:10.3390/ijerph15112347
Wu, C., Ju, M., Wang, L., Gu, X., and Jiang, C. (2020). Public participation of the River Chief system in China: current trends, problems, and perspectives. Water 12 (12), 3496. doi:10.3390/w12123496
Wu, Y., Washbourne, C., and Haklay, M. (2022). Citizen science in China’s water resources monitoring: current status and future prospects. Int. J. Sustain. Dev. World Ecol. 29 (3), 277–290. doi:10.1080/13504509.2021.2013973
Yuan, F., Wei, Y. D., Gao, J., and Chen, W. (2019). Water crisis, environmental regulations and location dynamics of pollution-intensive industries in China: a study of the Taihu Lake watershed. J. Clean. Prod. 216 (216), 311–322. doi:10.1016/j.jclepro.2019.01.177
Zamawe, F. (2015). The implication of using NVivo software in qualitative data analysis: evidence-based reflections. Malawi Med. J. 27 (1), 13. doi:10.4314/mmj.v27i1.4
Zhang, Y., Deng, J., Qin, B., Zhu, G., Zhang, Y., Jeppesen, E., et al. (2022). Importance and vulnerability of lakes and reservoirs supporting drinking water in China. Fundam. Res. 3, 265–273. doi:10.1016/j.fmre.2022.01.035
Keywords: water quality monitoring, sustainable development goals, citizen science, innovative design, China
Citation: Wu Y, Washbourne C and Haklay M (2023) Inspiring citizen science innovation for sustainable development goal 6 in water quality monitoring in China. Front. Environ. Sci. 11:1234966. doi: 10.3389/fenvs.2023.1234966
Received: 05 June 2023; Accepted: 16 October 2023;
Published: 01 November 2023.
Edited by:
Hilary Snook, United States Environmental Protection Agency (EPA), United StatesReviewed by:
Mohd Yusoff Ishak, Putra Malaysia University, MalaysiaCopyright © 2023 Wu, Washbourne and Haklay. This is an open-access article distributed under the terms of the Creative Commons Attribution License (CC BY). The use, distribution or reproduction in other forums is permitted, provided the original author(s) and the copyright owner(s) are credited and that the original publication in this journal is cited, in accordance with accepted academic practice. No use, distribution or reproduction is permitted which does not comply with these terms.
*Correspondence: Yaqian Wu, dWNmYXd1Z0B1Y2wuYWMudWs=
Disclaimer: All claims expressed in this article are solely those of the authors and do not necessarily represent those of their affiliated organizations, or those of the publisher, the editors and the reviewers. Any product that may be evaluated in this article or claim that may be made by its manufacturer is not guaranteed or endorsed by the publisher.
Research integrity at Frontiers
Learn more about the work of our research integrity team to safeguard the quality of each article we publish.