- 1School of Engineering and Built Environment, Griffith University, Nathan, QLD, Australia
- 2Department of Fisheries and Marine Science, Noakhali Science and Technology University, Noakhali, Bangladesh
- 3Centre for Marine Science, School of Life and Environmental Sciences, Deakin University, Melbourne, VIC, Australia
- 4Laboratory of Environmental Health and Ecotoxicology, Department of Environmental Sciences, Jahangirnagar University, Dhaka, Bangladesh
- 5Department of Zoology, College of Science, King Saud University, Riyadh, Saudi Arabia
- 6Environmental and Life Sciences Programme, Faculty of Science, Universiti Brunei Darussalam, Gadong, Brunei
Microplastics (MPs) have become pervasive in the environment, posing a threat to the environment, living organisms, and human health. Therefore, MPs have been extensively investigated in bodies of water, soils, and the atmosphere. However, there is limited information about MPs contamination in drinking water sold in plastic packaging from underdeveloped countries. In this study, we analyzed water samples from 10 different common brands of bottled water to detect and characterize MPs using stereomicroscopic and FTIR techniques. Oral consumption of MPs per capita was also estimated. Interestingly, our findings demonstrated that MPs were present in every brand. The average abundance of MPs varied from 14 ± 6.8 particles/L to 56 ± 23 particles/L, with a mean of 35 ± 19 particles/L in all brands. This number of MPs in the studied country was comparatively higher than those found in other countries. MPs were found in four different shapes (fibers, fragments, films, and beads), with fibers dominating the samples (90%). MPs were sorted into eight different colors, with the transparent one accounting for about 66% of the overall count, and 94% of the MPs were <0.5 mm in size. Infrared spectral analysis (FTIR) confirmed four types of polymers, e.g., low-density polyethylene (LDPE), high-density polyethylene (HDPE), ethylene vinyl acetate (EVA), and polyethylene terephthalate (PETE) where LDPE and HDPE were dominant. The estimated daily intake of MPs per person was determined to be 2.63 particles, translating to a yearly intake of 960 particles/person. MPs in bottled drinking water might come from the sources of the raw water and the materials used in the packaging, which warrants additional research. As MPs in drinking water have direct exposure to human health, we should be aware of using plastic packaging for drinking water.
1 Introduction
Microplastics (MPs) are polymer particles of various shapes or morphotypes smaller than 5 mm in size, such as films, beads, pellets, fragments, beads, spheres, or fibers (Thompson et al., 2004; Anderson et al., 2017; Banik et al., 2022). A variety of chemical compositions of MPs have been distinguished, including polyethylene (PE), polypropylene (PP), acrylic, polyamide (PA), polyester (PEST), ethylene vinyl acetate (EVA), polyethylene terephthalate (PETE), polyurethane (PU), polyvinyl chloride (PVC), polyacrylamide (PAA), polyethylene vinyl acetate (PEVA), polyethersulfone (PES), and polystyrene (PS) (Di and Wang, 2018; Nur et al., 2022). The manufacturing of plastics has seen a dramatic development since its entry on the consumer stage, increasing from 1 million in 1945 to over 367 million tons in 2020 (PMERG, 2021). With the increase in plastic production, there has been a related increase in plastic contamination of the world’s environment. The first report of MPs as a pollutant was in the marine environment in 1972 (Carpenter and Smith, 1972), but recently plastics have been identified within almost all environmental compartments, including ponds, rivers, wetlands, freshwater lakes, and inland seas, and in every organism from tiny phytoplankton to the giant humpback whale (Eriksen et al., 2013; Horton et al., 2017; Lusher et al., 2017). Regardless of the fact that the environmental and toxicological effects of MPs are still generally obscure, MPs are viewed as an emerging pollutant with conceivable impacts on human health (Pivokonsky et al., 2018; Smith et al., 2018).
The sources of MPs in the environment, particularly the aquatic environment, include plastic production plants, industrial waste, sewage discharge, and the decomposition of plastic litter (Mason et al., 2016; da Costa et al., 2016; Mintenig et al., 2017; Andrady, 2011). Virgin MPs have been shown to affect different life forms (Pivokonsky et al., 2018; Karami et al., 2017). Due to their ability to absorb many types of contaminants, such as organic pollutants and heavy metals, MPs can cause both physical and chemical contamination of the environment (Virsek et al., 2017; Squadrone et al., 2021; Noman et al., 2021; Noman et al., 2022). Hence, the toxicological effects through ingestion of these plastics may be presented in three different ways, the plastics themselves, the plastic additives, and the adsorbed contaminants (Browne et al., 2008; Browne et al., 2013; Zhang et al., 2020; Hui et al., 2021; Wang et al., 2021). For instance, the ingested plastic particles may cause internal abrasions or blockages in the organisms’ gastrointestinal tracts (Wright et al., 2013), and POPs adsorbed on plastic surfaces could be accumulated by organisms (Andrady, 2011). In addition, the smaller MPs might translocate in the body tissues, and the smallest ones (<1.5 mm) are more likely to translocate into sensitive organs and cause harm (Browne et al., 2008; Waller at al., 2017).
There has been evidence of plastic pollution in the ecosystem for almost 50 years. Currently, reports of this contaminant have come from almost everywhere—even from the human placenta (Dekiff et al., 2014; Fok and Cheng, 2015; Wu et al., 2019; Radisic et al., 2020; Hengstmann et al., 2021; Muhammad et al., 2021; Sendra et al., 2021; Squadrone et al., 2021; Yang et al., 2021; Yin et al., 2021; Zhang et al., 2021). However, the first report by Kosuth et al. (2018) revealed the presence of MPs in potable water only 5 years ago. They examined 159 tap water samples from 15 different nations and found high levels of MPs (an average of 5.45 particles/L) in the potable water. Due to the widespread notice this report received, other nations’ research into the presence, distribution, and removal of MPs in drinking water has continued to advance (Oßmann et al., 2018; Pivokonsky et al., 2018; Mintenig et al., 2019). These studies indicated that the bottled water contamination by MPs was caused by packaging materials. There is proof from some other research that drinking water from reusable plastic bottles has the highest particle counts on average. They tested the water from glass bottles, single-use plastic bottles, re-usable plastic bottles, and beverage cartons, among other kinds of packaging. Additionally, it was discovered that, in addition to the packaging substance itself, the MPs load may also be influenced by carbonation and bottle age. In reusable bottles, presence of the additive Tris phosphite may be a sign of leakage from the container. According to some other studies, cleaning reusable bottles may be a significant entrance point for MP particles as well as other equipment like bottle fillers. Because transport pipes are frequently made of PE with PA fittings, PEST and PVC in water bottles also suggests that these polymers are the result of the abrasion of plastic materials used in the purification and supply of drinking water (Medrano et al., 2019; Mintenig et al., 2019).
The presence of MPs in bottled mineral and other drinking waters has been the subject of several studies in different parts of the world considering its human health risk (Pivokonsky et al., 2018; Uhl et al., 2018; Koelmans et al., 2019; Mintenig et al., 2019; Danopoulos et al., 2020). Recent studies revealed that the number of MPs inhaled and ingested by the human body through the food chain was 12,100 to 74,000 items per year (Cox et al., 2019). Again, the existence of MPs in the human blood and lung tissues (Jenner et al., 2022; Leslie et al., 2022), signifies the vulnerability of humans to MPs. However, there are no reports of MPs in drinking water in Bangladesh despite plastic being one of the essential industrial components that significantly contribute to the economy of the country (BIDA, 2021). Every year, this country produces millions of tons of plastics for the packaging industry, household goods, pharmaceutical industry, garments bags and accessories, toys, sanitary items, and construction products, including PVC pipes (BIDA, 2021). Only a small percentage of them are recycled (Islam, 2011). Almost all mineral water companies sell their products in plastic bottles in Bangladesh. Therefore, there is a high possibility of the existence of MPs in those bottles of mineral water. Understanding the effects of MPs on human health requires research on their types, quantities, and the possible toxicity of bottled water. Researching MPs in bottled drinking water helps us to better understand the threats to consumer safety and awareness, address environmental issues, develop regulatory standards, encourage sustainable packaging options, and contribute to the security of the world’s water supply. Considering the knowledge gap stated above and the importance of the topic, this study aimed to (i) quantify the abundance of MPs, (ii) characterize the morphotypes and polymeric composition of MPs in bottled mineral water from Bangladesh, and (iii) estimate the dietary intake of MPs through drinking mineral water. This is the first study of its kind from Bangladesh that can contribute to ensuring the safety and purity of bottled water, protecting public health, and enhancing consumer confidence.
2 Materials and methods
2.1 Sample collection and preparation
A total of 50 samples covering 10 different brands (five samples per brand) of 500 mL bottled mineral waters were collected from the market. All brands packaged their products in recyclable PETE plastic bottles. All of the samples were taken to the laboratory for further examination after collection. In the laboratory, the collected water was filtered through a 5-micron cellulose nitrate membrane filter. Then the samples were transferred to a glass dish and kept until microscopic analysis.
2.2 Identification of MPs
For the quantification and identification of MPs, the filter paper was checked through a stereomicroscope (Leica EZ4E, Germany) with 8x to ×35 magnification. At first, the filter paper was divided into four segments by pointing on top and counting each segment one after the other. A high-resolution camera attached to a microscope was used to capture the image of the MPs. The dimensions of MPs were measured through ImageJ software (ver. 2.0.0). In case of suspicious plastic particles, a hot needle test was conducted. The visual characteristics of MPs were classified into various types and shapes, colors, and sizes. From a representative number of particles, the polymer type was identified by using Fourier Transformed Infrared (FT-IR) spectroscopy (IR Prestidge-21). The MPs were combined with the KBr crystal to create a KBr plate. The KBr plate was examined in the FT-IR machine. The measurement was done in wavenumber 400–4,000 cm−1 transmission mode (Tanaka and Takada, 2016). The statistical software, Origin Pro 2021 was used to perform further analyses of FT-IR polymer spectra. Based on the spectral search, search by band locations, and visual match, the spectra were interpreted. Only polymers with reference spectra matching for more than 80% were approved.
2.3 Contamination control
Blank experiments were done with a similar arrangement, and no plastics were found in the blank sample. For the blank sample, filtered deionized water were kept open in beaker while filtering bottled water samples and filtered again after completing the filtration process of the samples. Before usage, every piece of glassware was thoroughly washed with ultrapure water. During the measurements, any type of plastic equipment was avoided as much as possible. A cotton lab coat and non-plastic gloves and masks were used by the operator to avoid self-contamination. All the equipment and the laboratory surface were wiped with 30% ethanol before conducting experiments.
2.4 Dietary intake (DI) of MPs
The dietary intake of MPs of water was calculated using the following equation (Almaiman et al., 2021):
where C is the recommended consumption of water/person/day, M is the average MPs particles/L, and BW is the average body weight for an adult. The World Health Organization’s recommended daily water intake (4.5 L/day) for an adult was used to calculate the per capita exposure estimation (Grandjean, 2004) because reliable data on drinking water consumption in Bangladesh were lacking. The average weight of adult men/women in Bangladesh is 60 kg (Ullah et al., 2017).
2.5 Statistical analysis
After microscopic analysis, the abundance of MPs was calculated as items/L. As each brand contained five replicates in our experiments, the abundance of MPs was expressed as mean ± SD. The statistical analyses (ANOVA) were conducted through PAST (version 3); a probability level of less than 0.05 was considered as significant. FT-IR data were analyzed in OriginPro 2021.
3 Results and discussion
3.1 Occurrence and abundance of MPs in bottled mineral water
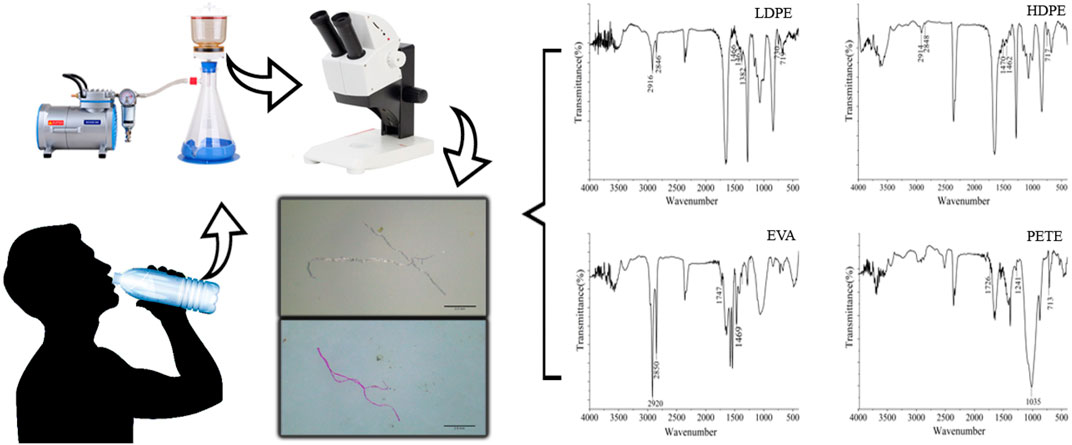
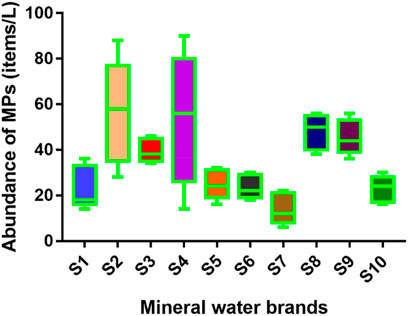
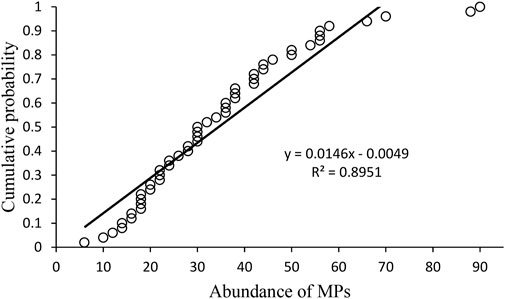
MPs were found in all 50 samples from 10 brands of mineral water and some typical microscopic images are shown in Figure 1. Quantification analyses showed that the highest number of MPs were found in brand 2 (56 ± 23 items/L), whereas the lowest was recorded in brand 7 (14 ± 7 items/L) (Figure 2). The average number of MPs was (35 ± 19 items/L) in all the mineral water brands, and there was a significant difference (p < 0.05) in the mean abundance of MPs in different mineral water brands. Figure 3 represents the cumulative probability distribution and MP concentration in bottled drinking water. This statistical illustration of the distribution of MPs within a particular set of samples provides information on the range of concentrations and the propensity to locate MPs at various levels. The plot determined the cumulative likelihood of locating a concentration within the dataset that was equal to or lowers than that value. The model exhibits high accuracy, as indicated by the high-R2 value of 0.8951. This value also signifies that the cumulative probability distribution model effectively explains that the variation observed in microplastic concentration in bottled drinking water was approximately 89.51%. The 5% and 95% values from the distributions were found to be 30 and 70 items/L, respectively.
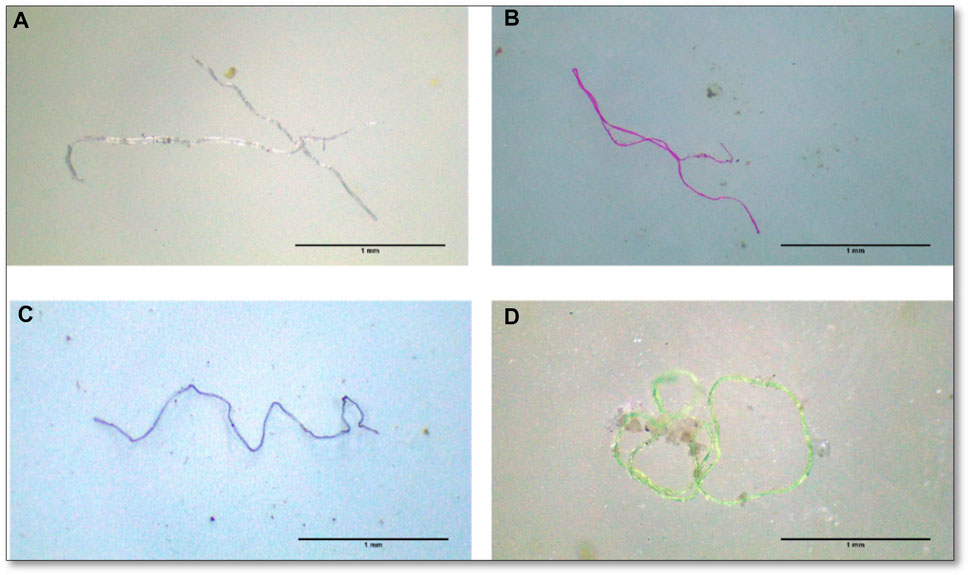
FIGURE 1. Microscopic images of MPs found in bottled mineral water: (A) transparent fiber; (B) pink fiber; (C) violet fiber; (D) green fiber (scale bar = 1 mm).
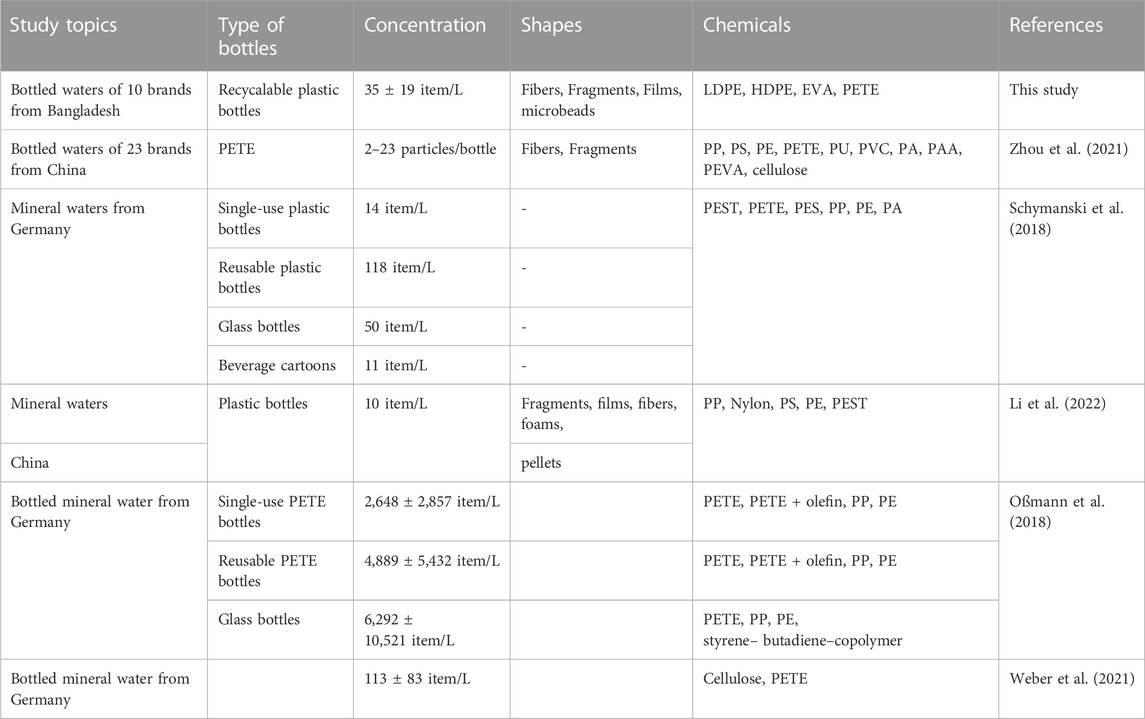
The above finding indicates the presence of MPs in the drinking water supply of Bangladesh. It is important to compare this result with other findings to gain a broader understanding of the issue. However, the research into MP contamination in drinking water is still developing. Only a few research studies have looked at the presence of MPs in bottled mineral water worldwide (Table 1). The concentration of MPs in our study was higher than in China and Saudi Arabia but lower than in Germany (Almaiman et al., 2021; Zhou et al., 2021; Li et al., 2022). One of the main reasons for the lower abundance of MPs in this study was possibly due to the detection method used. In the cellular filter method, we could not estimate the MPs <5 micron. Zhou et al. (2021) examined the presence of MPs in three brands of bottled water in China and found that the abundance of MPs varied from 2 particles/bottle to 23 particles/bottle (Table 1).
Mason et al. (2018) reported that 93% of samples from 259 water bottles included MPs, with an average of 10.4 particles/L. They also explained that, at least partially the origin of MPs was their packageing and/or bottling itself. Oßmann et al. (2018) reported that the number of particles was 2,649 ± 2,857 per liter in the single-use PETE bottles, whereas in the glass bottles 6,292 ± 10,521 plastics/L were present from Germany. While PETE was predominant in the plastic bottles, various polymers, including polyethylene or styrene-butadiene-copolymer, were reported in the glass bottles, which signifies that other contamination sources along with the packaging itself should be considered. Similarly, Schymanski et al. (2018) reported 118 ± 88 particles/L in returnable plastic bottles, whereas there werer only 14 ± 14 particles/L in single-use bottles. In addition, they noted that glass-bottled water included a significant concentration of plastic particles (50 ± 52 particles/L), compared to only 11 ± 8 particles/L in beverage cartons. Packaging itself may release MPs into the water (Schymanski et al., 2018). The variation of MP concentration varied significantly between studies due to different detection methods and regions. Drivers such as industrial activities, population density, urbanization, and waste management practices can contribute to the presence of microplastics in water sources. For example, water sources already contaminated with MPs due to pollution from various human activities can find their way into bottled drinking water during the bottling process. During the handling processes, MP particles can be released from caps. In addition, most of the studies, including this one, reported fibers were dominant in bottled drinking water. These fibers could originate from sources of water and could not be easily removed during the treatment process as they withstand physical and chemical stresses, including UV radiation and water treatment disinfectants, leading to their persistence in water sources and their subsequent presence in mineral water (Li et al., 2022). Each form of plastic has a distinct chemical structure and molecular set up that influence its physical characteristics. Polyethylene terephthalate (PET), high-density polyethylene (HDPE), polypropylene (PP), and other plastic polymers are frequently used to make plastic bottles (Uhl et al., 2018). The features and functionality of plastic bottles might vary depending on the type of polymer used to make them. Due to its great strength and rigidity, polyethylene terephthalate (PET), for instance, is frequently used for carbonated beverage bottles. PET is renowned for its remarkable transparency, which enables customers to plainly view the contents of the bottle (Zhang et al., 2021). On the other hand, HDPE and PP can be utilized for bottles when product visibility is not necessary because they are often more opaque. Because of its exceptional impact resistance, high-density polyethylene (HDPE) is a good choice for bottles that might experience rough handling or transportation. Due to their less effective gas barriers, polyethylene (PE) and polypropylene (PP) are frequently utilized for non-carbonated beverage bottles. As a result, producers take into account these elements when deciding which type of polymer is best for a given application to make sure the bottles fulfill the required performance standards and legal criteria (Zhu et al., 2021).
3.2 Size of MPs
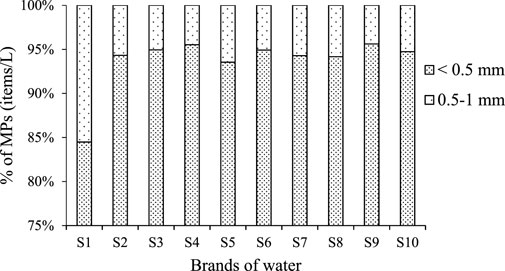
MPs recovered from the mineral water were classified into two size categories: <0.5 mm and 0.5–1 mm. No MPs were detected to be larger than 1 mm in size. Overall, around 94% of the particles were <0.5 mm in size, whereas the remaining 6% was in 0.5–1 mm size range (Figure 4). However, there are limitations of available methods to determine the nano-sized particles from water (Koelmans et al., 2015; Pivokonsky et al., 2018). To cope with this limitation, Schymanski et al. (2018) used micro-Raman spectroscopy with a ×10, ×20, and ×50 magnification for detecting smaller sized plastics. They catagorized five size ranges: 5–10 mm, 10–20 mm, 20–50 mm, 50–100 mm, and >100 mm. They found that around 80% of the plastics particles in the bottled mineral water were between 5 and 10 μm in size. In contrast, we have used a steriomicroscope with ×8 to ×35 magnification, and size ranges were <0.5 mm and 0.5–1 mm. Oßmann et al. (2018) reported that over 90% of MPs were below 5 μm in the mineral water. Similarly, in the bottled mineral water, around 95% of MPs were between 6.5 and 100 µm in size recorded by Mason et al. (2018). Previous studies reported that the size distribution of MPs inclines towards smaller sizes, probably due to the degradation of larger plastic debris (Zhao et al., 2014; Zhang et al., 2015).
3.3 Shapes of MPs
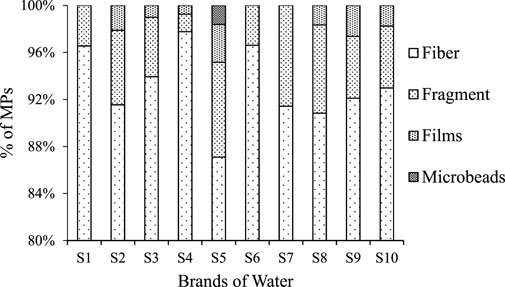
Based on shape, four groups were detected (fibers, fragments, films, and microbeads) (Figure 5). Most of the detected MPs were fibers followed by films and fragments. Among the MPs, around 90% of particles were fibers, 7% were fragments, and the remaining 3% were films and microbeads. The maximum numbers of fibers were collected from Brand 4, which comprised 53 ± 29 items/L of fibers (∼98%). In terms of fragments, brand 8 comprised the maximum number 3.6 ± 3.3 items/L, which covers 4.36% of the total MPs recovered from that brand’s water. Similarly to our findings, Zhou et al. (2021) identified two categories of MPs (fibers and fragments), and fibers were found to be dominant in almost all brand waters. In contrast to our study, Mason et al. (2018) reported five morphotypes of MPs: fragment, fiber, pellet, film, or foam. They reported that fragments were found to be the most common type of particles (66%), followed by fibers (13%) and films (12%). A similar trend of morphotype distribution was observed by Pivokonsky et al. (2018) in the treated tap water samples, where the fragments were the most abundant morphotype as well. They reported that plastic fibers in water would often come from washing machines, whereas plastic fragments in water would come from the breakdown of various plastic items. However, we hypothesize that the fibers in the bottled water may be derived from the raw water sources (Zhou et al., 2021). As all the mineral water brands established in the capital city Dhaka, which is the hub of hundreds of textile garments, that may cause the input of substantial amount of fibers in the raw water.
3.4 Color of MPs
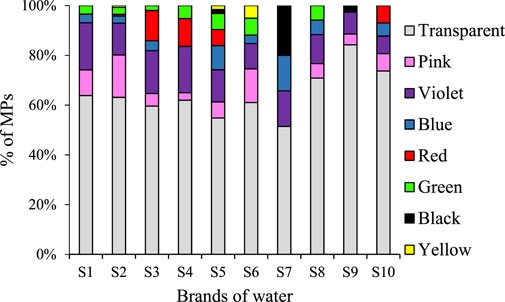
A total of eight colors of MPs were found throughout the study: red, blue, yellow, violet, green, pink, black, and transparent (Figure 6). The transparent MPs were highest in number among all the brands, comprising around 66% of the total MPs. In terms of MPs colors, the following sequence was maintained in all the mineral water samples: transparent (65.87%) > violet (13.42%) > pink (7.67%) > red (4.09%) > blue (3.75%) > green (3.43%) > black (1.25%) > yellow (0.5%). Due to the bleaching process while treating the waters, MPs lost their color, which made them transparent. However, in previous studies related to mineral water, the color of MPs was not mentioned and could therefore not be compared to our findings.
3.5 Polymer characterization
A representative number of particles was taken for FT-IR analysis. Among them, four types of polymers (PETE, HDPE, LDPE, and EVA) were identified. Some of them remain unidentified. PETE (25%) and HDPE (25%) were the dominant types of polymer. The distribution pattern of polymer type was as follows PETE (25%), HDPE (25%), LDPE (18.75%), EVA (18.75%), and Unidentified (12.5%) (Figure 7). The IR spectrum of the LDPE and HDPE samples revealed strong peaks at 2,916 cm−1, 2,846 cm−1, and 2,914 cm−1, 2,848 cm−1, respectively, showing a C-H stretch. CH2 bend was identified by transmittance at wavelengths of 1,466 cm−1, 1,462 cm−1 in LDPE, and 1,470 cm−1, 1,462 in HDPE. In LDPE, the peak wavelength at 1,382 cm−1 represents the CH3 bend, whereas 730 cm−1, 719 cm−1 in LPDE, and 717 cm−1 in HDPE represent the CH2 rock (Jung et al., 2021). The strong peaks at 2,920 cm−1 and 2,850 cm−1 show C-H bond stretching vibrations, whereas the peak at 1,747 cm−1 specifies C=O stretch, and 1,769 cm−1 depicts CH2/CH3 stretch in the EVA particle sample. Peaks at 1,726 cm−1 indicate C=O stretching, 1,241 cm−1, 1,035 cm−1 indicate C-O stretching, and a wavelength of 713 cm−1 represents aromatic C-H bond stretching in PETE. However, due to ageing and MPs degradation, certain similar peaks of HDPE and EVA polymer samples were missing from the IR spectrum (Sathish et al., 2019; Banik et al., 2022).
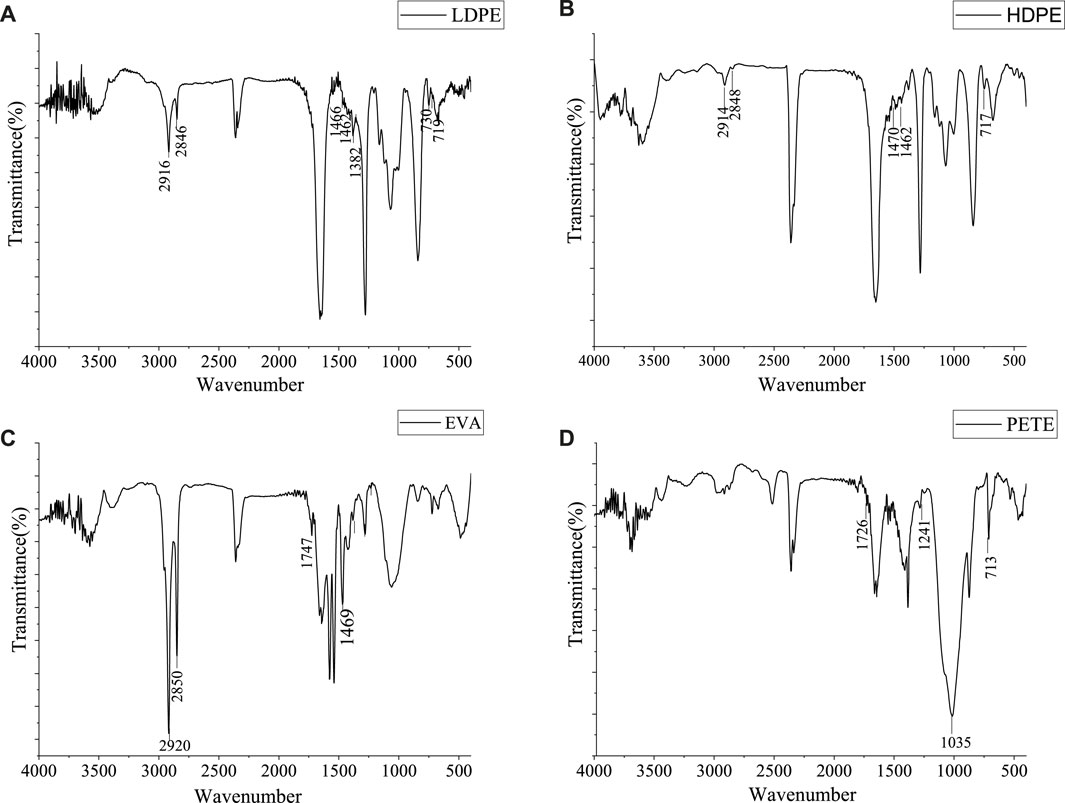
FIGURE 7. Fourier transform infrared (FTIR) spectra of the MPs in bottled drinking water. Letters (A-C and D) denotes different types of polymers.
PE, PETE, PP, PS, and PVC were the most frequently identified polymers in freshwater and bottled water (Oßmann et al., 2018; Schymanski et al., 2018; Koelmans et al., 2019; Danopoulos et al., 2020; Kankanige & Babel, 2020), which strongly supports our findings. According to previous research, the most popular plastics used in packaging are PE, PP, PVC, PETE, and PS (Geyer et al., 2017). The global plastic demand can influence the occurrence of these mostly abundant polymers (Andrady, 2011; Bond et al., 2018). Furthermore, the density of PE and PP is less than 1 g/cm3, making these polymers buoyant. PVC and PETE, on the other hand, have higher densities (1.3–1.7 g/cm3), making them more susceptible to sedimentation (Koelmans et al., 2019). As a result, the density of plastic polymers could be another factor explaining the high frequency of PE and PETE in the drinking water samples examined in this investigation.
3.6 Dietary intake of MPs
Dietary intake measurements are used to evaluate a population’s or an individual’s drink intake. In order to determine exposure to MPs contaminants to human health and to help design nutritional guidelines for public health policy, we assessed the food intake of MPs per person per day in this study. Using the mean value of MPs (35 particles/L) in water and the average recommended consumption of water (4.5 L/day as suggested by WHO) for an adult (60 kg), the per capita daily dietary intake of MPs was found to be 2.63 particles/person/day. These figures represent a yearly MP intake of 960 particles/person.
4 Conclusion
Bangladesh has an extensive domestic and export market of plastic goods. Hence, there is high possibility of the intrusion of MPs in different types of beverages through their raw materials and packaging. Therefore, the availability, composition and dietary intake of MPs in the sample of bottled drinking water of Bangladesh were studied for the first time. All the water brands contained MPs with an average 35 ± 19 particles/L. Four morphotypes of MPs were found, and fibers comprised around 90% of the total abundance, which indicated contamination through natural and synthetic fibers. Transparent MPs were high in number, which might be due to the bleaching process in water. Among the identified polymers, LDPE and HDPE were dominant. The estimated annual dietary intake of 960 particles per person solely from drinking water conveys possible health hazards to humans. The occurrence of these particles in drinking water raises issues regarding the safety and quality of the water supply and may have negative effects on human health. Further study of the risk assessment of MPs can help us understand the impacts of MPs in drinking water on human health. The production and packaging of bottled drinking water should be closely monitored by the administrative department and policymakers since it could pose serious health risks to people.
Data availability statement
The original contributions presented in the study are included in the article/supplementary material, further inquiries can be directed to the corresponding author.
Author contributions
Conceptualization, MH; methodology, PB, A-AN, MH, and MR; software, A-AN and MH; validation, PB, MH, and MR; formal analysis, PB and A-AN; investigation, PB; resources, MH; data curation, PB and A-AN.; writing—original draft preparation, MN and A-AN; writing—review and editing, MH and MR; JY, TA; visualization, MA; supervision, MH; project administration, MH; funding acquisition, MH, MA, and TA. All authors contributed to the article and approved the submitted version.
Funding
This research was funded by the Researchers Supporting Project Number (RSP2023R436), King Saud University, Riyadh, Saudi Arabia. It was also partly funded by Universiti Brunei Darussalam under the FOS Allied Fund (UBD/RSCH/1.4/FICBF(a)/2023).
Acknowledgments
We would especially want to thank the volunteers who assisted us with the lab analyses. For the FTIR analysis, we thank Jahangirnagar University’s Wazed Miah Science Research Center in Bangladesh. The Researchers Supporting Project number (RSP 2023R436), King Saud University, Riyadh, Saudi Arabia is gratefully acknowledged by the authors.
Conflict of interest
The authors declare that the research was conducted in the absence of any commercial or financial relationships that could be construed as a potential conflict of interest.
Publisher’s note
All claims expressed in this article are solely those of the authors and do not necessarily represent those of their affiliated organizations, or those of the publisher, the editors and the reviewers. Any product that may be evaluated in this article, or claim that may be made by its manufacturer, is not guaranteed or endorsed by the publisher.
References
Almaiman, L., Aljomah, A., Bineid, M., Aljeldah, F. M., Aldawsari, F., Liebmann, B., et al. (2021). The occurrence and dietary intake related to the presence of microplastics in drinking water in Saudi Arabia. Env. Mon. Ass. 193 (7), 390–413. doi:10.1007/s10661-021-09132-9
Anderson, P. J., Warrack, S., Langen, V., Challis, J. K., Hanson, M. L., and Rennie, M. D. (2017). Microplastic contamination in lake Winnipeg, Canada. Environ. Pollut. 225, 223–231. doi:10.1016/j.envpol.2017.02.072
Andrady, A. L. (2011). Microplastics in the marine environment. Mar. Pollut. Bull. 62, 1596–1605. doi:10.1016/j.marpolbul.2011.05.030
Banik, P., Hossain, M. B., Nur, A. A. U., Choudhury, T. R., Liba, S. I., Yu, J., et al. (2022). Microplastics in sediment of Kuakata Beach, Bangladesh: Occurrence, spatial distribution, and risk assessment. Front. Mar. Sci. 9, 860989. doi:10.3389/fmars.2022.860989
BIDA (Bangladesh Investment Development Authority) (2021). Plastic snapshot. Avaliable At: https://bida.gov.bd/plastic#:∼:text=Plastic%20is%20one%20of%20the,well%20as%20the%20export%20market.
Bond, T., Ferrandiz-Mas, V., Felipe-Sotelo, M., and van Sebille, E. (2018). The occurrence and degradation of aquatic plastic litter based on polymer physicochemical properties: A review. Crit. Rev. Environ. Sci. Technol. 1-38, 685–722. doi:10.1080/10643389.2018.1483155
Browne, M. A., Dissanayake, A., Galloway, T. S., Lowe, D. M., and Thompson, R. C. (2008). Ingested microscopic plastic translocates to the circulatory system of the mussel, Mytilus edulis (L). Environ.l Sci. Technol. 42, 5026–5031. doi:10.1021/es800249a
Browne, M. A., Niven, S. J., Galloway, T. S., Rowland, S. J., and Thompson, R. C. (2013). Microplastic moves pollutants and additives to worms, reducing functions linked to health and biodiversity. Curr. Biol. 23, 2388–2392. doi:10.1016/j.cub.2013.10.012
Carpenter, E. J., and Smith, J. K. (1972). Plastics on the sargasso sea surface. Science 175, 1240–1241. doi:10.1126/science.175.4027.1240
Cox, K. D., Covernton, G. A., Davies, H. L., Dower, J. F., Juanes, F., and Dudas, S. E. (2019). Human consumption of microplastics. Environ. Sci. Technol. 53, 7068–7074. doi:10.1021/acs.est.9b01517
da Costa, J. P., Santos, P. S., Duarte, A. C., and Rocha-Santos, T. (2016). Nano) plastics in the environment–sources, fates and effects. Sci. Total Environ. 566, 15–26. doi:10.1016/j.scitotenv.2016.05.041
Danopoulos, E., Twiddy, M., and Rotchell, J. M. (2020). Microplastic contamination of drinking water: A systematic review. PloS one 15 (7), 0236838. doi:10.1371/journal.pone.0236838
Dekiff, J. H., Remy, D., Klasmeier, J., and Fries, E. (2014). Occurrence and spatial distribution of microplastics in sediments from Norderney. Environ. Pollut. 186, 248–256. doi:10.1016/j.envpol.2013.11.019
Di, M., and Wang, J. (2018). Microplastics in surface waters and sediments of the three gorges reservoir, China. Sci. Total Environ. 616, 1620–1627. doi:10.1016/j.scitotenv.2017.10.150
Eriksen, M., Mason, S., Wilson, S., Box, C., Zellers, A., Edwards, W., et al. (2013). Microplastic pollution in the surface waters of the laurentian great lakes. Mar. Pollut. Bull. 77, 177–182. doi:10.1016/j.marpolbul.2013.10.007
Fok, L., and Cheung, P. K. (2015). Hong Kong at the pearl river estuary: A hotspot of microplastic pollution. Mar. Pollut. Bull. 99, 112–118. doi:10.1016/j.marpolbul.2015.07.050
Geyer, R., Jambeck, J. R., and Law, K. L. (2017). Production, use, and fate of all plastics ever made. Sci. Adv. 3 (7), 1700782. doi:10.1126/sciadv.1700782
Grandjean, A. C. (2004). Water requirements, impinging factors and recommended intakes. Working Paper 25–40.
Hengstmann, E., Weil, E., Wallbott, P. C., Tamminga, M., and Fischer, E. K. (2021). Microplastics in lakeshore and lakebed sediments - external influences and temporal and spatial variabilities of concentrations. Environ. Res. 197, 111141. doi:10.1016/j.envres.2021.111141
Horton, A. A., Walton, A., Spurgeon, D. J., Lahive, E., and Svendsen, C. (2017). Microplastics in freshwater and terrestrial environments: Evaluating the current understanding to identify the knowledge gaps and future research priorities. Sci. Total Environ. 586, 127–141. doi:10.1016/j.scitotenv.2017.01.190
Hui, J., Long, Y. Y., Li, Z. Y., Pan, Y., and Chen, L. Q. (2021). Effects of microplastics pollution on plankton: A review. J. Appl. Ecol. 32, 2633–2643. doi:10.13287/j.1001-9332.202107.040
Islam, M. S. (2011). Prospects and challenges of plastic industries in Bangladesh. J. Chem. Engi. 26, 16–21. doi:10.3329/jce.v26i1.10176
Jenner, L. C., Rotchell, J. M., Bennett, R. T., Cowen, M., Tentzeris, V., and Sadofsky, L. R. (2022). Detection of microplastics in human lung tissue using μFTIR spectroscopy. Sci. Total Environ. 831, 154907. doi:10.1016/j.scitotenv.2022.154907
Jung, J. W., Park, J. W., Eo, S., Choi, J., Song, Y. K., Cho, Y., et al. (2021). Ecological risk assessment of microplastics in coastal, shelf, and deep sea waters with a consideration of environmentally relevant size and shape. Environ. Pollut. 270, 116217. doi:10.1016/j.envpol.2020.116217
Kankanige, D., and Babel, S. (2020). Smaller-sized micro-plastics (MPs) contamination in single-use PET-bottled water in Thailand. Sci. Total Environ. 717, 137232. doi:10.1016/j.scitotenv.2020.137232
Karami, A., Golieskardi, A., Keong Choo, C., Larat, V., Galloway, T. S., and Salamatinia, B. (2017). The presence of microplastics in commercial salts from different countries. Sci. Rep. 7, 46173. doi:10.1038/srep46173
Koelmans, A. A., Besseling, E., and Shim, W. J. (2015). Nanoplastics in the aquatic environment Critical review. Cham, Springer: Mar. Anthrop. Litter, 325–340.
Koelmans, A. A., Nor, N. H. M., Hermsen, E., Kooi, M., Mintenig, S. M., and De France, J. (2019). Microplastics in freshwaters and drinking water: Critical review and assessment of data quality. Water Res. 155, 410–422. doi:10.1016/j.watres.2019.02.054
Kosuth, M., Mason, S. A., and Wattenberg, E. V. (2018). Anthropogenic contamination of tap water, beer, and sea salt. PloS one 13 (4), 0194970. doi:10.1371/journal.pone.0194970
Leslie, H. A., Van Velzen, M. J., Brandsma, S. H., Vethaak, D., Garcia-Vallejo, J. J., and Lamoree, M. H. (2022). Discovery and quantification of plastic particle pollution in human blood. Environ. Int. 163, 107199. doi:10.1016/j.envint.2022.107199
Li, Y., Peng, L., Fu, J., Dai, X., and Wang, G. (2022). A microscopic survey on microplastics in beverages: The case of beer, mineral water and tea. Analyst 147 (6), 1099–1105. doi:10.1039/d2an00083k
Lusher, A., Hollman, P., and Mendoza-Hill, J. (2017). Microplastics in fisheries and aquaculture: Status of knowledge on their occurrence and implications for aquatic organisms and food safety. Rome, Italy: FAO Fisheries and Aquaculture, 147.
Mason, S. A., Garneau, D., Sutton, R., Chu, Y., Ehmann, K., Barnes, J., et al. (2016). Microplastic pollution is widely detected in US municipal wastewater treatment plant effluent. Environ. Pollut. 218, 1045–1054. doi:10.1016/j.envpol.2016.08.056
Mason, S. A., Welch, V. G., and Neratko, J. (2018). Synthetic polymer contamination in bottled water. Front. Chem. 407, 407. doi:10.3389/fchem.2018.00407
Medrano, D., Leslie, H. A., and Quinn, B. (2019). Microplastics in drinking water: A review and assessment. Current Opinion in Environmental Science and Health 7, 69–75.
Mintenig, S., Löder, M., Primpke, S., Gerdts, G., Löder, M., and Gerdts, G. (2019). Low numbers of microplastics detected in drinking water from ground water sources. Sci. Total Environ. 648, 631–635. doi:10.1016/j.scitotenv.2018.08.178
Mintenig, S. M., Int-Veen, I., Löder, M. G., Primpke, S., and Gerdts, G. (2017). Identification of microplastic in effluents of waste water treatment plants using focal plane array-based micro-Fourier-transform infrared imaging. Water Res. 108, 365–372. doi:10.1016/j.watres.2016.11.015
Muhammad, A., Zhou, X., He, J., Zhang, N., Shen, X., Sun, C., et al. (2021). Toxic effects of acute exposure to polystyrene microplastics and nanoplastics on the model insect, silkworm Bombyx mori. Environ. Pollut. 285, 117255. doi:10.1016/j.envpol.2021.117255
Noman, M. A., Feng, W., Zhu, G., Hossain, M., Chen, Y., Zhang, H., et al. (2022). Bioaccumulation and potential human health risks of metals in commercially important fishes and shellfishes from Hangzhou Bay, China. Sci. Rep. 12, 4634. doi:10.1038/s41598-022-08471-y
Noman, M. A., Sun, J., and Hossain, M. B. (2021). COVID-19 generated personal protective equipment: Sources of microplastics and pathogen vectors in marine environments? Front. Mar. Sci. 8, 798047. doi:10.3389/fmars.2021.798047
Nur, A. A. U., Hossain, M. B., Banik, P., Choudhury, T. R., Liba, S. I., Umamaheswari, S., et al. (2022). Microplastic contamination in processed and unprocessed sea salts from a developing country and potential risk assessment. Chemosphere 308, 136395. doi:10.1016/j.chemosphere.2022.136395
Oßmann, B. E., Sarau, G., Holtmannspötter, H., Pischetsrieder, M., Christiansen, S. H., and Dicke, W. (2018). Small-sized microplastics and pigmented particles in bottled mineral water. Water Res. 141, 307–316. doi:10.1016/j.watres.2018.05.027
PEMRG (Plastics Europe Market Research Group) (2021). Plastics–the Facts 2020: An analysis of European plastics production, demand and recovery for 2020. Brussels: Plastic Europe Association of Plastic Manufacturers. Avaliable At: www.plasticeurope.org.
Pivokonsky, M., Cermakova, L., Novotna, K., Peer, P., Cajthaml, T., and Janda, V. (2018). Occurrence of microplastics in raw and treated drinking water. Sci. Total Environ. 643, 1644–1651. doi:10.1016/j.scitotenv.2018.08.102
Radisic, V., Nimje, P. S., Bienfait, A. M., and Marathe, N. P. (2020). Marine plastics from Norwegian west coast carry potentially virulent fish pathogens and opportunistic human pathogens harboring new variants of antibiotic resistance genes. Microorganisms 8, 1200. doi:10.3390/microorganisms8081200
Sathish, N., Jeyasanta, K. I., and Patterson, J. (2019). Abundance, characteristics and surface degradation features of microplastics in beach sediments of five coastal areas in Tamil Nadu, India. Mar. Pollut. Bull. 142, 112–118. doi:10.1016/j.marpolbul.2019.03.037
Schymanski, D., Goldbeck, C., Humpf, H. U., and Fürst, P. (2018). Analysis of microplastics in water by micro-Raman spectroscopy: Release of plastic particles from different packaging into mineral water. Water Res. 129, 154–162. doi:10.1016/j.watres.2017.11.011
Sendra, M., Pereiro, P., Yeste, M. P., Mercado, L., Figueras, A., and Novoa, B. (2021). Size matters: Zebrafish (Danio rerio) as a model to study toxicity of nanoplastics from cells to the whole organism. Environ. Pollut. 268, 115769. doi:10.1016/j.envpol.2020.115769
Smith, M., Love, D. C., Rochman, C. M., and Neff, R. A. (2018). Microplastics in seafood and the implications for human health. Curr. Environ. health Rep. 5, 375–386. doi:10.1007/s40572-018-0206-z
Squadrone, S., Pederiva, S., Bezzo, T., Sartor, R. M., Battuello, M., Nurra, N., et al. (2021). Microplastics as vectors of metals contamination in Mediterranean Sea. Environ. Sci. Pollut. Res. Int. 29 (20), 29529–29534. doi:10.1007/s11356-021-13662-7
Tanaka, K., and Takada, H. (2016). Microplastic fragments and microbeads in digestive tracts of planktivorous fish from urban coastal waters. Scientific reports 61 (1), 34351.
Thompson, R. C., Olsen, Y., Mitchell, R. P., Davis, A., Rowland, S. J., John, A. W., et al. (2004). Lost at sea: Where is all the plastic? Science 304, 838. doi:10.1126/science.1094559
Uhl, W., Eftekhardadkhah, M., and Svendsen, C. (2018). Mapping microplastic in Norwegian drinking water. Atlantic 185, 491–497. https://319738-www.web.tornado-node.net/wp-content/uploads/MP_in_DW_-_excecutive_summary.pdf
Ullah, A. A., Maksud, M. A., Khan, S. R., Lutfa, L. N., and Quraishi, S. B. (2017). Dietary intake of heavy metals from eight highly consumed species of cultured fish and possible human health risk implications in Bangladesh. Toxicol. Rep. 4, 574–579. doi:10.1016/j.toxrep.2017.10.002
Virsek, M. K., Lovsin, M. N., Koren, S., Krzan, A., and Peterlin, M. (2017). Microplastics as a vector for the transport of the bacterial fish pathogen species Aeromonas salmonicida. Mar. Pollut. Bull. 125, 301–309. doi:10.1016/j.marpolbul.2017.08.024
Waller, C. L., Griffiths, H. J., Waluda, C. M., Thorpe, S. E., Loaiza, I., Moreno, B., et al. (2017). Microplastics in the antarctic marine system: An emerging area of research. Sci. Total Environ. 598, 220–227. doi:10.1016/j.scitotenv.2017.03.283
Wang, Q., Zhu, X., Hou, C., Wu, Y., Teng, J., Zhang, C., et al. (2021). Microplastic uptake in commercial fishes from the Bohai Sea, China. Chemosphere 263, 127962. doi:10.1016/j.chemosphere.2020.127962
Weber, F., Kerpen, J., Wolff, S., Langer, R., and Eschweiler, V. (2021). Investigation of microplastics contamination in drinking water of a German city. Science of the Total Environment 755, 143421.
Wright, S. L., Thompson, R. C., and Galloway, T. S. (2013). The physical impacts of microplastics on marine organisms: A review. Environ. Pollut. 178, 483–492. doi:10.1016/j.envpol.2013.02.031
Wu, X., Pan, J., Li, M., Li, Y., Bartlam, M., and Wang, Y. (2019). Selective enrichment of bacterial pathogens by microplastic biofilm. Water Res. 165, 114979. doi:10.1016/j.watres.2019.114979
Yang, L., Zhang, Y., Kang, S., Wang, Z., and Wu, C. (2021). Microplastics in freshwater sediment: A review on methods, occurrence, and sources. Sci. Total Environ. 754, 141948. doi:10.1016/j.scitotenv.2020.141948
Yin, L., Wen, X., Huang, D., Zeng, G., Deng, R., Liu, R., et al. (2021). Microplastics retention by reeds in freshwater environment. Sci. Total Environ. 790, 148200. doi:10.1016/j.scitotenv.2021.148200
Zhang, J., Wang, L., and Kannan, K. (2021). Quantitative analysis of polyethylene terephthalate and polycarbonate microplastics in sediment collected from South Korea, Japan and the USA. Chemosphere 279, 130551. doi:10.1016/j.chemosphere.2021.130551
Zhang, K., Gong, W., Lv, J., Xiong, X., and Wu, C. (2015). Accumulation of floating microplastics behind the three gorges dam. Environ. Pollut. 204, 117–123. doi:10.1016/j.envpol.2015.04.023
Zhang, L., Xie, Y., Zhong, S., Liu, J., Qin, Y., and Gao, P. (2020). Microplastics in freshwater and wild fishes from lijiang river in guangxi, southwest China. Sci. Total Environ. 755, 142428. doi:10.1016/j.scitotenv.2020.142428
Zhao, S., Zhu, L., Wang, T., and Li, D. (2014). Suspended microplastics in the surface water of the yangtze estuary system, China: First observations on occurrence, distribution. Mar. Pollut. Bull. 86, 562–568. doi:10.1016/j.marpolbul.2014.06.032
Zhou, X. J., Wang, J., Li, H. Y., Zhang, H. M., and Zhang, D. L. (2021). Microplastic pollution of bottled water in China. J. Water Process. Eng. 40, 101884. doi:10.1016/j.jwpe.2020.101884
Keywords: microplastics, polymers, bottled drinking water, dietary intake, human health
Citation: Hossain MB, Yu J, Banik P, Noman MA, Nur A-AU, Haque MR, Rahman MM, Albeshr MF and Arai T (2023) First evidence of microplastics and their characterization in bottled drinking water from a developing country. Front. Environ. Sci. 11:1232931. doi: 10.3389/fenvs.2023.1232931
Received: 01 June 2023; Accepted: 28 June 2023;
Published: 06 July 2023.
Edited by:
Jing Ding, Harbin Institute of Technology, ChinaReviewed by:
Yunshu Zhang, University of Shanghai for Science and Technology, ChinaOmowunmi H. Fred-Ahmadu, Independent Researcher, Lagos, Nigeria
Copyright © 2023 Hossain, Yu, Banik, Noman, Nur, Haque, Rahman, Albeshr and Arai. This is an open-access article distributed under the terms of the Creative Commons Attribution License (CC BY). The use, distribution or reproduction in other forums is permitted, provided the original author(s) and the copyright owner(s) are credited and that the original publication in this journal is cited, in accordance with accepted academic practice. No use, distribution or reproduction is permitted which does not comply with these terms.
*Correspondence: M. Belal Hossain, bWJobnN0dUBnbWFpbC5jb20=
 M. Belal Hossain
 Jimmy Yu1
 Partho Banik
 Md. Abu Noman
 As-Ad Ujjaman Nur
 Md. Rashedul Haque
 Md. Mostafizur Rahman
 Mohammed Fahad Albeshr
 Takaomi Arai