
94% of researchers rate our articles as excellent or good
Learn more about the work of our research integrity team to safeguard the quality of each article we publish.
Find out more
ORIGINAL RESEARCH article
Front. Environ. Sci., 17 July 2023
Sec. Environmental Informatics and Remote Sensing
Volume 11 - 2023 | https://doi.org/10.3389/fenvs.2023.1222871
 Said Nawar1*
 Elsayed Said Mohamed2*
 Safa Essam-Eldeen Sayed3Wagih S. Mohamed3Nazih Y. Rebouh4
 Amr A. Hammam3
Potentially toxic elements (PTEs) pose a significant threat to soil and the environment. Therefore, the fast quantification of PTEs is crucial for better management of contaminated sites. Versatile technique such as Visible near-infrared spectroscopy (Vis–NIRS) (350–2,500 nm) has attracted tremendous attention for assessing PTEs and has achieved promising results combined with successful multivariate analysis. This research investigated the potential of Vis–NIRS combined with partial least squares regression (PLSR) and variable selection methods to assess key PTEs (Cd, Co, Cu, Cr, Pb, and Zn) in agricultural soils under arid conditions. The soil samples (80) were collected from a polluted area around Al-Moheet drainage, Minya Governorate–upper Egypt. The samples were scanned using an ASD FieldSpec-4 spectroradiometer. Simulated annealing (SA) and uninformative variable elimination (UVE) were used to select the effective wavelengths in predicting PTEs. PLSR was used to develop the spectral models using the full range (FR-PLS) and feature-selected spectra techniques SA (SA-PLS) and UVE (UVE-PLS). The results indicated that UVE-PLS models performed better than FR-PLS and SA-PLS models in predicting the key PTEs. The obtained coefficient of determination (R2) and the ratio of performance to deviation (RPD) were 0.74 and 2.48 (Cr), 0.72 and 2.03 (Pb), 0.62 and 1.86 (Cd), 0.59 and 1.78 (Cu), 0.52 and 1.68 (Co), and 0.46 and 1.41 (Zn), respectively. The results suggested that the UVE-PLS spectral model is promising for predicting Cr, Pb, and Cd, and can be improved for predicting Cu, Co, and Zn elements in agricultural soils.
Potentially toxic elements (PTEs) accumulation in agricultural soils can cause serious health problems for humans and negatively impact ecosystems (Khan et al., 2008; Zhang et al., 2009). PTEs, such as cadmium (Cd), chromium (Cr), cobalt (Co), copper (Cu), lead (Pb), and zinc (Zn), constitute a significant group of soil contaminants (Bruemmer et al., 1986). These elements endanger human and animal health by entering the water, soil, plants, and food chain (Gholizadeh et al., 2018). Because of their persistence and long biological half-lives, they disrupt the nutrient balance in the soil and reduce plant growth (Shi et al., 2018). As a result, quantification of PTEs in the soil is critical for efficient monitoring and subsequent remediation. Traditionally, PTEs have been quantified using wet chemistry, such as inductively coupled plasma (ICP) analysis or atomic absorption spectrometry (AAS). These methods are time-consuming, expensive, and unsuitable for many soil samples (Nawar et al., 2020). Therefore, there is a rising need for detection and measurement equipment that can be used on-site and in real-time, which has contributed to advancing new techniques such as visible and near-infrared spectroscopy (Vis-NIRS).
Vis-NIRS is a commonly effective tool for soil analysis, such as soil organic carbon (SOC), texture, nutrients, and PTEs. Modern instrumental spectroscopic technologies analyse samples at high resolution, yielding many spectral variables per sample. The high-resolution measurement can result in large predictors (p) and small (n) samples, which occur when the number of spectral variables exceeds the number of samples, and have posed difficulties in analysing the relationship between the target (e.g., soil properties) and spectral variables. Therefore, appropriate statistics algorithms are required to extract useful information from spectra. Partial least squares regression (PLSR) is a widely used algorithm coupled with variable selection strategies (Xiaobo et al., 2010). PLSR is a popular multivariate regression technique that can handle many noisy and correlated variables and small samples (Wold et al., 2001; Forina et al., 2004). The potential of Vis-NIRS coupled with PLSR was examined by Kooistra et al. (2001), who reported a coefficient of determination (R2) of 0.88 and 0.90 for estimating Cd and Zn, respectively, in river floodplains (Netherlands). The PLSR was also used to estimate Cr and Ni concertations in soil samples (Han et al., 2021), reporting R2 of 0.69–0.71. However, removing uninformative variables improves PLS calibration performance (Spiegelman et al., 1998; Andries et al., 2011, 2017). Besides better PLS model interpretation, lower measurement costs and a lower risk of overfitting may be obtained (Andersen and Bro, 2010).
Variable selection algorithms are well-known for improving model robustness and precision, excluding noisy spectral regions and collinear wavelengths (Xiaobo et al., 2010). For PLS, many variable elimination methods have been published (Gauchi and Chagnon, 2001; Xiaobo et al., 2010; Huang et al., 2019; Mehmood et al., 2020), among which are the uninformative variable elimination (UVE) for PLSR (UVE-PLS) (Centner et al., 1996) and simulated annealing (SA) (Kalivas et al., 1989). UVE-PLS is a variable elimination method based on the PLSR regression coefficients’ significance. Variable importance is determined by PLSR regression coefficients and the standard deviation is calculated based on cross-validation (e.g., jackknifing). The variables with values less than the calculated threshold from the random process within the cross-validation are removed. SA has shown promising results in improving PLSR calibrations in various matrices (Balabin and Smirnov, 2011; Liu et al., 2019; Guo et al., 2020). The SA is a probabilistic optimization technique that accepts non-optimizing solutions with a predetermined probability of avoiding being trapped in a local minimum (Swierenga et al., 1998).
Industrial activities and long-term applications of inorganic fertilizers have heavily impacted agricultural soils in several regions of Egypt and other countries over the last few decades. Furthermore, the high-cost laboratory analysis of PTEs for large samples compared with the proximal sensing method (Nawar et al., 2020). Therefore, there is a growing need for versatile and cost-effective methods that can be developed based on limited reference samples for rapidly quantifying soil contaminants by PTEs. This study aimed to investigate the feasibility and cost-effectiveness of Vis–NIRS to quantify key PTEs (e.g., Cd, Co, Cu, Cr, Pb, and Zn) in limited samples from arid agricultural soils of a polluted area close to the Nile River in Egypt. The main objectives were: (i) to explore the potential of vis–NIRS for predicting the key PTEs and (ii) to compare the performance of spectral models using the PLSR method with spectral full-range (FR-PLS) and selected spectral datasets based on uninformative variable elimination (UVE-PLS) and the simulated annealing (SA-PLS), for models calibration and predictions of the target key PTEs.
The study area is located along with both sides El-Moheet drainage, Minya Governorate, Upper Egypt (Figure 1). This drainage extends south to north of serving the Governorate, with a length of about 100 km. However, it is considered the most dangerous source of pollution to the environment in this area. The study area occupied about 28,94 km2 (27° 56′30″to 28° 04′35″N, and 30° 43′09″to 30° 48′51″E). The area is almost flat, with elevations between 38 and 41 m above sea level. Arid conditions characterize the study area, including a hot summer, a warm winter, high evaporation, and low rainfall intensity. The average annual temperature during the winter months is about 29°C, while it reaches 41°C in the summer (Mayhoub and Azzam, 1997). The soil of the study area is located among the alluvial floodplain deposits of the Nile River, with dominant texture ranges between silt and clay. Based on the soil taxonomy (Soil Survey Staff, 2022), the soils were classified to the suborder level as Entic Calcitorrerts, Typic Haplotorrerts, and Haplotorrrerts. The study area is mainly cultivated with wheat, corn, soybeans, cotton, potatoes, and sugar cane (Hammam et al., 2022).
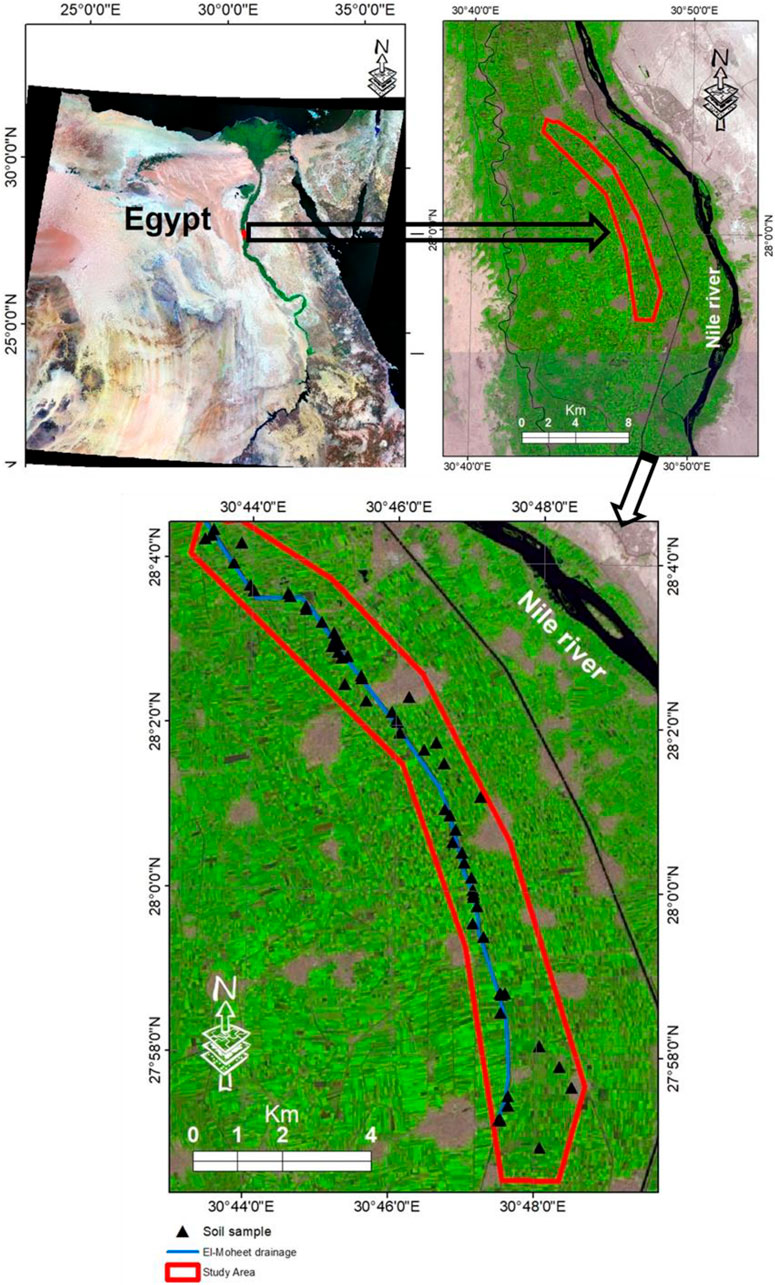
FIGURE 1. Location map of the study area and the soil samples.
Eighty soil samples were collected (60 at 0–20 cm and 20 at 20–40 cm) to create the soil spectral library. Sixty sampling locations were selected randomly to cover the soil spatial variability regarding land use, texture, and slope variation within the study area. For the surface sampling (0–20 cm), around 1 kg of soil was taken at each location, and the sampling positions were recorded using GPS (Hammam et al., 2022). To introduce the PTEs variability with depth to the spectral library, additional twenty subsurface samples (20–40 cm) were randomly selected at 20 locations out of the sixty locations. The limited subsurface samples were due to budget limitations. The samples were prepared by manually removing the non-soil materials (e.g., grass, roots, stone/gravel). Each soil sample was thoroughly mixed and quartered, bringing the total weight down to about 300 g, and is air-derided before being ground and sieved (2 mm) to obtain the fine earth (Liu et al., 2020; Gholizadeh et al., 2021). Finally, each sample was divided into two parts of about 150 g each for chemical and spectral analyses.
Each sample was first transferred to the National Authority for Remote Sensing and Space Sciences (NARSS), where the chemical analyses were performed. The soil organic carbon (SOC) content was determined by Walkley and Black procedure (Walkley and Black, 1934). For the extraction and quantification of total PTEs, the aqua regia digestion method was used (Page et al., 1982). Briefly, 0.25 g of soil was extracted with a mixture of concentrated nitric and hydrochloric acids (7 mL and 2 mL, respectively) using the microwave instrument at 200°C. The extraction was then made up to 50 mL volume by adding water. The PTEs analysis was performed by ICP-MS (Thermo, model iCAP-RQ). Using 1:2.5 soil water suspension, the soil pH was measured by the pH-meter Jenway (Hammam et al., 2022).
The second part of each sample was thoroughly mixed and placed in plastic cups with diameters of 4.9 and 2 cm in height. The sample surface was leveled and smoothed with a spatula to achieve optimal diffuse reflection. The soil spectra were measured in reflectance format using an ASD FieldSpec 4 spectroradiometer (Malvern Panalytical Inc., Westborough, USA) with a full range (350–2,500 nm). The spectral resolution varies from 3 nm in the 700 nm range to 6 nm in the 1,400–2,100 nm range. The samples were scanned by a high-intensity probe with a light source (built-in) that was used in contact with complete darkness conditions. Before sample scanning, the ASD instrument was started and allowed to warm up for 30 min and then calibrated with a white reference (99% reflection). Five successive spectra were taken and averaged to produce one representative spectrum of each soil sample.
The same spectral data preprocessing was performed for all PTEs investigated using Python. First, the noise at both edges was removed by cutting the range outside 450–2,450 nm. Then, spectra were subjected to a second derivative with a Savitzky–Golay smoothing (SDSG) technique (Savitzky and Golay, 1964). The SDSG was calculated using a second-order polynomial, which fit 13-point-width spectral windows. The derivatives methods can eliminate the spectra’s baseline drift, enhance absorption features, and extract relevant information from the near-infrared range (Ertlen et al., 2010). The derivatives of spectral data (first and second) have been used to improve the prediction of PTEs, e.g., Cd, Cu, Pb, and Zn (Khosravi et al., 2018; Liu et al., 2018).
PLSR is a multivariate analysis technique that projects the X variables (predictors) and the Y variable (response), to a new space to model the linear relationship (Wold et al., 2001). The algorithm projects information in the original X data onto a small number of essential orthogonal variables (components).
To develop the FR-PLS models, a two-dimensional data matrix comprised of the Xi variables (full spectral data (450–2,450 nm)) and Yi variables (PTEs values) was created. Before running the analysis, the entire dataset was divided into 75% for calibration and 25% for prediction using the Kennard-Stone (KS) algorithm (Kennard and Stone, 1969). PLSR with k-fold cross-validation (k = 5) correlated the variation in a target variable (e.g., PTEs) to the variation in multi-component variables (wavelengths) by using the sklearn. decomposition module available in Python. The optimal number of components (NC) (latent variables) was determined based on the NC with the smallest root mean squared error of cross-validation (RMSEcv). The best performance calibration model (lowest RMSEcv) was tested using the validation (prediction) set.
Removing unrelated variables, omitting redundancies, and selecting the most relevant variables from spectral data are necessary to improve model accuracy (Xu et al., 2019). The feature selection methods reduce complexity while retaining the most valuable wavelengths highly correlated with the predicted variables (Xiaobo et al., 2010). In the current study, two algorithms, uninformative variable elimination (UVE) (Centner et al., 1996) and simulated annealing (SA) (Kirkpatrick et al., 1983), were used to choose the essential spectral features for PTE assessment. These methods were used to develop spectral models and compared with those based on full-range spectral data (FR-PLS) developed in section 2.3.1.
SA is a stochastic global search optimization algorithm. Variable selection by SA improves the model’s transferability and predictive accuracy (Swierenga et al., 1998). For wavelength selection, the SA solution is denoted as a string of numbers containing k values representing the variables to be selected from N variables from the calibration set (X). The X variables combined with PTEs values (Y) were used to develop a PLSR model with predetermined components (Xiaobo et al., 2010). SA typically defines and attempts to reduce a cost function, namely, the root mean square error in cross-validation (RMSECV). The goal is to define a hyper-parameter—the number of bands that must be retained (N)—that is less than the total number of bands during the optimisation process. The procedure includes fitting a PLSR model with the optimal number of latent variables and calculating the RMSECV (cost function) iteratively. At each step, three bands were randomly swapped, and the RMSECV of the optimised PLSR was calculated. The selected bands are returned at the end of the procedure, along with the optimal number of PLSR model components associated with such a band selection and the value of the RMSECV at each iteration.
The UVE technique selects variables with the highest correlation with the response, observing only the properties inherent in the spectral data. The variable selection-based VE method uses the PLSR algorithm output to identify only a subset of important variables for variable identification. Variables are chosen in two stages when using a filter. First, the PLSR model is developed based on the given data, and then the variables are selected by introducing a threshold based on the results of the developed model. The feature’s relevance score is then calculated individually, excluding feature interactions. The UVE-PLS method was developed in the following steps: (1) optimise the PLSR using the entire spectrum, (2) extract the regression coefficients that associate each wavelength with the response, and (3) discard the lowest correlation wavelengths one at a time, (4) rebuild the calibration model using the lowest RMSE of cross-validation as the metric in iteration until the RMSE decreases, and (5) remove a fixed number of wavelengths iteratively until the RMSEcv decreases.
The performance of the spectral models in predicting the PTEs was assessed based on the calculated values of the coefficient of determination (R2), RMSE, and the ratio of performance to deviation (RPD) described as follows:
Where the measured
Table 1 presents the statistics of pH, SOC, and the tested elements. The soil pH values ranged between 7.79 and 8.56 with a mean value of 8.15. The SOC content ranged between 2,460 mg kg-1 and 25710 mg kg-1 with a mean value of 10948 mg kg-1. The contents of Cd have the lowest content, ranging between 0.05 and 2.07 mg kg-1, with mean and SD of 0.79 and 0.46 mg kg-1, respectively. The values of Fe, Zn, and Cr followed the highest contents with mean values of 137.55, 83.11, and 79.52 mg kg-1, maximum values of 210.43, 131.13, and 127.16 mg kg-1, and SD of 21.43, 12.67, and 18.57 mg kg-1, respectively. The contents of Pb and Co are comparable with mean values of 30.04 and 28.54 mg kg-1 and maximum values of 106.54 and 43.52 mg kg-1, respectively. The contents of Cu ranged between 34.25 and 91.40 mg kg-1, with a mean value of 50.22 mg kg-1.
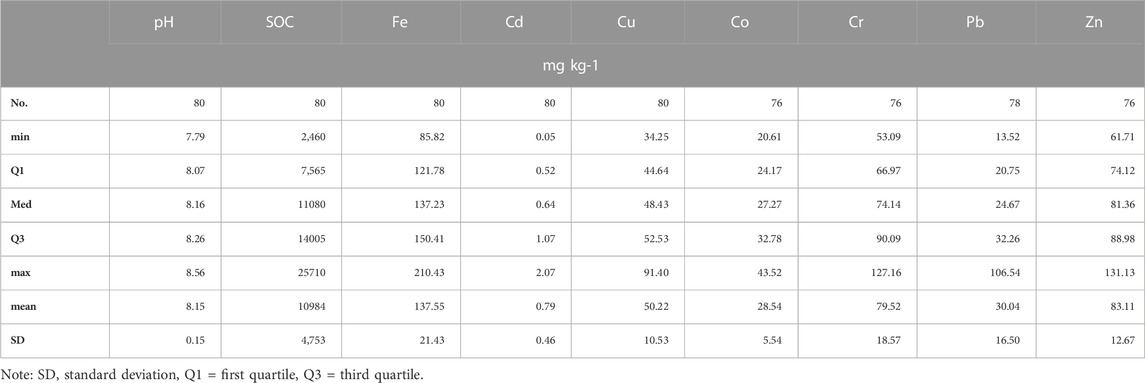
TABLE 1. Descriptive statistics of the soil samples (80) analysed for pH, soil organic carbon (SOC), iron (Fe), cadmium (Cd), copper (Cu), cobalt (Co), chromium (Cr), lead (Pb), and zinc (Zn) analysed with inductively coupled plasma mass spectrometry (ICP-MS) for the total contents (mg kg-1).
Figure 2 presents the calculated Pearson correlation coefficients (r) between pH, SOC content, and PTEs concentrations. A positive correlation was observed between the tested PTEs, except a negative correlation between Co and Fe. The highest coefficient value was observed between Cr and Cd (r = 0.82). The high correlations were observed between Cr and the other PTEs with r values of 0.60 with Cu, 0.53 with Pb, and 0.43 with Zn, but a very low correlation with Co (r = 0.23). The correlation between Cr and Fe was high (r = 0.63). SOC demonstrated a low correlation with Cu, Co, and Zn, very low with Cd, Cr, and Pb, and negative with Fe (r = - 0.11). The pH showed moderate negative correlations with Cd, Cr, Zn, Pb, and Cu (−0.33 ≤ r ≤ −0.49), but showed the negative weak correlations with Co and Fe (r = −0.21 and −0.18). Also, a medium negative correlation was found between pH and SOC (r = −0.36).
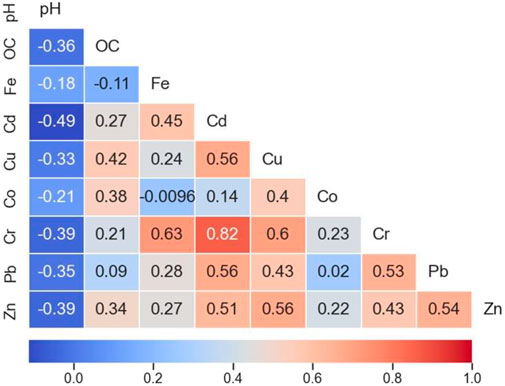
FIGURE 2. The correlation coefficients (Pearson) between the measured PTEs, e.g., chromium (Cr), cobalt (Co), cadmium (Cd), zinc (Zn), copper (Cu), iron (Fe), and lead (Pb), soil organic carbon (SOC), and pH.
The raw and processed spectral data of the soil samples are presented in Figure 3. The main features at 450–550 nm, 900 nm, 1,400 nm, 1900 nm, and 2,200 nm are observed (Figure 3A), but the absorption characteristics were not significant enough. The second derivative spectra indicated that the baseline drift and mixed overlapping peaks were gradually eliminated, thereby more detailed information and characteristic peaks appeared (Figure 3B). The second derivative spectra showed six regions of the spectrum that exhibit distinct absorption features around 480–550 nm, 1,400 nm, 1900 nm, 2,200 nm, 2,300, and 2,400 nm. The absorption features in the visible region are typically broad, while the features in the infrared region (e.g., 2,200 or 2,300 nm) are usually narrower and sharper. The absorption features around 1,400 and 1900 nm are associated with hydroxyl (OH) and water. The region between 2000 and 2,400 nm is associated with the components of organic matter.
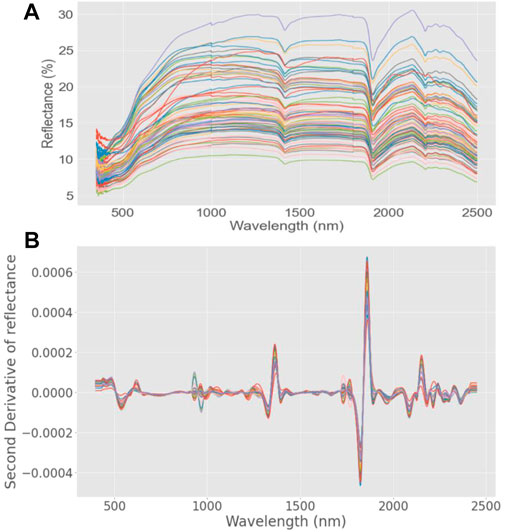
FIGURE 3. The raw spectra (A) and the processed spectra using the second derivative (B).
The results of estimating PTEs based on the FR-PLS models in cross-validation and prediction are presented in Table 2. The performance of the models in cross-validation was poor to fair (1.07 ≤ RPD ≤1.47). Table 2 shows that the best results were obtained for the Cr (R2 = 0.54, RMSEcv = 13.40 mg kg-1, and RPD = 1.47), followed by Zn, Pb, Co, and Cu, respectively. The worst results were obtained for Cd (R2 = 0.13, RMSEcv = 0.40 mg kg-1, and RPD = 1.07).
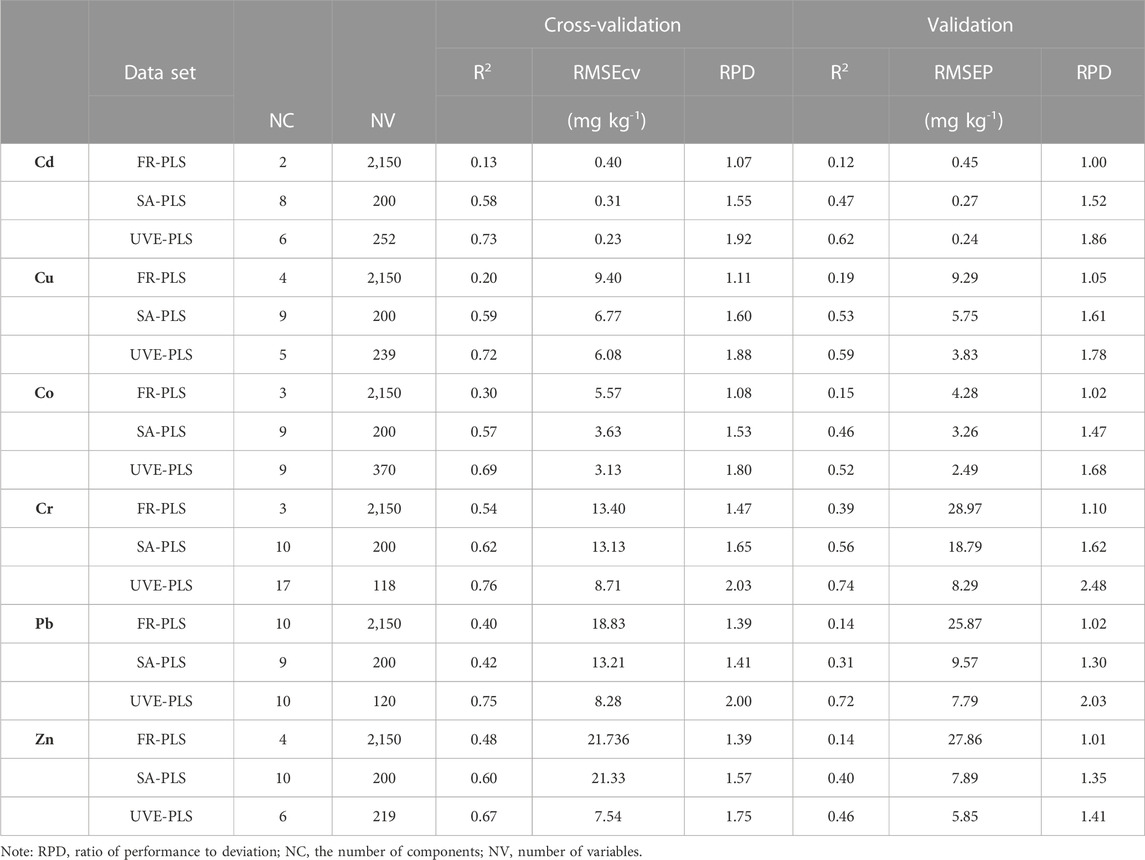
TABLE 2. The cross-validation and prediction (validation) results of PLSR models based on: a full range (FR-PLS), simulated annealing (SA-PLS), and uninformative variable elimination (UVE-PLS) of Vis-NIR spectral data for estimating cadmium (Cd), copper (Cu), cobalt (Co), chromium (Cr), lead (Pb), and zinc (Zn).
The prediction results were less than the cross-validation with very poor performance (1.00 ≤ RPD ≤1.10). The best results were obtained for Cr (R2 = 0.39, RMSEP = 28.97 mg kg-1, and RPD = 1.10), followed by Cu, Co, Pb, and Zn, respectively (Table 2). The worst results were obtained for Cd (R2 = 0.12, RMSEP = 0.45 mg kg-1, and RPD = 1.00).
The results of SA-PLS models in cross-validation and prediction are presented in Table 2. The performance of SA-PLS models in cross-validation and prediction was better than those of FR-PLS models. The SA-PLS models’ performance in cross-validation was fair (1.41 ≤ RPD ≤1.65). The best results were obtained for the Cr (R2 = 0.62, RMSEcv = 13.13 mg kg-1, and RPD = 1.65) followed by Zn, Cu, Cd, and Co, respectively (Table 2). The worst results were obtained for Pb (R2 = 0.42, RMSEcv = 13.21 mg kg-1, and RPD = 1.41) (Table 2). The prediction results followed the trend of cross-validation with fair to poor performance (1.30 ≤ RPD ≤1.62). The best results were obtained for Cr (R2 = 0.56, RMSEP = 18.79 mg kg-1, and RPD = 1.62), followed by Cu, Cd, Co, and Zn, respectively (Table 2). The worst prediction results were obtained for Pb (R2 = 0.31, RMSEP = 9.57 mg kg-1, and RPD = 1.30).
In all cases, the UVE-PLS outperformed the SA-PLS and FR-PLS models, resulting in a good cross-validation performance and predictions (Table 2; Figure 4 &5). The performance of UVE-PLS in cross-validation was fair to very good (1.75 ≤ RPD ≤2.03). The highest cross-validation performance was for Cr (R2 = 0.76, RMSEcv = 8.71 mg kg-1, and RPD = 2.03), followed by Pb, Cd, Cu, and Co, respectively. The worst performance was obtained for Zn with R2 = 0.67, RMSEcv = 7.54 mg kg-1, and RPD = 1.75 (Table 2; Figure 4). The prediction results showed the same trend of the cross-validation, with fair to very good performance (1.41 ≤ RPD ≤2.48). The best performance was obtained for Cr (R2 = 0.74, RMSEP = 8.29 mg kg-1, and RPD = 2.48), followed by Pb, Cd, Cu, and Co. The worst performance was obtained for Zn with R2 = 0.46, RMSEP = 5.85 mg kg-1, and RPD = 1.41 (Table 2; Figure 5).
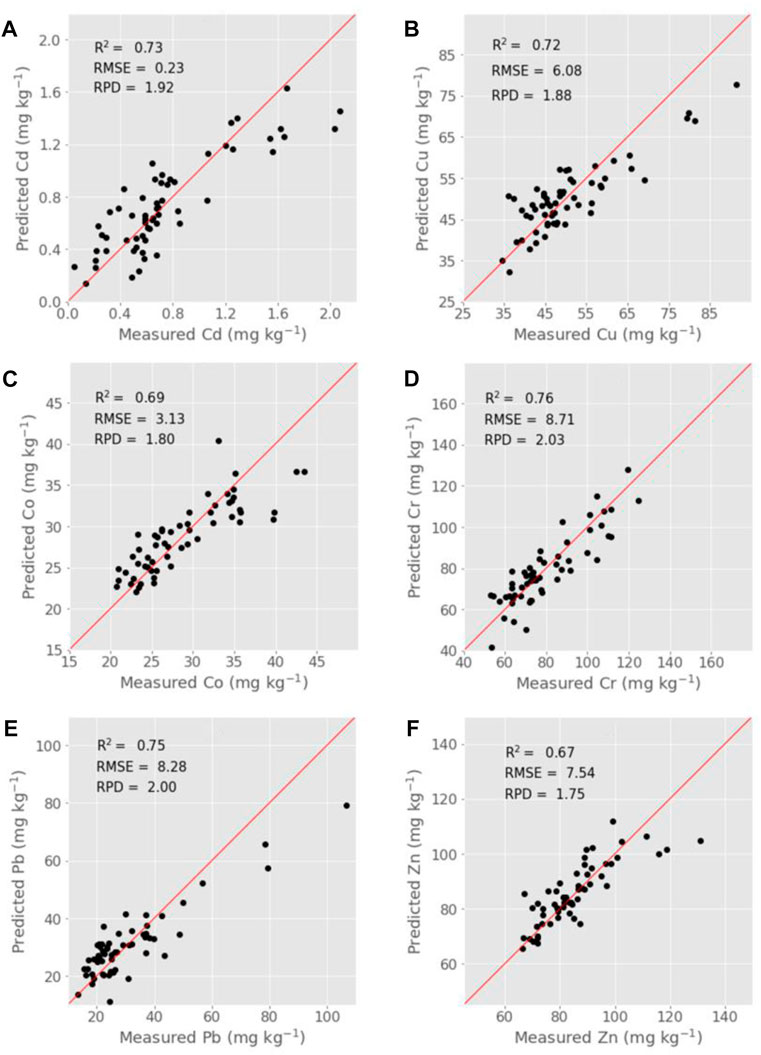
FIGURE 4. The cross-validation results of the UVE-PLS models for the tested PTEs Cd (A), Cu (B), Co (C), Cr (D), Pb (E), and Zn (F).
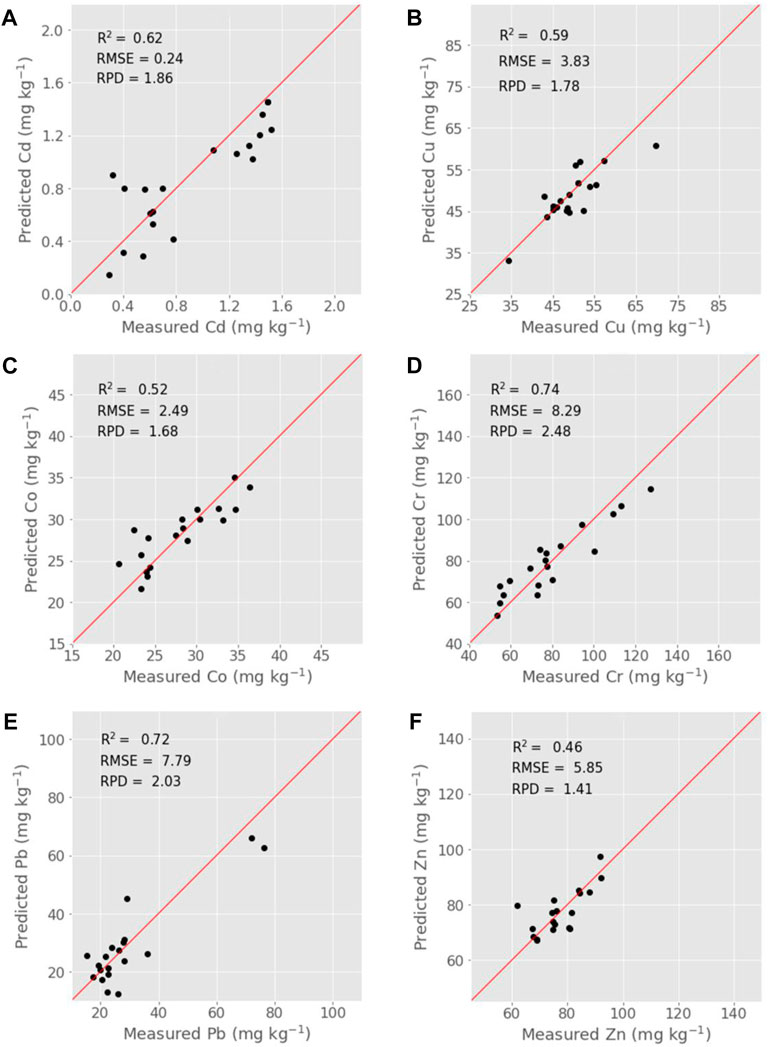
FIGURE 5. The prediction results of the UVE-PLS models for the tested PTEs Cd (A), Cu (B), Co (C), Cr (D), Pb (E), and Zn (F).
The spectral models based on PLSR and different spectral datasets provided diverse performances. The UVE-PLS method outperformed the SA-PLS in reducing variables and improving the prediction results. The best prediction results were achieved with UVE-PLS with very good performance for Cr with R2 = 0.74, RMSEP = 8.29 mg kg-1, and RPD = 2.48 (Figures 6A–C, respectively). The SA-PLS provided a fair prediction for Cr with R2 = 0.56, RMSE of 18.79 mg kg-1, and RPD of 1.62. Where the performance of Cr prediction based on FR-PLS was very poor R2 = 0.39, RMSE = 28.97 mg kg-1, and RPD = 1.10. These results indicated a substantial accuracy improvement in the Cr UVE-PLS model. The improvement in R2 (increasing by 89.7%), a reduction in RMSE by 71.4%, and an increase in RPD by 125.4%, compared with Cr FR-PLS models. Compared the results of Cr UVE-PLS with the results of Cr SA-PLS, R2 increased by 32.1%, RMSE reduced by 55.9%, and RPD increased by 53.1%. Similarly, the predictions of the other PTEs (Cd, Co, Cu, Pb, and Zn) based UVE-PLS models were improved as R2 increased by 67%–440% and 11.3%–132.2%, RMSE reduced by 32.4%–81.3% and 11.1%–55.9%, and RPD increased by 56.4%–83.0% and 4.4%–53.0% compared with the results of Cd, Co, Cu, Pb, and Zn based on FR-PLS and SA-PLS models, respectively.
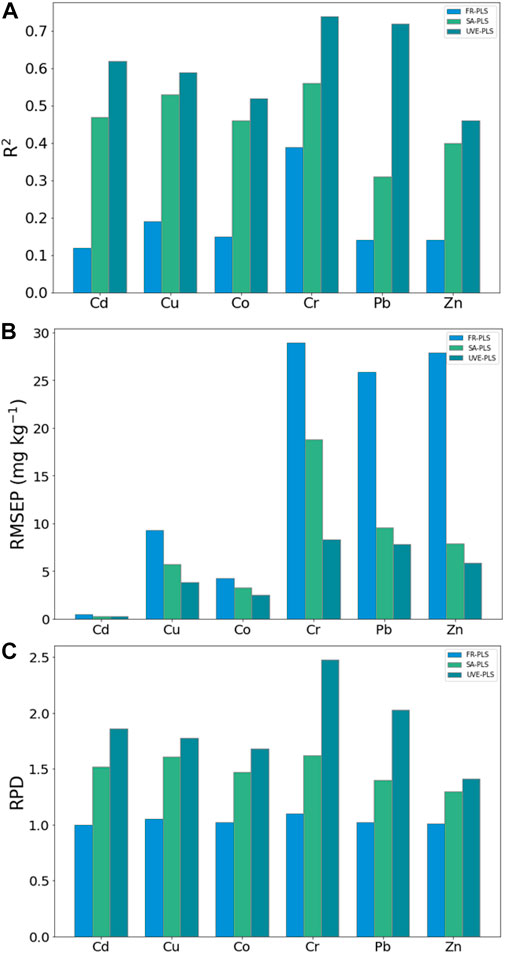
FIGURE 6. The histogram plots of R2 (A), RMSEP (B), and RPD (C) based on values resulted from the spectral models FR-PLS, SA-PLS, and UVE-PLS for the tested PTEs (Cd, Co, Cu, Cr, Pb, and Zn).
The PTEs concentrations are characterised by considerable variability as a result of the soil composition, the land use, and the arid nature of the study area. The soils of the study area were classified into three levels: moderate, considerable, and very high levels of contamination. The majority (70.7%) of the study area had high PTEs concentrations, with average concentrations (mg kg-1) of Cr, Co, Cu, Cd, Pb, and Zn being 91.23, 29.44, 53.83, 1.12, 36.04, and 101.29, respectively (Hammam et al., 2022). The positive relationship between PTEs each other and with Fe content (except Co) signifies that PTEs have the same source in the study area. The location of the study area–around the El-Moheet drainage—on the west side of the Nile River (Egypt), strongly contributed to the soil characteristics and the contamination in the study area. The mineralogical composition of the study area is composed of Holocene silts and clays, due to Nile flooding deposition, which covers the whole area (Abou Heleika et al., 2018). The low SOC content (1.1%) and pH values that ranged from slightly alkaline (7.79) to moderately alkaline (8.56), can be attributed to the arid nature of the study area (low precipitation) accompanied by the domination of basic cations such as magnesium (Mg2+) and calcium (Ca2+) (Al-Soghir et al., 2022). These findings are in line with those reported that soils in this area of Egypt have low SOC content and high pH (7.73–9.45) (e.g., Al-Soghir et al., 2022; Hammam et al., 2022). More importantly, the significant impact of the intensive agricultural practices of using mineral fertilizers, pesticides, and polluted irrigation water (Hammam et al., 2022). The El-Moheet drainage is considered a pollution source as some farmers use such water for irrigating their crops due to the deficiency of clean irrigation water (Abou Heleika et al., 2018; Hammam et al., 2022).
The estimation of PTEs using Vis-NIRS mainly relies on the indirect relationship with active soil components (e.g., clay, OC, and Fe). PTEs have no direct spectral features in the Vis-NIR region. Still, they can be detected indirectly through correlation with spectrally active soil attributes such as clay, OC, and Fe in the Vis-NIR region (Cipullo et al., 2019; Nawar et al., 2020). The correlation with total Fe can be the major predictive mechanism (Wu et al., 2005). Thus, the reflectance spectra can indirectly assess the PTEs concentrations in soil samples based on the correlation between contaminant concentrations and spectrally active soil attributes. For example, a considerable positive correlation of Fe with the tested PTEs concentrations (e.g., Cd, Cu, Zn, As, Pb, and Mn) has been reported (Gholizadeh et al., 2021), suggesting that PTEs were closely bonded to Fe (Wu et al., 2005). In the current study, the spectrally active soil component (Fe) strongly correlated with the PTEs (Cd, Cu, Pb, Zn, and Cr) with a medium to strong correlation (r = 0.24–0.63). The correlation between the SOC and PTEs was weak to medium positive (r = 0.09–0.42). These results indicate that Fe more significantly influenced the prediction of PTEs contents from spectra than other soil components such as SOC (Khosravi et al., 2018; Gholizadeh et al., 2021). Therefore, in arid conditions (low SOC) as the case of current research, the role of Fe in estimating PTEs can be larger than the SOC and can significantly influence soil spectra (Wu et al., 2007).
Estimating soil PTEs using Vis–NIRS was reported with different modelling accuracy (Wu et al., 2005, 2007; Cipullo et al., 2019; Hong et al., 2019; Gholizadeh et al., 2020). The strong correlations between PTEs and Fe–have a spectral response, and are responsible for the viability of the Vis–NIRS estimation of PTEs in soils (Kemper and Sommer, 2002; Araújo et al., 2014; Gholizadeh et al., 2021). Wu et al. (2007) successfully predicted low levels of PTEs in agricultural soils with descending order of prediction accuracy Ni > Cr > Co > Cd. They attributed such order of accuracy to the order of their correlation coefficients with Fe. The high performance of Cr and Pb predictions has been confirmed based on 2,160 samples used to assess selected PTEs (Cr, Cu, Pb, Zn, and Al) in forest soils in the Czech Republic (Gholizadeh et al., 2021). The current study found different modeling performances for the PTEs models (Table 2), with the order Cr > Pb > Cd > Cu > Co > Zn. The fair prediction of Co, Cu, and Zn can be explained by the fact that a greater proportion of those elements penetrate and precipitate from the solution phase in the soil. As a result, a large amount of these PTEs are allocated naturally in the soil profile by an independent process, making them undetectable when scanning surface soil samples by Vis-NIRS (Simón et al., 2001; Gholizadeh et al., 2021).
Based on the RPD classes of model performance (Viscarra Rossel et al., 2006), the prediction performance for Cr, Pb, and Cd, based on UVE-PLS, belonged to good to very good classes (RPD = 1.86–2.48). Cu, Co, and Zn models’ performance is considered fair (RPD = 1.41–1.78). Our results are in agreement with those reported by Xu et al. (2019), who have reported the highest accuracy for Cr with a correlation coefficient (ρc) of 0.80, RPD of 1.63, and RMSEP of 9.47, which is higher than those obtained in the current study (8.29 mg kg−1). Our results are better than those reported by O'Rourke et al. (2016), using a prediction set of 80 soil samples analysed with a full range Vis-NIRS coupled with a cubist modelling method for the prediction of the total concentration of 40 soil elements. The authors reported poor results for Cr with R2 = 0.26, RMSEP = 24.93 mg kg−1, and RPIQ = 0.44), with a concentration range from 5.56 to 221.7 mg kg−1. In this context, Todorova et al. (2014), who used 124 soil samples and full-range Vis-NIRS coupled with PLSR, reported excellent to poor prediction for Cu, Zn, Pb, Ni, and Cr with R2, RPD, and RMSEP of 0.89–0.38, 3.16–1.3, and 4.75–21.35 mg kg−1, respectively. They found the highest accuracy for Cu and the worst for Cr. Also, poor results have been reported for estimating Cr based on PLSR and full spectral range (Xu et al., 2021). The authors reported R2 = 0.45, RPD = 1.38, and RMSEP of 20.33 mg kg−1, and they suggested using appropriate dimensionality reduction methods for optimal results.
The first derivative provided higher-performance PTEs models than the second derivative when estimating PTEs in soils using spectral derivatives (Nawar et al., 2016; Chakraborty et al., 2017). The first derivative improves the spectral data while keeping the information’s continuity and integrity, while the second derivative adds more noise to the spectral information (Nawar et al., 2016; Khosravi et al., 2018). In this study, however, the performance of the models-based derivative spectra was higher than those of the models-based first derivative when estimating the target key PTEs using the selected wavelengths. The advantage of using the second derivative can be attributed to the capabilities of the second derivative to improve the spectral resolution, reduce the background noise, and pick out spectral peaks (Kong et al., 2018). Finding the spectral peaks that overlap is the critical part of the second derivative ability to improve the resolution of second derivative spectra, which helps to find out where the samples are different and locate the best wavelengths close to the spectral peaks (Saranwong et al., 2004). In this context, high-order derivatives showed better capabilities than low-order derivatives in assessing PTEs (Cr, Cu, and Ag) (Xu et al., 2021). Therefore, the above reasons may explain why models based second derivative outperformed the models based on the first derivative spectra when using variable selection techniques.
In the current study, the usefulness and benefit of feature selection algorithms, UVE and SA, were tested for selecting optimal variables for PTEs prediction. Using the feature selection algorithms resulted in removing the redundant and unuseful variables, reducing the spectral data dimension, selecting fewer variables of the spectral data, and avoiding potential over-fitting (Vohland et al., 2011; Gholizadeh et al., 2021). The UVE set fewer spectral variables in this research and provided better results than full-range spectra and SA (Table 2). The superiority of UVE over SA has been reported (Balabin and Smirnov, 2011; Ong et al., 2022) and explained that UVE subjectively removes variables based on either high noise or low detector response in an automated way for the calibration of Vis-NIR data (Centner et al., 1996). Besides, the strength of UVE is due to the selection of the valuable wavelengths based on the stability of each wavelength evaluated by the calculated regression coefficients within the PLSR calibration (Ong et al., 2022). Therefore, the variables selection-based UVE method helps to develop robust and stable spectral predictive models (Balabin and Smirnov, 2011).
However, compared to most of the mentioned studies, the prediction samples used in this study were relatively small (n = 20). The dataset significantly impacted the accuracy of calibration and prediction of soil properties, e.g., OC and PTEs (Nawar and Mouazen, 2017; Gholizadeh et al., 2021). The number of samples influences the model accuracy (Douglas et al., 2018; Cipullo et al., 2019), leading to various counterintuitive and unfamiliar side effects, leading to non-reasonable performance (Douglas et al., 2018; Nawar et al., 2019), with a general trend that the prediction capability increases with the sample’s number. However the limitation of the prediction set in the current study, the results obtained here are better for some elements, e.g., Cr, Pb, and Cd, and comparable to others, e.g., Cu, Co, and Zn. One of the reasons for the better prediction results of PTEs could be a good distribution of samples with minimum and maximum values (Table 2). Therefore, a good pre-selection of the calibration and the prediction sets with the wide range of concentration will improve prediction performance. Consequently, further investigation of the impact of a different dataset is needed to determine the optimal sample size and concentration range for enhancing the prediction accuracy obtained in this work, particularly for Cu, Co, and Zn.
The current research investigates the potential of visible and near-infrared spectroscopy (Vis-NIRS) combined with PLSR and feature selection algorithms (uninformative variable elimination (UVE) and simulated annealing (SA)) to predict the PTEs (Cd, Cu, Co, Cu, Pb, and Zn) contents in agriculture soils under the arid conditions in a polluted area in Egypt. The results showed that (i) the Vis-NIRS has the potential for predicting the tested PTEs, (ii) the full-range spectral dataset (FR) resulted in very poor models performance for all the PTEs (R2 < 0.40), (iii) the predictions obtained from the selected variables of the spectra based on UVE algorithm combined with PLSR (UVE-PLS) improved all the PTEs models’ accuracies (0.46 ≤ R2 ≤ 0.74) comparing with the models based the full spectral range, (iv) Cr models resulted in the highest performance for all methods (FR-PLS, SA-PLS, and UVE-PLS), and (v) the prediction results based on UVE-PLS for Cr, Pb, and Cd can be classified as very good (RPD values of 2.48, 2.03, and 1.86, respectively), and less accurate predictions (good to fair) obtained for Cu, Co, and Zn (RPD values of 1.78, 1.68, and 1.41, respectively). The results suggested that Vis-NIRS combined with the PLSR and feature selection algorithm (UVE) is promising for screening PTEs in agricultural soils. Future research should focus on testing these findings on larger datasets with a wider range of contents from different sites to be combined with other powerful machine learning methods such as cubist and random forest.
Data are available from the authors upon request.
Conceptualization, SN and EM; methodology, SN, EM, and AH; software, SN; validation, SN; formal analysis, SN, EM, and AH; investigation, SN, SE-E, WM, AH, and EM; data curation, SE-E, AH, EM, and WM; visualization, SN; writing the paper draft, SN; review and editing the manuscript, SN, EM, SE-E, WM, NR, and AH. All authors contributed to the article and approved the submitted version.
The authors would like to acknowledge the soil and water department, faculty of agriculture, Suez Canal University, Egypt. The authors also acknowledge the soil department, faculty of agriculture, Minia University, and the National Authority for Remote Sensing and Space Sciences for laboratory analyses and support. This paper has been supported by the RUDN University Strategic Academic Leadership Program.
The authors declare that the research was conducted in the absence of any commercial or financial relationships that could be construed as a potential conflict of interest.
All claims expressed in this article are solely those of the authors and do not necessarily represent those of their affiliated organizations, or those of the publisher, the editors and the reviewers. Any product that may be evaluated in this article, or claim that may be made by its manufacturer, is not guaranteed or endorsed by the publisher.
Abou Heleika, M., Ismail, E., and Ahmed, M. (2018). Delineation of contamination zone using geophysical and hydrogeochemical methods around the El Moheet drain in the El Minia district, Upper Egypt. Arab. J. Geosci. 11 (20), 1–13. doi:10.1007/s12517-018-3927-2
Al-Soghir, M. M. A., Mohamed, A. G., El-Desoky, M. A., and Awad, A. A. M. (2022). Comprehensive assessment of soil chemical properties for land reclamation purposes in the toshka area, Egypt. Sustain. Switz. 14 (23), 15611. doi:10.3390/su142315611
Andersen, C. M., and Bro, R. (2010). Variable selection in regression-a tutorial. J. Chemom. 24 (11–12), 728–737. doi:10.1002/cem.1360
Andries, J. P. M., Vander Heyden, Y., and Buydens, L. M. C. (2011). Improved variable reduction in partial least squares modelling based on Predictive-Property-Ranked Variables and adaptation of partial least squares complexity. Anal. Chim. Acta 705 (1–2), 292–305. doi:10.1016/j.aca.2011.06.037
Andries, J. P. M., Vander Heyden, Y., and Buydens, L. M. C. (2017). Improved variable reduction in partial least squares modelling by Global-Minimum Error Uninformative-Variable Elimination. Anal. Chim. Acta 982, 37–47. doi:10.1016/j.aca.2017.06.001
Araújo, S. R., Demattê, J. A. M., and Vicente, S. (2014). Soil contaminated with chromium by tannery sludge and identified by vis-NIR-mid spectroscopy techniques. Int. J. Remote Sens. 35 (10), 3579–3593. doi:10.1080/01431161.2014.907940
Balabin, R. M., and Smirnov, S. V. (2011). Variable selection in near-infrared spectroscopy: Benchmarking of feature selection methods on biodiesel data. Anal. Chim. Acta 692 (1–2), 63–72. doi:10.1016/j.aca.2011.03.006
Bruemmer, G. W., Gerth, J., and Herms, U. (1986). Heavy metal species, mobility and availability in soils. Z. Für Pflanzenernährung Und Bodenkd. 149 (4), 382–398. doi:10.1002/jpln.19861490404
Centner, V., Massart, D. L., De Noord, O. E., De Jong, S., Vandeginste, B. M., and Sterna, C. (1996). Elimination of uninformative variables for multivariate calibration. Anal. Chem. 68 (21), 3851–3858. doi:10.1021/ac960321m
Chakraborty, S., Weindorf, D. C., Deb, S., Li, B., Paul, S., Choudhury, A., et al. (2017). Rapid assessment of regional soil arsenic pollution risk via diffuse reflectance spectroscopy. Geoderma 289, 72–81. doi:10.1016/J.GEODERMA.2016.11.024
Cipullo, S., Nawar, S., Mouazen, A. M., Campo-Moreno, P., and Coulon, F. (2019). Predicting bioavailability change of complex chemical mixtures in contaminated soils using visible and near-infrared spectroscopy and random forest regression. Sci. Rep. 9 (1), 4492–4503. doi:10.1038/s41598-019-41161-w
Douglas, R. K., Nawar, S., Alamar, M. C., Mouazen, A. M., and Coulon, F. (2018). Rapid prediction of total petroleum hydrocarbons concentration in contaminated soil using vis-NIR spectroscopy and regression techniques. Sci. Total Environ. 616–617, 147–155. doi:10.1016/j.scitotenv.2017.10.323
Ertlen, D., Schwartz, D., Trautmann, M., Webster, R., and Brunet, D. (2010). Discriminating between organic matter in soil from grass and forest by near-infrared spectroscopy. Eur. J. Soil Sci. 61 (2), 207–216. doi:10.1111/j.1365-2389.2009.01219.x
Forina, M., Lanteri, S., Oliveros, M. C. C., and Millan, C. P. (2004). Selection of useful predictors in multivariate calibration. Anal. Bioanal. Chem. 380 (3), 397–418. doi:10.1007/s00216-004-2768-x
Gauchi, J. P., and Chagnon, P. (2001). Comparison of selection methods of explanatory variables in PLS regression with application to manufacturing process data. Chemom. Intelligent Laboratory Syst. 58 (2), 171–193. doi:10.1016/S0169-7439(01)00158-7
Gholizadeh, A., Coblinski, J. A., Saberioon, M., Ben-Dor, E., Drábek, O., Demattê, J. A. M., et al. (2021). Vis–nir and xrf data fusion and feature selection to estimate potentially toxic elements in soil. Sensors 21 (7), 2386. doi:10.3390/s21072386
Gholizadeh, A., Saberioon, M., Ben-Dor, E., and Borůvka, L. (2018). Monitoring of selected soil contaminants using proximal and remote sensing techniques: Background, state-of-the-art and future perspectives. Crit. Rev. Environ. Sci. Technol. 48 (3), 243–278. doi:10.1080/10643389.2018.1447717
Gholizadeh, A., Saberioon, M., Ben-Dor, E., Viscarra Rossel, R. A., and Borůvka, L. (2020). Modelling potentially toxic elements in forest soils with vis–NIR spectra and learning algorithms. Environ. Pollut. 267, 115574. doi:10.1016/j.envpol.2020.115574
Guo, Z., Barimah, A. O., Shujat, A., Zhang, Z., Ouyang, Q., Shi, J., et al. (2020). Simultaneous quantification of active constituents and antioxidant capability of green tea using NIR spectroscopy coupled with swarm intelligence algorithm. LWT 129, 109510. doi:10.1016/j.lwt.2020.109510
Hammam, A. A., Mohamed, W. S., Sayed, S. E. E., Kucher, D. E., and Mohamed, E. S. (2022). Assessment of soil contamination using gis and multi-variate analysis: A case study in el-minia governorate, Egypt. Agronomy 12 (5), 1197. doi:10.3390/agronomy12051197
Han, A., Lu, X., Qing, S., Bao, Y., Bao, Y., Ma, Q., et al. (2021). Rapid determination of low heavy metal concentrations in grassland soils around mining using vis–NIR spectroscopy: A case study of inner Mongolia, China. Sensors 21 (9), 3220. doi:10.3390/s21093220
Hong, Y., Shen, R., Cheng, H., Chen, Y., Zhang, Y., Liu, Y., et al. (2019). Estimating lead and zinc concentrations in peri-urban agricultural soils through reflectance spectroscopy: Effects of fractional-order derivative and random forest. Sci. Total Environ. 651, 1969–1982. doi:10.1016/j.scitotenv.2018.09.391
Huang, C., Du, J., Nie, B., Yu, R., Xiong, W., and Zeng, Q. (2019). Feature selection method based on partial least squares and analysis of traditional chinese medicine data. Comput. Math. Methods Med. 2019, 9580126. doi:10.1155/2019/9580126
Kalivas, J. H., Roberts, N., and Sutter, J. M. (1989). Global optimization by simulated annealing with wavelength selection for ultraviolet-visible spectrophotometry. Anal. Chem. 61 (18), 2024–2030. doi:10.1021/ac00193a006
Kemper, T., and Sommer, S. (2002). Estimate of heavy metal contamination in soils after a mining accident using reflectance spectroscopy. Environ. Sci. Technol. 36 (12), 2742–2747. doi:10.1021/es015747j
Kennard, R. W., and Stone, L. A. (1969). Computer aided design of experiments. Technometrics 11 (1), 137–148. doi:10.1080/00401706.1969.10490666
Khan, S., Cao, Q., Zheng, Y. M., Huang, Y. Z., and Zhu, Y. G. (2008). Health risks of heavy metals in contaminated soils and food crops irrigated with wastewater in Beijing, China. Environ. Pollut. 152 (3), 686–692. doi:10.1016/j.envpol.2007.06.056
Khosravi, V., Doulati Ardejani, F., Yousefi, S., and Aryafar, A. (2018). Monitoring soil lead and zinc contents via combination of spectroscopy with extreme learning machine and other data mining methods. Geoderma 318, 29–41. doi:10.1016/j.geoderma.2017.12.025
Kirkpatrick, S., Gelatt, C. D., and Vecchi, M. P. (1983). Optimization by simulated annealing. Science 220 (4598), 671–680. doi:10.1126/science.220.4598.671
Kong, W., Zhang, C., Cao, F., Liu, F., Luo, S., Tang, Y., et al. (2018). Detection of Sclerotinia stem rot on oilseed rape (Brassica napus L) leaves using hyperspectral imaging. Sensors Switz. 18 (6), 1764. doi:10.3390/s18061764
Kooistra, L., Wehrens, R., Buydens, L. M. C., Leuven, R. S. E. W., and Nienhuis, P. H. (2001). Possibilities of soil spectroscopy for the classification of contaminated areas in river floodplains. ITC J. 3 (4), 337–344. doi:10.1016/S0303-2434(01)85041-8
Liu, J., Han, J., Xie, J., Wang, H., Tong, W., and Ba, Y. (2020). Assessing heavy metal concentrations in earth-cumulic-orthic-anthrosols soils using Vis-NIR spectroscopy transform coupled with chemometrics. Spectrochimica Acta - Part A Mol. Biomol. Spectrosc. 226, 117639. doi:10.1016/j.saa.2019.117639
Liu, J., Li, N., Zhen, F., Xu, Y., Li, W., and Sun, Y. (2019). Rapid detection of carbon-nitrogen ratio for anaerobic fermentation feedstocks using near-infrared spectroscopy combined with BiPLS and GSA. Appl. Opt. 58 (18), 5090. doi:10.1364/ao.58.005090
Liu, J., Zhang, Y., Wang, H., and Du, Y. (2018). Study on the prediction of soil heavy metal elements content based on visible near-infrared spectroscopy. Spectrochimica Acta - Part A Mol. Biomol. Spectrosc. 199, 43–49. doi:10.1016/j.saa.2018.03.040
Mayhoub, A. B., and Azzam, A. (1997). A survey on the assessment of wind energy potential in Egypt. Renew. Energy 11 (2), 235–247. doi:10.1016/S0960-1481(96)00113-9
Mehmood, T., Saebø, S., and Liland, K. H. (2020). Comparison of variable selection methods in partial least squares regression. doi:10.1002/cem.3226
Nawar, S., Buddenbaum, H., Hill, J., Kozak, J., and Mouazen, A. M. A. M. A. M. (2016). Estimating the soil clay content and organic matter by means of different calibration methods of vis-NIR diffuse reflectance spectroscopy. Soil Tillage Res. 155, 510–522. doi:10.1016/j.still.2015.07.021
Nawar, S., Cipullo, S., Douglas, R. K. K., Coulon, F., and Mouazen, A. M. M. (2020). The applicability of spectroscopy methods for estimating potentially toxic elements in soils: State-of-the-art and future trends. Appl. Spectrosc. Rev. 55 (7), 525–557. doi:10.1080/05704928.2019.1608110
Nawar, S., Delbecque, N., Declercq, Y., De Smedt, P., Finke, P., Verdoodt, A., et al. (2019). Can spectral analyses improve measurement of key soil fertility parameters with X-ray fluorescence spectrometry? Geoderma 350, 29–39. doi:10.1016/j.geoderma.2019.05.002
Nawar, S., and Mouazen, A. M. (2017). Comparison between random forests, artificial neural networks and gradient boosted machines methods of on-line Vis-NIR spectroscopy measurements of soil total nitrogen and total carbon. Sensors Switz. 17 (10), 2428–2449. doi:10.3390/s17102428
Ong, P., Tung, I. C., Chiu, C. F., Tsai, I. L., Shih, H. C., Chen, S., et al. (2022). Determination of aflatoxin B1 level in rice (Oryza sativa L) through near-infrared spectroscopy and an improved simulated annealing variable selection method. Food control. 136, 108886. doi:10.1016/j.foodcont.2022.108886
O’Rourke, S. M., Minasny, B., Holden, N. M., and McBratney, A. B. (2016). Synergistic use of vis-NIR, MIR, and XRF spectroscopy for the determination of soil geochemistry. Soil Sci. Soc. Am. J. 80 (4), 888–899. doi:10.2136/sssaj2015.10.0361
Page, A. L., Miller, R. H., and Keeney, D. R. (1982). Methods of soil analysis: Part 2, chemical and microbiological properties agronomy series No 9. Madison, WI: American Society of Agronomy.
Saranwong, S., Sornsrivichai, J., and Kawano, S. (2004). Prediction of ripe-stage eating quality of mango fruit from its harvest quality measured nondestructively by near infrared spectroscopy. Postharvest Biol. Technol. 31 (2), 137–145. doi:10.1016/j.postharvbio.2003.08.007
Savitzky, A., and Golay, M. J. E. (1964). Smoothing and differentiation of data by simplified least squares procedures. Anal. Chem. 36 (8), 1627–1639. doi:10.1021/ac60214a047
Shi, T., Guo, L., Chen, Y., Wang, W., Shi, Z., Li, Q., et al. (2018). Proximal and remote sensing techniques for mapping of soil contamination with heavy metals. Appl. Spectrosc. Rev. 53 (10), 783–805. doi:10.1080/05704928.2018.1442346
Simón, M., Martín, F., Ortiz, I., García, I., Fernández, J., Fernández, E., et al. (2001). Soil pollution by oxidation of tailings from toxic spill of a pyrite mine. Sci. Total Environ. 279 (1–3), 63–74. doi:10.1016/S0048-9697(01)00726-4
Soil Survey Staff (2022). Keys to soil taxonomy. 13th Edn. USDA-Natural Resources Conservation Service.
Spiegelman, C. H., McShane, M. J., Goetz, M. J., Motamedi, M., Yue, Q. L., and Coté, G. L. (1998). Theoretical justification of wavelength selection in PLS calibration: Development of a new algorithm. Anal. Chem. 70 (1), 35–44. doi:10.1021/ac9705733
Swierenga, H., De Groot, P. J., De Weijer, A. P., Derksen, M. W. J., and Buydens, L. M. C. (1998). Improvement of PLS model transferability by robust wavelength selection. Chemom. Intelligent Laboratory Syst. 41 (2), 237–248. doi:10.1016/S0169-7439(98)00055-0
Todorova, M., Mouazen, A. M., Lange, H., and Atanassova, S. (2014). Potential of near-infrared spectroscopy for measurement of heavy metals in soil as affected by calibration set size. Water, Air, Soil Pollut. 225 (8), 2036–2057. doi:10.1007/s11270-014-2036-4
Viscarra Rossel, R. A., Walvoort, D. J. J., McBratney, A. B., Janik, L. J., and Skjemstad, J. O. (2006). Visible, near infrared, mid infrared or combined diffuse reflectance spectroscopy for simultaneous assessment of various soil properties. Geoderma 131 (1–2), 59–75. doi:10.1016/j.geoderma.2005.03.007
Vohland, M., Besold, J., Hill, J., and Fründ, H. C. (2011). Comparing different multivariate calibration methods for the determination of soil organic carbon pools with visible to near infrared spectroscopy. Geoderma 166 (1), 198–205. doi:10.1016/j.geoderma.2011.08.001
Walkley, A., and Black, I. A. (1934). An examination of the degtjareff method for determining soil organic matter, and a proposed modification of the chromic acid titration method. Soil Sci. 37 (1), 29–38. doi:10.1097/00010694-193401000-00003
Wold, S., Sjöström, M., and Eriksson, L. (2001). PLS-regression: A basic tool of chemometrics. Chemom. Intelligent Laboratory Syst. 58 (2), 109–130. doi:10.1016/S0169-7439(01)00155-1
Wu, Y., Chen, J., Ji, J., Gong, P., Liao, Q., Tian, Q., et al. (2007). A mechanism study of reflectance spectroscopy for investigating heavy metals in soils. Soil Sci. Soc. Am. J. 71 (3), 918–926. doi:10.2136/sssaj2006.0285
Wu, Y., Chen, J., Wu, X., Tian, Q., Ji, J., and Qin, Z. (2005). Possibilities of reflectance spectroscopy for the assessment of contaminant elements in suburban soils. Appl. Geochem. 20 (6), 1051–1059. doi:10.1016/j.apgeochem.2005.01.009
Xiaobo, Z., Jiewen, Z., Povey, M. J. W., Holmes, M., and Hanpin, M. (2010). Variables selection methods in near-infrared spectroscopy. Anal. Chim. Acta 667, 14–32. doi:10.1016/j.aca.2010.03.048
Xu, D., Chen, S., Viscarra Rossel, R. A., Biswas, A., Li, S., Zhou, Y., et al. (2019). X-ray fluorescence and visible near infrared sensor fusion for predicting soil chromium content. Geoderma 352, 61–69. doi:10.1016/j.geoderma.2019.05.036
Xu, X., Chen, S., Ren, L., Han, C., Lv, D., Zhang, Y., et al. (2021). Estimation of heavy metals in agricultural soils using vis-nir spectroscopy with fractional-order derivative and generalized regression neural network. Remote Sens. 13 (14), 2718. doi:10.3390/rs13142718
Keywords: hyperspectral data, spectroscopy, soil analysis, heavy metals, variable selection
Citation: Nawar S, Mohamed ES, Essam-Eldeen Sayed S, Mohamed WS, Rebouh NY and Hammam AA (2023) Estimation of key potentially toxic elements in arid agricultural soils using Vis-NIR spectroscopy with variable selection and PLSR algorithms. Front. Environ. Sci. 11:1222871. doi: 10.3389/fenvs.2023.1222871
Received: 16 May 2023; Accepted: 07 July 2023;
Published: 17 July 2023.
Edited by:
Songchao Chen, ZJU-Hangzhou Global Scientific and Technological Innovation Center, ChinaReviewed by:
Yuxin Ma, Manaaki Whenua Landcare Research, New ZealandCopyright © 2023 Nawar, Mohamed, Essam-Eldeen Sayed, Mohamed, Rebouh and Hammam. This is an open-access article distributed under the terms of the Creative Commons Attribution License (CC BY). The use, distribution or reproduction in other forums is permitted, provided the original author(s) and the copyright owner(s) are credited and that the original publication in this journal is cited, in accordance with accepted academic practice. No use, distribution or reproduction is permitted which does not comply with these terms.
*Correspondence: Said Nawar, c2FpZC5uYXdhckBhZ3Iuc3Vlei5lZHUuZWc=; Elsayed Said Mohamed, c2FsYW1hNTVAbWFpbC5ydQ==
Disclaimer: All claims expressed in this article are solely those of the authors and do not necessarily represent those of their affiliated organizations, or those of the publisher, the editors and the reviewers. Any product that may be evaluated in this article or claim that may be made by its manufacturer is not guaranteed or endorsed by the publisher.
Research integrity at Frontiers
Learn more about the work of our research integrity team to safeguard the quality of each article we publish.