 Wei Liu
 Junping Ji
 Xin Liu
94% of researchers rate our articles as excellent or good
Learn more about the work of our research integrity team to safeguard the quality of each article we publish.
Find out more
ORIGINAL RESEARCH article
Front. Environ. Sci., 04 August 2023
Sec. Environmental Economics and Management
Volume 11 - 2023 | https://doi.org/10.3389/fenvs.2023.1216279
This article is part of the Research TopicLow-Carbon Transformation for Sustainable DevelopmentView all 14 articles
The close production and consumption relationship between industries leads to the embodied CO2 transfer among industrial sectors along with the exchange of products. Thus, grasping the situation of embodied carbon transfers from the demand side is of great significance for better reducing a country or region’s CO2 emissions. This study investigates the embodied carbon transfers in Guangdong Province from 2002 to 2017 from the industrial dimension by applying a hypothetical extraction method. An enhanced generalized RAS method was utilized to predict the intersectoral carbon transfers in 2025 and 2030. The results show that, from 2002 to 2017, the average proportion of carbon emission output of 72.11% made the production and supply of electricity and heat sector the main CO2 emission transfer exporter, while the other service and construction sectors were the leading importers. Moreover, the embodied carbon transfers between these three sectors are the main carbon transfer paths. By 2025, the other service sectors will become the largest embodied carbon importers, surpassing the construction sector. Therefore, it is necessary to control the consumption demand of other service and construction sectors on the demand side to reduce carbon emissions driven by demand.
For a long time, the continuous accumulation of greenhouse gasses such as CO2 has caused the phenomenon of global warming. Globally, China has become the country with the largest CO2 emissions with continuous industrialization. In this regard, China has proposed a dual-carbon goal, that is, to reach carbon peak by 2030 and become carbon neutral by 2060. The secondary industry, as a crucial contributor to regional economic development, is also the main source of carbon emissions, making it an indispensable part of government carbon reduction policies. The intermediate products produced by upstream sectors with high CO2 emissions are not entirely used by themselves. Driven by the demand of downstream sectors, some intermediate products will transfer through the industrial chain, and carbon emissions will also be transferred from the demand side to intermediate products. First, policymakers tend to focus on higher CO2-emitting industries based on the producer principle; they believe that major carbon emitting sectors should bear a greater responsibility for reducing emissions. However, such policies may not achieve long-term carbon reductions significantly. Hence, it is essential to analyze the intersectoral carbon transfers from a consumer principle to explore how carbon emissions are transferred under demand-driven, and to help the government formulate more effective emission reduction policies.
Regarding the spatial dimension, previous studies mainly explored the CO2 emission transfers between countries, regions, or provinces. In the study of carbon transfers from a national perspective, Wang and Han (2021) specifically analyzed the possibility of implied carbon emissions and trade decoupling between Chinese and American industries, crediting that in the US exports from high-technology industry or service industry to China, the decoupling has been best achieved. Some scholars are conducting research on the embodied emission transfers between multiple countries. Zhong et al. (2018) analyzed the carbon flows from multi-country trade, and proposed that this part of CO2 emissions could then be lowered by increasing the proportion of clean energy in total energy consumption. Wang et al. (2020) further discussed the embodied emission transfers among major countries from the perspective of industry, and found that China’s CO2 emission inflow is largely concentrated in the electromechanical equipment and chemicals in developed countries. Huang and Zhang (2023) found that digitization can better reduce the embodied CO2 emissions of exports under a higher global value chains (GVC) position. Some studies have explored the characteristics of carbon transfers between provinces in domestic trade. In China, the network characteristics of inter-provincial embodied emission transfers are significantly different (Sun et al. (2020)), and among them, a significant portion of the embodied carbon flows occurs between the southeastern coastal area and economically backward provinces in the central and western regions (Li and Li (2022); Tao and Wen (2022)). In addition, the generated carbon dioxide flows accordingly with industrial transfers between different provinces. Li et al. (2022) found that the paths of carbon and industrial transfers were somewhat similar but not completely coupled. Other studies explored the factors influencing inter-provincial carbon transfers. Wang and Wang et al. (2021) believed that environmental supervision and governance would inhibit the outflow of carbon emissions, whereas urbanization and energy intensity would promote its transfers. Wang and Hu (2020) found that 35.4% of carbon emissions from 2007 to 2012 came from inter-provincial demand from the production side, and this portion of carbon transfers continued to increase.
Similar to carbon emission transfers in the spatial dimension, since various industrial sectors play different roles in economic development, exploring the relationship of embodied emission transfers between industries is required, further promoting the allocation of the emission reduction responsibilities (Xia et al. (2022)). After drawing specific CO2 transfer paths of various industries in China in 2012, Bai et al. (2018) found that the electricity and heat generation and supply industry and construction industry were the most important carbon emission exporter and importer, respectively. Zheng et al. (2022) explored the association among industrial carbon intensity, factor flow, and industrial transfers from 30 provinces. After discussing the carbon transfer path between industrial sectors, Li et al. (2021) further investigated the potential influencing factors of the main path. Sun and Fang (2022) discussed the identification and optimization of unreasonable carbon transfers from a supply-side perspective under environmental regulations.
Carbon transfers between industrial sectors are mainly based on either complex network theory or the hypothetical extraction method (HEM). In complex network theory, inter-industry CO2 emissions are described in the form of a network, in which the industry itself is a node, and the amount of transferred CO2 is the edge connecting the nodes (Du et al. (2018); Ma et al. (2019); Du et al. (2020); Jiang et al. (2019); Wang and Yao (2022)). Therefore, the carbon correlation between industrial sectors is reflected in several characteristics of complex networks. On basis of complex network analysis, Du et al. (2020) investigated the CO2 transfer characteristics in 66 industries in the Yangtze River Economic Belt through network density, network connectedness, degree centrality, betweenness centrality, and other network characteristics. Wang and Yu et al. (2021) explored the significant characteristics of CO2 emission transfers of 30 industries in China from 2002 to 2015 through complex network theory. The hypothetical extraction method analyzes the economic relationship between selected and other sectors by comparing the difference in economic performance in the presence or absence of the selected sector (Du et al. (2019); Hou et al. (2021); Dai et al. (2021); Hertwich (2021)). Hou et al. (2020) focused on the embodied CO2 emission transfers among multiple sectors in China from 1992 to 2012 and concluded that the electricity and construction sectors were main sectors with the greatest CO2 emission output and input, respectively. Among Pakistan’s industrial sectors, Sajid (2020) found that the textile and apparel sectors were the top carbon emission importers.
Previous literature on CO2 emission transfer mainly examined spatial dimensions, such as intercountry and interregional, while research on industrial dimensions as the entry point for carbon emission transfers is relatively insufficient. Although some studies have focused on CO2 emission flows between industries from a national perspective, the industrial structure between regions is quite different, due to the different levels of development between regions. Thus, further exploring the carbon emission transfers among industries at the provincial and urban levels is necessary. As a result, it is better to effectively identify the carbon correlation characteristics and carbon emission transfer paths of industries in different regions. About method use, complex network analysis and hypothetical extraction method can accurately reflect the carbon correlation characteristics among sectors. However, a complex network analysis cannot show the specific carbon emission transfers between sectors because it mainly represents the carbon transfer relationship through the characteristics of the network. The hypothetical extraction method can obtain the direction and size of intersectoral carbon emission transfers by decomposing net backward and forward linkage emissions.
In this study, we used the hypothetical extraction method (HEM) as the research method to identify the main CO2 emission exporters and importers and analyzes the intersectoral embodied carbon transfer path in Guangdong Province from 2002 to 2017. Through EGRAS method (Enhanced Generalized RAS-Method), a prediction is made for the input-output table in 2025 and 2030 and the change in carbon transfers between industrial sectors.
The basic idea of HEM is to assume that the target sector is extracted and has no economic correlation with other sectors, which was first proposed by Schultz (1977) and now applied to research fields such as carbon emissions, energy consumption, and land and water resources (Wen et al. (2022); Li et al. (2022); Fang et al. (2022); Deng et al. (2018)).
By comparing the difference in economic performance in the presence or absence of the selected sector, the impact of the selected sector on the production and its economic correlation with other sectors were analyzed.
HEM divides the industrial system M into two industrial groups, Ma and M-a, where Ma is the industrial group that needs to be analyzed. The economic system can be given as:
where
Duarte et al. (2002) combined vertically integrated consumption with traditional hypothesis extraction methods and divided CO2 emissions of the interested sector into four categories: internal, mixed, net backward linkage, and net forward linkage emissions. Moreover, vertically integrated consumption specifically reflects the CO2 emissions from product consumption by each industry in this study. The HEM is used to find out the inter-industry carbon correlation, and the basic form is as follows:
Based on the I-O model, DCIi, reflecting the direct carbon intensity, is calculated as:
where the direct CO2 emissions of sector i is denoted by DCEi, while Xi represents its total output.
The vertically integrated consumption of carbon emissions of sector, VICi, is presented as follows:
where Lij denotes the Leontief inverse matrix element, that is, the corresponding element in
By further decomposing the vertically integrated consumption of carbon emissions, we can get the following categories:
Internal emissions (IE) refer to the CO2 emissions from the products produced and directly used by the target industrial group, Ma, for its own demand, and is shown as follows:
Mixed emissions (ME), which represents CO2 emissions of the intermediate goods purchased by other industrial groups, M-a, from the target industrial groups, Ma, and used in the production of Ma, are calculated as follows:
Net forward linkage emissions (NFL) reflect carbon emissions in the process of target industrial group Ma’s products being purchased by other industry groups, M-a, for their own use. The formula is as follows:
Net backward linkage emissions (NBL) refer to the carbon emissions of products purchased from other industry groups, M-a, by the target industry group, Ma, as an intermediate input. The formula is as follows:
From the point of view of the whole economic system, the following relationships exist:
By further decomposing NFL and NBL, we can obtain the specific carbon emission transfers among the industrial sectors. If sector H is a sector in other industrial groups M-a, the CO2 emissions shifted from industrial group Ma to sector H are shown as follows:
In contrast, the carbon emission transferred from sector H to industrial group Ma can be expressed as follows:
By replacing the DCI in Eqs 8, 9 with the value-added rate of the industrial sectors, VAR, the embodied value transfers between industries can be presented as follows:
The biproportional scaling method (RAS) was first brought forward by Stone to correct for the direct consumption coefficient. Due to the scenario analysis for 2025, 2030 and the lack of statistical data support in the preparation process, we used the EGRAS method, which was first proposed by He and Liu (2018) to estimate the intermediate inputs in 2025, 2030. This method has several advantages including number preservation, convexity preservation, zero preservation, being unbiased, avoiding positive and negative term offsets, and effectively retaining the prior information. The model is shown as follows:
where X0 ij and Xij are the intermediate input in the reference period and the target period, respectively; aij is defined as the ratio of Xij to X0 ij; ui and vj are the total intermediate output of industry i and the total intermediate input of industry j in the target period, respectively.
Industrial CO2 emissions caused by energy use can be presented as follows:
where CEi denotes the CO2 emissions generated by the fuel consumption of industry i; ei,k is consumption of fuel k in industry i, and fuel k’s average lower heating value is expressed by ACVk.
where Ck represents carbon content per unit calorific value of fuel k, and its carbon oxidation rate is represented by Ok.
The industrial energy consumption data in Guangdong Province were collected from Carbon Emissions Accounts and Datasets (CEADs), while the average lower heating value was obtained from the associated table of China Energy Statistical Yearbook. Carbon content per unit calorific value and carbon oxidation rate were obtained from the Guidelines for the Preparation of the Provincial Greenhouse Gas Inventory (Trial). See Supplementary Appendix S1 for carbon emission factor and average lower heating values for some fuels.
In order to maintain consistency of sector classification in different data, this study divided the industries in I-O table into 28 sectors, then further adjusted and merged the sector in carbon emission accounting accordingly. The corresponding relationship between the sectors is shown in Supplementary Appendix S2.
Referring to the compilation method of Li and Xue (1998), Liu and Peng (2010), Xu (2016) and Lu (2019), this study compiles the comparable price I-O tables for 2002, 2007, 2015, and 2017, with 2012 as the benchmark year. The price index of all sectors was obtained from the National Bureau of Statistics of China and the Guangdong Statistical Yearbook. The I-O tables in Guangdong Province from 2002 to 2017 was taken from Guangdong Provincial Bureau of Statistics.
With reference to Weber et al. (2008), we further adjust the comparable price I-O table to a non-competitive I-O table with comparable prices. It is assumed that both imports and domestic products or services from outside the province flow to intermediate input and final demand within the province (including exports and domestic and external outflows).
Based on the Action Plan for Carbon Peak before 2030 and “The 14th Five Year Plan” for Guangdong Province to Address Climate Change, assuming that the carbon intensity of Guangdong Province will decrease by 20.5% in 2025 compared with 2020, and by 18.5% in 2030 compared with 2025, then carbon intensity in 2025 and 2030 were calculated on the basis of 2002–2017. See Supplementary Appendix S3 for more details.
According to the input-output tables from 2002 to 2017, the components such as added value, total intermediate, final use and other components in the input-output table for 2025, 2030 can be simply estimated. Finally, on basis of the intermediate demand of the 2017 input-output table, the EGRAS method was referenced to estimate the intermediate input and complete the compilation of the 2025, 2030 input-output tables (Zhang et al. (2021)). See Table 1 for the main assumptions and Supplementary Appendix S4 for detailed compilation steps.
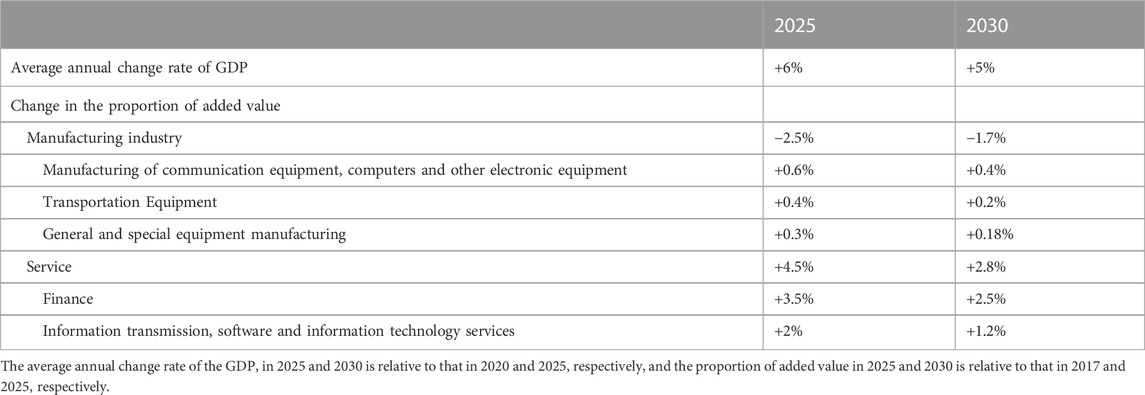
TABLE 1. Main assumptions for the compilation of input-output tables in 2025 and 2030.
The direct consumption of carbon emissions represents the sectoral CO2 emissions on the supply side, while the vertically integrated consumption represents it from a demand side. If the sectoral direct consumption is greater than its vertically integrated consumption, then it means a part of the CO2 emissions is shifted to other industries along with the products, and vice versa. The direct consumption and vertically integrated consumption in 28 industrial sectors are presented in Table 2, taking the data of 2012 as a case. The production and supply of electricity and heat sector (S22), metal smelting and rolling sector (S14), and the transport, storage and post sector (S26), these three sectors consumed a great deal of energy, causing direct carbon emissions with 311.51, 33.21, 56.99 Mt respectively. However, for these sectors, due to higher vertically integrated consumption, carbon emissions from a supply side were greater than those driven by their own needs, making them the main embodied emission exporters. As for direct consumption of S22, 84% of carbon emissions came from products provided to other industries rather than from intermediate products required for its own production. This part of CO2 emissions was generated under the demand of other industries and was transferred among various sectors. In the other two sectors with embodied carbon emission outputs (i.e., S14 and S26), this proportion was 64% and 47%, respectively. The direct consumption of other service sectors (S28), electrical, mechanical, and equipment manufacturing sector (S18), the construction sector (S25), and manufacturing of communication equipment, computers, and other electronic equipment sector (S19) were less than the vertical integration consumption, which indicated that the net CO2 emissions were transferred into these sectors. From the point of view of demand, the CO2 emissions of other service sectors for their own production were 46.94 Mt, while from the supply side, the carbon emissions were only 1.86 Mt. Approximately 45.09 Mt of carbon dioxide was hidden in the intermediate products purchased by other service sectors from other industries, which was 24.29 times the CO2 emissions from its own production. The net carbon inflows of construction sector were only 4.79 times that of the supply side, but the embodied carbon emission input was 56.24 Mt, which made itself the largest embodied CO2 importer.
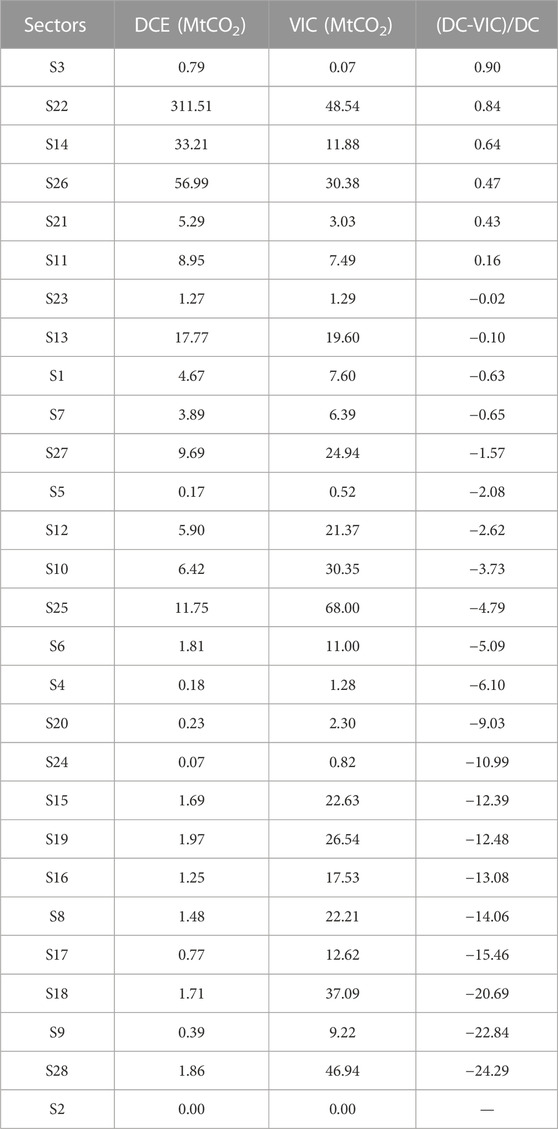
TABLE 2. Direct consumption and vertically integrated consumption of industrial sectors in Guangdong Province in 2012.
The NFL and NBL of the various sectors reflect their embodied CO2 emission output and input between industries, respectively. As shown in Figure 1A, from 2002 to 2017, five major industries with the largest proportion of NFL among industrial sectors in Guangdong Province were S22 (production and supply of electricity and heat sector, ∼72.11%), S26 (transport, storage and post sector, ∼10.83%), S14 (metal smelting and rolling sector, ∼5.54%), S13 (non-metallic mineral products sector, ∼3.51%), and S11 (petroleum processing, coking and nuclear fuel processing, ∼1.64%), with the total carbon emission output accounting for more than 90%. As the main energy production and supply sector, the production and supply of electricity and heat sector is an important upstream industry in economies, providing other industries with the necessary electricity and heat to meet their basic productive activities. Therefore, the important position of this sector in the industrial chain makes it the largest exporter of carbon.
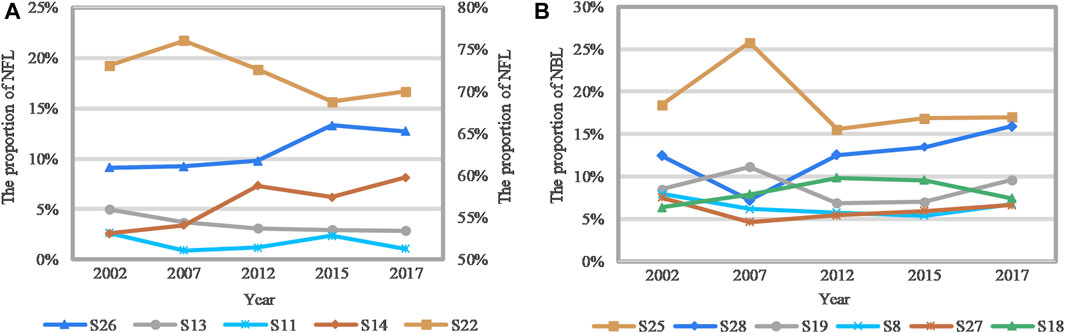
FIGURE 1. The proportion of NFL/NBL of sectors in Guangdong Province from 2002 to 2017. (A) The top five sectors with the largest proportion of NFL. (B) The top six sectors with the largest proportion of NBL. Notes: In (A), the broken line of production and supply of electricity and heat sector adopts the secondary ordinate on the right-hand side.
The proportion of embodied carbon outputs of the transportation, storage, and post sector rose from 9.11% in 2002 to 12.71% in 2017. By further decomposing the NFL of the transportation, storage, and post sectors, we obtained the specific carbon emissions transferred from this sector to another industrial sector. As seen in Figure 2A, the embodied carbon transferred from the transportation, storage and post sector to S28 (other service sectors), S25 (construction sector), S27 (wholesale, retail and accommodation, catering sector) increased significantly from 2.04, 2.93 and 0.67 Mt in 2002 to 8.97, 7.37 and 6.03 Mt in 2017, respectively. In 2017, these three paths accounted for more than 50% of the CO2 emission outputs of the transportation, storage, and post sector. Continuously strengthening domestic and international trade, such as the rapid development of express services in the postal industry, has promoted economic links between the transportation, storage, and post sector, other service sectors, and the wholesale, retail, accommodation, and catering sector, then further improved the carbon linkage among them.
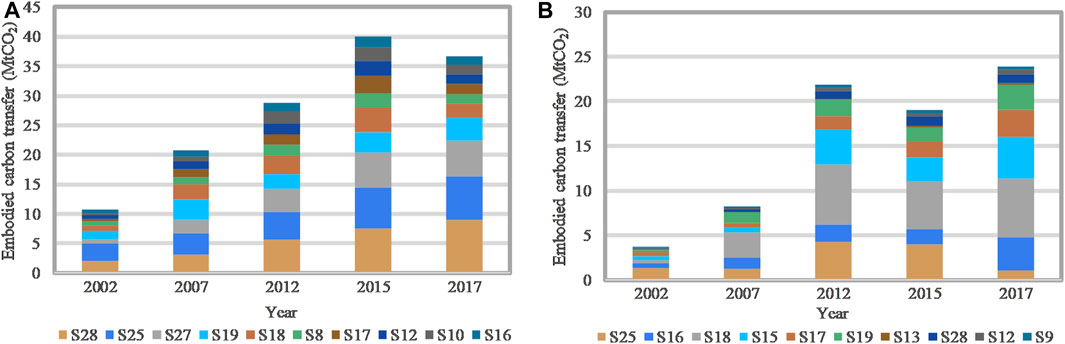
FIGURE 2. Ten main carbon emissions transfer paths from major sectors in Guangdong Province from 2002 to 2017. (A) The transport, storage, and post sector. (B) The metal smelting and rolling sector.
In addition, the proportion of embodied CO2 output of the metal smelting and rolling sector increased significantly, from 2.60% in 2002 to 8.17% in 2017. As a major manufacturing province in China, the development of advanced manufacturing in Guangdong Province has increased the demand for ferrous and non-ferrous metal materials in the electrical, mechanical and equipment manufacturing sector, metal products sector, and general and specialty equipment manufacturing sector. This increased embodied carbon output of metal smelting and rolling sector, as shown in Figure 2B, from which carbon emission transferred to S18 (electrical, mechanical, and equipment manufacturing sector) increased from 0.43 Mt in 2002 to 6.49 Mt in 2017. The proportion of this part of the carbon emission output of the metal smelting and rolling sector also increased from 10.80% to 24.56%.
The CO2 emission input of the industries is expressed by NBL; that is, the carbon emissions implied in the goods are transferred as a result of purchasing products from other sectors. Figure 1B shows that S25 (construction sector), S28 (other service sectors), S19 (manufacturing of communication equipment, computers, and other electronic equipment sector), S8 (leather, furs, down, and related products sector), S27 (wholesale, retail and accommodation, catering sector), and S18 (electrical, mechanical, and equipment manufacturing sector) were the top six sectors in Guangdong Province with the highest CO2 emission input, transferring more than 55% of the total CO2 emissions.
From 2002 to 2017, S25 (construction sector) was the top embodied carbon importer. The share of transferred CO2 rose from 18.46% in 2002 to 25.76% in 2007, decreased to 15.56% in 2012, and rose steadily to 17.02% in 2017. The proportion of carbon emissions input of S29 (other service sectors) decreased from 12.46% in 2002 to 7.23% in 2007 and increased to 15.92% in 2017, with a trend of surpassing the construction sector as the largest embodied CO2 emission importer. The large amounts of construction materials and mechanical equipment required for construction and installation activities in the construction sector cannot be met by their own production. The same is true for other service sectors, such as the tertiary industry. These two sectors are more likely to purchase the products and services required for their intermediate inputs from other industries during production. Therefore, despite the large proportion of transferred CO2 emissions, they exhibited lower carbon emissions on the supply side. As important advanced manufacturing industries in Guangdong Province, S19 (manufacturing of communication equipment, computers and other electronic equipment sector) and S18 (electrical, mechanical and equipment manufacturing sector) have also been taking a high proportion in carbon emission transfers, and their carbon emission input increased from 12.92 and 9.72 Mt in 2002 to 31.19 and 24.03 Mt in 2017.
By decomposing the NFL and NBL of the various industries, the specific CO2 emission transfer amount between industrial sectors can be obtained to further analyze the key embodied emission transfer paths. Figure 3 summarizes the top 15 paths with the largest carbon emission transfers in each year from 2002 to 2017, with a total of 20 paths. The sum of the carbon emission transfers from these pathways made up over 70% of the total. Among them, S22 (production and supply of electricity and heat sector) accounted for 17 routes as carbon emission exporters. In the other three paths, the carbon emission exporters were S13 (non-metallic mineral products sector) and S26 (transportation, storage, and post sector). As main embodied carbon exporters and importers, the carbon correlation between S22, and S25 (construction sector) or S28 (other service sectors) naturally became the two most important carbon emission transfer paths. However, it is noteworthy that in 2017, the embodied CO2 emission input of S28 from S22 was 38.92 Mt, that exceeded the 37.73 Mt transferred by S25 from S22 and became the largest CO2 emission transfer path. Moreover, the proportion of CO2 emissions transferred from S22 to basic manufacturing sectors like S6 (food manufacturing and tobacco processing sector), S7 (textile sector), and S14 (metal smelting and rolling sector) decreased significantly from 2.36%, 2.28%, and 1.97% in 2002 to 1.56%, 1.47%, and 0.62% in 2017, respectively. In contrast, there was still a strong carbon emission correlation with S19 (manufacturing of communication equipment, computers, and other electronic equipment sector), S18 (electrical, mechanical, and equipment manufacturing sector), and S22.
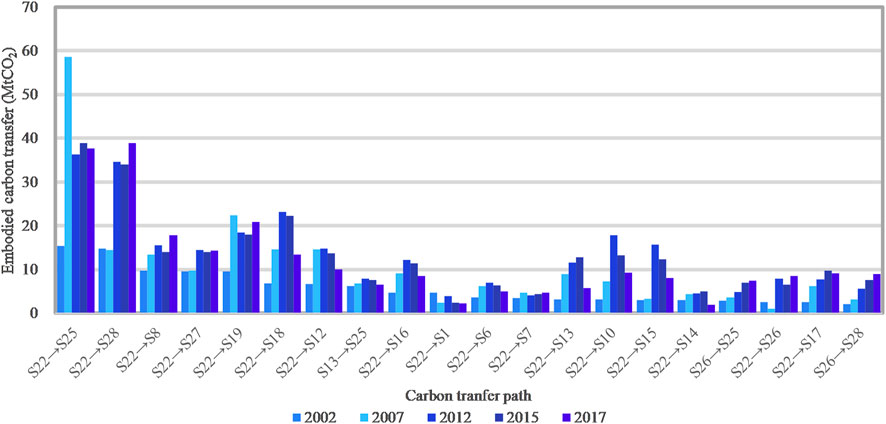
FIGURE 3. The top 15 carbon emission transfer paths among industrial sectors in Guangdong Province from 2002 to 2017.
The changes in the proportion of embodied emission transfers and the proportion of value-added transfers in the main carbon emission transfer paths were shown in Supplementary Figure A1, respectively, from 2007 to 2017. Among the six main paths, there was an obvious correlation between the changes in the proportion of carbon transfers and the change in the proportion of value-added transfers. It shows that the embodied CO2 transfers between industries was, to a certain extent, the embodiment of the value of products circulating in the industrial chain, reflecting changes in the industrial structure. Therefore, the changes of the main carbon emission transfer path reflect that Guangdong Province is continuously developing advanced manufacturing industry and striving to promote its structural transformation and upgrading.
After a simple prediction of the carbon intensity of various industries and using the EGRAS method to compile the I-O tables of Guangdong Province in 2025 and 2030, then the CO2 emissions in these two periods were obtained, as shown in Supplementary Figure A2. According to China’s Action Plan for Carbon Peak before 2030, Guangdong Province is expected to realize the carbon peak target between 2025 and 2030, with estimated carbon emissions of 523.78 and 519.53 Mt in 2025 and 2030, respectively.
The main CO2 emission exporters among the industrial sectors in 2017–2030 are shown in Figure 4A, including S22 (production and supply of electricity and heat sector), S26 (transportation, storage, and post sector), S14 (metal smelting and rolling sector), S5 (non-metallic mineral products sector), and S27 (wholesale, retail, accommodation, and catering sector). Furthermore, S22 remains the most important sector with the largest embodied CO2 emission output; however, the proportion of carbon emission output will decrease from 69.97% in 2017 to 55.73% in 2030, owing to the reduction in its own carbon intensity and its reduced dependence of other industrial sectors on electricity and heat. The embodied CO2 emission output of the transportation, storage, and post sector and the metal smelting and rolling sector will continue to increase from 2002 to 2017, from 12.71% to 8.16% in 2017 to 17.32% and 13.55% in 2030, respectively.
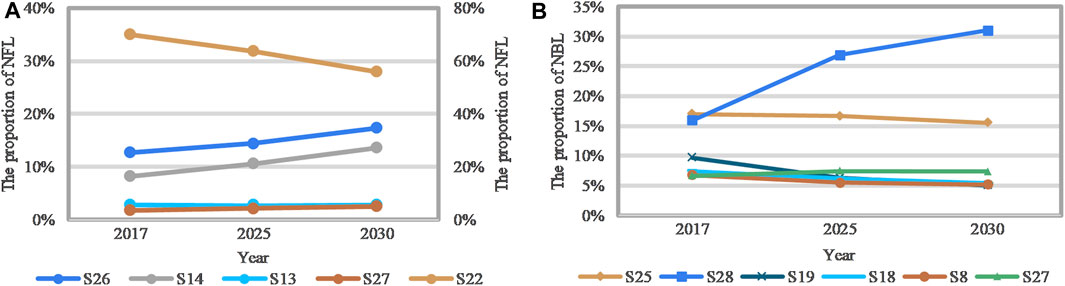
FIGURE 4. The proportion of NFL/NBL of sectors in Guangdong Province from 2017 to 2030. (A) The top five sectors with the largest proportion of NFL (B) The top six sectors with the largest proportion of NBL. Notes: In (A), the broken line of production and supply of electricity and heat sector adopts the secondary ordinate on the right-hand side.
In 2017–2025, the main sectors with embodied carbon inputs in Guangdong Province were still S25 (construction sector), S28 (other service sectors), S19 (manufacturing of communication equipment, computers, and other electronic equipment sector), S18 (electrical, mechanical, and equipment manufacturing sector), S8 (leather, furs, down, and related products sector), and S27 (wholesale, retail, accommodation, catering sector). The difference is that, in 2025, the share of CO2 emission input of the other service sectors will begin to exceed that of the construction sector and rise to 31.02% by 2030, becoming the largest embodied CO2 emission importer, as presented in Figure 4B. As Guangdong Province strives to accelerate industrial structural transformation and hope to build a new system of modern service industry, the share of GDP of other service sectors, mainly the finance, information transmission, software, and information technology service sectors, will continue to increase, and economic ties with other industrial sectors will also strengthen. Additionally, it will lead to increased input of carbon emissions.
The first 10 carbon emission transfer paths of Guangdong Province in each year in 2017, 2025, and 2030, totaling 14 paths, were analyzed, and the results are shown in Figure 5. The carbon linkages between S22 (production and supply of electricity and heat sector) and S28 (other service sectors), and between S22 and S25 (construction sector) remain the most critical carbon transfer paths. The share of transferred CO2 emissions in these two pathways increases from 23.72% in 2017 to 27.94% in 2030. In addition, the proportion of embodied emission transfers between S22 and S28 increased from 12.08% in 2017 to 19.31% in 2030, which is far higher than the 8.63% between S22 and S25. As Guangdong Province enters the stage of high-quality development, the productive service sector is becoming increasingly specialized, promoting its integration with primary and secondary industries, and the value-added rate of the service industry will constantly increase, further promoting the economic development. Therefore, the demand in the service sector for transportation and logistics has been increasing, and the industry relationship between the service sector and the transport, storage, and post sector has become closer. The carbon emission transfers between S26 (transport, storage, and post sector) and S28, and S26 and S27 (wholesale, retail and accommodation, catering sector) has increased significantly from 8.99 and 6.00 Mt in 2017 to 20.03 and 8.66 Mt in 2030. In addition, the proportion of carbon emission transfers in these three paths between S16 (general and special equipment manufacturing sector), S17 (transportation equipment sector), S15 (metal products sector) and S14 (metal smelting and rolling sector) respectively increased from 1.17%, 0.93% and 1.46% in 2017 to 2.58%, 2.39% and 2.33% in 2030. This change is mainly due to the increase in the proportion of added value of advanced manufacturing industry during the “Fourteenth Five-Year Plan” period, which further strengthened the carbon emission linkages between the above-mentioned industrial sectors.
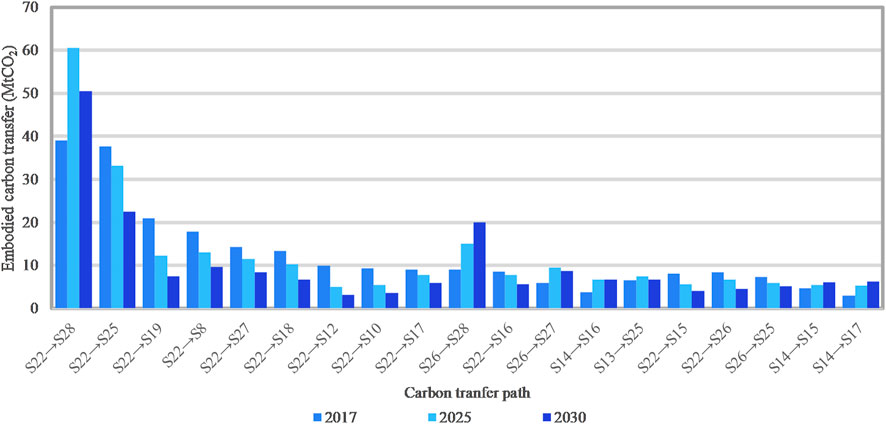
FIGURE 5. The top 15 paths of carbon emission transfer among sectors in Guangdong Province from 2017 to 2030.
This study first compiles a non-competitive I-O table with comparable prices in Guangdong Province from 2002 to 2017 and then uses EGRAS to roughly compile the I-O table in Guangdong Province in 2025 and 2030. Finally, we analyzed carbon emission transfers from 2002 to 2017 and from 2017 to 2030 using HEM. Some findings are as follows:
1) From 2002 to 2017, the average proportion of carbon emission output of the production and supply of electricity and heat sector reached 72.11%, that remains the most important CO2 emission exporter. In 2017, the proportion of embodied emission input of construction sector reached 17.02%, while that in other service sectors was 15.92%. Among the carbon transfer paths, the carbon linkage between the production and supply of electricity and heat sector as exporter, and construction sector and other service sectors as importers are the most critical carbon transfer paths. In 2017, the other service sector transferred 38.92 Mt of carbon emissions from the production and supply of electricity and heat sector, surpassing the path between the construction sector and the production and supply of electricity and heat sector as the largest carbon emission transfer path.
2) In 2017–2030, the production and supply of the electricity and heat sector was still the main exporter with the highest CO2 emission output, but the proportion of carbon emission output will decrease significantly, mainly because of decreased dependence on electricity and heat and lower carbon intensity. In 2025, the proportion of embodied emission input of other service sectors will exceed that of the construction sector and will become the leading CO2 emission importer. By 2030, the carbon transfer path between the production and supply of electricity and heat sector, and other service sectors will account for 19.31% of carbon emissions.
Carbon transfers between industrial sectors shows that carbon emission reduction policies cannot be targeted only at industries that directly emit higher CO2. An increase in the demand of downstream industrial sectors also results in increased carbon emissions from upstream industries. Therefore, we put forward relevant suggestions on the carbon emission reduction policies of industrial sectors from the supply side and the demand side respectively, hoping to scientifically realize carbon emission reduction from the perspective of the whole industry chain.
On the supply side, most CO2 emission outputs are from the important basic industries such as the energy supply, transportation, and metal processing. Thus, there is a real need to limit direct CO2 emissions reasonably. Second, for the most important embodied CO2 emission exporter, it is also essential to optimize energy structure, and promote the construction of wind power and photovoltaic bases, further improving the exploitation and utilization of renewable energy. In addition, key carbon emission exporters can also improve the energy utilization rate in their own production processes, which reduces energy consumption to a certain extent, thereby achieving the goal of carbon emission reduction. The government can also encourage relevant sectors to adopt green and clean technology for production and accelerate the technological development of clean energy to directly reduce CO2 emissions.
On the demand side, it is also required to reduce the demand of these sectors such as the construction sector and other service sectors on the premise of maintaining the stable development of the industry. This eases CO2 reduction pressure on the upstream production industries. Specifically, the industrial sector can improve the efficiency of electricity usage and reduce unnecessary losses.
Overall, it is required to scientifically monitor the carbon transfer path among the main carbon emission exporters and importers, especially the path involving the energy supply sector, pay close attention to the carbon correlation changes among industries, and further explore the main drivers behind the path. Thus, corresponding measures can be taken to address different carbon transfer paths to achieve more scientific and efficient carbon emission reductions while maintaining stable economic growth.
This study mainly studies the carbon emission transfer between industrial sectors in Guangdong Province based on the input-output table, and analyzes the main carbon emission transfer sectors and paths. In this study, the industrial sectors such as the metal smelting and rolling sector are the main carbon emitters, while other studies have shown that industrial land use affects economic performance and regional carbon emissions (Pan et al. (2021); Shu and Xiong (2019)). Therefore, in the future, we can further explore how to achieve urban carbon emission reduction more effectively from the perspective of land use and industrial space layout.
The raw data supporting the conclusion of this article will be made available by the authors, without undue reservation.
JJ and WL contributed to the conception and design of the study. WL analyzed the model and drafted the manuscript. XL provided data and method support. All authors contributed to the article and approved the submitted version.
This research was supported by the Scientific Research Staring Fund for Introduced Talents, Harbin Institute of Technology, Shenzhen (GA11409016 and XIAO20220080).
The authors thank the editor and reviewers of this manuscript.
The authors declare that the research was conducted in the absence of any commercial or financial relationships that could be construed as a potential conflict of interest.
All claims expressed in this article are solely those of the authors and do not necessarily represent those of their affiliated organizations, or those of the publisher, the editors and the reviewers. Any product that may be evaluated in this article, or claim that may be made by its manufacturer, is not guaranteed or endorsed by the publisher.
The Supplementary Material for this article can be found online at: https://www.frontiersin.org/articles/10.3389/fenvs.2023.1216279/full#supplementary-material
Bai, H., Feng, X., Hou, H., He, G., Dong, Y., and Xu, H. (2018). Mapping inter-industrial co2 flows within China. Renew. Sustain. Energy Rev. 93, 400–408. doi:10.1016/j.rser.2018.05.054
Dai, F., Yang, J., Guo, H., and Sun, H. (2021). Tracing co2 emissions in China-us trade: A global value chain perspective. Sci. Total Environ. 775, 145701. doi:10.1016/j.scitotenv.2021.145701
Deng, G., Wang, L., and Xu, X. (2018). Linkage effect of virtual water trade in China's industrial products—Based on generalized hypothetical extraction method. Ecol. Indic. 93, 1302–1310. doi:10.1016/j.ecolind.2018.06.019
Du, H., Chen, Z., Peng, B., Southworth, F., Ma, S., and Wang, Y. (2019). What drives CO2 emissions from the transport sector? A linkage analysis. Energy (Oxf) 175, 195–204. doi:10.1016/j.energy.2019.03.052
Du, Q., Guo, X., Bao, T., Huang, Y., and Han, X. (2020). CO2 flows in the inter-regional and inter-sectoral network of the Yangtze River economic zone. Environ. Sci. Pollut. Res. Int. 27, 16293–16316. doi:10.1007/s11356-020-08129-0
Du, Q., Xu, Y., Wu, M., Sun, Q., Bai, L., and Yu, M. (2018). A network analysis of indirect carbon emission flows among different industries in China. Environ. Sci. Pollut. Res. Int. 25, 24469–24487. doi:10.1007/s11356-018-2533-x
Duarte, R., Sánchez-Chóliz, J., and Bielsa, J. (2002). Water use in the Spanish economy: An input–output approach. Ecol. Econ. 43, 71–85. doi:10.1016/S0921-8009(02)00183-0
Fang, D., Cai, Q., Wu, F., Chen, B., and Zhang, L. (2022). Modified linkage analysis for water-land nexus driven by interregional trade. J. Clean. Prod. 353, 131547. doi:10.1016/j.jclepro.2022.131547
He, Z., and Liu, L. (2018). A comparative study on the improvement of the GRAS method for updating the social accounting matrix and input-output table. Quantitative Tech. Econ. 35, 142–161. doi:10.13653/j.cnki.jqte.2018.11.009
Hertwich, E. G. (2021). Increased carbon footprint of materials production driven by rise in investments. Nat. Geosci. 14, 151–155. doi:10.1038/s41561-021-00690-8
Hou, H., Bai, H., Ji, Y., Wang, Y., and Xu, H. (2020). A historical time series for inter-industrial embodied carbon transfers within China. J. Clean. Prod. 264, 121738. doi:10.1016/j.jclepro.2020.121738
Hou, H., Wang, J., Yuan, M., Liang, S., Liu, T., Wang, H., et al. (2021). Estimating the mitigation potential of the Chinese service sector using embodied carbon emissions accounting. Environ. Impact Assess. Rev. 86, 106510. doi:10.1016/j.eiar.2020.106510
Huang, Y., and Zhang, Y. (2023). Digitalization, positioning in global value chain and carbon emissions embodied in exports: Evidence from global manufacturing production-based emissions. Ecol. Econ. 205, 107674. doi:10.1016/j.ecolecon.2022.107674
Jiang, M., Gao, X., Guan, Q., Hao, X., and An, F. (2019). The structural roles of sectors and their contributions to global carbon emissions: A complex network perspective. J. Clean. Prod. 208, 426–435. doi:10.1016/j.jclepro.2018.10.127
Li, M., Li, Q., Wang, Y., and Chen, W. (2022a). Spatial path and determinants of carbon transfer in the process of inter provincial industrial transfer in China. Environ. Impact Assess. Rev. 95, 106810. doi:10.1016/j.eiar.2022.106810
Li, Q., Wu, S., Lei, Y., Li, S., and Li, L. (2021). Evolutionary path and driving forces of inter-industry transfer of co2 emissions in China: Evidence from structural path and decomposition analysis. Sci. Total Environ. 765, 142773. doi:10.1016/j.scitotenv.2020.142773
Li, Q., and Xue, T. (1998). Analysis of China's economic development sector. China: China Statistics Press.
Li, Y., and Li, H. (2022). China's inter-regional embodied carbon emissions: An industrial transfer perspective. Environ. Sci. Pollut. Res. Int. 29, 4062–4075. doi:10.1007/s11356-021-15694-5
Li, Z., Li, Z., and Song, Y. (2022b). Identification of key provinces and sectors for energy conservation in China: Linkage analyses based on the modified hypothetical extraction method. Energy Strateg. Rev. 44, 100998. doi:10.1016/j.esr.2022.100998
Liu, Q., and Peng, Z. (2010). Comparative price input output sequence table and analysis of China from 1992 to 2005. China: China Statistics Press.
Lu, L. (2019). Research on the compilation method of comparable input-output sequences table-taking China's 1987-2015 input-output tables as an example. dissertation/master's thesis (Kunming, China: Yunnan University of Finance and Economics). [Kunming (Yunnan)].
Ma, N., Li, H., Tang, R., Dong, D., Shi, J., and Wang, Z. (2019). Structural analysis of indirect carbon emissions embodied in intermediate input between Chinese sectors: A complex network approach. Environ. Sci. Pollut. Res. Int. 26, 17591–17607. doi:10.1007/s11356-019-05053-w
Pan, H., Yang, T., Jin, Y., Dall'Erba, S., and Hewings, G. (2021). Understanding heterogeneous spatial production externalities as a missing link between land-use planning and urban economic futures. Reg. Stud. 55, 90–100. doi:10.1080/00343404.2019.1701186
Sajid, M. J. (2020). Inter-sectoral carbon ties and final demand in a high climate risk country: The case of Pakistan. J. Clean. Prod. 269, 122254. doi:10.1016/j.jclepro.2020.122254
Schultz, S. (1977). Approaches to identifying key sectors empirically by means of input-output analysis. J. Dev. Stud. 14, 77–96. doi:10.1080/00220387708421663
Shu, H., and Xiong, P. (2019). Reallocation planning of urban industrial land for structure optimization and emission reduction: A practical analysis of urban agglomeration in China's Yangtze River delta. Land Use Policy 81, 604–623. doi:10.1016/j.landusepol.2018.11.034
Sun, L., and Fang, S. (2022). Irrational carbon emission transfers in supply chains under environmental regulation: Identification and optimization. Sustainability 14, 1099. doi:10.3390/su14031099
Sun, L., Qin, L., Taghizadeh-Hesary, F., Zhang, J., Mohsin, M., and Chaudhry, I. S. (2020). Analyzing carbon emission transfer network structure among provinces in China: New evidence from social network analysis. Environ. Sci. Pollut. Res. Int. 27, 23281–23300. doi:10.1007/s11356-020-08911-0
Tao, T., and Wen, G. (2022). Research on accounting of provincial carbon transfer: Based on the empirical data of 30 provinces in China. Environ. Sci. Pollut. Res. Int. 29, 40984–40996. doi:10.1007/s11356-021-17410-9
Wang, Q., and Han, X. (2021). Is decoupling embodied carbon emissions from economic output in Sino-us trade possible? Technol. Forecast Soc. Change 169, 120805. doi:10.1016/j.techfore.2021.120805
Wang, S., Wang, X., and Tang, Y. (2020). Drivers of carbon emission transfer in China—An analysis of international trade from 2004 to 2011. Sci. Total Environ. 709, 135924. doi:10.1016/j.scitotenv.2019.135924
Wang, W., and Hu, Y. (2020). The measurement and influencing factors of carbon transfers embodied in inter-provincial trade in China. J. Clean. Prod. 270, 122460. doi:10.1016/j.jclepro.2020.122460
Wang, X., Yu, J., Song, J., Di, X., and Wang, R. (2021a). Structural evolution of China's intersectoral embodied carbon emission flow network. Environ. Sci. Pollut. Res. Int. 28, 21145–21158. doi:10.1007/s11356-020-11882-x
Wang, Y., Wang, X., Chen, W., Qiu, L., Wang, B., and Niu, W. (2021b). Exploring the path of inter-provincial industrial transfer and carbon transfer in China via combination of multi-regional input–output and geographically weighted regression model. Ecol. Indic. 125, 107547. doi:10.1016/j.ecolind.2021.107547
Wang, Y., and Yao, J. (2022). Complex network analysis of carbon emission transfers under global value chains. Environ. Sci. Pollut. Res. Int. 29, 47673–47695. doi:10.1007/s11356-022-19215-w
Weber, C. L., Peters, G. P., Guan, D., and Hubacek, K. (2008). The contribution of Chinese exports to climate change. Energy Policy 36, 3572–3577. doi:10.1016/j.enpol.2008.06.009
Wen, W., Li, Y., and Song, Y. (2022). Assessing the “negative effect” and “positive effect” of Covid-19 in China. J. Clean. Prod. 375, 134080. doi:10.1016/j.jclepro.2022.134080
Xia, Q., Tian, G., and Wu, Z. (2022). Examining embodied carbon emission flow relationships among different industrial sectors in China. Sustain Prod. Consum. 29, 100–114. doi:10.1016/j.spc.2021.09.021
Xu, L. (2016). Compile and analysis of China comparable price carbon emissions input-output table. dissertation/master's thesis (Beijing, China: Capital University of Economics and Business).
Zhang, H., Xia, M., Su, R., and Lin, C. (2021). The compilation of the time series input-output tables in China: 1981—2018. Stat. Res. 38, 3–23. doi:10.19343/j.cnki.11-1302/c.2021.11.001
Zheng, X., Yu, H., and Yang, L. (2022). Factor mobility, industrial transfer and industrial carbon emission: A spatial matching perspective. Front. Environ. Sci. 10. doi:10.3389/fenvs.2022.822811
Keywords: embodied carbon transfers, hypothetical extraction method, EGRAS method, industrial sectors, Guangdong
Citation: Liu W, Ji J and Liu X (2023) Inter-industrial embodied carbon transfers in a developed subnational region: a case study of Guangdong Province, China. Front. Environ. Sci. 11:1216279. doi: 10.3389/fenvs.2023.1216279
Received: 03 May 2023; Accepted: 27 July 2023;
Published: 04 August 2023.
Edited by:
Fayyaz Ahmad, Lanzhou University, ChinaReviewed by:
Haozhi Pan, Shanghai Jiao Tong University, ChinaCopyright © 2023 Liu, Ji and Liu. This is an open-access article distributed under the terms of the Creative Commons Attribution License (CC BY). The use, distribution or reproduction in other forums is permitted, provided the original author(s) and the copyright owner(s) are credited and that the original publication in this journal is cited, in accordance with accepted academic practice. No use, distribution or reproduction is permitted which does not comply with these terms.
*Correspondence: Junping Ji, amlqdW5waW5nQGhpdC5lZHUuY24=
Disclaimer: All claims expressed in this article are solely those of the authors and do not necessarily represent those of their affiliated organizations, or those of the publisher, the editors and the reviewers. Any product that may be evaluated in this article or claim that may be made by its manufacturer is not guaranteed or endorsed by the publisher.
Research integrity at Frontiers
Learn more about the work of our research integrity team to safeguard the quality of each article we publish.