 R. De Jesus Crespo
 M. Valladares-Castellanos
 Volodymyr V. Mihunov
 T. H. Douthat
94% of researchers rate our articles as excellent or good
Learn more about the work of our research integrity team to safeguard the quality of each article we publish.
Find out more
ORIGINAL RESEARCH article
Front. Environ. Sci., 04 September 2023
Sec. Conservation and Restoration Ecology
Volume 11 - 2023 | https://doi.org/10.3389/fenvs.2023.1214037
This article is part of the Research TopicModeling the Human Well-being Benefits of Ecosystem Restoration and Management for Environmental Decision MakingView all 11 articles
Impounding surface waters in reservoirs is a major mechanism for providing water for human consumption, including potable water, hydroelectric power, and industrial uses. Building reservoirs incurs environmental and social costs, and therefore safeguarding their effectiveness and longevity is a concern of clear public interest. One factor that affects the longevity of reservoirs is sedimentation, a process exacerbated by land use conversion in upstream watershed areas. Despite the economic importance of preventing sedimentation in existing reservoirs, few consumers are aware of the natural features that provide sediment retention services and the relevance of their conservation in their daily lives. Moreover, managing for landscape level sediment retention services is challenging due to a lack of clarity regarding supply and demand flows that transcend watershed boundaries and jurisdictions. Our study seeks to bridge these gaps by characterizing the flow of sediment retention services to reservoirs and link these services to the specific consumers that benefit using a socio-ecological network (SEN) framing. We conducted this study on the island of Puerto Rico (PR), the population of which is heavily reliant on reservoirs as a primary water resource, while experiencing severe and chronic reservoir sedimentation problems. Our study models avoided sediment export, and the costs were averted thanks to this service. We characterized protection as opposed to vulnerability of these sediment retention services by estimating the proportion of natural areas under some form of legal conservation status and the level of landscape fragmentation. We frame these services as an SEN by using water distribution lines as links to estimate the number of beneficiaries and their location relative to the reservoir’s water source. Our results identify watersheds with conservation needs, their beneficiaries, and where within those watersheds to prioritize conservation efforts to safeguard access to clean water in PR. More broadly, our study provides a model case study for establishing supply and demand service flows of water purification services and demonstrating the utility of mapping socio-ecological networks of service flows in order to justify conservation policies based on ecosystem services.
Reservoirs are among the most important sources of freshwater for human consumption, with uses ranging from household to industrial consumption, agricultural irrigation, hydropower, and flood control. With population growth and the ever increasing consumption patterns, the demand for freshwater has led to the impoundment of many of the world’s rivers and tributaries. Today, it is estimated that over 60% of the major rivers worldwide are interrupted by dams, and often at the expense of altering the river’s connectivity and ecological function (Grill et al., 2019), including changes in flow regime (Poff and Zimmerman, 2009), geomorphology (Chong et al., 2021), and the migratory routes of aquatic fauna, all leading to freshwater biodiversity decline (Turgeon et al., 2019). Given their importance across the major sectors of society, and the environmental costs that they represent, ensuring the effective functioning and longevity of existing reservoirs (and hence preventing the need for developing new dams) should be a key societal priority.
The most important driver of reservoir lifespan decline is sedimentation (Podolak and Doyle, 2015). Sedimentation is largely caused by natural processes in the upstream watersheds of reservoirs, including erosion, landslides, and instream deposition (Schleiss et al., 2016); however, anthropogenic land uses such as deforestation, agriculture, and urbanization can also accelerate reservoir sedimentation rates (Gellis et al., 2006; Yuan et al., 2015; Attulley et al., 2022). Conversely, natural areas, such as forests and wetlands, have the capacity to mitigate erosion and retain eroded sediments, helping prevent their deposition in streams and rivers (Hammel et al., 2015; Guerra et al., 2016). The conservation of these sediment retention ecosystem services (ES) should therefore be incorporated into reservoir management strategies, which often rely solely on reactive and costly approaches such as reservoir dredging.
Incorporating watershed-scale ES management for reservoir longevity requires clearly defining the extent of the services and the beneficiaries of such services. Accordingly, an increasing number of studies have focused on mapping and identifying the service flows from ES supply and demand (Wei et al., 2017). In the context of water quality, ES supply consists of upstream to downstream watershed-scale hydrological processes including evapotranspiration, infiltration, and runoff generation, which influence water purification and erosion control. Mapping the extent of hydrological ES supply has been advanced by remote sensing and geographic information system technology that facilitates access to spatially explicit data on topography, land cover, soil, and climate. These data can be used as inputs for existing hydrological modeling approaches (Renard et al., 1997; Borselli et al., 2008), which in turn have been incorporated into user-friendly platforms readily accessible to ES managers (Hamel et al., 2015; Sharp et al., 2020).
For ES demand, clearly defining the spatial relationships related to hydrological ES flows is an important step toward coordinated governance strategies that explicitly link the diverse set of influential actors and users for a more strategic watershed management. While the mapping of ES supply is now more accessible than ever, the governance capacity of ES flows has been challenging due to a lack of landscape-level policy support systems and tools, as well as the difficulty of communicating the social and economic importance of landscape-level ES to relevant stakeholders and end-users (De Groot et al., 2010).
One way to do so is to frame the system of services as a network graph, with nodes and links (or edges in network terminology) connecting landscapes to people via a mix of natural and constructed features (Felipe-Lucia et al., 2021, Figure 1). This approach to describing the relational components of coupled systems exemplifies a socio-ecological network (SEN) framing (Sayles and Baggio, 2017; Sayles et al., 2019; Felipe-Lucia et al., 2021). Incorporating SEN framing allows for linking the spatial and scalar dimensions of the functions that support the landscape production of ES (e.g., river stream networks) to the scales of demand and consumption for the final services and their linkage to human populations (i.e., pipelines connecting water sources to households). There is a need for the standardization of ES structures and for mapping ES social and economic values (De Groote et al., 2010). SEN framing facilitates the standardization of dyadic components of ES flows (nodes and ties) and also the mapping of service flows to end-users. This is in turn important for valuing tradeoffs from different policy decisions related to planning infrastructure and land use that impact landscape functions.
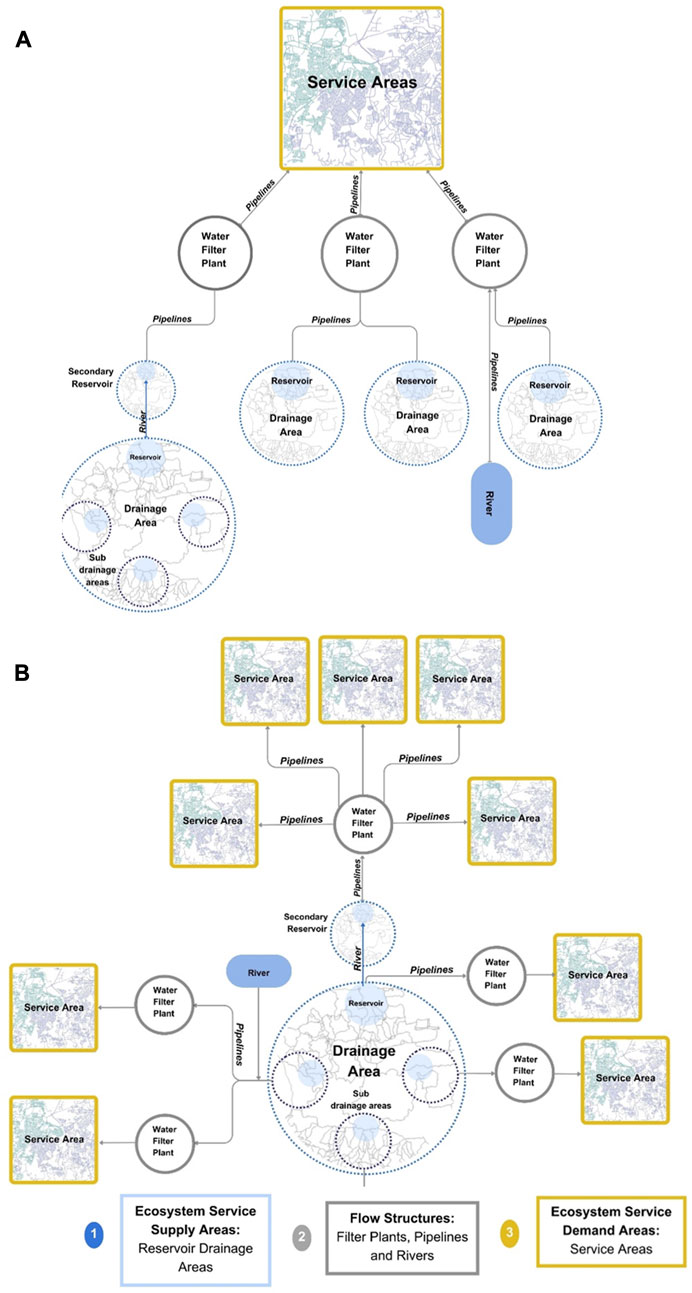
FIGURE 1. Conceptual representation of the sediment retention ecosystem service supply and demand flows using an SEN approach. Panel (A) represents the network of a single service area, which represents the location of end users and their linkages to several reservoirs and their respective watershed areas. Panel (B) represents the network of a single reservoir’s watershed area and its linkages to multiple service areas. We present an example of each of these derived from our data in Figure 6.
In the case of sediment retention services, the important nodes are the landscape units (watersheds and micro-catchments), the reservoirs, the filter plants, and the service areas to consumers. They are linked by flows, or edges, via natural features such as streams in the case of the landscape-to-reservoir networks, which then connect to the constructed features of pipe networks to filter plants and then to end-users. Applying an SEN framework can help identify the natural and human components of ecosystem supply and demand, allowing researchers to focus more concretely on sometimes hard to conceptualize inter-relationships. In doing so, it helps inform management within complex systems, especially questions of governance in spatially mismatched systems (Bodin et al., 2019; Sayles et al., 2019; Wang et al., 2019), as is the case with sediment retention and other hydrological ecosystem services.
In this study, we will use the SEN framework to fully characterize the sediment retention service flows for reservoirs in the Caribbean Island of Puerto Rico (PR). The reservoirs in PR are the primary water resource for the majority of PR’s population (Ortiz-Zayas et al., 2004; PRDNER, 2008a; Quiñones, 2022). They are also important for hydroelectric power generation, flood control, fisheries, and recreation (Ortiz-Zayas et al., 2004). Most of PR’s reservoirs have experienced significant capacity loss due to sedimentation (Ortiz-Zayas et al., 2004; PRDNER, 2008b; Quiñones, 2022). Reservoir capacity losses in PR due to sedimentation range from 12% to 81%, depending on topography, rainfall patterns, and anthropogenic impact (USGS, 2019).
The effects of climate change (droughts, more frequent hurricanes, and floods) could potentially exacerbate reservoir capacity loss in the future, increasing the need for preventative watershed-scale sediment management strategies. For example, in PR, the recent hurricanes Maria, Irma (2017), and Fiona (2022) contributed to a severe capacity loss for many of the island’s reservoirs, including a 16% capacity reduction for Dos Bocas, one of the most important reservoirs of the island, rendering its remaining lifespan to 37 years (Quinones, 2022). Moreover, 88 million dollars of the Federal Emergency Management Agency (FEMA) disaster recovery funds for PR have been allocated for the dredging of another important reservoir that became severely affected due to recent hurricanes (FEMA, 2022a). The critical state of the island’s reservoirs makes them especially vulnerable to droughts, as evidenced in the period of 2014–2016, when a severe drought compromised access to potable water on the Island, requiring the implementation of rationing practices to households during the summer months and resulting in severe agricultural losses (PRDNER, 2016). These events show that PR’s water resources are vulnerable to climatic events and should be prioritized for preventive management. The recent influx of federal resilience planning (FEMA, 2022b), and more recently for nature-based solutions (NOAA, 2023) to PR, suggest the need for empirical data and strategies to support effective prioritization and management.
Our specific objectives for this project are as follows: 1) to quantify and value the sediment retention services upstream of important reservoirs for water consumption, 2) to determine the location of the beneficiaries of these services and create service-shed network maps illustrating the flows of supply to demand, and 3) to determine the vulnerability of these service flows by looking at the level of legal protection and/or fragmentation of natural areas. Addressing these objectives would help inform prioritization for watershed level management of the reservoirs in PR. Moreover, by framing these objectives around an SEN approach, this study provides practical steps for operationalizing the study of ES flows and helps inform their management. While the outputs of this study most directly inform ES flow management by environmental and water resource agencies, authorities, and engaged advocacy groups, our study also provides information that can aid in creating greater general awareness about ES flows, what areas are important for conservation, and who benefits from them. The connection of water consumer geographies to relevant ES landscape units can be useful for a broad swath of the society, ranging from concerned individuals to clients of water utilities, as well as grassroots organizations interested in community-based planning and engagement.
Puerto Rico is a Caribbean island with an estimated 3,221,789 inhabitants, a population density of 960 people per square mile, and a total land area of 3,424.32 square miles (US Census, 2022, data as of June 2022). Annually, temperature averages range from 22 to 25°C in the mountains to 24–27°C in coastal areas (USGS, 2013). A central mountain range divides the north and south ends of the Island, creating distinct rainfall patterns. Rainfall in the most humid areas of PR can reach 169 inches/year (4292.6 mm/yr), whereas in the most arid regions, it averages 30 inches/year (762 mm/yr) (USGS, 2016). Overall, the island has a tropical climate with local microclimatic variations due to topography and trade winds.
From the environmental governance perspective, PR is well-positioned to develop landscape-level management efforts compared to other US jurisdictions with more decentralized planning systems. A centralized Puerto Rico Planning Board was created during the New Deal and aimed to create comprehensive economic and land use planning through a centralized government entity (Howell, 1952; Pico, 1953). Water utilities and sewer systems are also centralized under a single utility, Puerto Rico Aqueduct and Sewer Authority (PRASA), the Puerto Rico Department of Natural and Environmental Resources (DNER) has been the island’s resource and pollution regulator since the 1970s, and a Joint Permit Regulation for Construction Works and Land Use issued by the Puerto Rico Planning Board governs land use permit under the Puerto Rico Planning Board Organic Act (1975) (Diaz-Garayua and Guilbe-Lopez, 2020), but other functions, e.g., administering local collections and parcel inventories, are part of the Puerto Rico Municipal Revenue Collections Center (CRIM). Within that context, the 1991 Autonomous Municipalities Act provided significant power for some planning and permitting and revenue activities, as well as traditional roles with local infrastructure (e.g., municipal roads) to many municipalities, leading to greater fragmentation in decision-making. However, within this system, much of the coordination and informatics for planning is still managed by the planning board, which was authorized in 2004 to create a Puerto Rico Land Use Plan, harmonizing land use classification and zoning, in conjunction with existing municipal plans throughout the entirety of PR. The plan was enacted in 2015 with land use classifications, and specific zoning is contained in the Territorial Ordainment Plan for each municipality where applicable (USGS, 2015). The combination of partial Municipal planning control, strong mayoral political power, private property rights and interests, and a mix of statewide planning authorities means that Puerto Rico is somewhat polycentric in terms of the landscape management scale, but amenable in structure and size to comprehensive landscape approaches.
These approaches may be collaborative or polycentric (Berardo and Lubell, 2016, Ansel and Gash, 2018), but they need to define salient landscape scales and areas if collaborative planning is going to operate. Special legislation and participation in national programs has created landscape level watershed efforts in the environmental quality realm, such as the San Juan Bay Estuary (SJBE) program. These efforts recognize challenges for the integration of local and community decision-making into the landscape/watershed context, but face the complexity that watersheds are governed by diverse domains intersecting with planning and infrastructure, not just environmental interests. Within this context, the scales and geographies of ES networks and flows must be defined if they are going to be governed, regardless of whether the policy strategy is centralized or polycentric. However, the collaboration to build structures for landscape governance may require creating forums and by-ins from actors at different scales and domains who can recognize their interdependent interests in governing ES flows, which requires their definition and mapping to resolve information asymmetries. This larger need was identified in the Puerto Rico Water Plan (PRDNER, 2008a), which has not been executed, and is part of the drivers of the legacy challenges to the Puerto Rico water sector.
We applied a watershed scale analysis for this study to help inform water quality governance, focusing on reservoirs supplying water for consumption. Puerto Rico has 36 reservoirs that have been used directly for services such as hydroelectric power generation, irrigation, and water consumption, as well as indirect services, such as flood control and recreation (Ortiz-Zayas et al., 2004; Quiñones, 2022). It is estimated that 70% of the potable water handled by the PRASA comes from reservoirs (Ortiz-Zayas et al., 2004; Quiñones, 2022) and that 96% of the residents of PR are served by PRASA (USGS, 2018). Most of the reservoirs are located in the central mountainous region to take advantage of the abundant rainfall in this area (Ortiz-Zayas et al., 2004). All reservoirs have seen reduction in their capacity due to high sedimentation rates, representing an important issue for water resource conservation in the Island (Ortiz-Zayas et al., 2004; Quiñones, 2022). Out of the existing reservoirs, we selected the trends on 20 reservoirs for detailed study (Table 1) due to their current importance for water consumption, excluding those that are no longer in use or that are primarily used for other purposes. We also included in our study a small artificial lagoon (Retencion Acueducto Norte, RAN Table 1), which is downstream from one of the major reservoirs (Dos Bocas) and which contributes water to one of the most important pipelines of the Island the “Acueducto Norte'' (Ortiz-Zayas et al., 2004). The selected reservoirs had watershed areas ranging from 4 to 498 km2 (Table 1). The sediment retention supply calculations focus on these watershed areas (entire upstream drainages including all stream tributaries) and also on the micro-catchment areas (the drainage areas of individual tributaries) within these larger watersheds (Figure 5). We conducted our analysis at both scales in order to provide concise summaries and valuations broadly (watershed scale) and create maps to identify areas within the watersheds that provide the most services currently and that could be targeted for conservation (micro-catchment scale).
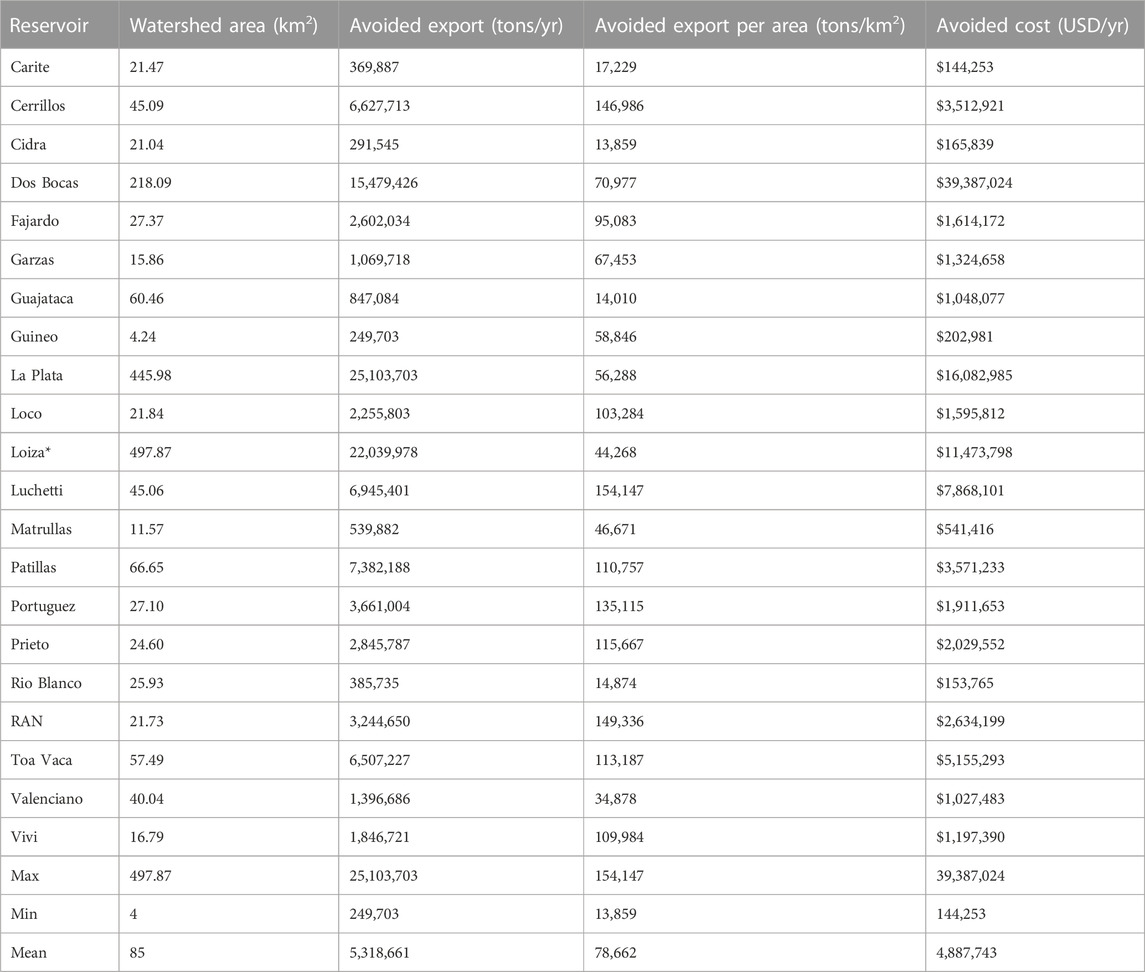
TABLE 1. Sediment retention service is quantified as avoided sediment exports and avoided dredging costs for the watersheds draining to reservoirs in Puerto Rico. * Loiza is also called Carraizo.
To estimate sediment retention ecosystem services, we used the Integrated Valuation of Ecosystem Services and Tradeoffs (InVEST) modeling platform. InVEST is a suite of open-source modeling software that generates spatially explicit estimates of ecosystem services which can then be used for environmental management applications (Natural Capital Project, 2022). We applied the sediment retention (SR) model (Hamel et al., 2015; Sharp et al., 2020) which maps the generation and delivery of sediments from overland erosion to the stream. The model computes the annual soil loss from each pixel (uslei) and the sediment delivery ratio (SDRi), that is, the proportion of the soil loss that was not retained by vegetation and topographic features and thus reached the stream. The product of the two values equals the sediment export from a given pixel, measured in tons⋅ha−1yr−1. Once in the stream, the sediment is assumed to reach its outlet, and no in-stream processes are modeled.
The annual soil loss on pixel i, uslei, measured in tons⋅ha−1yr−1, is estimated using the Revised Universal Soil Loss Equation (RUSLE1; Rendard et al., 1997), which is a widely used and validated erosion model predicting annual soil loss based on runoff, slope, and land cover (Rendard et al., 1997). In particular, RUSLE is a product of five values: Ri—rainfall, erosivity Ki—soil erodibility, and LSi—slope length-gradient, estimated from elevation relationships (slopes) of a given pixel and its neighboring area using multiple flow direction algorithms,
Ci—cover-management factor (usle_c in the biophysical table)
Pi–—support practice factor (usle_p in the biophysical table)
In turn, SDRi, a proportion, is a function of SDRmax, maximum theoretical SDR (chosen based on the input for the entire model), connectivity index, and two other calibration parameters chosen for the model (Borselli’s IC0 and k), which define the function describing the growth of SDR over the connectivity index, which is an S-shaped increasing function. Lower k defines a steeper growth of SDR, and lower IC0 produces a function with higher overall SDR values. The connectivity index, similarly to the slope length-gradient factor, uses multiple flow direction algorithms and captures slope relationships, but in contrast also accounts for the cover-management factor values of pixels. This index hydrologically links the overland sources of sediment to streams (sediment sinks), with its higher values corresponding to higher connectivity, for example, due to the sparse vegetation or higher slope, or vice versa. Once the sediment export is estimated as the product of uslei and SDRi, the retained sediment amounts for each pixel can also be measured as the difference between the sediment generated (uslei) and subsequently exported from the pixel.
For this study, the erosivity raster (R-factor) was acquired from NOAA Coastal Services Center (2014b) and converted from US customary into System International (SI) units by multiplying the raster values by 17.02, as detailed in Appendix A of the USDA RUSLE handbook (Renard et al., 1997). Soil erodibility raster (K-factor) was tabulated from the gNATSGO database (USDA NRCS Soil Survey Staff (2021a) and similarly multiplied by 0.13 to convert into SI units (Renard et al., 1997). The biophysical table for the SDR model contained usle_c and usle_p-values for each land use and land cover (LULC) code and was derived from previous studies (Wischmeier and Smith, 1978; Stone and Hilborn, 2012) and adapted from Smith et al. (2017), which conducted the most recent modeling effort for ES in Puerto Rico. For the land use and land cover layer, the NOAA 2010 Coastal Change Analysis Program (C-CAP) 30 Meter Land Cover of Puerto Rico raster was used (National Oceanic and Atmospheric Administration Office for Coastal Management, 2022). To our knowledge, this is the most recent LULC layer for the Island. It classifies LULC in 23 classes described in detail in the NOAA Office of Coastal Management (2022). A digital elevation model (DEM) raster was required, and for this we used the Advanced Spaceborne Thermal Emission and Reflection Radiometer (ASTER, 2019) data. The ASTER DEM was corrected by filling in sinks (using the fill tool in ArcGIS Pro; Esri, 2022a), and the output stream maps from the InVEST model were confirmed to be consistent with existing stream shapefiles (USGS, 2017). The calibrating parameters were set to default values according to InVEST guidelines (Sharp et al., 2020), and they were as follows: threshold flow accumulation (number of pixels)—100, Borselli K parameter (which was tested at values ranging from 1 to 3, with 0.5 increments; see the validation/calibration section), Borselli IC0- 0.5, maximum SDR (proportion) set at 0.8, and maximum L value 122.
Previous validation studies using the InVEST SR model have found support for the use of the tool for the first-order ES assessment to prioritize and rank areas for conservation (Hamel et al., 2015). The use of local data for model validation and calibration is recommended to improve the performance and accuracy (Hamel et al., 2015; Hamel et al., 2017). Our calibration and validation process is described in the next section.
To validate the outputs of the InVEST SR model, we compared the model’s sediment export estimates from 22 watersheds draining into the reservoirs to the measured values of average annual sedimentation rates on the same reservoirs (Quiñones, 2022). These values were compiled as Mm3 per year, so we converted our tons per year estimates to this unit using the steps detailed in Supplementary Material S1. In addition, the InVEST SR model was tested with different values of the parameter kb, which has been found in previous studies to be the most sensitive to variation (Anjinho et al., 2022). We tested the model with values ranging from 1 to 3, with 0.5 increments, and determined their relative performance using a coefficient of determination criteria (Rauf and Ghumman, 2018; Anjinho et al., 2022). The coefficient of determination values ranged from R2 = 0.72 for kb = 1 to R2 = 0.77 for kb = 3. All the tested models’ performances were classified as “good” according to criteria from previous studies validating observed vs. modeled sediment exports (Rauf and Ghumman, 2018; Anjinho et al., 2022). While the sediment estimates correlated to observations, the estimated values ranged in magnitude based on the kb parameter used (the higher the kb, the higher the value, SM2). Because the InVEST SR model only accounts for overland erosion, and does not include other potential sources of sedimentation (e.g., gully erosion, landslides, and bank erosion), we expected our sediment export estimates to be lower in magnitude than the observations. This was consistently the case for our lower bound estimate (kb = 1).
We also compared our value estimates with those of previous studies on overland erosion rates. Ramos-Sharron and Figueroa-Sanchez (2017) estimated the overland sediment export from coffee farms in the Luchetti watershed which ranged between 14,000 and 29,500 Mg per year (or 15,432 and 32,518 tons per year). By comparison, our model estimated a range of total overland sediment exports in the same watershed of 40,789–130,599 tons per year, as shown in Supplementary Material S2. Considering that coffee farms comprise only a portion of the Luchetti watershed area, our lower bound estimates (k1) may be considered to be within similar value ranges. Another example comes from the Canovanas watershed. We estimated it to have an overland sediment export range between 38 and 220 tons/km2/year (Supplementary Material S2), while an empirical study for this same watershed (Larsen, 2012) estimated the export to be 41 metric tons/km2/year from the overland erosion component of the sediment budget (in that study defined as slopewash and tree throw). We determined from these comparisons, as well as our validation analysis, that our lower bound estimates (kb = 1, SM1) were the most credible based on empirical observations. Therefore, our descriptive analyses will focus around these values. However, for details of the higher bound value estimates, see Supplementary Material S2.
We estimated the present dollar value for the avoided sediment export using the formula described in Sude et al. (2011) (Equation 1):
where SRi is the sediment prevented from entering the water system per pixel and MC is the cost of sediment removal. We estimated the value of sediment removal using the existing estimates of sediment dredging costs. While the actual costs of sediment removal can vary based on the size of the project, the dredging technique, and the sediment disposal approach (Anchor, 2019), we used an estimate of $8 m3, which has been applied in previous studies for calculating reservoir sediment management in the US (Smith et al., 2013). We adjusted the value to $8.64/ton using a conversion factor of 1.08 ton/m3 based on the bulk density estimates of sediments in a reservoir in PR (Soler-Lopez et al., 1997).
However, this is a lower bound, as recent value estimates range between $8 and 60 per m3, considering that the costs of site preparation, management, and sediment disposal are taken into account (Anchor, 2019). In addition, recent estimates from a reservoir dredging project in PR suggest a cost of up to $26 per ton (FEMA, 2022a), so our cost per ton estimate is a lower bound, conservative value. We extrapolated these costs over a 20-year period, applying the equation mentioned previously plus a discount rate of 3% (0.03) per year, based on the Office of Management and Budget guidelines (CEA, 2017), and those used in other similar estimates, which may include rates of 7% in some instances, although some newer recommendations around the social costs of carbon, for example, are using 2%–3% discounting rates (USEPA, 2022). We then estimated the net present value of the average cost per year after adjusting for the discount rate. Our analysis does not include estimates about rates of inflation for infrastructure projects, which should be considered in future studies, or when adopting the final valuation policies.
To estimate the vulnerability of the sediment retention service, we characterized our study watersheds in terms of fragmentation and level of protection. Landscape fragmentation may lead to alterations in ES supply and demand flows (Mitchell et al., 2015). In the context of water purification and runoff reduction, landscape fragmentation can disrupt flow patterns, interrupting the retention capacity of natural areas when they are interspersed with anthropogenic land uses (Mitchell et al., 2015). In addition, we argue that once a landscape is fragmented, it becomes more vulnerable to urbanization. This is because fragmentation leads to a reduction in habitat quality, biodiversity, and ecological function (Mullu, 2016), all of which are factors that are taken into consideration when granting or denying development permits in PR (Puerto Rico Law 241 1999; Puerto Rico Law 416 2004). In addition, once a natural area is fragmented by a road or infrastructure, it becomes more connected to the larger urban infrastructure and more amenable for further development, an effect termed “induced growth” (Cervero, 2003). Conversely, in protected areas, where there are formal legal and planning protections, there would be less vulnerability to fragmentation and to the loss of ES flows.
To quantify fragmentation, we used the 2010 National Land Cover Database of USGS. We estimated at the landscape and class level, the edge density, number of patches, and patch density using the landscapemetrics package in R (Hesselbarth et al., 2019). The landscape metrics were calculated at the micro-catchment and the watershed scale. To quantify vegetation fragmentation, the edge density and patch density values of the land cover classes associated with vegetation were summarized using the weighted average method. The grassland, mixed forest, scrub, palustrine forested wetland, palustrine scrub wetland, palustrine emergent wetland, estuarine forested wetland, estuarine scrub wetland, and estuarine emergent wetland values were weighted as a function of the percentage of land per class (Equation 2).
where CMjw is the class metric weighted value for a site j, CMi is the value per class metric, and PLAND is the percentage of the land cover by the class.
To estimate the level of protection, we used the Protected Areas Database of the United States (PAD-US) 3.0 (USGS & GAP, 2022), A protected area under the PAD-US database is one: “Dedicated to the preservation of biological diversity and to other natural (including extraction), recreation and cultural uses, managed for these purposes through legal or other effective means” (USGS & GAP, 2022). They include land with state or federal protection status (e.g., wilderness areas, national monuments, and area of critical environmental concern) and long-term easements and agreements (USGS & GAP, 2022).
We used the ArcGIS Pro Analysis tools to estimate the percentage of protection per watershed area and micro-catchment. A summary of the steps followed to characterize service supply, protection, and fragmentation is presented in Figure 2.
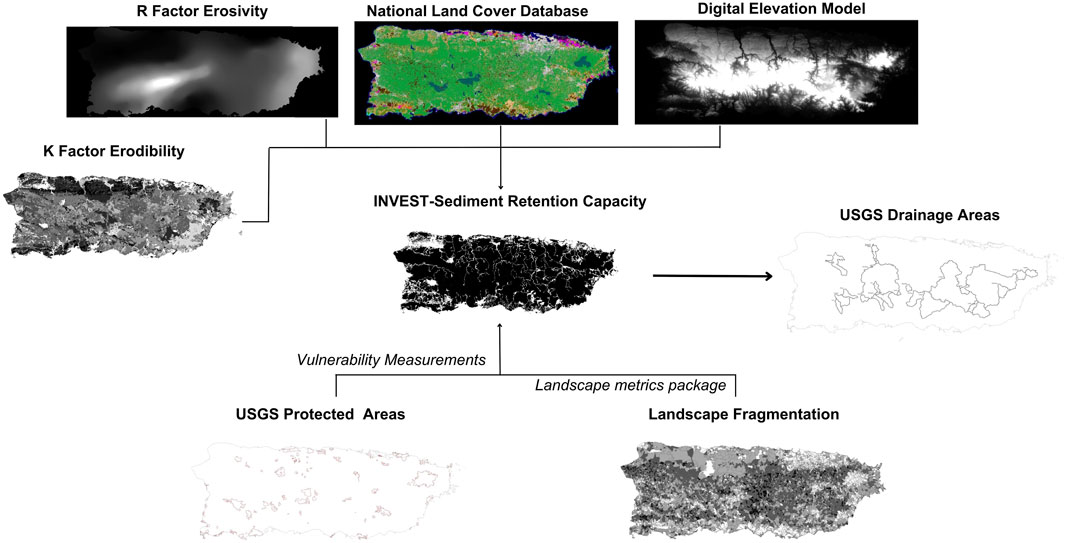
FIGURE 2. Summary of steps followed and data inputs used for the characterization of sediment retention service supply and vulnerability.
A combination of spatial and non-spatial data was used to delineate the service areas and estimate the population served to measure the ES demand. First, the watershed areas and reservoirs were defined as the supply nodes. For this study, the reservoir watershed areas were acquired from the National Water Information System of the United States Ecological Survey (USGS, 2023). The service areas were defined as the demand nodes, and the streams and pipe networks were defined as edges connecting the demand and supply nodes. Furthermore, intermediate structures such as water filtration plants and pipeline pressure zones were used to trace the ES flow along the network.
To identify the service areas associated with the water reservoirs, we joined the 2022 water quality reports provided by the Puerto Rico Aqueduct and Sewer Authority (PRASA, 2021) and the Safe Drinking Water Information System (SDWIS) datasets from the United States Environmental Protection Agency (USEPA, 2023). Second, to map the service areas’ spatial extent, we used the ArcGIS Pro 3.0 spatial analysis tools to join the filter plants, pipelines, and pressure zone network layers from the Puerto Rico Aqueduct and Sewer Authority (Esri, 2020). We summarized the population and number of households within each service area using the ESRI USA Census 2020 Redistricting Blocks layer that joins the U.S. Census Bureau population information and the 2020 TIGER boundaries for Puerto Rico (ESRI, 2022b). Further details about the specific process used to undertake this analysis are provided in Supplementary Material S3.
We compared our service area population estimates with the estimates published online by the PR Aqueduct and Sewer Authority for the reservoirs that they administer (PRASA, 2023). While the PRASA estimates capture the demand for the reservoirs within their supply system, the data do not provide an estimate of demand for reservoirs not administered by PRASA but that also provide water for consumption. In addition, the data do not include location information beyond a list of municipalities, making it difficult to detailed comparison of user demand. Therefore, our approach is intended to 1) provide a more accurate location of service characterization for PR and 2) test the SEN approach for estimating water use demand in locations where specific consumer data are not readily available. Figure 3 shows the workflow followed for the service demand estimates.
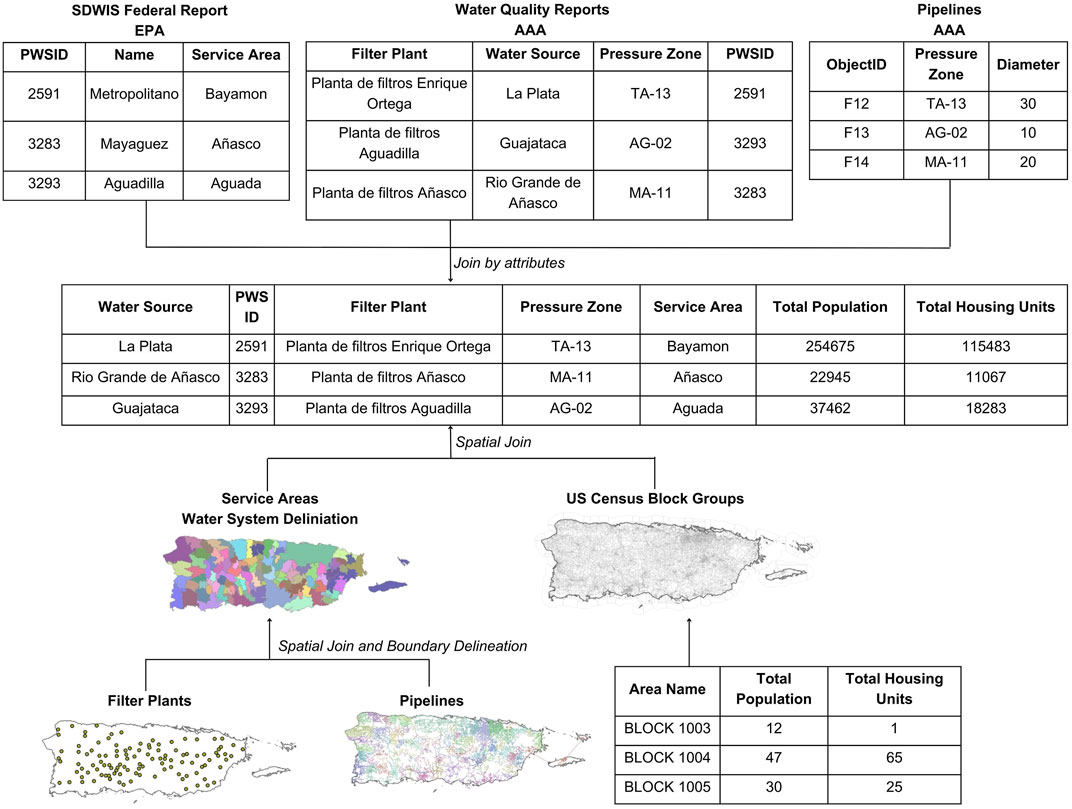
FIGURE 3. Summary of steps followed and the data used to estimate sediment retention ecosystem service demand by users of the reservoirs and water systems of the PR Aqueduct and Sewer Authority (PRASA).
To estimate the actual water demand per household, we used the daily per capita domestic use in PR estimated at 98 gallons (0.37 m3) (Molina Rivera and Irrizary-Ortiz, 2021). We then extrapolated these values to a year, for an estimated annual per capita use of 135 m3. Since the average population per household in PR is 2.74 people (US Census, 2022), this leads to an estimated water use of 370 m3 per household/yr. We multiplied this number by PRASA clients served (when available) or SEN household estimates to estimate the household water demand (Mm3/yr) for each system. For reference, we also include the reservoirs’ current capacity based on data obtained by Quiñones (2022) (SM1) for comparison with our demand estimates.
The watershed scale mean avoided sediment export was 5,318,661 tons/yr and ranged from 249,703 tons/yr to 25,103,703 tons/yr. The watershed with the highest sediment total avoided export was La Plata, and the one with the lowest was Guineo. These values correspond to the relative size of these watersheds, as La Plata is among the largest in area and Guineo among the smallest (Table 1). Corrected by watershed size, the mean avoided export was 78,617 tons/km2. The watershed with the highest per area avoided export value was Luchetti with 154,148 tons/km2, followed by the RAN watershed with 149,336 tons/km2. The lowest per area avoided export was observed in Cidra, with 13,859 tons/km2, followed by Guajataca, with 14,010 tons/km2. The total avoided costs due to the avoided sediment exports ranged from $144,253 to $39,387,024, with an average $4,887,743 avoided costs per year.
According to our SEN estimates, the service demand (households connected) to each reservoir ranged from 1,365 to 250,775 households, with an average of 53,297 households per year (Table 2). Our estimates of the service demand (i.e., household users) were compared against the published values by PRASA of the estimated clients served by their reservoirs (Table 2), and there was a positive correlation of the values (R2 = 0.56). While the number of households served on average by each reservoir was nearly identical (PRASA = 54,935, SEN = 53,407), the values were not comparable for some reservoirs, suggesting a discrepancy that we further address in our Discussion section. The largest discrepancy was found with the Cidra reservoir, which according to our SEN analysis is connected to 170,873 households, while the PRASA estimates that it serves 14,537 households. We speculate that PRASA estimates were corrected by the relative proportion of water extracted from this reservoir to each of these areas under normal conditions, while our study focused mainly on the number of households connected to the reservoir’s network.
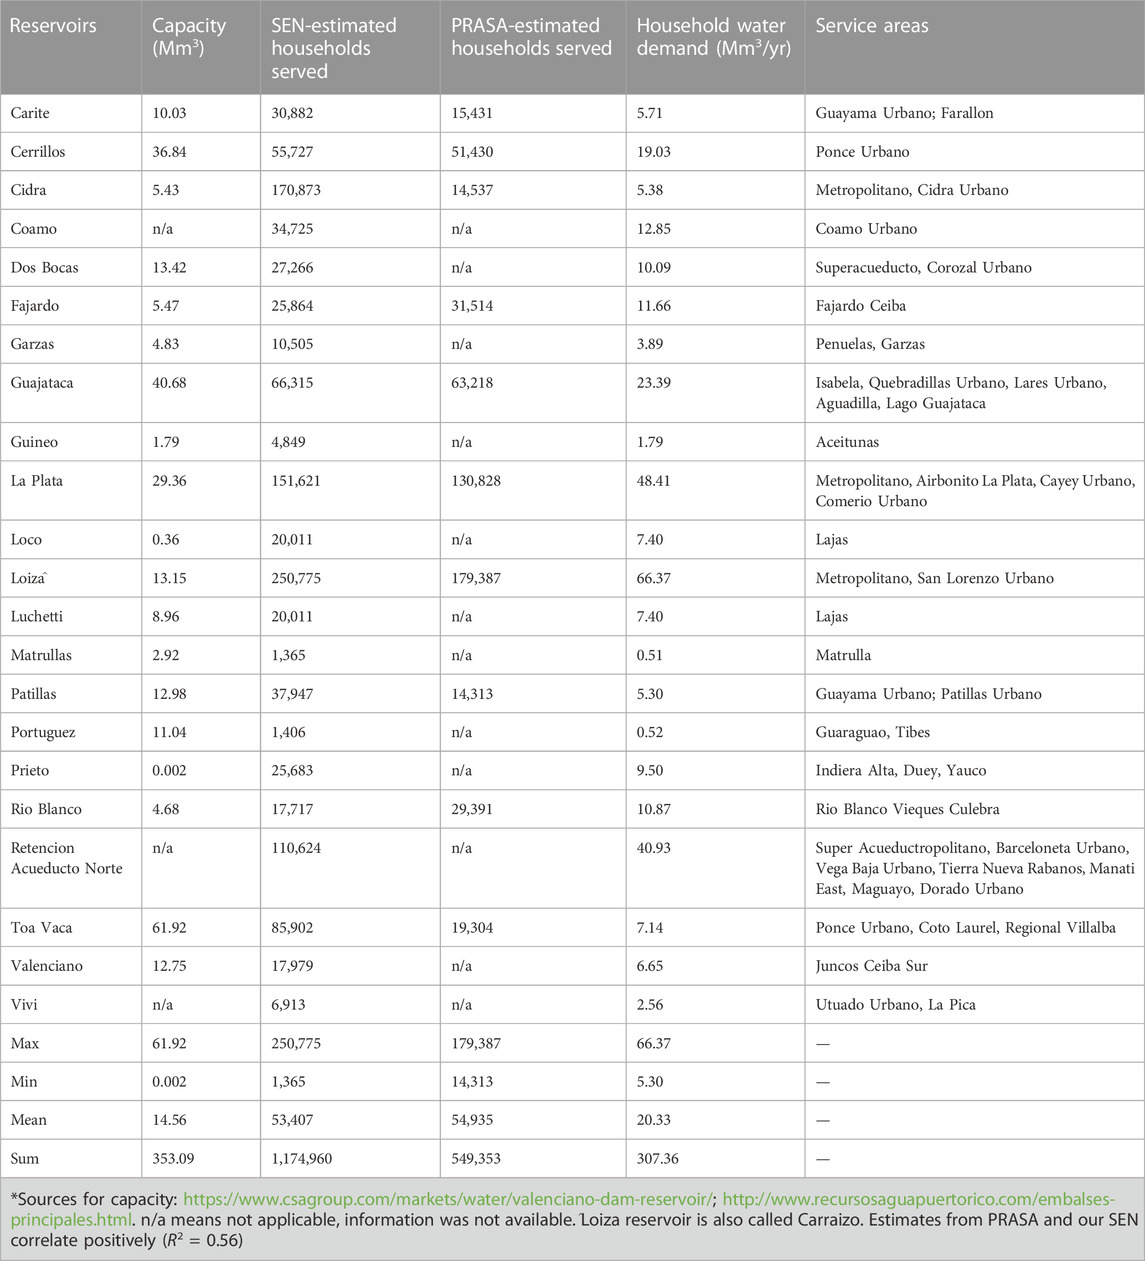
TABLE 2. Sediment retention demand, quantified as the number of people connected to the reservoir (SEN estimates) and characterized by the water systems being served and the reservoir current capacity.
In terms of water demand, we estimated that a total of 307.36 Mm3 of water is consumed annually from all the reservoirs under study, and an average of 20.33 Mm3 per reservoir per year. We validated these values using existing data on actual water withdrawals from the Island. According to Molina-Rivera and Irizarry-Ortiz, (2021), water deliveries for 2020 were 1.48 Mm3/day or 540 Mm3 per year. Considering that surface water accounts for ∼89% of water deliveries (Molina et al., 2019) and reservoirs account for ∼70% of surface water withdrawals (Ortiz-Zayas et al., 2004; Quiñones, 2022), then the total annual water demand is approximately 336 Mm3/year, which is similar to our estimate of 307.36 Mm3/yr. The specific values of water demand per reservoir and how that compares to the current capacity for each of the reservoirs are shown in Table 2.
The percent of natural areas in the watersheds of the studied reservoirs ranged from 50% to 98%, with an average of 82%. The percent protection ranged from 0% to 70%, with an average of 17%. The edge density ranged from 12 to 87 m/ha, with an average of 53 m/ha. The number of patches ranged from 18 to 19,082, with an average of 1,507 patches per watershed area. The patch density ranged from 0 to 5 patches per 100 ha, with an average of two patches per 100 ha.
The watersheds with higher than average avoided exports (service supply, Table 1; Figure 4) in order of value are Dos Bocas, La Plata, Loiza, Luchetti, and Toa Vaca. While all of these watersheds have a high percentage of natural areas (64%–86%), all have relatively low percentage of areas under the legal conservation status (0%–6.6%) (Table 2). Out of these, Toa Vaca had the highest fragmentation (ED = 87.31 m/ha, PD = 4.19). Loiza, La Plata, and Toa Vaca also rank as higher than average in terms of service demand (Table 2; Figure 4).
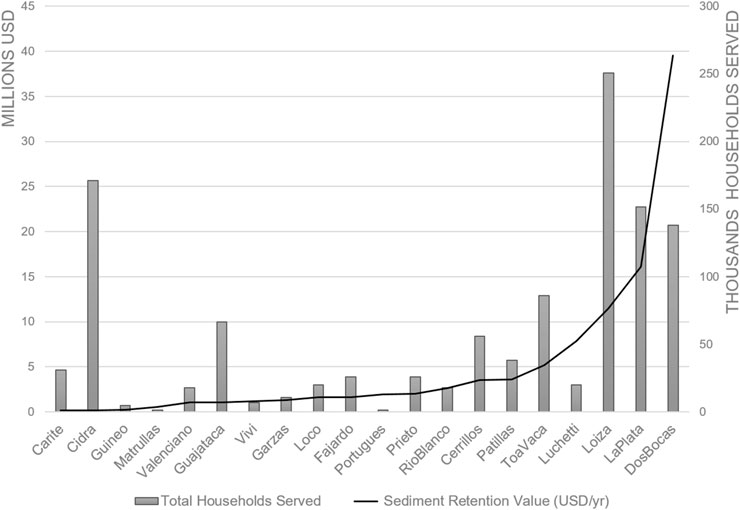
FIGURE 4. Supply vs. demand of sediment retention services. For the reservoir Dos Bocas, we used the estimates of population demand for Retencion Acueducto Norte and Dos Bocas combined (Table 2), as the latter drains and contributes water to the former.
The watersheds with higher than average service demand according to our SEN analysis (in order of demand) are Loiza, Cidra, La Plata, RAN, Toa Vaca, Guajataca, and Cerrillos. Out of these, Cidra and Guajataca had below average service supply in total and corrected by area (Table 1; Figure 4). Cidra stands out as having the lowest natural area (50%), low conservation status (0%, Table 3), and relatively high fragmentation (ED = 60.4, PD = 4.08) (Table 3). Loiza and La Plata have high total service supply and demand (Figure 4), but when correcting by area, they both have a lower than average supply (Table 1). Moreover, the percentage of natural areas under legal conservation status is low for these watersheds (2.79% and 4.15%, respectively, Table 3; Figure 5).
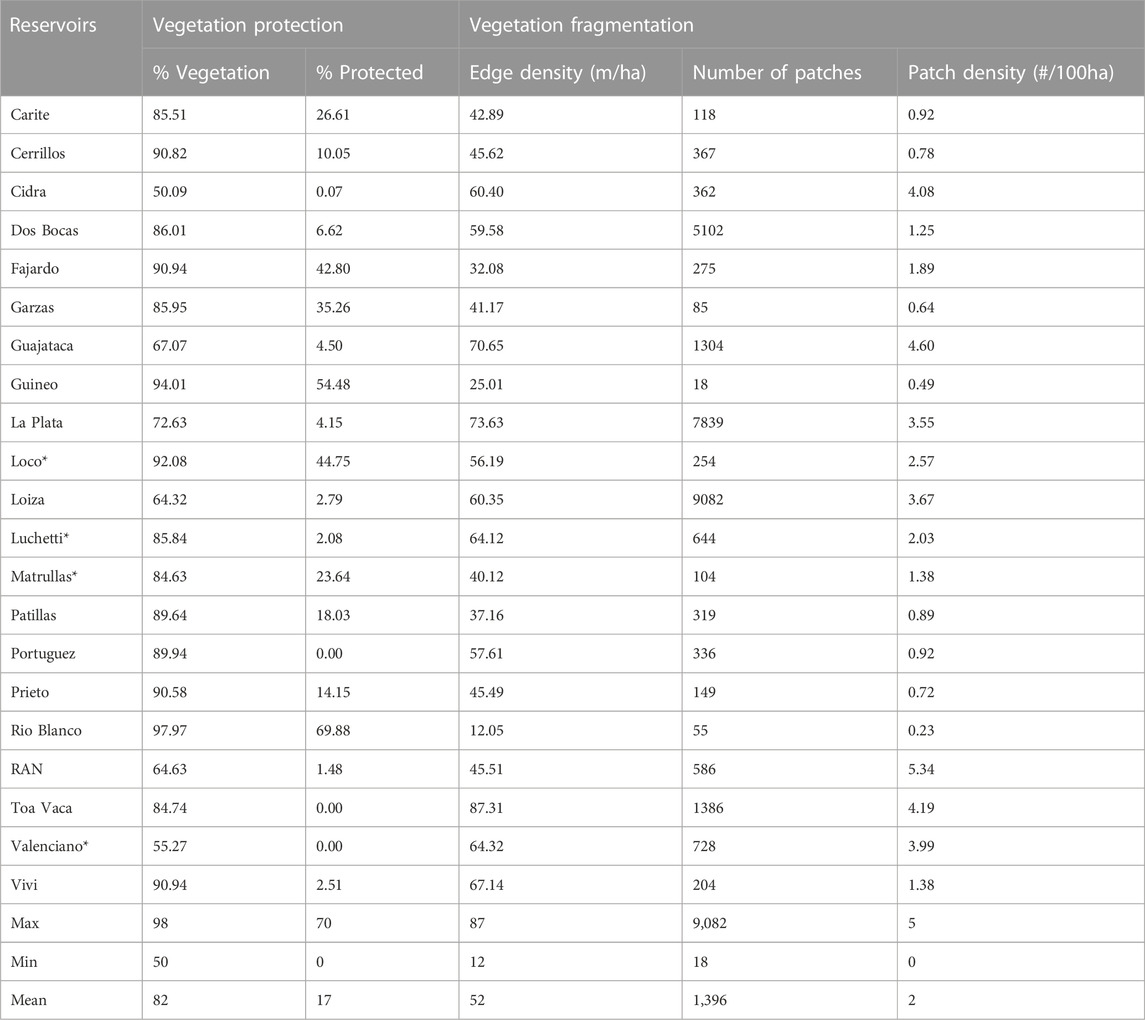
TABLE 3. Vulnerability assessment of sediment retention service, quantified as the percentage of protection, and level of fragmentation of the vegetation in reservoirs’ watershed areas.
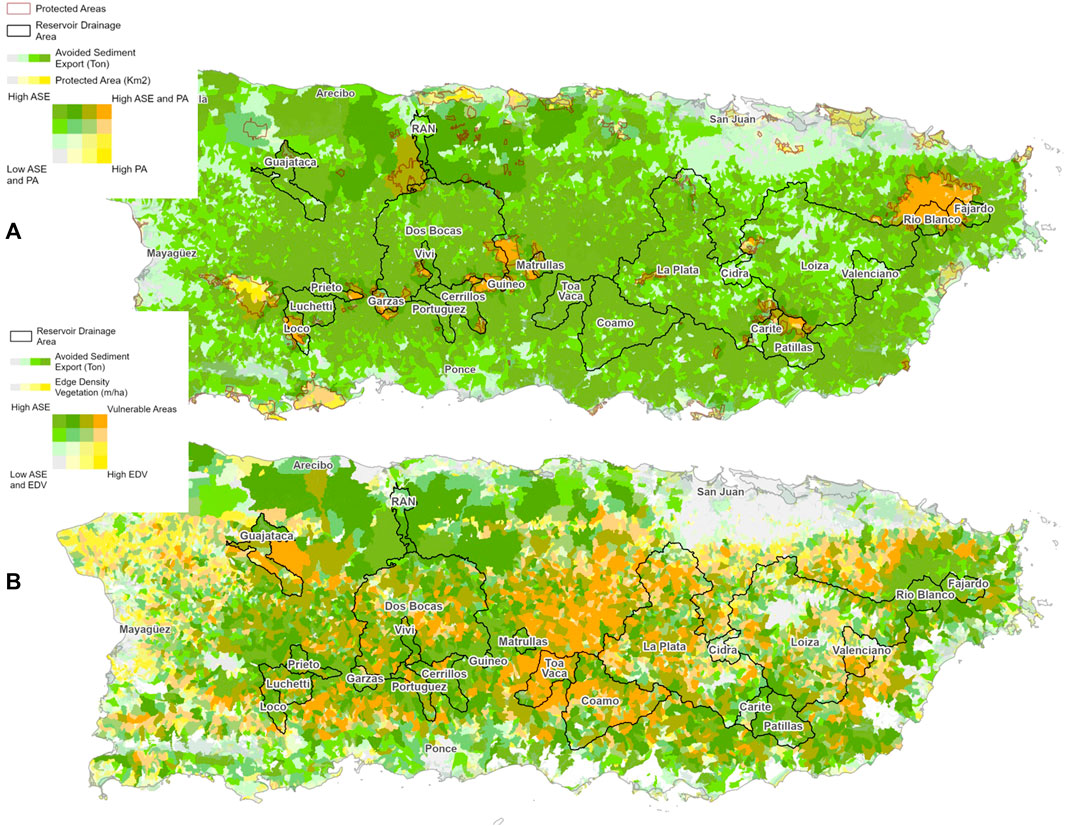
FIGURE 5. Avoided sediment export at the micro-catchment scale for the reservoirs under study. Panel (A) depicts avoided sediment export in relation to the percent of protected areas. Panel (B) depicts avoided sediment export in relation to edge density, an indicator of fragmentation. RAN, Retencion Acueducto Norte.
Dos Bocas can be considered to be having a high service supply (in total and corrected by area) and also a high demand if we take into account its position upstream from the RAN watershed. These watersheds would benefit from having been more formally protected from future development and land use change, as Dos Bocas has only 6.62% of its watershed under legal conservation status (1.48% for RAN). Toa Vaca also has a high service supply and relatively high demand, but high vulnerability, as its natural areas are among the most fragmented relative to other watersheds evaluated (ED = 87.31, PD = 4.19).
The Cidra and Guajataca reservoirs should be considered to be supply and demand mismatched because they are in high demand with lower than average supply of sediment retention service. These watersheds have natural areas of 50% and 67% (respectively), relatively high fragmentation (ED = 60.40 and 70.65, respectively), and low protection status (0%; 4%). These watersheds can be considered for restoration purposes to enhance their service delivery to the beneficiary populations.
Our SEN map results are shown in Figure 6 for a selected number of illustrative service areas and watershed areas. These maps illustrate how disparate locations across the island are connected to the network of natural stream features, and pipelines, and how landscape conservation in the watershed area of distant reservoirs benefits populations outside of these landscape units. These island-wide connections exist for other reservoirs and service areas as well, and Table 2 lists these linkages. Detailed maps for additional locations are available upon request, but were not included for the sake of brevity.
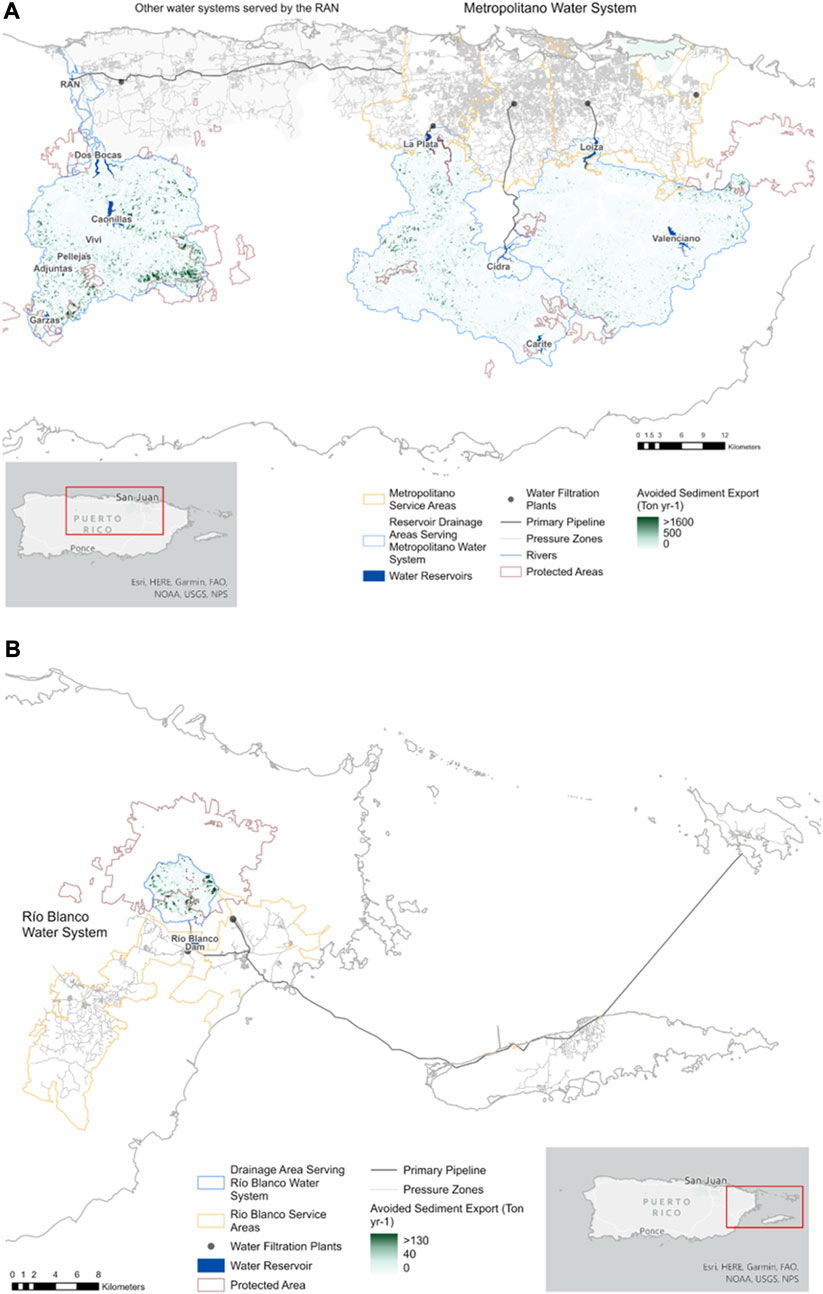
FIGURE 6. Maps depicting examples of our SEN results for the supply and demand of sediment retention services of reservoirs in PR. Panel (A) is analogous to panel (A) in Figure 1, and depicts the service area of Metropolitano, which corresponds to the San Juan metropolitan area, and all the reservoirs and watershed areas connected to it. Panel (B) is analogous to panel (B) in Figure 1 and depicts the watershed area of Rio Blanco reservoir and its linkages to multiple service areas including the islands of Vieques and Culebra, and also the municipalities of PR. RAN refers to Retencion Acueducto Norte. Other service areas and reservoir linkages are shown in Table 2.
The watersheds that supply water for consumption in PR have a relatively high percentage of natural areas, but most have little legal conservation and protection, making them vulnerable to development and land use change in the future. By estimating the avoided costs of sediment removal provided by these natural areas, and the number and location of people who are benefitted, we can develop conservation strategies for safeguarding this resource for future generations of the Island such as payment for ecosystem service schemes and targeted conservation easement programs that account for landscape prioritization by means of ES valuation.
Our estimates suggest that individually, the watersheds draining to reservoirs contribute an estimated $4.9 million dollars per year in avoided costs. Sude et al., 2011 followed a similar approach to study sediment retention services for the Ertan Reservoir in Yalong River, China (101 km2), and estimated 785.8 × 10⁸ yuan of avoided costs in 1 year (year 2005), which amounts to a much larger value in USD than our estimates. On the other hand, another study in the Uma-Oya watershed in Sri Lanka (765 km2) estimated the avoided costs of $34,215 USD annually, which is much lower than our estimates. These comparisons highlight that value estimates can vary depending on the parameters used and the assumptions. Here, we assumed that the reservoirs would be dredged in the event that the reservoir’s capacity became compromised, and we also made assumptions regarding the discount rate of these avoided costs and the dredging costs themselves. Therefore, the actual avoided costs are meant here to provide a relative estimate, with these criteria in mind.
Despite these caveats, we can compare our avoided cost estimates to the recent Loiza (also known as Carraizo) reservoir dredging project in PR for further validation. In 2022, the project allocated an initial $88.7 million for dredging, after the reservoir had already been dredged in the year 1997 (FEMA, 2022a). This amounts to at least ∼$3.5 million/yr of cost accrued in 25 years, which is not too far from our estimates, especially when considering that the planned dredging volume 2 Mm3 (2.6 million cubic yards) is lower than that of the actual sedimentation that occurred in this time period (4.39 Mm3, FEMA, 2022b). Moreover, the measure of avoided sediment removal costs from dredging does not account for other co-benefits of sediment retention services, including recreational uses, fisheries, and biodiversity conservation. In addition, previous studies have calculated other ESs provided by the same natural areas, such as nutrient retention, carbon sequestration, and flood risk reduction, which have been documented as valued by residents in PR (Smith et al., 2017), and to contribute co-benefits beyond monetary valuation, such as increases in human wellbeing (Yee, 2020).
When extrapolating the number of households connected to reservoirs into the estimates of water demand, we observe that the level of annual water withdrawals (i.e., 307.36 Mm3) is very close in value to the total capacity of the reservoirs being withdrawn from (353.09 Mm3). On average, the annual demand for water from individual reservoirs (20.33 Mm3) exceeds the existing capacity (14.56 Mm3). While these estimates should be considered carefully, with all the limitations of our study in mind, these estimates support a need for developing proactive strategies to prevent further capacity loss, an imperative that may become more crucial in the future, if there are changes in the precipitation regime (droughts and hurricanes) that exacerbate the vulnerability of reservoirs in PR.
Our study characterized the level of legal protection of sediment retention services across the Island. The most important reservoirs in terms of service demand according to our study, Loiza, La Plata, and Dos Bocas, have a high percentage of natural areas in their watersheds which provide high levels of sediment retention. However, they have a low percentage of protected areas, which makes their watersheds vulnerable to future development, which may disrupt the systems of natural functions underpinning the ecosystem service provision. This is relevant in terms of relating ecosystem service flows to strategic watershed conservation initiatives, which have been highlighted as crucially essential for post-hurricane resilience on the Island (Preston et al., 2020). It is also important in terms of relating issues of water provision to land use regulation and planning policy. For example, this analysis would inform PRASA water users about the potential impact of changes to land use classifications under the Puerto Rico Land Use Plan and Joint Permitting Regulation (Puerto Rico Planning Board, 2022) to the reservoirs that provide water for their consumption.
A reservoir system that seems to be vulnerable according to our study is Cidra, which serves a large population, but has a low percentage of natural area and higher than average fragmentation. Cidra’s high demand estimates can be attributed to its connection to the Metropolitano system, for which it may contribute a small proportion of the total amount of water. However, the fact that it is connected to a high population area and that it also connects to different service areas that rely on it solely (Cidra Urbano) highlight the potential need for its management. Previous sedimentation surveys on the Cidra reservoir suggest that there is no immediate concern for capacity loss for this reservoir due to sedimentation in the near future (Soler-Lopez, 2010). However, sedimentation has been shown to affect the reservoir’s operational capacity, as water intake structures and sediment discharging structures (sluice gates) have been buried by 8–9 feet of sediment (Ortiz-Zayas et al., 2004). Another highly fragmented watershed area is that of Toa Vaca, a reservoir with high sES demand and supply, but which would benefit from conservation and restoration initiatives, especially given its current capacity, which is high and suggests its potential to serve an even larger population in the future. While this study showed high ES supply, the Toa Vaca drainage area also stands out as having one of the highest per area sediment export rates of all major reservoirs according to previous studies, supporting the need for watershed planning to avoid further increasing erosion and sediment export rates in the future (Ortiz-Zayas et al., 2004).
Our findings may help inform the development of payment for ecosystem service schemes that use these dollar value estimates as a guideline. For example, a municipality in PR interested in community-based conservation efforts could designate annual fees to water consumers for the protection of the service provisioning units of their primary reservoirs. For an average reservoir with 54,297 households and $4.9 million dollars in sediment retention service, this would imply a $90 annual fee or approximately $7 per month per household, which could then be used in coordination with existing NGOs and organizations on the Island to develop strategic conservation programs (e.g., Para La Naturaleza, Foundation for Puerto Rico, Centro para la Conservacion del Paisaje, and Protectores de Cuencas). Here, we must note that in Puerto Rico, utility rates are much higher than in the US (United States Environmental Protection Agency, 2023) and the poverty level doubles that of the poorest state (ACS, 2021). Adding even a small fee to an already exceedingly expensive utility system for the PR citizens may not be the first approach to consider. Alternatively, already existing programs and fees may be used toward these goals. For example, PRASA already charges residents two relevant fees: 1) environmental and regulatory compliance charge (CCAR) and 2) a water sustainability charge (PRASA, 2022). Perhaps the strategic use of these already collected funds could be considered for ES management, which is an important aspect of water sustainability in PR.
The selection of the best places to focus for conservation easements and other protection strategies could then be informed by our fine-scale map of micro-catchment (Figure 5) within each watershed area, which provides information regarding total sediment retained and current level of protection and fragmentation. The actual cost of acquiring and conserving properties for sediment retention services has not been factored in this study and could be the focus of future studies that complete a more expansive cost–benefit analysis of payment for the ecosystem service program on the Island. These analyses may also include other co-benefits such as flood control, recreational opportunities, and biodiversity conservation, all of which would add to the value of acquiring land for conservation.
Our study is the first one to provide a clear characterization of the supply and demand of sediment retention ES flows for the island of Puerto Rico. By knowing which landscapes contribute to the water quality of which citizens, we can develop more targeted conservation strategies and community-led efforts for ES management. For example, we showed a link between the protected areas of the Luquillo National Forest, the only tropical federal forest of the Nation, and the water quality of the islands of Vieques and Culebra, which are the end users of the Rio Blanco reservoir, and direct beneficiaries of the conservation of these natural areas (Figure 6). We also showed how the residents of the San Juan metropolitan area benefit not only from the nearby La Plata and Loiza reservoir watersheds but also from the more distant Dos Bocas, which is directly linked to the water supply of the Retencion Acueducto Norte. This information provides the citizens of PR with a better understanding of the value of vegetation conservation and management across the Island, and at fine scales, in order to see which landscapes and micro-catchments to target in order to protect and enhance sediment retention. Table 2 shows other linkages across the Island.
Our study also presents a replicable process to apply for operationalizing the characterization of supply and demand flows of ES. Our suggested SEN process can be applied or customized as needed for other applications. This could include the addition of relational ties to plans and laws at different scales for governance analysis, more detailed incorporation of natural functions and landscape data for modeling, or additional consumer information for future value estimations based on service–consumer linkages. The context of water quality service flows presents an opportunity to create concrete measurements of socio-ecological linkages, as stream networks and pipelines connect landscapes to end users, and these data are widely available, at least in the United States, from utilities, and via Safe Drinking Water Act and Clean Water Act (SDWA and CWA) reporting databases. PR was an ideal case study for the application of the suggested approach because the Island is the single source of ES, and PRASA serves most of the population as a Commonwealth wide utility. While the approach could be used in other locations, we should note that it would require acquiring the system service data for the lines potentially from several utilities and jurisdictions. SDWA and CWA data, for example, associate reservoirs with locations of demand, but these are jurisdictional attributes, without specific spatial data on service areas and service lines. Additional studies are needed to determine how feasible it is to replicate this process in other locations and what are the data gaps and challenges that need to be overcome to do so. Additional limitations of our study are discussed as follows.
Our study had several limitations. The InVEST SR model is not meant to provide a comprehensive sediment budget for reservoirs, as the avoided sediment export values only account for overland erosion and does not include estimates for gully erosion, channel erosion, or landslides (Natural Capital Project, 2022). In Puerto Rico, landslides may constitute the majority of the sedimentation source for surface waters (Larsen, 2012); therefore, our estimates only cover a portion of the sedimentation risk in surface waters on the island. Nevertheless, the processes that lead to avoided sediment export by vegetation also contribute to reducing landslide risk. For example, a study by Larsen (2012) compared sediment exports and sources of four watersheds in PR and found a higher rate of landslides in urbanized vs. forested watersheds. In addition, the process of fragmentation, which we suggest here that it can affect the provision of overland sediment retention, can also increase the risk for other forms of erosion. For example, it has been suggested that road construction, which fragments forested areas, is a leading cause of landslide occurrence in PR (Larsen and Torres-Sanchez, 1992; Hughes and Shulz, 2020). Therefore, the mapping and prioritization data presented here can be beneficial for the management of erosion issues in the island as a whole, and not just from overland erosion. Previous studies have also conducted similar mapping characterizations for the risk of landslides through the island (Hughes and Schulz, 2020). Using this information, we developed a supplementary map showing how landslide risk relates to our estimates of avoided exports from overland erosion (Supplementary Material S4).
While the network of the reservoir to filter plant to pipeline allows a rough estimation of the number of end users for each reservoir’s water, the fact that pipelines receive water from multiple sources makes it more complicated to determine the relative importance of each reservoir source that contributes to the same distribution system. Therefore, our estimates of connected households could be further refined in future studies to include relative weights accounting for the proportion of water provided by each reservoir to each system. Here, we note that our estimates of consumers linked to the selected watershed areas do not fully match the estimates of clients served published by PRASA in their website. We were not able to find the methods used by PRASA to provide their estimates, but it is possible that their methods account for the relative importance of each reservoir to the end users connected, as well as potential losses during the distribution process. Despite these discrepancies, the relative importance to users of the reservoirs studied correlated with the PRASA numbers, and therefore our analysis still provides a good estimate of relative differences in service demand, even if the absolute number of users required further validation.
Our assessment of the vulnerability of services is based on the assumption that the fragmentation of natural areas would likely cause a reduction in the ES supply and that natural areas under any form of the legal conservation status should be better protected against development. These assumptions need to be tested in greater detail in the future.
Lastly, our model estimates are based on the best available publicly accessible datasets. Some of these data (e.g., 2010 PR CCAP land use and land cover) would need to be updated once new information is available to better reflect the current conditions on the island. However, since our methods have been documented in detail and are based on open source software and data, we believe our results can be replicated fully to update them as needed and help inform management of reservoir sedimentation.
Water consumers in Puerto Rico benefit from sediment retention services from natural landscapes across the Island. These services can amount to millions of dollars annually if we consider the potential costs of reservoir dredging. Our study provides a valuation of these services and a characterization of the service flows from watershed areas to reservoirs to end users, which show how people in one side of the island benefit from distant natural landscapes in their everyday lives. This characterization is useful for raising awareness about the importance of ecosystem service conservation and also a framework for future studies to evaluate socio-ecological networks of water quality ecosystem service flows. Despite the value of sediment retention services by natural landscapes in Puerto Rico, these landscapes are vulnerable due to the low level of legal conservation, fragmentation, and potential changes to zoning regulations that have been proposed in PR. The information we provide here can assist decision makers and communities in prioritizing areas for conservation and management to address these vulnerabilities in the future.
The original contributions presented in the study are included in the article/Supplementary Materials; further inquiries can be directed to the corresponding author.
Conception and design of the work (RD and TD); acquisition, curation, and analysis of data (MV, VM, RD, and TD); design and formatting of figures and tables (MV, RD, and TD); drafting of the manuscript (RD, TD, MV, and VM); revising the manuscript critically for important intellectual content (RD, TD, MV, and VM). All authors contributed to the article and approved the submitted version.
Puerto Rico Sea Grant provided funds for the execution of this project (grant no. NA22OAR4170097). Additional funds were provided by the National Academy of Sciences Gulf Research Program Early Career Fellowship (grant no. 2000010755).
The authors would like to give a special thanks to Ferdinand Quiñones for providing background information, contextual awareness, and validation information for this project.
The authors declare that the research was conducted in the absence of any commercial or financial relationships that could be construed as a potential conflict of interest.
All claims expressed in this article are solely those of the authors and do not necessarily represent those of their affiliated organizations, or those of the publisher, the editors, and the reviewers. Any product that may be evaluated in this article, or claim that may be made by its manufacturer, is not guaranteed or endorsed by the publisher.
The Supplementary Material for this article can be found online at: https://www.frontiersin.org/articles/10.3389/fenvs.2023.1214037/full#supplementary-material
Advanced Spaceborne Thermal Emission and Reflection Radiometer (ASTER) (2019). Global digital elevation model version 3 (GDEM 003). https://asterweb.jpl.nasa.gov/gdem.asp.
American Community Survey (ACS) (2021). Percent population below the poverty line (2016-2020). https://data.census.gov/table?q=S1701:+POVERTY+STATUS+IN+THE+PAST+12+MONTHS&g=010XX00US$0400000,&tid=ACSST5Y2020.S1701.
Anchor, Q. E. A. (2019). “Development of basic cost model for removal of sediment from reservoirs,” in Prepared for the national reservoir sedimentation and sustainability team (Lakewood, CO, United States: Anchor QEA, Limited Liability Company).
Anjinho, P. D. S., Barbosa, M. A. G. A., and Mauad, F. F. (2022). Evaluation of InVEST’s water ecosystem service models in a Brazilian Subtropical Basin. Water 14 (10), 1559. doi:10.3390/w14101559
Atulley, J. A., Kwaku, A. A., Gyamfi, C., Owusu-Ansah, E. D., Adonadaga, M. A., and Nii, O. S. (2022). Reservoir sedimentation and spatiotemporal land use changes in their watersheds: The case of two sub-catchments of the white volta basin. Environ. Monit. Assess. 194 (11), 809. doi:10.1007/s10661-022-10431-y
Berardo, R., and Lubell, M. (2016). Understanding what shapes a polycentric governance system. Public Adm. Rev. 76 (5), 738–751. doi:10.1111/puar.12532
Bodin, Örjan, Alexander, Steven M., Baggio, Jacopo, Barnes, Michele L., Berardo, Ramiro, Cumming, Graeme S., et al. (2019). Improving network approaches to the study of complex social–ecological interdependencies. Nat. Sustain. 2 (7), 551–559. doi:10.1038/s41893-019-0308-0
Borselli, L., Cassi, P., and Torri, D. (2008). Prolegomena to sediment and flow connectivity in the landscape: A gis and field numerical assessment. Catena 75, 268–277. doi:10.1016/j.catena.2008.07.006
Cervero, R. (2003). Road expansion, urban growth, and induced travel: A path analysis. J. Am. Plan. Assoc. 69 (2), 145–163. doi:10.1080/01944360308976303
Council of Economic Advisors (CEA) (2017). Discounting for Public Policy: Theory and recent evidence on the merits of updating the discount rate. https://obamawhitehouse.archives.gov/sites/default/files/page/files/201701_cea_discounting_issue_brief.pdf. Accessed 04/29/2023.
De Groot, R. S., Alkemade, R., Braat, L., Hein, L., and Willemen, L. (2010). Challenges in integrating the concept of ecosystem services and values in landscape planning, management and decision making. Ecol. Complex. 7 (3), 260–272. doi:10.1016/j.ecocom.2009.10.006
Díaz-Garayúa, J. R., and Guilbe-López, C. J. (2020). “Confronting styles and scales in Puerto Rico: Comprehensive versus participative planning under a colonial estate,” in Urban and regional planning and development: 20th century forms and 21st century transformations (Berlin, Germany: Springer), 347–360.
Esri (2022a). Fill tool. https://pro.arcgis.com/en/pro-app/latest/tool-reference/spatial-analyst/fill.htm.
Esri (2020). PRASA facilities in PR. https://www.arcgis.com/home/item.html?id=c189dd9e74c54981afcac8f923b10f35#overview.
Esri (2022b). USA Census 2020 redistricting Blocks. https://www.arcgis.com/home/item.html?id=b3642e91b49548f5af772394b0537681.
Felipe-Lucia, M. R., Guerrero, A. M., Alexander, S. M., Ashander, J., Baggio, J. A., Barnes, M. L., et al. (2021). Conceptualizing ecosystem services using social–ecological networks. Trends Ecol. Evol. 37, 211–222. doi:10.1016/j.tree.2021.11.012
FEMA (2022b). Environmental assessment carraízo reservoir dredging. https://recovery.pr.gov/documents/PA-DR-4339-169882-CarraizoDredging-EA-Appendix-A-English-20220705.pdf.
FEMA (2022a). FEMA approves $88 million to dredge the carraízo reservoir. https://www.fema.gov/press-release/20221212/fema-approves-88-million-dredge-carraizo-reservoir#:∼:text=San%20Juan%2C%20Puerto%20Rico%20%E2%80%93The,to%20dredge%20the%20Carra%C3%ADzo%20Reservoir.
Gellis, A. C., Webb, R. M., McIntyre, S. C., and Wolfe, W. J. (2006). Land-use effects on erosion, sediment yields, and reservoir sedimentation: A case study in the Lago Loiza basin, Puerto Rico. Phys. Geogr. 27 (1), 39–69. doi:10.2747/0272-3646.27.1.39
Grill, G., Lehner, B., Thieme, M., Geenen, B., Tickner, D., Antonelli, F., et al. (2019). Mapping the world’s free-flowing rivers. Nature 569 (7755), 215–221. doi:10.1038/s41586-019-1111-9
Guerra, Carlos A., Maes, Joachim, Geijzendorffer, Ilse, and Metzger, Marc J. (2016). An assessment of soil erosion prevention by vegetation in Mediterranean Europe: Current trends of ecosystem service provision. Ecol. Indic. 60, 213–222. doi:10.1016/j.ecolind.2015.06.043
Hamel, P., Chaplin-Kramer, R., Sim, S., and Mueller, C. (2015). A new approach to modeling the sediment retention service (InVEST 3.0): Case study of the Cape Fear catchment, North Carolina, USA. Sci. Total Environ. 524, 166–177. doi:10.1016/j.scitotenv.2015.04.027
Hamel, P., Falinski, K., Sharp, R., Auerbach, D. A., Sánchez-Canales, M., and Dennedy-Frank, P. J. (2017). Sediment delivery modeling in practice: Comparing the effects of watershed characteristics and data resolution across hydroclimatic regions. Sci. Total Environ. 580, 1381–1388. doi:10.1016/j.scitotenv.2016.12.103
Hesselbarth, M. H. K., Sciaini, M., With, K. A., Wiegand, K., and Nowosad, J. (2019). Landscapemetrics: An open-source R tool to calculate landscape metrics. Ecography 42, 1648–1657. doi:10.1111/ecog.04617
Howell, B. (1952). The planning system of Puerto Rico. Town Plan. Rev. 23 (3), 211–222. doi:10.3828/tpr.23.3.b7310885ll37p5n8
Hughes, K. S., and Schulz, W. H. (2020). “Map depicting susceptibility to landslides triggered by intense rainfall, Puerto Rico: U.S,”. Open-File Report 2020–1022 (Reston, VA, USA: United States Geological Survey).
Larsen, M. C. (2012). Landslides and sediment budgets in four watersheds in eastern Puerto Rico. Water Qual. Landsc. Process. four watersheds East. P. R. 1789, 153–178. doi:10.3133/pp1789
Larsen, M. C., and Torres-Sanchez, A. J. (1992). Landslides triggered by hurricane hugo in eastern Puerto Rico, september 1989. Caribb. J. Sci. 28 (3-4), 113–125.
Mitchell, M. G., Suarez-Castro, A. F., Martinez-Harms, M., Maron, M., McAlpine, C., Gaston, K. J., et al. (2015). Reframing landscape fragmentation's effects on ecosystem services. Trends Ecol. Evol. 30 (4), 190–198. doi:10.1016/j.tree.2015.01.011
Molina, W. L., Irizarry-Ortiz, M., Santiago, M., Pazmino-Hernandez, M., and Kahlid, S. (2019). Estimated public-supply water withdrawals and domestic water use in Puerto Rico (ver. 2.0, March 2023). Reston, VA, USA: United States Geological Survey.
Molina-Rivera, W. L., and Irizarry-Ortiz, M. M. (2021). “Estimated water withdrawals and use in Puerto Rico, 2015: U.S,”. Open-File Report 2021–1060 (Reston, VA, USA: United States Geological Survey).
Mullu, D. (2016). A review on the effect of habitat fragmentation on ecosystem. J. Nat. Sci. Res. 6 (15), 1–15.
National Oceanic and Atmosferic Administration (NOAA) (2023). Biden-Harris Administration recommends funding of $34.4 million for projects in Puerto Rico to strengthen Climate-Ready Coasts as part of Investing in America agenda. https://www.noaa.gov/news-release/noaa-bil-investments-2023-puerto-rico.
National Oceanic and Atmospheric Administration (NOAA) Coastal Services Center (2014b). The rainfall-runoff erosivity factor (R-factor) for Puerto Rico. https://coast.noaa.gov/digitalcoast/tools/opennspect.html.
National Oceanic and Atmospheric Administration (NOAA) Office for Coastal Management (2022). 2010 coastal change analysis program (C-cap) 30 meter land cover of Puerto Rico. https://www.fisheries.noaa.gov/inport/item/48300.
Natural Capital Project (2022). InVEST 3.13. User’s Guide. Stanford, CA, United States: Stanford University.
Ortiz-Zayas, J., Quinones, F., and Silvana Palacios, P. E., (2004). Caracteristicas y Condicion de Los Embalses Principales en Puerto Rico. Departamento de Recurcos Nat. y Ambientales, Commonw. P. R., 191.
Picó, R. (1953). Puerto Rico: Its problems and its programme. Town Plan. Rev. 24 (2), 85. doi:10.3828/tpr.24.2.x728tt231935536k
Podolak, C. J., and Doyle, M. W. (2015). Reservoir sedimentation and storage capacity in the United States: Management needs for the 21st century. J. Hydraulic Eng. 141 (4), 02515001. doi:10.1061/(asce)hy.1943-7900.0000999
Poff, N. L., and Zimmerman, J. K. (2009). Ecological responses to altered flow regimes: A literature review to inform the science and management of environmental flows. Freshw. Biol. 55, 194–205. doi:10.1111/j.1365-2427.2009.02272.x
Preston, Benjamin Lee, Miro, Michelle E., Brenner, Paul, Gilmore, Christopher K., Raffensperger, John F., Madrigano, Jaime, et al. (2020). Beyond recovery: Transforming Puerto Rico's water sector in the wake of hurricanes Irma and Maria. Homeland security operational analysis center operated by the RAND corporation. https://www.rand.org/pubs/research_reports/RR2608.html.
Puerto Rico Departament of Natural and Environmental Resources (PRDNER) (2008a). Plan Intergal de Recursos de Agua en Puerto Rico. https://www.drna.pr.gov/historico/oficinas/saux/secretaria-auxiliar-de-planificacion-integral/planagua/plan-integral-de-recursos-de-agua-de-puerto-rico/plan-integral-de-recursos-de-agua-de-puerto-rico-2008/resumen-ejecutivo/RESUMEN_EJECUTIVO_PIRA_2008.pdf.
Puerto Rico Aqueduct and Sewer Authority (PRASA) (2021). La calidad del agua potable: Informe Anual. https://www.acueductospr.com/en/web/guest/informes-sobre-la-calidad-del-agua. Accessed 04/19/2023.
Puerto Rico Aqueduct and Sewer Authority (PRASA) (2022). Memorial Explicativo: Propuesta de Revision de la Estructura Tarifaria de la Autoridad de Acueductos y Alcantarillados de Puerto Rico. https://docs.pr.gov/files/AAA/Portada/Documentos/MemorialExplicativoTarifas2022v7FINAL.pdf.
Puerto Rico Aqueduct and Sewer Authority (PRASA) (2023). Niveles de los Embalses Principales. https://www.acueductospr.com/niveles-de-los-embalses.
Puerto Rico Department of Environmental and Natural Resources (PRDNER) (2016). Informe sobre la sequía de 2014-2016 en Puerto Rico. https://www.drna.pr.gov/wp-content/uploads/2017/01/Informe-Sequia-2014-2016.compressed.pdf.
Puerto Rico Department of Natural and Environmental Resources (PRDNER) (2008b). Integral plan for water resources in Puerto Rico. https://acrobat.adobe.com/link/review?uri=urn:aaid:scds:US:2f9276af-7401-33bd-a308-4a1fdf05cb75.
Puerto Rico Planning Board (Junta Planificación de PR) (2022). Nuevo reglamento conjunto (borrador). https://jp.pr.gov/wp-content/uploads/2022/10/Nuevo-RC-Borrador-10-26-22.pdf.
Puerto Rico (PR) Law 241 (1999). New Puerto Rico wildlife law. https://www.fao.org/faolex/results/details/es/c/LEX-FAOC076935/.
Puerto Rico (PR) Law 416 (2004). Puerto Rico environmental policy law. https://www.lexjuris.com/lexlex/leyes2004/lexl2004416.htm. Accessed 02/15/2023.
Quinones, F. (2022). Recursos de Agua de Puerto Rico: Embalses Principales de Puerto Rico. https://www.recursosaguapuertorico.com/Embalses-Principales.html.
Ramos-Scharrón, C. E., and Figueroa-Sánchez, Y. (2017). Plot-farm-and watershed-scale effects of coffee cultivation in runoff and sediment production in western Puerto Rico. J. Environ. Manag. 202, 126–136. doi:10.1016/j.jenvman.2017.07.020
Rauf, A. U., and Ghumman, A. R. (2018). Impact assessment of rainfall-runoff simulations on the flow duration curve of the upper Indus River—a comparison of data-driven and hydrologic models. Water 10 (7), 876. doi:10.3390/w10070876
Renard, K., Foster, G., Weesies, G., McCool, D., and Yoder, D. (1997). Predicting soil erosion by water: A guide to conservation planning with the revised soil loss equation. Maryland, MA, United States: U.S. Department of Agriculture, Agricultural Research Service.
Sayles, J. S., and Baggio, J. A. (2017). Social–ecological network analysis of scale mismatches in estuary watershed restoration. Proc. Natl. Acad. Sci. 114 (10), E1776-E1785–E1785. doi:10.1073/pnas.1604405114
Sayles, J. S., Mancilla Garcia, M., Hamilton, M., Alexander, S. M., Baggio, J. A., Fischer, A. P., et al. (2019). Social-ecological network analysis for sustainability sciences: A systematic review and innovative research agenda for the future. Environ. Res. Lett. 14 (9), 093003. doi:10.1088/1748-9326/ab2619
Schleiss, Anton J., Franca, Mário J., Juez, Carmelo, and De Cesare, Giovanni (2016). Reservoir sedimentation. J. Hydraulic Res. 54 (6), 595–614. doi:10.1080/00221686.2016.1225320
Sharp, R., Douglass, J., Wolny, S., Arkema, K., Bernhardt, J., Bierbower, W., et al. (2020). InVEST 3.12.0. User’s guide. The natural capital project. https://storage.googleapis.com/releases.naturalcapitalproject.org/invest-userguide/latest/index.html.
Smith, A., Yee, S. H., Russell, M., Awkerman, J., and Fisher, W. S. (2017). Linking ecosystem service supply to stakeholder concerns on both land and sea: An example from Guánica Bay watershed, Puerto Rico. Ecol. Indic. 74, 371–383. doi:10.1016/j.ecolind.2016.11.036
Smith, C., Williams, J., Nejadhashemi, A. P., Woznicki, S., and Leatherman, J. (2013). Cropland management versus dredging: An economic analysis of reservoir sediment management. Lake Reserv. Manag. 29 (3), 151–164. doi:10.1080/10402381.2013.814184
Soler-López, L. R. (2010). U.S. Geological survey scientific investigations map 3118, 1 plate. available at https://pubs.usgs.gov/sim/3118/.
Soler-López, L. R., Pérez-Blair, F., and Webb, R. M. T. (1997). Sedimentation survey of Lago Yahuecas, Puerto Rico. Reston, VA, USA: United States Geological Survey, 98–4259.
Stone, R. P., and Hilborn, D. (2012). Universal soil loss equation (USLE) factsheet. Ministry Agric. Food Rural Aff. order, 12–051.
Sude, B., Nan, W., Ji-Xi, G., Chen, Z., Jing, G., and Driss, E. (2011). New approach for evaluation of a watershed ecosystem service for avoiding reservoir sedimentation and its economic value: A case study from ertan reservoir in Yalong River, China. Appl. Environ. Soil Sci., 2011, doi:10.1155/2011/576947
United States Department of Agriculture (USDA) Natural Resources Conservation Service (NRCS) Soil Survey Staff (2021a). Gridded national soil survey geographic (gNATSGO) database for Puerto Rico. Available online at https://nrcs.app.box.com/v/soils.
United States Environmental Protection Agency (USEPA) (2023). SDWIS federal reports Search. https://sdwis.epa.gov/ords/sfdw_pub/r/sfdw/sdwis_fed_reports_public/200.
United States Environmental Protection Agency (2022). Standards of performance for new, reconstructed, and modified sources and emissions guidelines for existing sources: Oil and natural gas sector climate review. https://www.federalregister.gov/documents/2022/12/06/2022-24675/standards-of-performance-for-new-reconstructed-and-modified-sources-and-emissions-guidelines-for.
United States Geological Survey (USGS) (2013). Chapter 3 of section A, federal standards book 11, collection and delineation of spatial data techniques and methods 11–A3 fourth edition. https://pubs.usgs.gov/tm/11/a3/pdf/tm11-a3_4ed.pdf.
US Census (2022). Quick facts Puerto Rico. https://www.census.gov/quickfacts/PR.
USGS (2016). Climate of Puerto Rico. https://www.usgs.gov/centers/cfwsc/science/climate-puerto-rico.
USGS (2017). National hydrography dataset. https://nhd.usgs.gov/.
USGS (2019). Sedimentation surveys in Puerto Rico. https://www.usgs.gov/centers/cfwsc/science/sedimentation-surveys-puerto-rico.
USGS (2023). Water data for the nation. http://waterdata.usgs.gov/nwis/.
USGS (2018). Water use in Puerto Rico. https://www.usgs.gov/centers/cfwsc/science/water-use-puerto-rico#:∼:text=The%20population%20served%20by%20public,population%20of%20about%20102%2C000%20residents.
USGSGAP (2022). Protected areas database of the United States (PAD-US) 3.0. Reston, VA, USA: United States Geological Survey. doi:10.5066/P9Q9LQ4B
Wischmeier, W. H., and Smith, D. D. (1978). Predicting rainfall erosion losses: A guide to conservation planning (No. 537). Washington, D.C., USA: Department of Agriculture, Science and Education Administration.
Yee, S. H. (2020). Contributions of ecosystem services to human well-being in Puerto Rico. Sustainability 12 (22), 9625. doi:10.3390/su12229625
Keywords: ecosystem services, sediment retention, reservoirs, socio-ecological networks, Puerto Rico
Citation: De Jesus Crespo R, Valladares-Castellanos M, Mihunov VV and Douthat TH (2023) Going with the flow: the supply and demand of sediment retention ecosystem services for the reservoirs in Puerto Rico. Front. Environ. Sci. 11:1214037. doi: 10.3389/fenvs.2023.1214037
Received: 28 April 2023; Accepted: 17 August 2023;
Published: 04 September 2023.
Edited by:
Joel Hoffman, United States Environmental Protection Agency (EPA), United StatesReviewed by:
Claudia Carvalho-Santos, University of Minho, PortugalCopyright © 2023 De Jesus Crespo, Valladares-Castellanos, Mihunov and Douthat. This is an open-access article distributed under the terms of the Creative Commons Attribution License (CC BY). The use, distribution or reproduction in other forums is permitted, provided the original author(s) and the copyright owner(s) are credited and that the original publication in this journal is cited, in accordance with accepted academic practice. No use, distribution or reproduction is permitted which does not comply with these terms.
*Correspondence: R. De Jesus Crespo, cmRlamVzdXNjcmVzcG8xQGxzdS5lZHU=
†These authors share first authorship
Disclaimer: All claims expressed in this article are solely those of the authors and do not necessarily represent those of their affiliated organizations, or those of the publisher, the editors and the reviewers. Any product that may be evaluated in this article or claim that may be made by its manufacturer is not guaranteed or endorsed by the publisher.
Research integrity at Frontiers
Learn more about the work of our research integrity team to safeguard the quality of each article we publish.