 Noppol Arunrat
 Sukanya Sereenonchai1
 Praeploy Kongsurakan
 Monthira Yuttitham
 Ryusuke Hatano
- 1Faculty of Environment and Resource Studies, Mahidol University, Nakhon Pathom, Thailand
- 2Graduate School of Fisheries and Environmental Sciences, Nagasaki University, Nagasaki, Japan
- 3Laboratory of Soil Science, Research Faculty of Agriculture, Hokkaido University, Sapporo, Japan
Since fire is still necessary for rotational shifting cultivation (RSC), the vertical distribution and slope effect on soil properties and soil surface loss after a fire remain unclear. To address these research gaps, the study aims to achieve the following objectives: 1) investigating post-fire soil properties and soil surface loss in RSC, and 2) assessing the vertical distribution and slope effect on soil properties and soil surface loss in RSC. Soil samples were collected from two stages of RSC: 6 years (RSC-6Y) and 12 years (RSC-12Y), located in Chiang Mai Province, Northern Thailand. A continuous 15-year left fallow field (CF-15Y) was used as the reference site. Soil samples were collected from the upper, middle, and lower slopes at depths of 0–5, 5–10, 10–20, and 20–30 cm at five different time points: before burning, 5 min, 3 months, 6 months, and 9 months post-fire. The results indicated that older fallow fields had a tendency to accumulate more soil organic carbon (SOC) and soil organic nitrogen (STN). The color of the ash was altered by the fire, resulting in dark reddish-brown ash with higher levels of pH, organic matter (OM), electrical conductivity, total nitrogen, and soil nutrients when compared to gray and white ashes. The combustion of OM during the fire was found to release soil nutrients, which could explain the increase after burning. SOC stock increased at deeper layers (5–10 cm) with higher values than pre-burning levels, especially at lower slope positions, while STN stock decreased at the surface soil post-fire but increased in deeper layers at all slope positions. The average soil surface loss ranged from 1.6 to 3.1 cm, with the highest loss observed 9 months after the fire (during the rainy season) at the upper slope. In terms of the impact of slope on soil properties following the fire event, our study indicated a significant correlation between lower slopes and variables including SOC, STN, electrical conductivity, nitrate–nitrogen (NO3-N), ammonium nitrogen (NH4-N), exchangeable calcium, and exchangeable magnesium. Further study is required to investigate and develop appropriate post-fire management strategies to effectively reduce nutrient loss and minimize soil surface erosion.
1 Introduction
Shifting cultivation is indeed one of the most complex and diverse forms of agriculture globally, with multiple aspects of land use systems developing since as early as 10,000 BC (Thrupp et al., 1997). The hill tribe population in Thailand traditionally depends on shifting agriculture. Prior to the 1960s, two major types of shifting cultivation were commonly practiced: pioneer and rotational. The pioneer shifting system was practiced by Hmong, Lahu, Lisu, Akha and Yao tribes, where fields were cleared, burned, and cropped until crop production decreased, indicating low soil fertility. People then abandoned the fields and relocated to a new site. In the rotational system, fields were cut, burned, cropped for one season, abandoned for recovery, and then returned for cropping, usually practiced by Karen and Lua tribes (Bass and Morrison, 1994; Rerkasem and Rerkasem, 1994). Currently, the practice of pioneer shifting cultivation has been restricted to forested areas due to the increase in population density and forest conservation policy, which have made this practice impossible in Thailand. Moreover, voluntary village relocation is extremely rare, and long fallow shifting cultivation has mostly disappeared. As a result, shifting cultivation in Thailand now mainly consists of the rotational system (Arunrat et al., 2022a; 2023).
The practice of rotational shifting cultivation (RSC) is reported to cause anthropogenic forest disturbances and soil degradation (Curtis et al., 2018), as it reduces both above and below ground biomass from natural vegetation (van Straaten et al., 2015). Furthermore, the use of fire for land preparation in RSC can have a negative impact on the topsoil (Pennington et al., 2001). Fire tends to decrease soil carbon by burning organic matter (OM) and reducing OM inputs (Jhariya and Singh, 2021), leading to reduced soil water and available nutrients (Phillips et al., 2000). After a fire, soil pH and electrical conductivity (ECe) often increase (Arunrat et al., 2021). Lauber et al. (2009) revealed that soils with close to neutral pH typically exhibit higher bacterial diversity compared to more acidic or basic soils. Additionally, soil nitrogen can be lost through volatilization (Zavala et al., 2014), which in turn can decrease soil microbial activity (Fierer et al., 2012). However, Christensen and Muller (1975) indicated that a rapid increase in nitrogen mineralization rates can promote increased microbial activity during the initial post-fire periods. Post-fire soil nutrients can be lost through leaching, soil erosion, and runoff (Faria et al., 2015), or increased from chars and ashes (Alcañiz et al., 2016). A reduction in the fallow cycle can cause a decline in soil fertility, increase soil loss, and decrease crop production. Gafur et al. (2000) found that approximately 27% of the soil nutrients were removed from the topsoil (10 cm) due to soil loss in shifting cultivation in Bangladesh, while these nutrients were deposited in the watershed. Mishra and Ramakrishnan (1983) investigated total sediment yields in shifting cultivation in northeastern India and found 49.7 and 56.3 t ha-1 year-1 in 10 and 5 fallow years, respectively. Thus, the changes in soil surface after a fire need to be investigated, but there is still a lack of studies on this aspect in Thailand.
Soil organic carbon (SOC) serves as both a source and sink of CO2, storing the largest pool in terrestrial ecosystems, which is two-thirds larger than the atmosphere (Smith, 2004). Lal (2003) revealed that even a small percentage change in soil carbon can significantly alter CO2 concentrations in the atmosphere. However, RSC and shortened cultivation cycles have been shown to have negative impacts on soil fertility, OM content, and erosion occurrence (McDonald et al., 2002; Gafur et al., 2003). Wairiu and Lal (2003) used SOC concentration as an indicator for soil erosion on sloping lands, showing that slash-and-burn agriculture resulted in higher losses of SOC in the topsoil than natural forest due to strong erosion. On the other hand, previous studies have reported the positive effects of biochar and ash after fire, which can increase SOC, soil fertility, and crop productivity (Lehmann et al., 2003; Dempster et al., 2012; Agegnehu et al., 2015; Reed et al., 2017; Moragues-Saitua et al., 2023). Although soil erosion can lead to carbon loss in eroded areas (Haj-Amor et al., 2022), it can also induce carbon sink due to the movement of carbon from eroded soil surface areas to depositional positions (Van Oost et al., 2007). Moreover, SOC can be transported to deeper soil layers due to intrinsic factors (e.g., climate, parent material, and topography) and extrinsic factors (e.g., vegetation, practice, and land use) (Teng et al., 2017). Deep SOC is important because it has a high potential for storage, with unsaturated carbon concentrations and slow turnover times (Trumbore, 2009). It has been reported that most deep SOC comes from vertical transport of dissolved organic carbon, carbon input by root penetration, and clay-bound organic carbon (Rumpel and Kögel-Knabner, 2011). However, the vertical dynamics of SOC and soil nutrients at the soil surface (0–30 cm) in RSC remain poorly understood. This lack of understanding is attributed to the fact that most of the root zone of upland rice is typically concentrated at the soil surface in RSC.
To this end, understanding the variations in soil properties and soil surface loss in RSC is crucial for assessing dynamics and developing appropriate management strategies. A fallow period is necessary for recovering soil nutrients; however, it is unknown how long it takes to reach the initial level, as it varies depending on factors such as topography, weather conditions, soil types, and land management. To date, there are limited studies on soil properties and soil surface loss before and after burning in RSC in Thailand. Furthermore, the variation of soil properties and soil surface loss throughout the cultivation cycle has not been reported. Therefore, the objectives of this study are 1) to investigate post-fire soil properties and soil surface loss in RSC and 2) to assess the vertical distribution and slope effect on soil properties and soil surface loss in RSC. This study provides the crucial knowledge on soil properties and soil surface loss dynamics, leading to the development of proper post-fire land management strategies in RSC.
2 Material and methods
2.1 Study area and field selection
The research was carried out in Ban Mae Pok, Ban Thab Subdistrict, Mae Chaem District, Chiang Mai Province, located in Northern Thailand, as shown in Figure 1. The study sites are situated in a mountainous area, with an elevation ranging from 700 to 1,000 m a.s.l. The rainy season usually starts from May until October. Winter season occurs from October to February, whereas summer season is from February to May (Trisurat et al., 2010; Department of Mineral Resources, 2015). Based on data from the Thai Meteorological Department's weather stations in Doi Ang Khang and Mueang Chiang Mai, the total rainfall during March to December 2022 was 2,227.5 mm. The highest amount of rainfall occurred in September (525.6 mm), while the lowest was recorded in November (16.0 mm). Soils in the highlands of Thailand (with slopes greater than 35%) are classified as slope complex series, which mostly includes mountainous areas (LDD, 1992; USAID, 1993). The topsoil (0–10 cm) is sandy loam, and the subsoils (10–30 cm) are sandy clay loam and sandy loam, mostly composed of reddish-brown lateritic soil. The soil pH varies from 5.63 to 6.65, and the OM content ranges from 2.75% to 5.53% (Arunrat et al., 2022a).
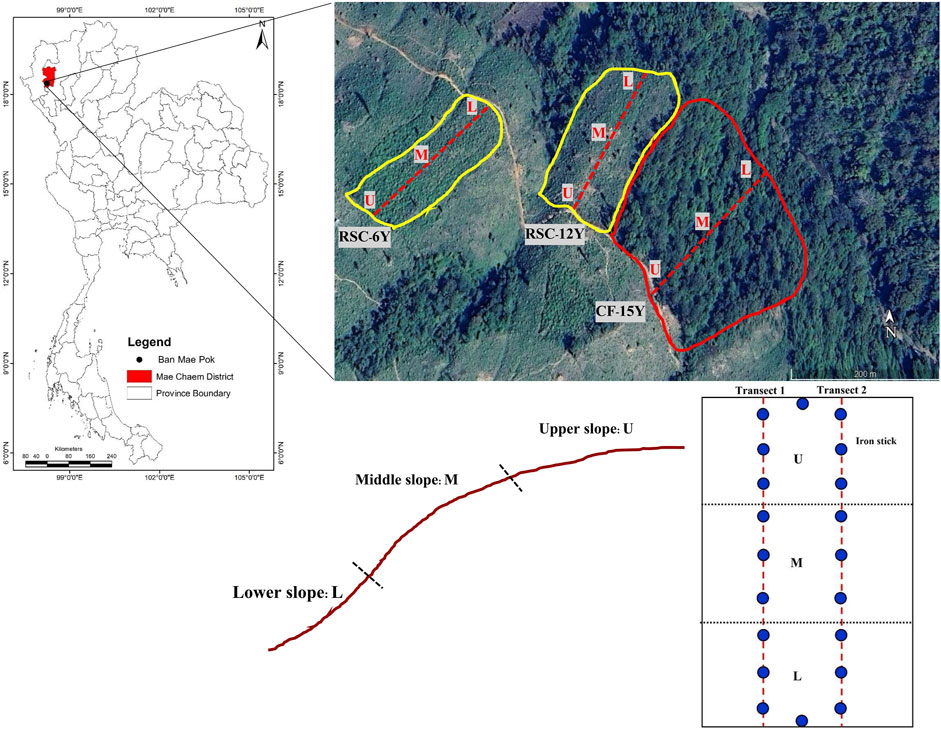
FIGURE 1. Study area. The aerial image was taken from Google Earth on 29 July 2023.
In this study, two RSC fields were selected, which were previously used for upland rice cultivation and then left fallow to allow for the recovery of secondary forest vegetation (Figure 1). The RSC-12Y (18°23′12.03″N, 98°11′39.56″E), at an elevation of 692 m a.s.l and with a slope gradient of 28% was left fallow for 12 years after upland rice harvesting, and in 2022, it was cleared, burnt, and cultivated with upland rice. The RSC-6Y (18°23′11.5″N, 98°11′33.56″E), at an elevation of 729 m a.s.l and with a slope gradient of 31% was left fallow for 6 years after upland rice harvesting, and in 2022, it was also cleared, burnt, and cultivated with upland rice. We also used a reference site, the 15-year continuous left fallow (CF-15Y) (18°23′10.11″N, 98°11′44.29″E), at an elevation of 640 m a.s.l and with a slope gradient of 30%, where no cultivation or burning was carried out and the soil properties continued to recover naturally.
To grow upland rice in RSC-6Y and RSC-12Y fields, upland rice seeds (∼125.0 kg ha-1) were dropped by hand using spades or planting sticks to dig shallow holes. The water source was rainfall only. Upland rice was harvested by hand, and the residues were left in the fields. The fields were then abandoned to allow for the recovery of secondary forest vegetation.
2.2 Experimental design and fire measurements
In 2022, the RSC-12Y (75 m × 170 m) and RSC-6Y (45 m × 150 m) fields were selected to cultivate based on the village rotation cycle. The boundaries of each RSC field were marked, and grasses, shrubs, woods, and saplings were cut and left in the field to dry in the sunlight for around 30–45 days. Firebreaks were created around the fields with a width of 5–7 m to prevent the spread of fire during burning. Each RSC field was divided into three slope positions - upper slope, middle slope, and lower slope (Figure 1). At each RSC field, the 20 iron sticks (30 cm length) with label scale were installed in 20 positions to measure the soil surface changes by installing at 0 cm of soil surface. Two transects were established vertically, spanning from the upper to the lower slope positions, and nine additional transects were marked horizontally. At the intersection of these vertical and horizontal transects, iron sticks were installed, with spacing of approximately 35 m × 20 m and 25 m × 15 m for RSC-12Y and RSC-6Y, respectively (Figure 1). Three plots were marked for measuring fire temperature, soil temperature, and soil sampling.
The burning of the RSC fields started at 3:00 p.m. and ended at around 5:00 p.m. after obtaining permission from the Mae Chaem District Office. During the burning process, the fire temperature at each pit of each RSC field was measured using an infrared thermometer (PONPE 470IR). Soil temperature and moisture were measured before (pre-burning) and 5 min after burning at each pit of each RSC field at the depth of 5, 10, 20, and 30 cm using a Thermocouple Type K (PONPE 422 PR) and moisture meter, respectively. The fire temperature, soil temperature, and soil moisture of RSC fields were presented in Supplementary Table S1.
2.3 Soil and ash sampling and analysis
Soil samples were collected from the upper slope, middle slope, and lower slope of RSC-12Y and RSC-6Y fields at depths of 0–5, 5–10, 10–20, and 20–30 cm at five different time points: before burning (March 2022), 5 min after burning (March 2022), 3 months after burning (June 2022), 6 months after burning (September 2022), and 9 months after burning (harvest, December 2022). Soil samples from the CF-15Y field were collected at four time points: March 2022, 3 months after RSC fields burning, 6 months after RSC fields burning, and 9 months after RSC fields burning.
A total of 360 soil samples were collected from the RSC fields, with 2 RSC fields, 3 plots, 4 depths, 5 time points, and 3 slope positions. In addition, 48 soil samples were taken from the CF-15Y site, with 1 CF site, 3 plots, 4 depths, and 4 time points. At each slope position of each RSC field, soil samples were collected from the same three plots at each time point. At each plot (20 × 20 m), soil samples of each depth were taken from five pits and mixed to obtain one composite sample per depth per plot. Stones, grasses, roots, and residues were removed manually, and around 1 kg of soil was placed in a plastic bag. Ash colors were determined using the Munsell soil color charts after the fire. A steel spoon was used to meticulously collect ash of each color from the respective sample plots. The chemical properties of ash were provided in Supplementary Table S2. Furthermore, a steel soil core (5.0 cm width × 5.5 cm length) was used to collect a soil sample from each depth to determine soil bulk density after drying at 105 °C for 24 h.
Soil texture was determined using the hydrometer method, while soil pH and ash pH were measured using a pH meter with a 1:1 and 1:10 suspension of solids in water, respectively (National Soil Survey Center, 1996). Electrical conductivity (ECe) was determined by measuring the saturation paste extracts using an EC meter (USDA, 1954). The cation exchange capacity (CEC) was measured by the NH4OAc pH 7.0 method. Total nitrogen (TN) was analyzed using the micro-Kjeldahl method. Ammonium nitrogen (NH4-N) and nitrate–nitrogen (NO3-N) were measured by the KCL extraction method. The exchangeable calcium (exch.Ca), magnesium (exch.Mg), and potassium (exch.K) values were analyzed using atomic absorption spectrometry with NH4OAc pH 7.0 extraction. Available phosphorus (avail.P) was measured using the molybdate blue method (Bray II extraction) (Bray and Kurtz, 1945). Organic carbon (OC) content was analyzed following the method of Walkley and Black (1934) using potassium dichromate (K2Cr2O7) in sulfuric acid, and the results were reported as organic matter (OM) by multiplying with 1.724.
2.4 Soil organic carbon and total nitrogen estimation
The SOC stock was estimated using the following equation:
where SOCstock is the soil organic carbon stock (Mg C ha-1),
The STN stock was calculated using the following equation:
where STNstock is the soil total nitrogen (Mg N ha-1),
To eliminate the potential impact of varying soil bulk density over time, which could lead to errors in estimating SOC stock, we employed the equivalent soil mass approach (Ellert and Bettanym, 1995) to adjust the SOC stock calculations using the following equation:
where
The adjusted soil thickness m) for each RSC field was calculated using the following equation (Arunrat et al., 2021):
where
2.5 Soil surface loss measurement
At each RSC field, the level of soil surface changes was recorded by measuring the label scale on 20 iron sticks. The 0 cm of soil surface level was recorded before burning in March 2022, and the label scales were recorded again at 5 min after burning in March 2022, 3 months after burning in June 2022, 6 months after burning in September 2022, and at harvest in December 2022. For the CF-15 site, a total of 20 iron sticks were also installed to monitor the level of soil surface at four time points: March 2022, 3 months after RSC fields burning, 6 months after RSC fields burning, and 9 months after RSC fields burning.
2.6 Statistical analysis
Statistical analysis was performed using the R environment (v.4.0.2). Soil physiochemical properties were compared among the CF-15, RSC-6Y, and RSC-12Y sites with varying positions and soil depths using Analysis of Variance (ANOVA). When the ANOVA result was significant at p ≤ 0.05, the Tukey Honestly Significant Difference (HSD) test was employed to perform multiple post hoc mean comparisons. The effect of the area position on soil properties was explained by Redundancy Analysis (RDA). The impact of each RSC field’s slope position on soil properties was analyzed using RDA, focusing on the position-based variation rather than individual layers. To ensure the integrity of our analysis, all explanatory variables underwent transformation and standardization through the application of the Hellinger method. Addressing concerns related to non-significant variables and collinearity, we adopted the forward selection method for variable selection. The R packages “tidyverse,” “agricolae,” “vegan,” “fastDummies,” and “ggplot2” were used for data arrangement, ANOVA and post hoc tests, data transformation, and data visualization.
3 Results
3.1 Variation of soil physical properties
The soil bulk densities among all fallow soils exhibited significant differences, with RSC-6Y showing the highest bulk density at 1.40 Mg m-3. The OM percentage was notably elevated in CF-15Y, while no significant difference in OM content was observed between the remaining RSC-6Y and RSC-12Y fields. Silt content was highest across all fallow soils, whereas the clay percentage in RSC-6Y was comparatively elevated compared to the other two sites (Table 1).
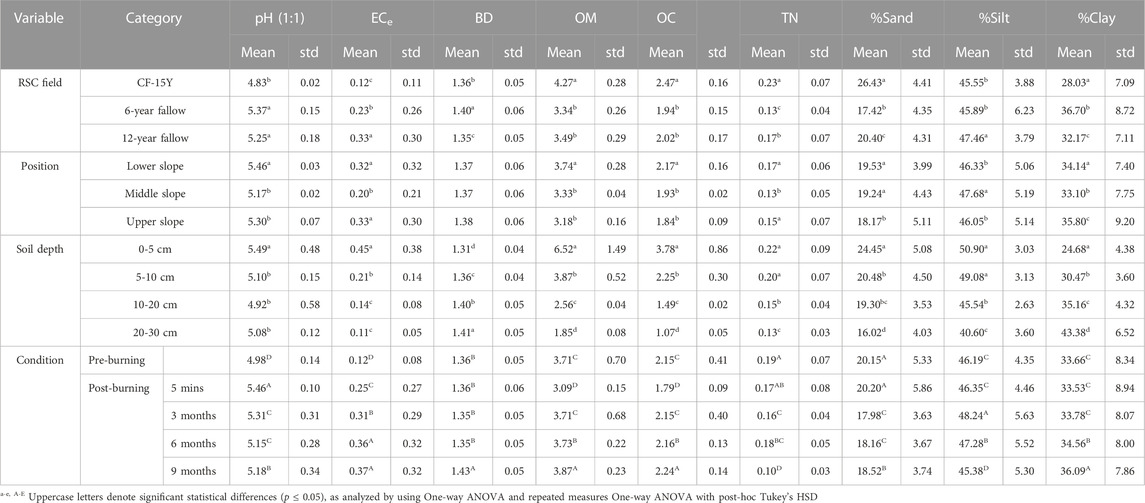
TABLE 1. Variation in soil properties: bulk density (BD) (Mg m-3), electrical conductivity (ECe) (dS m-1), organic matter (OM) (%), organic carbon (OC) (%), total nitrogen (TN) (%), and proportion of sand, silt and clay (%) with land use, position, soil depth, and chronological time of burning.
The topography positions have an impact on the soil physical properties in all RSC fields. The highest OM content was observed in the lower slope with 3.74%. Among the three types of soil particles, silt occupied the largest portion, and it was the richest in the middle slope with 47.68%. The percentages of sand in the lower and middle slopes were not significantly different, while the highest percentage of clay was found in the upper slope (Table 1).
The levels of OM exhibited significant differences after burning, displaying a pronounced decrease after 5 min of burning. Subsequently, there was a significant increase that persisted until 9 months after the fire, surpassing the pre-fire levels. However, soil bulk density and soil texture remained unaltered following the fire (Table 1).
3.2 Variation of soil chemical properties
The variation in soil chemical properties is influenced by the differences in fallow period. While CF-15Y exhibited a low pH value of 4.83, there was no significant difference in pH between RSC-6Y and RSC-12Y. It is important to note that there was a notable difference in ECe among the three types of fallow soil. TN had the highest proportion in CF-15Y, while its content was comparatively lower in RSC-6Y (Table 1). CEC was significantly higher in CF-15Y compared to RSC-6Y and RSC-12Y. There was no significant difference in available P between CF-15Y and RSC-6Y, while its content varied significantly in the 6- and 12-year fallow soils. Available K was most abundant in RSC-12Y, whereas RSC-6Y exhibited the highest available Ca content. Additionally, available Mg content was significantly higher in RSC-6Y compared to the other two types of fallow soil. It is worth mentioning that NH4-N and NO3-N levels differed significantly between CF-15Y and RSC-6Y, with both constituents being most abundant in RSC-12Y (Table 2).
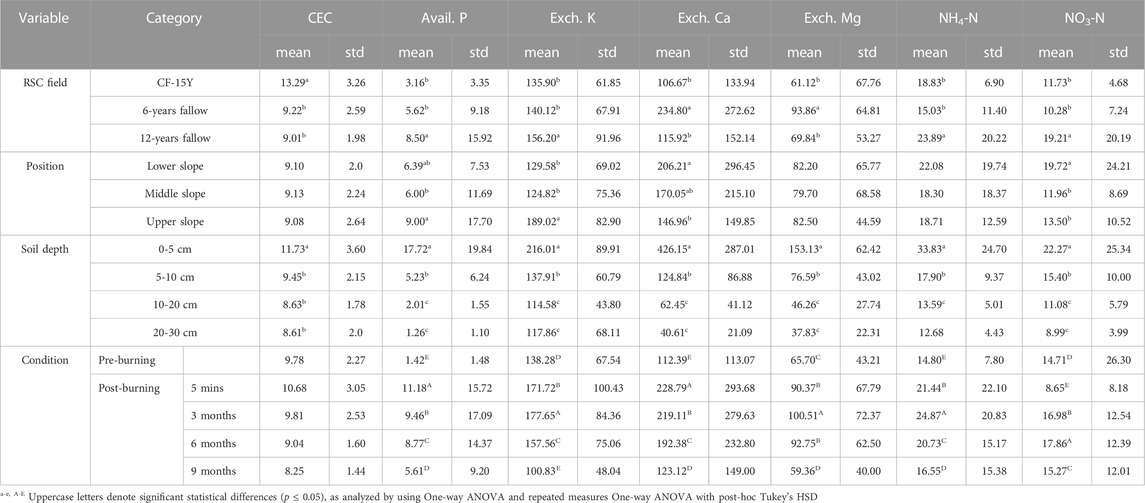
TABLE 2. Variation in soil properties: cation exchange capacity (CEC) (meq 100 g-1); available P (mg kg-1); exchangeable K, Ca, and Mg (mg kg-1), NH4-N, and NO3-N (mg kg-1) content with land use, position, soil depth, and chronological time of burning.
Topography, especially hillslopes, can have a significant impact on soil chemical properties. Soil pH was observed to be highest in the lower slope, whereas ECe exhibited relatively lower values in the middle slope. TN content was comparatively lower in the middle slope (Table 1). The upper slope had the highest concentration of available P, while the middle slope exhibited comparatively lower levels of available K. Available Ca and Mg were most abundant in the lower slope (Table 2).
After burning, the soil pH showed a significant increase at the 5-min post-burning stage, reaching a value of 5.46. The highest ECe was observed 9 months after burning. TN content exhibited a continuous decline after the fire (Table 1). Available P content was notably high 5 min after burning, with a value of 11.18 mg kg-1, while a remarkably high level of available K was found at the 3-month post-burning stage. Notably, available Ca contents in all post-burning stages displayed significant differences. A significant increase in available Mg was observed 3 months after burning, reaching a value of 100.51 mg kg-1. Both NH4-N and NO3-N contents in all post-burning stages were also significantly different (Table 2).
3.3 Variation of soil organic carbon and soil total nitrogen stocks
The results of the ANOVA analysis indicated that there were significant differences in SOC and STN due to various factors, including RSC field, time point, topography position, and soil depth (Table 3). Significant differences in STN were observed for all individual variables, except for the interaction with the topography position. This indicates that the effect of each variable is not dependent on the topography level, and each variable has a separate impact on STN (Table 3).
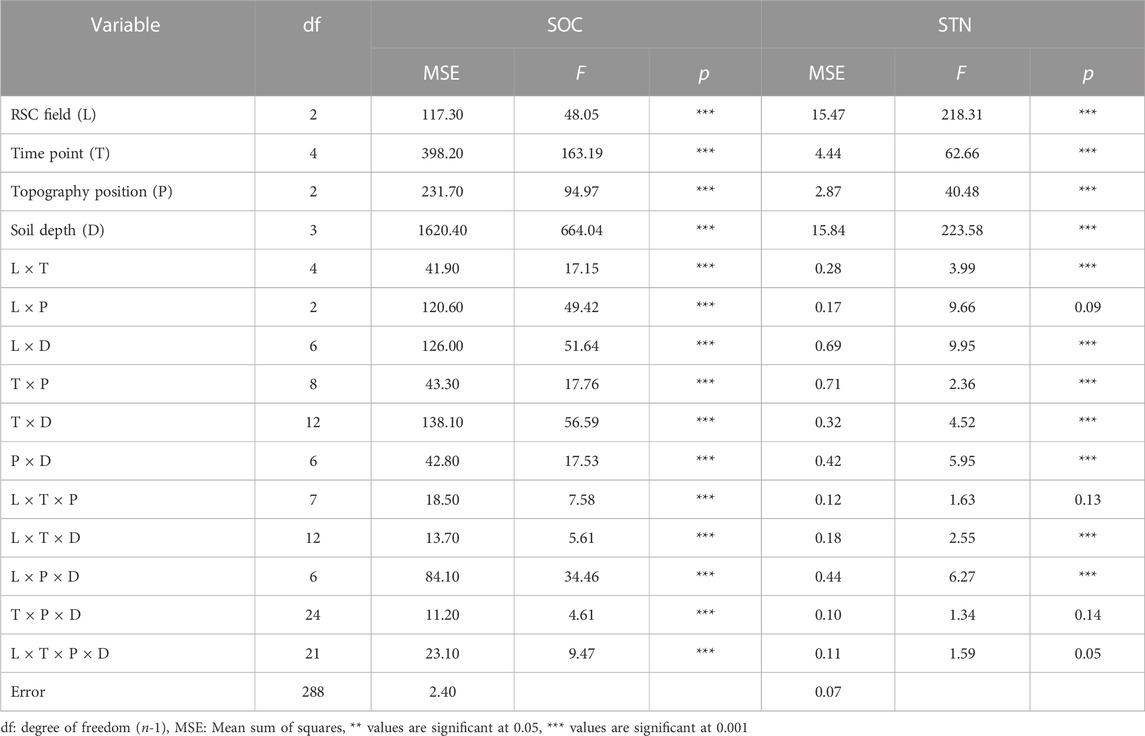
TABLE 3. Results of one-way repeated measures ANOVA for soil organic carbon (SOC) and total nitrogen (STN) according to RSC field, time point, topography position, soil depth, and their interactions among variables
SOC and STN levels can exhibit seasonal variability due to a range of factors across different slope positions. In CF-15Y, the SOC was highest at the 3-month stage after the fire, measuring 90.30 Mg C ha-1, while it was lowest at the 6-month stage (Figure 2; Table 4). Across all slopes of RSC-12Y, there was no significant difference in SOC between the pre-burning stage and the 5-min post-burning stage. However, in the three slopes of RSC-12Y, the highest SOC was observed at the 9-month post-burning stage. The amount of SOC was notably high in the lower slope of the RSC-6Y field 9 months after burning, totaling 95.48 Mg C ha-1 (Figure 3; Table 4). In CF-15Y, there was no significant difference in STN between the 3-, 6-, and 9-month stages, but the highest STN was recorded at the 9-month stage, reaching 10.16 Mg N ha-1. Among the three slopes of RSC-12Y, the STN was highest at the 6-month post-burning stage (Figure 4; Table 5). Notably, the STN was remarkably high in the middle slope of RSC-6Y at the 5-min post-burning stage (Figure 5; Table 5).
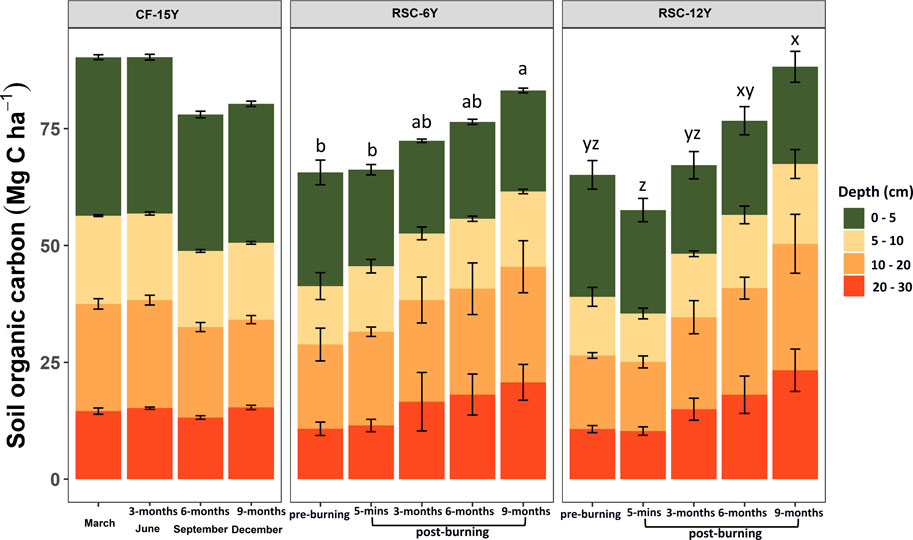
FIGURE 2. Soil organic carbon (Mg C ha-1) of 0–5, 5–10, 10–20, and 20–30 cm soil depth during pre-burning, and different time post-burning: 5-min, 3-month, 6-month, and 9-month under 6-year and 12-year left fallow for all slope positions compared with continues fallow 15-year. a–b and x–z denote significant differences among time period of each field (p ≤ 0.05).
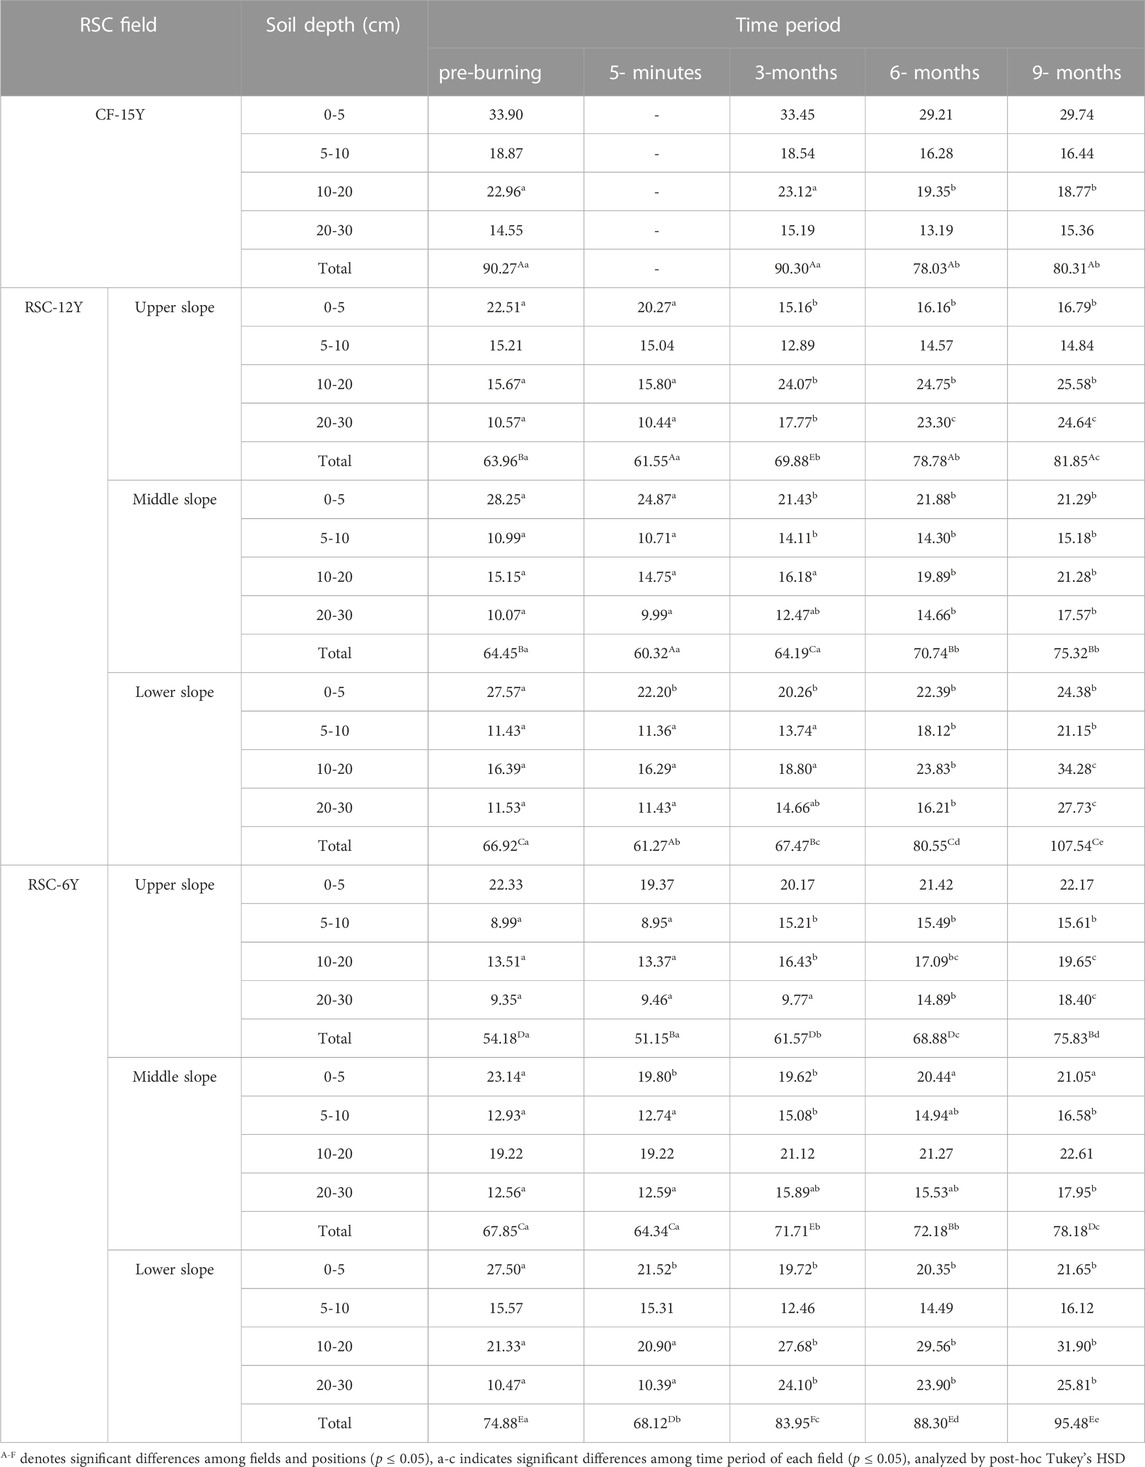
TABLE 4. Average soil organic carbon (Mg C ha-1) of sample soil: CF-15Y, RSC-12Y and RSC-6Y fields with different left fallow period (year) of RSC, position, soil depth, and chronological time of burning
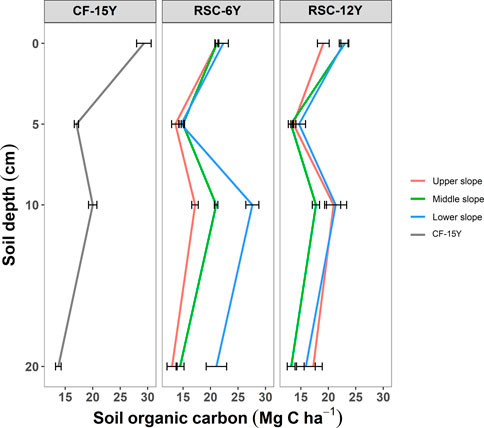
FIGURE 3. Variation of soil organic carbon (Mg C ha-1) with soil depth in different area position under 6-year and 12-year left fallow compared with continues fallow 15-year.
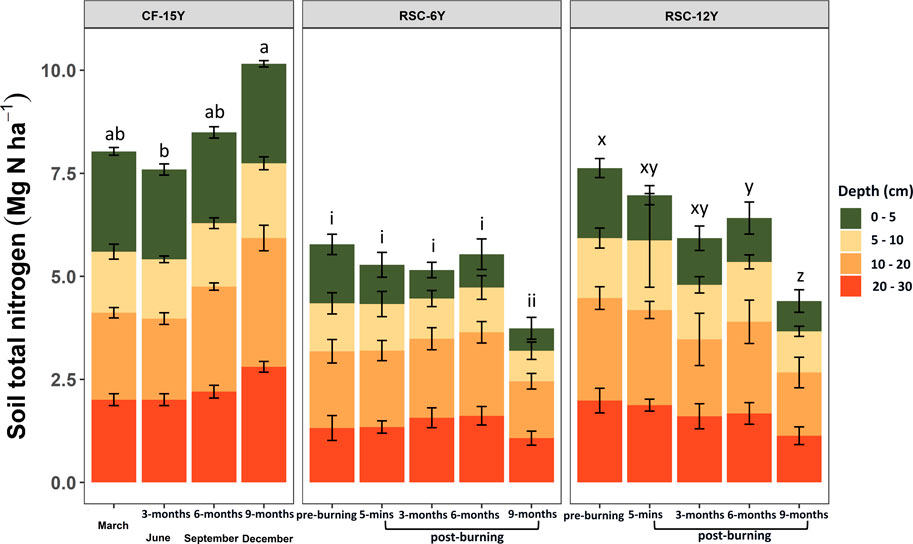
FIGURE 4. Soil total nitrogen (Mg N ha-1) of 0–5, 5–10, 10–20, and 20–30 cm soil depth during pre-burning, and different time post-burning: 5-min, 3-month, 6-month, and 9-month under 6-year and 12-year left fallow for all slope positions compared with continues fallow 15-year. a–b, i–ii, and x–z denote significant differences among time period of each field (p ≤ 0.05).
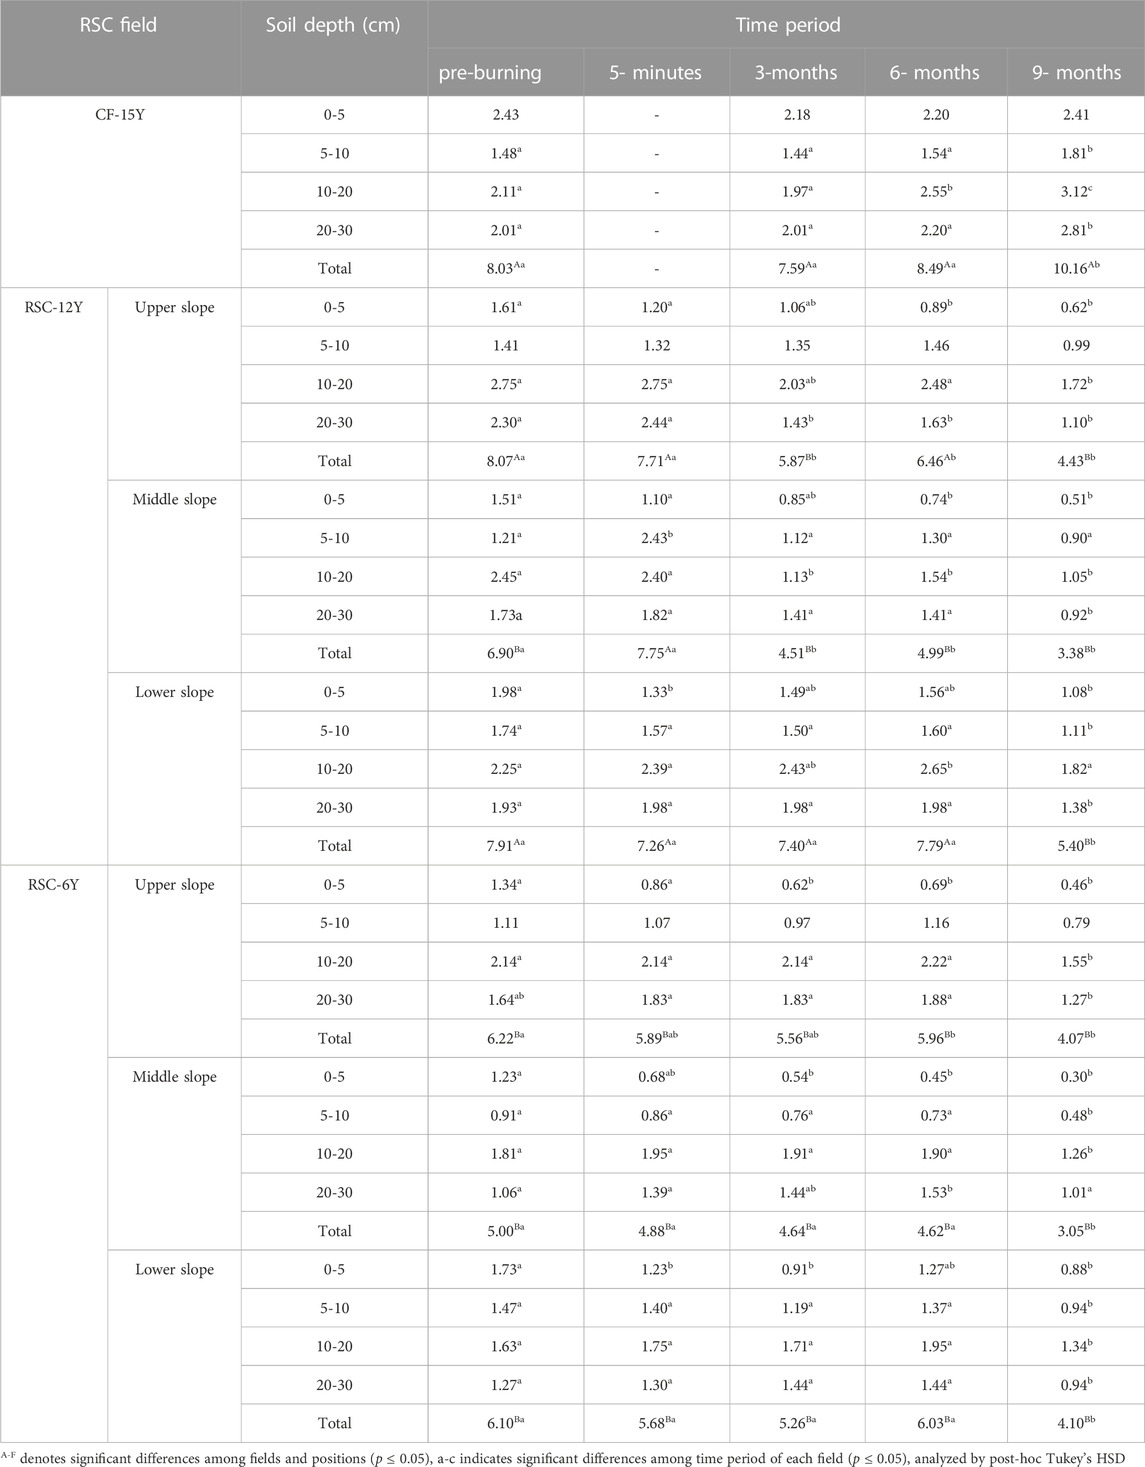
TABLE 5. Average soil total nitrogen (Mg N ha-1) of sample soil: CF-15Y, RSC-12Y and RSC-6Y fields with different left fallow period (year) of RSC, position, soil depth, and chronological time of burning
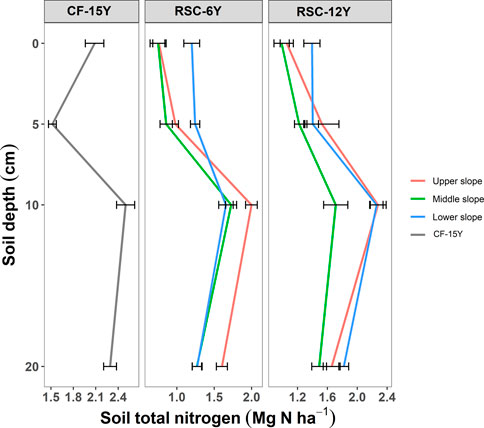
FIGURE 5. Variation of soil total nitrogen (Mg N ha-1) with soil depth in different area position under 6-year and 12-year left fallow compared with continues fallow 15-year.
The vertical distribution of SOC and STN stocks is important aspect of soil health and productivity (Figure 3, Figure 5). In CF-15Y, the highest SOC values were observed in March and at the 3-, 6-, and 9-month post-burning stages, specifically within the 0–5 cm depth, with corresponding values of 33.90, 33.45, 29.21, and 29.74 Mg C ha-1. Similarly, SOC was also the highest in RSC-6Y and RSC-12Y fields. It is noteworthy that SOC was higher at the pre-burning stage compared to the post-burning stages in RSC-6Y and RSC-12Y soils (Table 4). At the depth of 10–20 cm in RSC-6Y and RSC-12Y fields, SOC stocks were significantly higher in the lower slope than the surface layer (Figure 3). The STN stock in CF-15Y significantly increased at 9 months post-burning, particularly at a soil depth of 10–30 cm. Although STN stocks in the RSC-6Y site slightly increased at a soil depth of 10–30 cm at 3 and 6 months after burning, STN stock significantly declined at 9 months after the fire for all soil depths. At deeper layers (10–30 cm) of the upper slope, higher STN stocks were observed compared to the middle and lower slope positions. Moreover, the RSC-12Y field exhibited its highest STN stock at a soil depth of 10–20 cm, both in the upper and lower slope positions (Figure 5; Table 5).
3.4 Multivariable analysis
Redundancy analysis revealed that there were varying relationships between SOC and STN and soil properties in different topographic positions (Figures 6A,B). In Figure 6A, the RDA plot explains 51.88% of the variation in the position of RSC-6Y (adj. R2 = 0.48). Three topographic positions were separated along the first axis, with middle and upper slope areas (21.2%) separated from the lower slope area, while the second axis separated the middle slope area (30.6%) from the other two positions. Figure 6A clearly illustrates the significant impact of slope position on the SOC in the RSC-6Y site. The results demonstrate that SOC is highly influenced by the lower slope position, while the upper slope position exhibits an opposite effect. The following factors have a similar trend as SOC: pH and OM, while sand content and ECe have a less pronounced effect. On the other hand, bulk density and exch. K exhibit an opposing trend to SOC across the different slope positions. Meanwhile, nitrogen compounds (STN, NO3-N and TN) were closly associated with both upper and lower slope position.
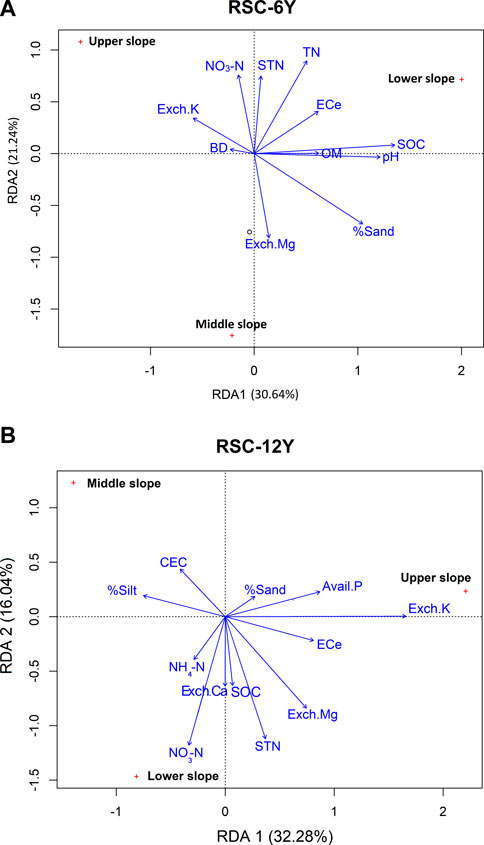
FIGURE 6. Redundancy analysis (RDA) of soil samples (0–30 cm) using soil properties response variables and quantitative explanatory variables under (A) 6-year left fallow and (B) 12-year left fallow in different position: lower, middle, and upper slopes.
For the RSC-12Y, the RDA plot used two axes to explain 48.32% of the variation in the three topographic positions (adj.R2 = 0.45, as shown in Figure 6B). The results indicate that NO3-N, STN, SOC, exch. Ca, and NH4-N were highly influenced by the lower slope position. On the other hand, Exch. K, Avail. P, sand content, and ECe were positively associated with the upper slope, while silt content and CEC were associated with the middle slope.
3.5 Soil surface loss
In the RSC-6Y, noticeable soil surface loss occurred in the middle and upper slopes 9 months after burning, even though the losses in these two slopes at the same post-burning stage did not display significant differences. In the RSC-12Y, the highest amount of soil surface loss was observed in the upper slope at the 9-month post-burning stage, totaling 4.98 cm lost. Notably, soil surface loss in the same fallow was significantly lower in the lower slope at all post-burning stages. In CF-15Y, a slight soil surface gain of 0.6 cm was noted in June, whereas this fallow experienced soil surface losses of 1.0 cm in September and 1.8 cm in December (Figure 7).
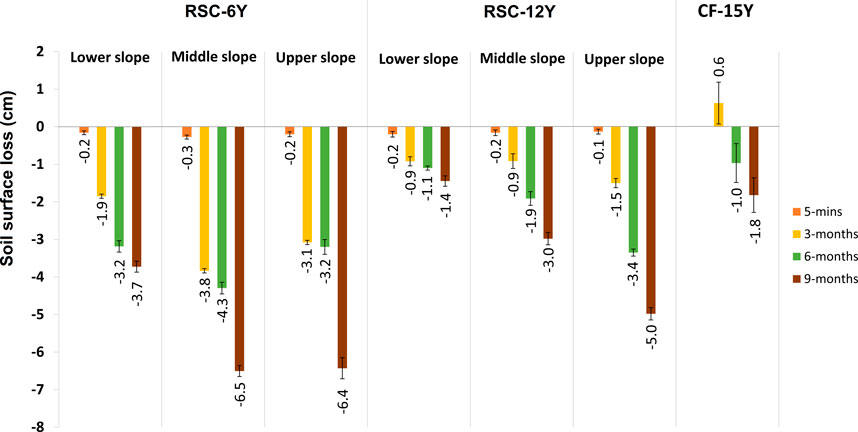
FIGURE 7. Soil surface loss (cm) of lower, middle, and upper slope during different time post-burning: 5-min, 3-month, 6-month, and 9-month under 6-year and 12-year left fallow compared with continues fallow 15-year.
4 Discussion
4.1 Effect of fallow periods on soil properties and soil surface loss
The results indicate that the CF-15Y had the highest OM and SOC stocks, particularly in the surface layer (0–5 cm) (Figure 2, Figure 3; Table 4). This trend was also observed for STN stocks (Figure 4, Figure 5; Table 5). Older fallow fields accumulate more leaf litter and other organic debris from above and below-ground biomass (Murovhi et al., 2012). In addition, the roots of weeds and grasses are a significant source of OM in the surface layer (Arunrat et al., 2023). This finding is consistent with Sharma et al. (2022), who reported that higher OM inputs from persistent vegetation cover in older fallow fields contribute to the higher OC content compared to younger fallow fields. The lower soil pH in CF-15Y compared to RSC-6Y and RSC-12Y (Table 3) suggests that it is rich in OM and undergoes more organic acid production during decomposition processes, which is consistent with Hong et al. (2019).
Currently, the fallow period of RSC fields has shortened due to population pressures and forest laws and regulations. As a result, most of the long-term fallow fields (>10 years) have become secondary natural forests, making it difficult to identify evidence of their previous boundaries. Thus, those fields eventually were no longer RSC fields; instead, they became natural forests. The shorter fallow cycle diminishes the ability of RSC to recover the ecosystem due to the loss of soil fertility through runoff and leaching, as observed in the current study (Figure 6). Prokop and Poreba (2012) found that 32–79 Mg ha–1 year–1 of soils were lost in the short fallow period of root crop cultivation on steep slopes in Northeast India. On the other hand, the loss of soil under natural forest was reported to range from 0.04 to 0.52 t ha-1 year-1 in Meghalaya, India (Saha et al., 2011). Arunrat et al. (2022b) found that the average soil erodibility at the topsoil (0–30 cm) of natural forest in northern Thailand was 0.1337 t h MJ-1 mm-1, the lowest value compared to crop lands. It takes several years for the restoration of topsoil nutrients after the conversion of natural forest to cropland. In northern Vietnam, Dung et al. (2008) estimated that the recovery of nitrogen and phosphorus would require more than 30 years and more than 6 years, respectively. In northern Thailand, Arunrat et al. (2023) observed that SOC and STN stocks had not reached pre-fire levels even after 2 years had passed. Meanwhile, a longer cycle duration allowed the germination of weed seeds and regrowth, which enhances the recovery of soil nutrients and reduces soil loss (Figure 7). Yadav (2013) found that the losses of carbon and nutrients in older fallow fields did not significantly affect crop productivity compared to younger fallow fields. Nevertheless, the findings of our current study, as depicted in Figure 7, demonstrate that CF-15Y experienced soil loss during the rainy season, with soil surface losses ranging from 1.0 to 1.8 cm. This phenomenon could be attributed to the substantial rainfall and resultant runoff, which likely led to soil deposition at the lowest slope position.
4.2 Effect of fire on soil properties and soil surface loss
The effects of fire on soil are primarily confined to the upper 10 cm of soil, where it can reduce soil moisture and increase soil temperature (Supplementary Table S1). This is because the increase in soil temperature can be attributed to the removal of canopy cover, loss of OM insulation, and deposition of black ash on the soil surface caused by the fire, which subsequently led to higher rates of evaporation (Cooperdock et al., 2020). The different heating temperatures during the fire altered the color of the ash, resulting in dark, reddish-brown ash that contained higher levels of pH, organic matter, electrical conductivity, total nitrogen, and soil nutrients (except available calcium) when compared to gray and white ashes (Supplementary Table S2). Black ash, which is the product of incomplete combustion of the litter containing a high proportion of carbon, is typically produced at low temperatures (<300 °C) (Úbeda et al., 2009). The reddish color of ash is due to the oxidation of iron minerals at low temperatures (Markl et al., 2006), while gray or white ash indicates high fire severity and more complete combustion of litter, which occurs at temperatures above 500 °C (Kuzyakov et al., 2018).
There is significant concern that shifting cultivation practices could deplete soil carbon and consequently increase CO2 levels in the atmosphere (Bruce et al., 1999). Detwiler (1986) estimated that shifting cultivation could lead to an average loss of 40% of soil carbon within 5 years. The current study found similar results to previous research, which showed a decline in SOC stocks in the surface layer (0–5 cm) at both RSC-6Y and RSC-12Y sites (as shown in Figure 2, Figure 3). This decline can be attributed to the combustion of OM in the soil, which is released into the atmosphere as CO2. The decline in STN stock after a fire (Figure 4, Figure 5) is attributed to the oxidation of OM through oxidized nitrogen gases and dinitrogen (N2) (Saplalrinliana et al., 2016). The decline in STN stocks continued even 9 months after burning in both RSC-6Y and RSC-12Y sites, as shown in Figure 4, Figure 5. This could be attributed to soil leaching and erosion caused by heavy rainfall, as the soil was left uncovered after burning. According to Bechmann (2014), nitrogen is highly susceptible to loss through surface and subsurface runoff in sloped areas. This can result in nutrient depletion and subsequently lead to reduced plant growth and productivity. Soil pH and ECe can increase after burning due to the release of basic cations (such as calcium, magnesium, and potassium) and the accumulation of ash, which contains alkaline materials (Table 1). The post-fire increase in ECe can also be attributed to the leaching of salts from the ash and the subsequent increased availability of nutrients that contribute to ion exchange processes in the soil (Da Silva Neto et al., 2019). The combustion of OM during a fire can release soil nutrients, such as Avail. P, Exch. K, Exch. Ca, Exch. Mg, and NH4-N, which could explain their increase after burning (Table 2). The increase in soil nutrients can be attributed to the ash generated from the combustion of vegetation, which contains essential nutrients that can replenish the soil (Saplalrinliana et al., 2016).
The loss of soil surface in RSC areas is a major concern not only for the loss of sediment but also for the decline in soil nutrients, as evidenced in the current study (Figure 7; Table 2). The burning of vegetation by fire strips away its protective cover, leaving the soil susceptible to erosion by wind and water. In addition, the heat generated by the fire can induce soil hydrophobicity, making it more prone to water repellency and erosion. Further, soil OM and structure loss due to burning can make the soil more vulnerable to erosion and result in a decline in soil nutrient availability. Our findings are also consistent with the study by Dass et al. (2010) who reported that soil nutrient losses of N, P, and K were primarily due to runoff and erosion in southern Orissa, India. Following the 3-month period post-burning, a discernible trend of rising SOC stocks was observed, persisting through the upland rice harvest stage at 9 months after burning, as depicted in Figure 2 and detailed in Table 1 (refer to OC values). The ash and charcoal left after burning can act as a source of nutrients and OM, leading to increased SOC levels. Chatterjee et al. (2022) reported an increase in SOC in shifting cultivation systems in India during the crop growing and fallow stages, which was attributed to the addition of OM from the regrowth of vegetation. Weeds and grasses can help to restore soil fertility during the fallowing phase (Xiao et al., 2022).
4.3 Vertical distribution and slope effect on soil properties and soil surface loss
The properties of soil can differ according to the depth in the soil profile, primarily attributed to the accumulation of OM, changes in soil texture and structure, and climate. Moreover, the topography of the land can also play a significant role in soil properties and surface loss, impacting factors such as soil erosion and nutrient availability. In RSC-6Y, an increase in SOC stock was observed at deeper layers (5–10 cm) after burning, resulting in higher levels than those before burning. At a depth of 10–30 cm, SOC stocks were significantly higher at lower slopes compared to the surface layer (Figure 3). There are two possible reasons for the increase in SOC and STN in deeper layer after a fire: ash deposition and vegetation changes. During a fire, OM is burned, and carbon is released into the atmosphere as CO2. However, some carbon remains in the form of charcoal or ash, which contains high levels of carbon and other plant nutrients, such as Ca, Mg, and K. When deposited in the soil, ash can be incorporated into deeper layers over time through erosion, bioturbation, or leaching (Bodí et al., 2014). After a fire, some plant species may be replaced by others with higher root biomass. These new plants can add OM to the soil through litterfall and root exudates, contributing to an increase in SOC and STN. They may also allocate more carbon to belowground biomass, such as roots, resulting in an increase in SOC and STN in deeper soil layers (Deng and Shangguan, 2017; Gross and Harrison, 2019). Sheikh et al. (2009) reported that the decline in SOC and STN with increasing soil depth could be attributed to the decomposition of plant residues, which were primarily located on the soil surface. The occurrence of heavy rainfall can lead to a decline in soil nutrients from the topsoil to the subsoil layer due to leaching losses, which can in turn promote the rapid growth of invasive weeds, as observed in the study conducted by Wapongnungsang et al. (2019).
Soil surface loss after a fire in sloped areas can have significant impacts on soil physicochemical properties (Figure 6). These impacts can be far-reaching and have long-term consequences for the growth and productivity of plants, as well as for the health and functioning of ecosystem. In sloped areas, the upper slope generally experiences greater erosion rates and soil surface loss compared to the lower slope or foothill areas. This is because the upper slope is more exposed to erosive forces such as rainfall and surface runoff, and the steeper gradient of the slope increases the velocity of water flowing over the soil surface. As a result, the upper slope tends to have thinner topsoil and lower OM and TN contents compared to the lower slope or foothill areas. The study conducted by Neergaard et al. (2008) supports the current study, as it revealed that the soil base-forming cations (K, Ca, Mg, and Na) and ECe exhibited significantly higher values in downslope soils when compared to upslope soils. Another possible mechanism, as explained by Bruun et al. (2006), is the loss of ash from the upper slope towards the foot of the slope. Gafur et al. (2003) also found that soil nutrients were washed away from the upper 10 cm and accumulated as sediments in the lower slope of shifting cultivation. Li et al. (2019) reported that depositional profiles at subsoil depth had significantly higher levels of SOC compared to non-eroding or eroding profiles, indicating greater SOC storage in those profiles. Furthermore, the slope can affect the rates of water infiltration and runoff. As the slope increases, the larger surface area and faster water flow lead to a decrease in infiltration. This results in a reduction of soil moisture content in deeper layers due to increased runoff and evaporation rates (Florinsky, 2012). However, future research could explore the vertical distribution and slope effects on soil properties and soil surface loss in RSC. This includes investigating the long-term effects of land use changes on soil properties, elucidating the physical and chemical processes contributing to soil erosion, and understanding how these processes vary across different slopes and soil types, as well as the effects of soil microbial communities. Such research efforts can provide a better understanding of the relationships between slope, depth, soil properties, and erosion rates, and inform sustainable land use and management practices that promote soil health and productivity.
5 Conclusion
Our study found that the SOC stock increased at 6- and 9-month post-burning, which were higher than the pre-burning levels. At deeper layers (5–10 cm), there was an upward trend in SOC stock resulting in higher values than pre-burning levels. The depth of 10–20 cm showed an increase in SOC stocks at lower slopes and higher than the surface layer. In contrast, STN stock decreased at the surface soil post-fire, while it increased in deeper layers at all slope positions. During the rainy season (September), the highest soil surface losses were observed after the fire, with the greatest losses occurring at the upper slope and the lowest at the lower slope. Additionally, lower slopes were found to be closely associated with SOC, STN, ECe, NO3-N, NH4-N, Exch. Ca, and Exch. Mg. To mitigate the negative effects on soil properties after fire, it is crucial to explore and implement effective post-fire management strategies.
Data availability statement
The original contributions presented in the study are included in the article/Supplementary Material, further inquiries can be directed to the corresponding author.
Author contributions
NA: conceptualization, methodology, investigation, writing—original draft, and writing—review and editing. SS: conceptualization, methodology, investigation, and writing—original draft. PK: methodology, investigation, and writing—original draft. MY: supervision. RH: conceptualization, methodology, and supervision.
Funding
This work (Grant No. RGNS 64–153) was supported by Office of the Permanent Secretary, Ministry of Higher Education, Science, Research and Innovation (OPS MHESI), Thailand Science Research and Innovation (TSRI) and Mahidol University.
Acknowledgments
We would like to thank the Office of the Permanent Secretary, Ministry of Higher Education, Science, Research, and Innovation (OPS MHESI), Thailand Science Research and Innovation (TSRI) and Mahidol University for supporting this study. The study was conducted according to the guidelines of the Declaration of Helsinki, and approved by the Institutional Review Board of Institute for Population and Social Research, Mahidol University (IPSR-IRB) (COA. No. 2022/03–059).
Conflict of interest
The authors declare that the research was conducted in the absence of any commercial or financial relationships that could be construed as a potential conflict of interest.
Publisher’s note
All claims expressed in this article are solely those of the authors and do not necessarily represent those of their affiliated organizations, or those of the publisher, the editors and the reviewers. Any product that may be evaluated in this article, or claim that may be made by its manufacturer, is not guaranteed or endorsed by the publisher.
Supplementary material
The Supplementary Material for this article can be found online at: https://www.frontiersin.org/articles/10.3389/fenvs.2023.1213181/full#supplementary-material
References
Agegnehu, G., Bird, M. I., Nelson, P. N., and Bass, A. M. (2015). The ameliorating effects of biochar and compost on soil quality and plant growth on a Ferralsols. Soil Res. 53 (1), 1–12. doi:10.1071/sr14118
Alcañiz, M., Outeiro, L., Francos, M., Farguell, J., and Úbeda, X. (2016). Long-term dynamics of soil chemical properties after a prescribed fire in a Mediterranean forest (Montgrí Massif, Catalonia, Spain) Massif, Catalonia, Spain). Sci. Total Environ. 572, 1329–1335. doi:10.1016/j.scitotenv.2016.01.115
Arunrat, N., Sereenonchai, S., and Hatano, R. (2022a). Effects of fire on soil organic carbon, soil total nitrogen, and soil properties under rotational shifting cultivation in northern Thailand. J. Environ. Manag. 302, 113978. doi:10.1016/j.jenvman.2021.113978
Arunrat, N., Sereenonchai, S., Kongsurakan, P., Iwai, C. B., Yuttitham, M., and Hatano, R. (2023). Post-fire recovery of soil organic carbon, soil total nitrogen, soil nutrients, and soil erodibility in rotational shifting cultivation in Northern Thailand. Front. Environ. Sci. 11, 1117427. doi:10.3389/fenvs.2023.1117427
Arunrat, N., Sereenonchai, S., and Hatano, R. (2021). Impact of burning on soil organic carbon of maize-upland rice system in Mae Chaem Basin of Northern Thailand. Geoderma 392, 115002. doi:10.1016/j.geoderma.2021.115002
Arunrat, N., Sereenonchai, S., Kongsurakan, P., and Hatano, R. (2022b). Soil organic carbon and soil erodibility response to various land-use changes in northern Thailand. Catena 219, 106595. doi:10.1016/j.catena.2022.106595
Bass, S., and Morrison, E. (1994). Shifting cultivation in Thailand, Laos and Vietnam: Regional overview and policy recommendations. London. UK: International Institute for Environment and Development IIED.
Bechmann, M. (2014). Long-term monitoring of nitrogen in surface and subsurface runoff from small agricultural dominated catchments in Norway. Agric. Ecosyst. Environ. 198, 13–24. doi:10.1016/j.agee.2014.05.010
Bodí, M., Martin, D. A., Santín, C., Balfour, V., Doerr, S. H., Pereira, P., et al. (2014). Wildland fire ash: production, composition and eco-hydro-geomorphic effects. Earth Sci. Rev. 130, 103–127. doi:10.1016/j.earscirev.2013.12.007
Bray, R. A., and Kurtz, L. T. (1945). Determination of total organic and available form of phosphorus in soil. Soil Sci. 59, 39–46. doi:10.1097/00010694-194501000-00006
Bruce, J. P., Frome, M., and Haite, E. (1999). Carbon sequestra-tion in soils. J. Soil Water Cons. 54, 382–389.
Bruun, T. B., Mertz, O., and Elberling, B. (2006). Linking yields of upland rice in shifting cultivation to fallow length and soil properties. Agric. Ecosyst. Environ. 113, 139–149. doi:10.1016/j.agee.2005.09.012
Chatterjee, D., Kuotsu, R., Raya, S. K., Patra, M. K., Thirugnanavel, A., Kumar, R., et al. (2022). Preventing soil degradation in shifting cultivation using integrated farming system models. Archives Agron. soil Sci. 68 (13), 1841–1857. doi:10.1080/03650340.2021.1937139
Christensen, N. L., and Muller, C. (1975). Effects of fire on factors controlling plant growth in Adenostoma chaparral. Ecol. Monogr. 45, 29–55. doi:10.2307/1942330
Cooperdock, S. C., Hawkes, C. V., Xu, D. R., and Breecker, D. O. (2020). Soil water content and soil respiration rates are reduced for years following wildfire in a hot and dry climate. Glob. Biogeochem. Cycles 34, e2020GB006699. doi:10.1029/2020gb006699
Curtis, P. G., Slay, C. M., Harris, N. L., Tyukavina, A., and Hansen, M. C. (2018). Classifying drivers of global forest loss. Science 361, 1108–1111. doi:10.1126/science.aau3445
Da Silva Neto, E. C., Pereira, M. G., Frade Júnior, E. F., Da Silva, S. B., Carvalho Júnior, J. A., and Dos Santos, J. C. (2019). Temporal evaluation of soil chemical attributes after slash-and-burn agriculture in the Western Brazilian Amazon. Acta Sci. - Agron. 41 (1), e42609. doi:10.4025/actasciagron.v41i1.42609
Dass, A., Sudhishri, S., Lenka, N. K., and Patnaik, U. (2010). Runoff capture through vegetative barriers and planting methodologies to reduce erosion, and improve soil moisture, fertility and crop productivity in southern Orissa, India. Nutr. Cycl. Agroecosys 89, 45–57. doi:10.1007/s10705-010-9375-3
Dempster, D. N., Jones, D. L., and Murphy, D. V. (2012). Clay and biochar amendments decreased inorganic but not dissolved organic nitrogen leaching in soil. Soil Res. 50 (3), 216–221. doi:10.1071/sr11316
Deng, L., and Shangguan, Z-P. (2017). Afforestation drives soil carbon and nitrogen changes in China. Land Degrad. Dev. 28 (1), 151–165. doi:10.1002/ldr.2537
Detwiler, R. P. (1986). Land use change and the global car-bon cycle: the role of tropical soils. Biogeochemistry 2, 67–93. doi:10.1007/bf02186966
Ellert, B. H., and Bettany, J. R. (1995). Calculation of organic matter and nutrients stored in soils under contrasting management regimes. Can. J. Soil Sci. 75, 529–538. doi:10.4141/cjss95-075
Faria, S. R., De la Rosa, J. M., Knicker, H., González-Pérez, J. A., and Keizer, J. J. (2015). Molecular characterization of wildfire impacts on organic matter in eroded sediments and top-soil in Mediterranean eucalypt stands. Catena 135, 29–37. doi:10.1016/j.catena.2015.07.007
Fierer, N., Lauber, C. L., Ramirez, K. S., Zaneveld, J., Bradford, M. A., and Knight, R. (2012). Comparative metagenomic, phylogenetic and physiological analyses of soil microbial communities across nitrogen gradients. ISME J. 6, 1007–1017. doi:10.1038/ismej.2011.159
Florinsky, I. (2012). Digital terrain analysis in soil science and geology. Cambridge, MA, USA: Academic Press.
Gafur, A., Borggaard, O. K., Jensen, J. R., and Petersen, L. (2000). Changes in soil nutrient content under shifting cultivation in the Chittagong Hill Tracts of Bangladesh. Geogr. Tidsskr. Dan. J. Geogr. 100, 37–46. doi:10.1080/00167223.2000.10649437
Gafur, A., Jensenb, J. R., Borggaard, O. K., and Petersen, L. (2003). Runoff and losses of soil and nutrients from small watersheds under shifting cultivation (Jhum) in the Chittagong Hill Tracts of Bangladesh. J. Hydrology 274 (1-4), 30–46. doi:10.1016/s0022-1694(02)00351-7
Gross, C. D., and Harrison, R. B. (2019). The case for digging deeper: soil organic carbon storage, dynamics, and controls in our changing world storage, dynamics, and controls in our changing world. Soil Syst. 3, 28. doi:10.3390/soilsystems3020028
Haj-Amor, Z., Araya, T., Kim, D. G., Bouri, S., Lee, J., Ghiloufi, W., et al. (2022). Soil salinity and its associated effects on soil microorganisms, greenhouse gas emissions, crop yield, biodiversity and desertification: a review. Sci. Total Environ. 843, 156946. doi:10.1016/j.scitotenv.2022.156946
Hong, S., Gan, P., and Chen, A. (2019). Environmental controls on soil pH in planted forest and its response to nitrogen deposition. Environ. Res. 172, 159–165. doi:10.1016/j.envres.2019.02.020
Jhariya, M. K., and Singh, L. (2021). Effect of fire severity on soil properties in a seasonally dry forest ecosystem of Central India. Int. J. Environ. Sci. Technol. 18, 3967–3978. doi:10.1007/s13762-020-03062-8
Kuzyakov, Y., Merino, A., and Pereira, P. (2018). Ash and fire, char, and biochar in the environment. Land Degrad. Dev. 29, 2040–2044. doi:10.1002/ldr.2979
Lal, R. (2003). Global potential of soil carbon sequestration to mitigate the greenhouse effect. Crit. Rev. Plant Sci. 22 (2), 151–184. doi:10.1080/713610854
Lauber, C., Knight, R., Hamady, M., and Fierer, N. (2009). Pyrosequencing-based assessment of soil pH as a predictor of soil bacterial community structure at the continental scale community structure at the continental scale: a pyrosequencing-based assessment. Appl. Environ. Microbiol. 75, 5111–5120. doi:10.1128/aem.00335-09
Lehmann, J., Pereira da Silva, J., Steiner, C., Nehls, T., Zech, W., and Glaser, B. (2003). Nutrient availability and leaching in an archaeological anthrosol and a ferralsol of the central amazon basin: fertilizer, manure and charcoal amendments. Plant Soil 249, 343–357. doi:10.1023/a:1022833116184
Li, T., Zhang, H., Wang, X., Cheng, S., Fang, H., Liu, G., et al. (2019). Soil erosion affects variations of soil organic carbon and soil respiration along a slope in Northeast China. Ecol. Process. 8, 28. doi:10.1186/s13717-019-0184-6
Markl, G., Blackenburg, F. V., and Wagner, T. (2006). Iron isotope fractionation during hydrothermal ore deposition and alteration. Geochim. Cosmochim. Acta 70, 3011–3030. doi:10.1016/j.gca.2006.02.028
Mcdonald, M. A., Healey, J. R., and Stevens, P. A. (2002). The effects of secondary forest clearance and subsequent land-use on erosion losses and soil properties in the Blue Mountains of Jamaica and subsequent land-use on erosion losses and soil properties in the Blue Mountains of Jamaica. Agric. Ecosyst. Environ. 92 (1), 1–19. doi:10.1016/s0167-8809(01)00286-9
Mishra, B. K., and Ramakrishnan, P. S. (1983). Slash and burn agriculture at higher elevations in North-Eastern India. I. Sediment, water and nutrient losses North-eastern India. Sediment, water and nutrient losses. Agric. Ecosyst. Environ. 9, 69–82. doi:10.1016/0167-8809(83)90007-5
Moragues-Saitua, L., Arias-González, A., Blanco, F., Benito-Carnero, G., and Gartzia- Bengoetxea, N. (2023). Effects of biochar and wood ash amendments in the soil-water-plant environment of two temperate forest plantations. Front. For. Glob. Change 5, 878217. doi:10.3389/ffgc.2022.878217
Murovhi, N. R., Materechera, S. A., and Mulugeta, S. D. (2012). Seasonal changes in litter fall and its quality from three sub-tropical fruit tree species at Nelspruit, South Africa its quality from three sub-tropical fruit tree species at Nelspruit, South. Africa. Agrofor. Syst. 86 (1), 61–71. doi:10.1007/s10457-012-9508-6
National Soil Survey Center, (1996). Soil Survey laboratory methods manual. Soil Survey investigations. Washington, DC, USA: USDA.
Neergaard, de A., Magid, J., and Ole Mertz, O. (2008). Soil erosion from shifting cultivation and other smallholder land use in Sarawak, Malaysia. Agric. Ecosyst. Environ. 125, 182–190. doi:10.1016/j.agee.2007.12.013
Pennington, P., Laffan, M., Lewis, R., and Otahal, P. (2001). Assessing the long-term impacts of forest harvesting and high intensity broadcast burning on soil properties at the Warra LTER site. Tasforests 13, 291–301.
Phillips, D. H., Foss, J. E., Buckner, E. R., Evans, R. M., and FitzPatrick, E. A. (2000). Response of surface horizons in an oak forest to prescribed burning surface horizons in an oak forest to prescribed burning. Soil Sci. Soc. Am. J. 64, 754–760. doi:10.2136/sssaj2000.642754x
Prokop, P., and Poreba, G. J. (2012). Soil erosion associated with an upland farming system under population pressure in Northeast India. Land Degrad. Dev. 23, 310–321. doi:10.1002/ldr.2147
Reed, E. Y., Chadwick, D. R., Hill, P. W., and Jones, D. L. (2017). Critical comparison of the impact of biochar and wood ash on soil organic matter cycling and grassland productivity of biochar and wood ash on soil organic matter cycling and grassland productivity. Soil Biol. Biochem. 110, 134–142. doi:10.1016/j.soilbio.2017.03.012
Rerkasem, K., and Rerkasem, B. (1994). Shifting cultivation in Thailand: Its current situation and dynamics in the context of highland development. London, UK: International Institute for Environment and Development.
Rumpel, C., and Kögel-Knabner, I. (2011). Deep soil organic matter—A key but poorly understood component of terrestrial C cycle understood component of terrestrial C cycle. Plant Soil 338 (1), 143–158. doi:10.1007/s11104-010-0391-5
Saha, R., Mishra, V. K., and Khan, S. K. (2011). Soil erodibility characteristics under modified land-use systems as against shifting cultivation in hilly ecosystems of Meghalaya, India. J. Sustain. For. 30, 301–312. doi:10.1080/10549811.2011.531992
Saplalrinliana, H., Thakuria, D., Changkija, S., and Hazarika, S. (2016). Impact of shifting cultivation on litter accumulation and properties of Jhum soils of north east India cultivation on litter accumulation and properties of Jhum soils of north east India. J. Indian Soc. Soil Sci. 64 (4), 402–413. doi:10.5958/0974-0228.2016.00052.9
Sharma, S. B., Kumar, S., Ovung, E. Y., and Konsam, B. (2022). Vegetation dynamics and soil nutrients across different shifting cultivation fallows in Montane Subtropical Forest of Mizoram, NE India nutrients across different shifting cultivation fallows in Montane Subtropical Forest of Mizoram, NE India. Acta Oecol. 115, 103833. doi:10.1016/j.actao.2022.103833
Sheikh, M. A., Kumar, M., and Bussmann, R. W. (2009). Altitudinal variation in soil organic carbon stock in coniferous subtropical and broadleaf temperate forests in garhwal himalaya carbon stock in coniferous subtropical and broadleaf temperate forests in garhwal himalaya. Carbon Balance Manag. 4 (1), 6. doi:10.1186/1750-0680-4-6
Smith, P. (2004). Carbon sequestration in croplands: the potential in europe and the global context context. Eur. J. Agron. 20 (3), 229–236. doi:10.1016/j.eja.2003.08.002
Teng, M. J., Zeng, L. X., Xiao, W. F., Huang, Z. L., Zhou, Z. X., Yan, Z. G., et al. (2017). Spatial variability of soil organic carbon in Three Gorges Reservoir area, China. China. Sci. Total Environ. 599–600, 1308–1316. doi:10.1016/j.scitotenv.2017.05.085
Thrupp, L. A., Hecht, S., and Browder, J. (1997). The diversity and dynamics of shifting cultivation: Myths, Realities, and Policy Implications. Washington, DC, USA: World Resources Institute.
Trumbore, S. (2009). Radiocarbon and soil carbon dynamics. Annu. Rev. Earth Planet. Sci. 37 (1), 47–66. doi:10.1146/annurev.earth.36.031207.124300
Úbeda, X., Pereira, P., Outeiro, L., and Martin, D. A. (2009). Effects of fire temperature on the physical and chemical characteristics of the ash from two plots of cork oak (Quercus suber). Land Degrad. Dev. 20, 589–608. doi:10.1002/ldr.930
Usda, (1954). Diagnosis and improvement of saline and alkali soils, agriculture. Washington, DC, USA: U.S. Salinity Laboratory. Government Printing Office.
Van Oost, K., Quine, T., Govers, G., De Gryze, S., Six, J., Harden, J., et al. (2007). The impact of agricultural soil erosion on the global carbon cycle of agricultural soil erosion on the global carbon cycle. Science 318, 626–629. doi:10.1126/science.1145724
van Straaten, O., Corre, M. D., Wolf, K., Tchienkoua, M., Cuellar, E., Matthews, R. B., et al. (2015). Conversion of lowland tropical forests to tree cash crop plantations loses up to one−half of stored soil organic carbon. Proc. Natl. Acad. Sci. U. S. A. 112, 9956–9960. doi:10.1073/pnas.1504628112
Wairiu, M., and Lal, R. (2003). Soil organic carbon in relation to cultivation and topsoil removal on sloping lands of Kolombangara, Solomon Islands on sloping lands of Kolombangara, Solomon Islands. Soil Tillage Res. 70, 19–27. doi:10.1016/s0167-1987(02)00116-2
Walkley, A., and Black, J. A. (1934). An examination of the dichormate method for determining soil organic matter and a proposed modification of the chromic acid titration method. Soil Sci. 37, 29–38. doi:10.1097/00010694-193401000-00003
Wapongnungsang, , Singh, B. Sh., and Tripathi, S. K. (2019). Changes in weed diversity and biomass during crop growth in three age chronosequence of forest fallows in Muallungthu village. Mizoram. Indian J. Ecol. 46 (1), 70–75.
Xiao, J., Chen, S., Sun, Y., Wu, S., Liang, W., and Yang, S. (2022). Effects of mechanical weeding on soil fertility and microbial community structure in star anise (Illicium verum Hook.f.) plantations on soil fertility and microbial community structure in star anise (Illicium verum Hook.f.) plantations. PLoS ONE 17 (4), e0266949. doi:10.1371/journal.pone.0266949
Yadav, P. K. (2013). Slash-and-burn agriculture in north-east India. J. Expert. Opin. Environ. Biol. 2, 2–5. doi:10.4172/2325-9655.1000102
Keywords: rotational shifting cultivation, soil organic carbon, soil total nitrogen, soil loss, fire
Citation: Arunrat N, Sereenonchai S, Kongsurakan P, Yuttitham M and Hatano R (2023) Variations of soil properties and soil surface loss after fire in rotational shifting cultivation in Northern Thailand. Front. Environ. Sci. 11:1213181. doi: 10.3389/fenvs.2023.1213181
Received: 27 April 2023; Accepted: 21 August 2023;
Published: 05 September 2023.
Edited by:
Aaron Kinyu Hoshide, University of Maine, United StatesReviewed by:
Manoj Kumar Jhariya, Sant Gahira Guru Vishwavidyalaya, IndiaSamuel Obeng Apori, Technological University Dublin, Ireland
Copyright © 2023 Arunrat, Sereenonchai, Kongsurakan, Yuttitham and Hatano. This is an open-access article distributed under the terms of the Creative Commons Attribution License (CC BY). The use, distribution or reproduction in other forums is permitted, provided the original author(s) and the copyright owner(s) are credited and that the original publication in this journal is cited, in accordance with accepted academic practice. No use, distribution or reproduction is permitted which does not comply with these terms.
*Correspondence: Noppol Arunrat, bm9wcG9sLmFydUBtYWhpZG9sLmFjLnRo