
94% of researchers rate our articles as excellent or good
Learn more about the work of our research integrity team to safeguard the quality of each article we publish.
Find out more
ORIGINAL RESEARCH article
Front. Environ. Sci., 11 July 2023
Sec. Conservation and Restoration Ecology
Volume 11 - 2023 | https://doi.org/10.3389/fenvs.2023.1212206
This article is part of the Research TopicHydrology, Water Resources, and Ecosystem Sustainable DevelopmentView all 10 articles
 Judith Z. Drexler1*
 Helen Raine2James D. Jacobi3Sally House1Pūlama Lima4William Haase5Arleone Dibben-Young6Bret Wolfe7
Hawaiian coastal wetlands provide important habitat for federally endangered waterbirds and socio-cultural resources for Native Hawaiians. Currently, Hawaiian coastal wetlands are degraded by development, sedimentation, and invasive species and, thus, require restoration. Little is known about their original structure and function due to the large-scale alteration of the lowland landscape since European contact. Here, we used 1) rapid field assessments of hydrology, vegetation, soils, and birds, 2) a comprehensive analysis of endangered bird habitat value, 3) site spatial characteristics, 4) sea-level rise projections for 2050 and 2100 and wetland migration potential, and 5) preferences of the Native Hawaiian community in a GIS site suitability analysis to prioritize restoration of coastal wetlands on the island of Molokaʻi. The site suitability analysis is the first, to our knowledge, to incorporate community preferences, habitat criteria for endangered waterbirds, and sea-level rise into prioritizing wetland sites for restoration. The rapid assessments showed that groundwater is a ubiquitous water source for coastal wetlands. A groundwater-fed, freshwater herbaceous peatland or “coastal fen” not previously described in Hawaiʻi was found adjacent to the coastline at a site being used to grow taro, a staple crop for Native Hawaiians. In traditional ecological knowledge, such a groundwater-fed, agro-ecological system is referred to as a loʻipūnāwai (spring pond). Overall, 39 plant species were found at the 12 sites; 26 of these were wetland species and 11 were native. Soil texture in the wetlands ranged from loamy sands to silt and silty clays and the mean % organic carbon content was 10.93% ± 12.24 (sd). In total, 79 federally endangered waterbirds, 13 Hawaiian coots (‘alae keʻokeʻo; Fulica alai) and 66 Hawaiian stilts (aeʻo; Himantopus mexicanus knudseni), were counted during the rapid field assessments. The site suitability analysis consistently ranked three sites the highest, Kaupapaloʻi o Kaʻamola, Kakahaiʻa National Wildlife Refuge, and ʻŌhiʻapilo Pond, under three different weighting approaches. Site prioritization represents both an actionable plan for coastal wetland restoration and an alternative protocol for restoration decision-making in places such as Hawaiʻi where no pristine “reference” sites exist for comparison.
In many places around the world, there are no pristine wetland “reference” sites to stand as guideposts for restoration targets (Otte et al., 2021). This is the case in the Hawaiian Islands due to the nearly complete alteration of lowland habitats after European contact and before botanical descriptions were documented. To date, 44% of the coastal wetland area in Hawaiʻi has been lost to other land uses (Van Rees and Reed, 2013). The remaining coastal wetlands provide crucial habitat for native invertebrates and plants, migratory birds, and federally endangered waterbirds including the Hawaiian stilt (ae‘o; Himantopus mexicanus knudseni), Hawaiian coot (‘alae ke‘oke‘o; Fulica alai), Hawaiian duck (koloa maoli; Anas wyvilliana), and Hawaiian common gallinule (‘alae ‘ula, Gallinula galeata sandvicensis; currently extirpated from Molokaʻi) (State of Hawai‘i, 1996; Pacific Coast Joint Venture, 2006; US Fish and Wildlife Service, 2011a; VanderWerf, 2012).
Historically, Hawaiian coastal wetlands were widely used to grow taro, a vital subsistence crop for Native Hawaiians. Taro (Colocasia esculenta) patches (loʻi kalo) were built inland from fish ponds (loko iʻa) along the coast, creating habitat mosaics that expanded the natural wetland habitat for shorebird populations (Burney et al., 2001; Harmon et al., 2021). Hawaiian coastal wetlands continue to have important socio-cultural uses as food sources and producers of native sedges (makaloa, Cyperus laevigatus) for weaving (Krauss, 2001; Erickson and Puttock, 2006). In addition, coastal wetlands in Hawaiʻi, as well as elsewhere around the world, have long provided essential ecosystem services such as carbon sequestration, trapping of sediments and nutrients, abatement of storm impacts, and protection from flooding (Roman and Burdick, 2012; Craft, 2016; Kroeger et al., 2017).
Land-use change along Hawaiʻi’s coastline started with the loʻi kalo and loko iʻa of the early Polynesians and culminated in rice and sugar plantations in the years following European contact (Athens et al., 1992; Burney et al., 2001; Gon and Winter, 2019). Mauka (toward the mountains, upland) of the lowlands, ranching, invasive ungulates, and pineapple cultivation have caused massive erosion, which has impacted the entire continuum from ridge to reef (Stock et al., 2011; Jacobi and Stock, 2017). The widespread anthropogenic transformation of coastal areas and the introduction of invasive plant species have resulted in the loss of most lowland native flora (Kirch, 1982; Cuddihy and Stone, 1990; Athens et al., 1992; Burney et al., 1997). Currently, most coastal wetlands in Hawaiʻi continue to be degraded by sedimentation, non-native ungulates, invasive plants (mainly mangrove (Rhizophora mangle), kiawe (Prosopis pallida), pickleweed (Batis maritima), and Indian fleabane (Pluchea indica)), development, and/or hydrologic changes from stream diversion, drought, and/or climate change (US Fish and Wildlife Service, 2011a; Van Rees and Reed, 2013).
Hawaiian coastal wetlands have received scant attention in the scientific literature. The most comprehensive classification of coastal wetlands (Erickson and Puttock, 2006) describes them as saline or brackish in salinity and consisting either of “coastal flats” or “estuarine wetlands.” Coastal flats are defined as groundwater driven, occurring in a floodplain, and containing mineral substrate. This definition differs somewhat from other definitions in the literature in which coastal flats are described as tidal ecosystems dominated by sediments and/or sand and found along coasts with low slope and energy (Jackson, 2013; Murray et al., 2019). Estuarine wetlands are defined by Erickson and Puttock (2006) as surface-water driven, occurring at river mouths or adjacent to tidal rivers, and containing organic or mineral substrates. Due to the complex hydrogeology, varied geomorphology, and novel plant communities on Molokaʻi, we hypothesized that these two main classifications may not encompass the full spectrum of coastal wetlands on the island. In particular, we surmised that there may be freshwater wetlands in areas receiving high rates of groundwater discharge along the coastline of the island (Oki et al., 2019).
Although few data exist in Western science to support this hypothesis, it is well supported by traditional ecological knowledge (TEK) in the Native Hawaiian culture, which speaks not only of the great socio-cultural significance of coastal wetlands but also of their ecohydrological function. The final verse of the mele (chant) “He Mele no Kāne” (The Waters of Kāne) (Figure 1) details various locations and the hydrologic connectivity of the waters of Kāne—the Hawaiian god of life and freshwater (Emerson, 1909). Specifically, the third line of the last verse states that the waters of Kāne can be found deep in the earth and in the gushing springs. This line is a clear reference to coastal aquifers and groundwater discharge at springs. The fourth line alludes to these locales as being coastal wetlands by stating that the waters are in the ducts of Kāne and Kanaloa–the Hawaiian god of salt water. While the translation by Emerson (1909) translates the term “kau” as a duct, “kau” also means to suspend. This line, therefore, references the suspension of Kāne (freshwater) above Kanaloa (saltwater) emphasizing not only the relationship between the two gods but also recognizing that the freshwater lens floats above the denser saltwater lens in coastal aquifers. The fifth to seventh lines of the verse state that these special locales are recognized and reserved for human consumption of their resources, for religious and spiritual functions, and most importantly, for procuring life. The final line of the mele emphasizes the Hawaiian word “ola,” which means livelihood, health, and “to thrive” (Pukui and Elbert, 1986). In short, this mele describes the fundamental importance of coastal wetlands to Native Hawaiians and demonstrates how the understanding of their function is inextricably intertwined with their socio-cultural value, a prime example of the Hawaiian socio-ecological system in which humans are perceived as part of and not separate from nature (Berkes and Folke, 1998; Winter et al., 2018; Gon III et al., 2021).
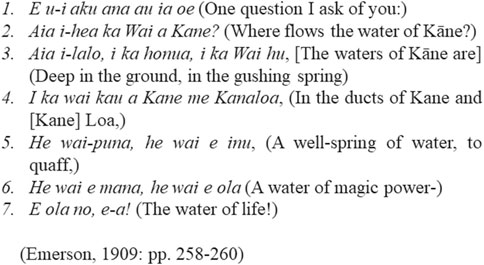
FIGURE 1. Sixth and final verse of “He Mele no Kāne,” a traditional Hawaiian mele (chant).
Because of their current degraded state, much work is needed for Hawaiian coastal wetlands to once again be thriving places for native flora and fauna. Fortunately, a renewed interest in traditional lowland agriculture by the Native Hawaiian community, as well as a need for improved habitat for endangered species, has recently catalyzed a strong interest in wetland restoration. Although opportunities for landscape-scale restoration are limited on the main, highly developed Hawaiian islands, the island of Molokaʻi stands apart. This island, with a population of more than half Native Hawaiians (Maui County, 2020), has resisted large-scale development. There are numerous coastal lowland areas that could potentially be restored, including former loʻi kalo, shrimp ponds, an extensive network of loko iʻa, and lowland floodplains and wetlands. Of particular interest are a series of relatively isolated coastal wetlands along the south shore, which are strategically proximal to one another (Henry, 2016). Yet, in Hawaiʻi, just like elsewhere, coastal wetlands are increasingly threatened by sea-level rise (van Rees and Reed, 2013; Kane et al., 2014; Harmon et al., 2021), so any restoration efforts need to incorporate future sea-level rise projections in order to have the best chance for long-term success.
Given the need for coastal wetland restoration in Hawaiʻi and the rare opportunity on Molokaʻi, we conducted a study to prioritize the restoration of 12 coastal wetlands on the island. In particular, we used a GIS site suitability analysis that incorporated 1) rapid field assessments of hydrology, vegetation, soils, and birds, 2) a comprehensive analysis of endangered bird habitat value, 3) spatial characteristics of the sites, 4) sea-level rise projections for 2050 and 2100 and wetland migration potential, and 5) preferences of the Native Hawaiian community. Our main objectives were to develop a protocol to prioritize coastal wetlands for restoration without the need for reference sites and to use the new protocol to rank each of the 12 sites, thereby creating an actionable blueprint for restoration. Although designed for Molokaʻi, our approach could be adapted for use in any place with few or no reference sites and/or strong indigenous community needs. The restoration endpoints we envision for Molokaʻi wetlands are driven more by re-establishing functionality and cultural resources rather than by trying to restore their original state, which may not be attainable at this point.
Molokaʻi, the fifth largest island in the Hawaiian chain, is situated between 21°00'–21°15' N and 157°20'–156°40' W with an area of 673 km2 (Figure 2) (Stearns and Macdonald, 1947). The population in 2020 was 6,253 (County of Maui, 2020). The island is largely composed of the 423 m-high, West Molokaʻi volcano and the younger, 1,512 m-high, East Molokaʻi volcano (Stearns and Macdonald, 1947). Molokaʻi has a mean annual temperature of 23.91°C (1978—2007; Giambelluca et al., 2014). The rainy season typically extends from October through April and the dry summer season extends from May through September (Sanderson, 1994). The mean rainfall is usually much higher in the northeastern or windward part of Molokaʻi, exceeding 406.4 cm, while the West Molokaʻi volcano receives less than 63.5 cm (1978–2007; Giambelluca et al., 2013). Most recently (from spring 2019–2022), Molokaʻi has experienced a drought throughout the western part of the island and the southcentral coast (NOAA National Integrated Drought Information System NIDIS, 2022a). Along the southcentral coast, drought severity has been extreme (D3) near the main Molokaʻi town of Kaunakakai and moderate (D1) along the eastern trajectory to the Kawela Gulch area (NOAA NIDIS, 2022a). The tides in Molokaʻi are mixed semidiurnal. The great diurnal tidal range (mean lower low water to mean higher high water) on Molokaʻi is 0.651 m (Kaunakakai Habor, NOAA, 2022b), placing coastal wetlands in the microtidal range. Twelve coastal wetland sites (site abbreviations used hereafter) were chosen for the study based on background data, accessibility, and the ability to gain lawful entry from landowners (Figure 2, Supplementary Figure S1; Table 1).
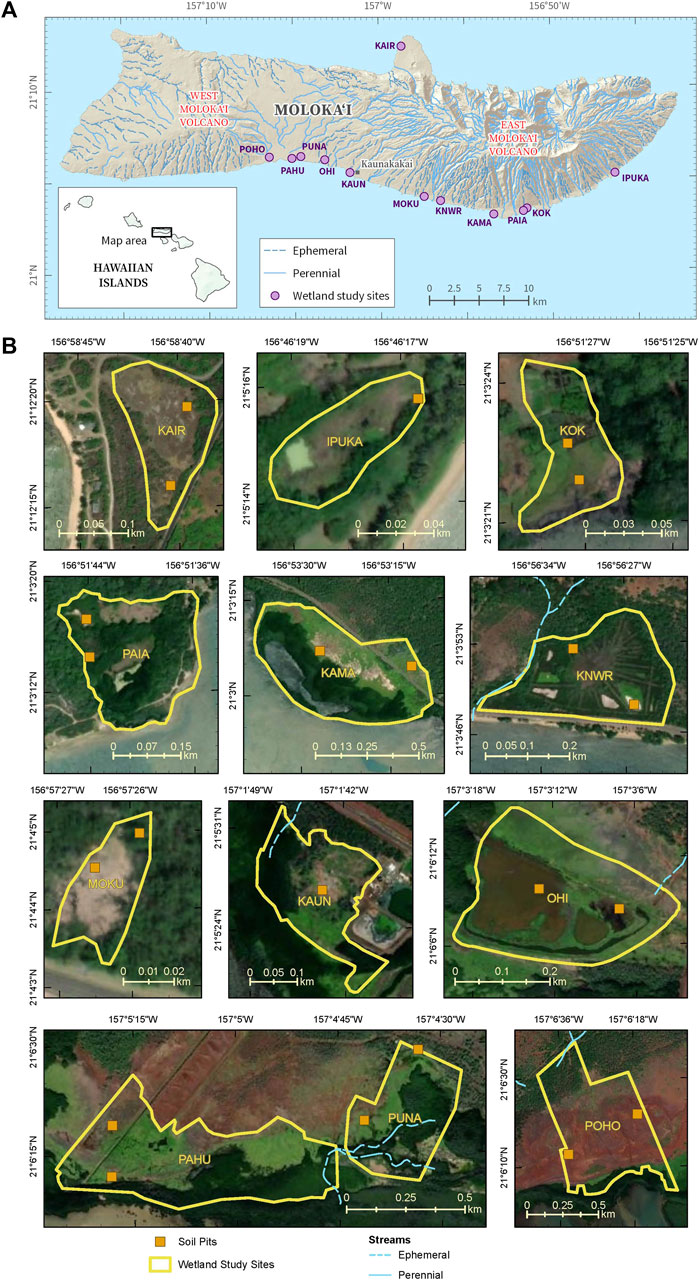
FIGURE 2. (A) Map of the island of Moloka’i, Hawaiʻi, showing the location of the 12 coastal wetland study sites and (B) imagery showing the site boundaries, soil pits, and streams at each of the study sites. Base imagery modified from the following sources: Esri, Maxar, Earthstar Geographics, and the GIS User Community.
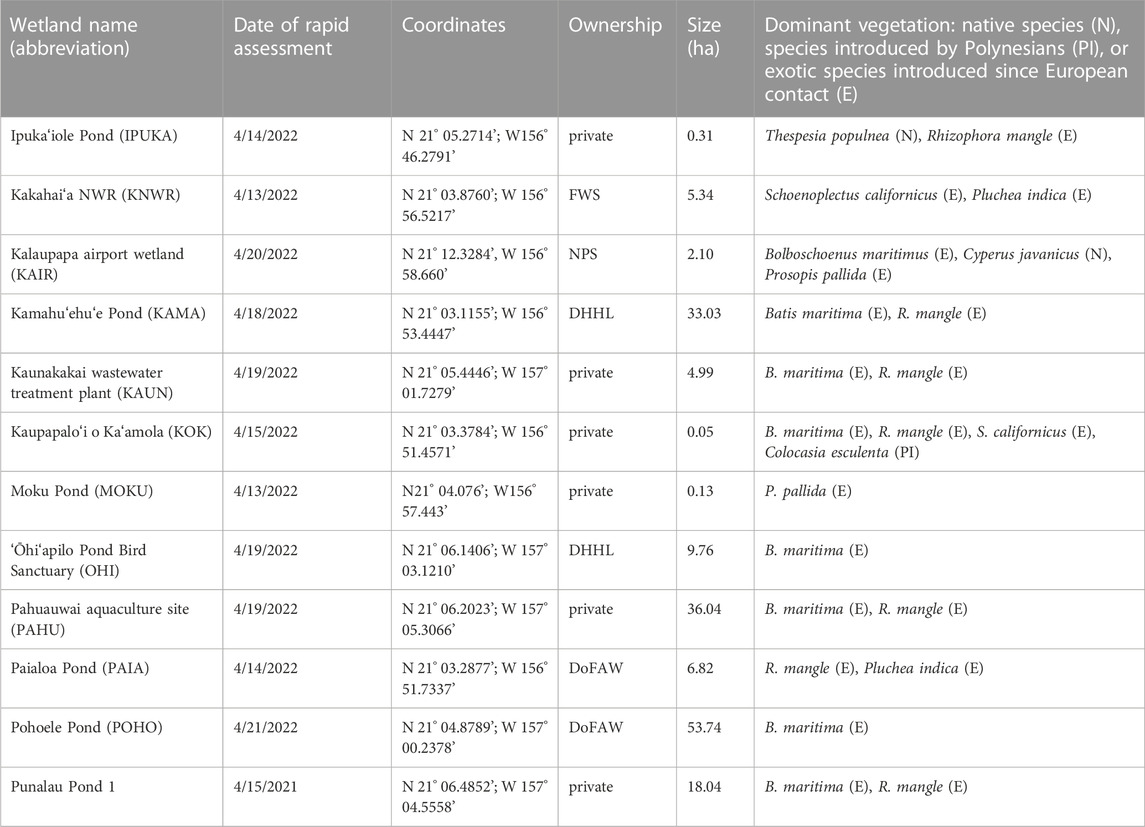
TABLE 1. Basic characteristics of the 12 wetland study sites on Molokaʻi assessed in April 2022. Abbreviations for land ownership are the Hawaiʻi Department of Land and Natural Resource, Division of Forestry and Wildlife (DoFAW), Department of Hawaiian Home Lands (DHHL), U.S. Fish and Wildlife Service (FWS), and National Park Service (NPS).
We created a GIS database of the environmental attributes of Molokaʻi, including soil types, hydrology, vegetation, land ownership, and rainfall/moisture zones, to select sites for the study and inform our prioritization process (Supplementary Table S1). The boundaries of each wetland were determined using Pictometry high-resolution aerial imagery (EagleView International, 2021) and Hawaiʻi State tax map parcels (Hawaiʻi Statewide GIS Program, 2021). The delineations for each site are approximate and were only created for the purposes of this study.
Rapid field assessments were conducted in April 2022 of the vegetation, soils, hydrology, and birds at each of the 12 sites. The purpose of the field assessments was to determine the current condition of sites for which little to no data were available.
For the hydrologic component of the rapid assessment, water sources (surface water, precipitation, groundwater, and/or seawater) were determined by examining high-resolution digital imagery (EagleView Technologies, Inc., 2008), site geomorphology, and walking the site periphery to identify springs, seeps, and intermittent streams. In addition, the depth from the wetland surface to the water table was determined in soil pits (see below) and the specific conductance of the groundwater was measured using a Fisherbrand™ Traceable™ expanded range conductivity meter (Fisher Scientific, Waltham, MA) calibrated to the salinity range of each site.
The soil component was focused on determining whether soil textures at the wetland sites followed their mapped classifications (mainly Kealia silt loam; Soil Survey Staff, 2021) and whether there was any within-site variability. Soil pits were dug to the depth of the water table or a maximum of 80 cm in two distinct areas of each site such as mauka (toward the mountains) and makai (toward the sea) in contrasting vegetation types or at different sides of a road or railroad grade that bisected the site. Soil samples at each pit were collected from 0–2 cm, 24–26 cm, and 48–50 cm depth from the surface, refrigerated, and transported within 5 days to the USGS Coastal and Marine Science Center in Santa Cruz, CA, for soil texture analysis and the USGS California Water Science Center in Sacramento, CA, for the analysis of % organic carbon by weight.
The structure and species composition of the plant communities found within each wetland site were characterized using a rapid field assessment procedure. Vegetation data were collected in survey plots, approximately 5 × 5 m in size, that were located in different plant communities found at each site. In each plot, vegetation cover and bare ground were visually estimated to the nearest 5%, and plant species were recorded in lifeform groups (trees, shrubs, ferns, vines, rushes, sedges, grasses, herbs, and submerged aquatic vegetation). Additional species found outside the plots, within or immediately adjacent to the wetland, were recorded with photographs and added to the site species list. Plant communities were identified both in the field and using the high-resolution digital imagery (EagleView Technologies, Inc., 2008). Taxonomic nomenclature follows the work of Wagner et al. (2005).
The rapid assessment for birds was carried out with a point count. Point counts were carried out for 10 min even if no birds were present. Birds were recorded following the State Waterbird Count methodology (Hawaiʻi Department of Land and Natural Resources, 2017). The short fieldwork period and extreme drought conditions present on the island at the time resulted in few native birds being present during the rapid assessment. Therefore, to ensure that avian diversity was adequately represented, the rapid assessment was supplemented with an avian dataset for Molokaʻi from Arleone Dibben-Young of the non-profit Hawaiian Islands Conservation Collective for the period from 2010 to 2020 (Supplementary Table S2). These data were collected twice per year during the annual State Waterbird Surveys or during bird monitoring trips and ad hoc sightings. Only native and migratory birds were included.
Soil texture was determined using standard USGS methodologies described in Drexler et al. (2021). The percentage of organic carbon by weight (% OC) was determined for the top two samples in the soil pits (0–2 cm and 24–26 cm) using a Costech ECS 4010 CHNS/O elemental analyzer (Costech Analytical Technologies, Inc., Valencia, CA, U.S.A.) according to a modified version of U.S. Environmental Protection Agency Method 440.0 (Zimmerman et al., 2007). Blanks, replicates, and standards were analyzed every 10 samples to assess instrument stability. Replicate samples were reanalyzed if the relative percentage difference between the two replicates was greater than 20%. The detection limit was 0.01%.
In this study, we used the SLR projections by Sweet et al. (2022), which incorporate the latest science from the Intergovernmental Panel on the Climate Change Sixth Assessment Report for updated temporal trajectories and exceedance probabilities based on different levels of global warming (Fox-Kemper et al., 2021; Garner et al., 2021). Multiple methods of projecting future ice-sheet changes from Antarctica (Levermann et al., 2020; Edwards et al., 2021) and Greenland (Bamber et al., 2019; Edwards et al., 2021) are integrated into the projections. Specifically, we used the relative sea-level rise projections for Molokaʻi, which are a part of the 1 x 1-degree grids for the Hawaiian Islands along the coastline relative to the baseline year of 2000. For some parts of Hawaiʻi, downscaled projections are available near NOAA-tide-gauges, but no such gauges are located on Molokaʻi, so the gridded projections were used.
Sweet et al. (2022) provide two kinds of projections: 1) observation-based projections to 2050 and 2) decadal scenario-based (modeled) projections to 2150. The scenario-based projections are combined to generate five sea-level scenarios ranging from low, intermediate-low, intermediate, intermediate-high, and high. On Molokaʻi, the observation-based projections to 2050 and the intermediate-low projections for 2050 are almost the same. This would ordinarily point toward using these projections for 2050. However, because the uncertainty of these projections was high at our wetland sites (<0.80 probability across the board), we opted instead to use the intermediate scenarios of SLR for both the 2050 and 2100 timeframes (Table 2).
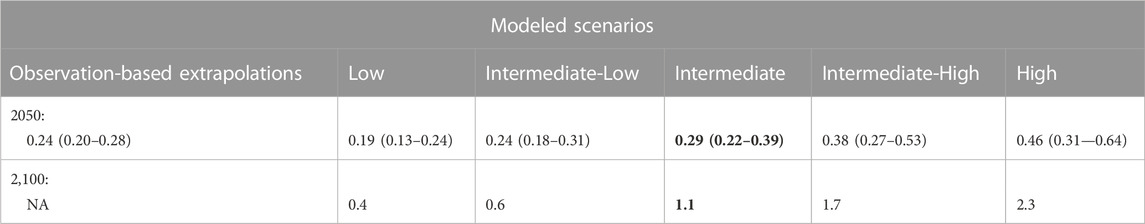
TABLE 2. Median values in meters (likely ranges) for observation-based extrapolations and modeled sea-level rise (SLR) scenarios for the Hawaiian Islands for 2050 and modeled SLR scenarios (no range provided) for 2100 from the work of Sweet et al. (2022). The tidal benchmark is mean higher water and the baseline date is 2000 for all extrapolations and scenarios. The intermediate scenario (bold) was chosen for the study due to the high uncertainty of projections (<0.8 probability) along the Molokaʻi coastline.
It is important to note that the SLR projections used here are for passive flooding from SLR only and do not include wave-induced flooding, yearly variability of sea-level from natural processes such as the El Niño–Southern Oscillation, or any additional impacts due to coastal erosion (Anderson et al., 2018; Sweet et al., 2022), which can exacerbate SLR and increase erosive impacts along the coastline (Drexler and Ewel, 2001; Anderson et al., 2018; Goodman et al., 2018).
The site suitability analysis consisted of 1) ranking the coastal wetlands based on specific sub-models or categories consisting of hydrology, resilience to sea-level rise, soils, vegetation, bird habitat value, and community support and 2) carrying out the actual suitability analysis in ArcGISPro based on the sub-models in step 1). Rankings (1 (lowest)–5 (highest)) were based on the best available data from the rapid assessment, the literature, and database sources. Site data were very limited, so we relied on both professional judgement as well as the available data to develop criteria that best encapsulated the functions and values of the sites. Following are descriptions of the ranking criteria for each of the sub-models and the suitability analysis procedure that was used.
Hydrologic parameters were ranked in three ways and then averaged for an overall score. Depth to groundwater from the land surface was used to assess the availability of water in the rooting zone of common wetland macrophytes (approximately 0–30 cm in depth; Moffett and Gorelick, 2016). The ranking was as follows: <30 cm from land surface to groundwater = 5; 31–50 cm = 3; >50 cm = 1. The second measure was the range of estimated groundwater (gw) discharge at the coastline (Oki et al., 2019) and/or the number of springs mauka of the site (Stearns and Macdonald, 1947). The gw discharge/spring ranking was as follows: >500,000 gallons gw discharge/day and the presence of springs/seeps mauka of site = 5; 100,000–500,000 gallons of gw discharge/day and springs on site = 3 or high gw discharge at the coast but no springs on site = 3; low gw discharge (<500,000 gallons/day) and no springs on site = 1. The third hydrologic category was salinity stress, which was ranked as follows: <35 part per thousand (ppt) in gw = 5, 35–50 ppt in gw = 3, and >50 ppt in gw or extensive salt pan = 1. If groundwater was not accessible at the site, then the condition of the vegetation during the rapid field assessment was used as an indication of the hydrologic status because good condition during drought is indicative of good hydrological status.
The resilience of each wetland to future SLR was ranked in the following way. First, we determined the surface elevation of each site using the Molokaʻi digital elevation model provided by Sweet et al. (2022). For 2050, the median elevation of each wetland was then estimated by subtracting 0.29 m (the projected SLR, Table 2) and adding a conservative estimate for vertical accretion over the ensuing years (3 mm/yr * 28 years). The median elevation of each wetland in 2100 was estimated by subtracting 1.1 m (the projected SLR, Table 2) and adding vertical accretion at the same rate but over 78 years. Data were not available for the elevation range of dominant wetland vegetation, which is required to determine the elevation of marsh drowning (Morris et al., 2022). For this reason, we used the elevation capital of each wetland (sensu Cahoon et al., 2020) to rank its relative resilience to inundation. Rankings for both 2050 and 2100 were <0 m elevation relative to the mean sea level (MSL) = 1; 0–0.3 m = 2, 0.31–0.6 m = 3, 0.61–0.9 m = 4, and >0.9 m = 5. Wetland migration potential was then determined by the availability of flat land (which was available for all wetlands, so no ranking was needed) and the distance to the nearest mauka road. The rankings for the distance to the nearest mauka road were <100 m = 1; 100–250 m = 2, 251–400 m = 3, 401–550 m = 4, and >551 m = 5. Because the coastal lowland zone of Molokaʻi is very flat and migration space is limited, we weighted resilience to inundation to be twice as important as migration space in the overall ranking of resilience to SLR. Finally, because the overall resilience to SLR is of critical importance to wetland sustainability, we weighted this sub-model to be three times more important than all the other sub-models except community support, which also received the same weighting.
The soil ranking was based on two parameters, soil texture and % of organic carbon (OC) content. Soil texture is a key measure of water holding capacity and water availability, which are both essential for successful plant colonization (Sprecher, 2001). The percentage of OC (or organic matter content, which is ∼2*OC) is typically at least 5% in wetland soils and is essential for biogeochemical cycling of nutrients and adequate friability for plant growth (Mitsch and Gosselink, 2007, Ch. 13; Munkholm, 2011). For soil texture, the ranking criteria were as follows: silty clay loam and silt loam = 5; silty clay and loam = 3; and sandy loam and loamy sand = 1. For % OC, the ranking was simply >2.5% OC (∼5% OM) = 5 and <2.5% OC = 1. Both of these ranking criteria were averaged to obtain the final soil rankings for each of the sites.
Vegetation at each of the sites was ranked based on two main criteria: 1) the proportion of native vs. non-native wetland plant species and 2) the species richness of native wetland species. In Hawaiʻi, the high prevalence of invasive species has largely transformed lowland areas (Staples and Cowie, 2001; Erickson and Puttock, 2006), so the presence of native wetland species is a strong indicator of vegetation status and is key to the successful restoration of wetland function. The ranking for native vs. non-native species was as follows: the site contains intact native-dominated wetland plant communities = 5, a small area of the site contains native-dominated wetland plant communities = 4, the site is mostly dominated by non-native alien wetland plant species but with some natives = 3, the site is dominated by non-native wetland plants but no invasive mangroves (Rhizophora mangle L.) = 2, and the site has no native wetland plants and high cover of mangrove, pickleweed (Batis maritima L.), and other non-native wetland species = 1. For species richness, ranking was as follows: ≥ five native wetland species = 5, four native wetlands species = 4, three native wetland species = 3, one or two native wetland species = 2, and no native wetland species = 1. The two criteria were averaged to obtain the overall vegetation ranking for each of the sites.
The current and potential (restored) habitat value of each wetland for threatened and endangered (T&E) wetland birds and migratory birds was ranked using data from the scientific literature, wetland management plans, the rapid assessments, the National Wetland Inventory (NWI), the 10-year database (2010–2020) of bird observations on Molokaʻi by the Hawaiian Islands Conservation Collective (Supplementary Table S2), GIS databases, and expert opinions from managers and landowners on Molokaʻi (Pacific Coast Joint Venture, 2006; US Fish and Wildlife Service (USFWS), 2011a, 2011b; Chutz, 2014; Malachowski and Dugger, 2018; Malachowski et al., 2018; Sustainable Resource Group International, 2018; Henry and Fredrickson, 2019; Henry and Fredrickson, 2022; USFWS, 2022). Sites were scored using the 12 criteria in Table 3. A multiplier of two was applied to the ‘suitability for T&E and migratory birds after restoration’ expert scores, as this criterion was evaluated at all sites and provides a more important indication of potential future habitat value than past bird observations, which were not available at all the sites. To ensure that sites with severe hazards for avian species were distinctly noted, a multiplier of three was applied to this category. The rankings used for each criterion and the details on how ranks were determined are provided in Table 3.
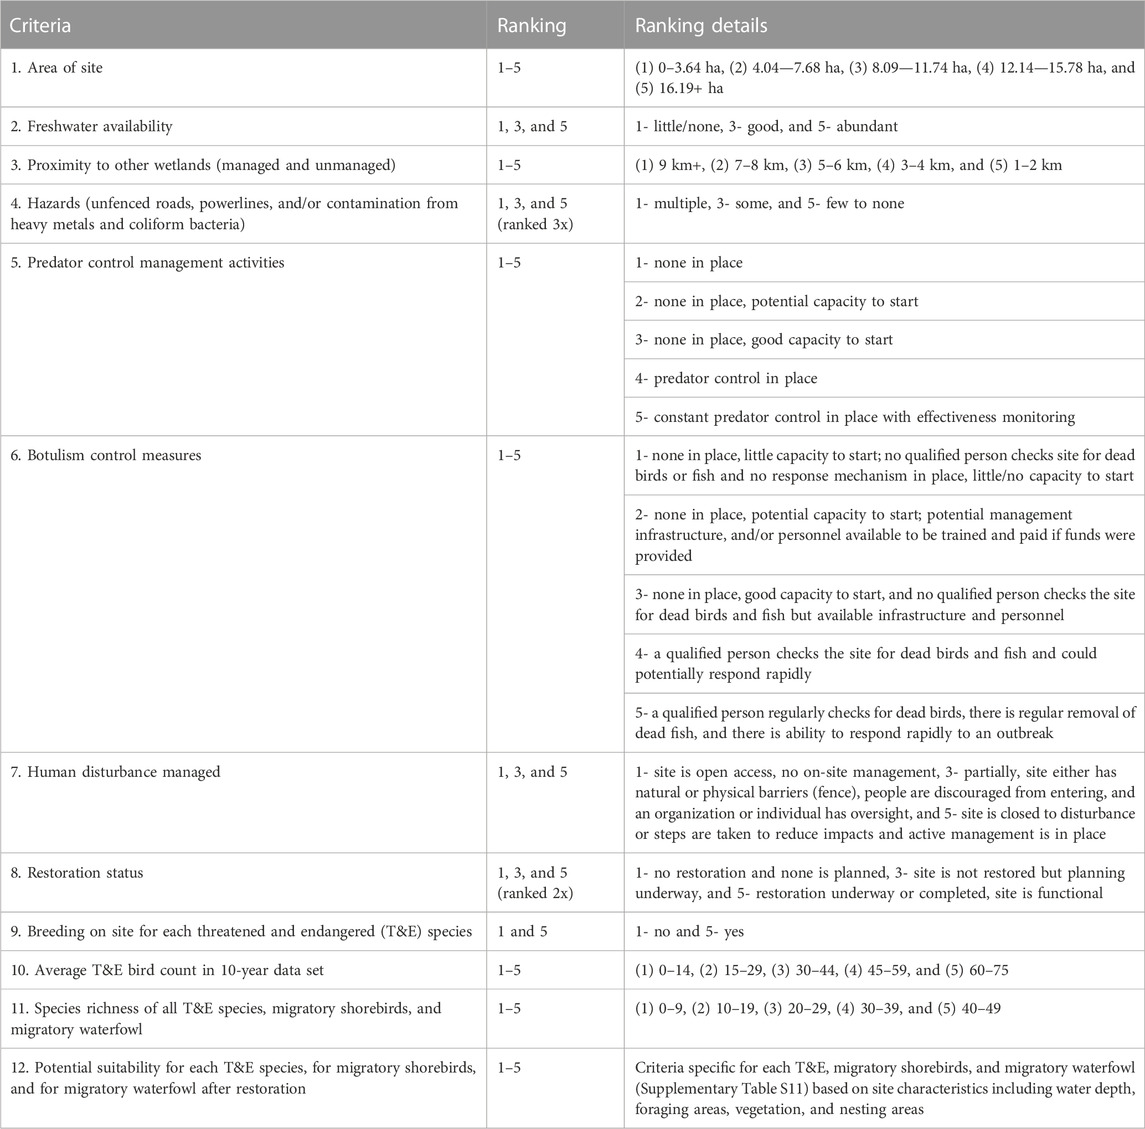
TABLE 3. Criteria used to rank habitat quality for threatened and endangered waterbirds (T&E), migratory shorebirds, and migratory waterfowl at each wetland site.
The sixth sub-model was community support. This component is of key importance as without broad-scale support from the largely Native Hawaiian community on Molokaʻi, wetland restoration is unlikely to come to fruition or be successful in the long term. Community support was carried out in several steps. First, the project community liaison, Pūlama Lima of Ka Ipu Makani, held one-on-one meetings with key Molokaʻi community members. This was followed by a larger community meeting during the rapid assessment work in which the project was explained and there was an open discussion about the 12 sites chosen for prioritization. Next, a score sheet for community support regarding the sites was sent out by the community liaison to each member of the Molokaʻi Wetland Partnership (MWP), a coalition of local NGOs and state and federal agencies with extensive knowledge of the natural resources and socio-cultural landscape of Molokaʻi. A follow-up meeting was then held to discuss any scores, which were in dispute or not well understood. In this way, each site was ranked as follows: likely community opposition (1), possible community opposition (2), community neutral (3), community supportive (4), and community highly supportive (5). Due to the overarching importance of this sub-model, it received a weight three times that of all the other sub-models except for sea-level rise, which also received the same weight.
All six sub-models were used to carry out the site suitability analysis in ArcGISPro version 3.0.2. Site suitability analyses have been used in a broad range of applications including wind farm placement, refugee camp establishment, and wetland restoration (White and Fennessy, 2005; Darwiche-Criado et al., 2017; Nasery et al., 2021; Younes et al., 2022) to identify locations with desired characteristics by using weighted criteria defined by the analyst to rank and score potential sites based on how closely they match an ideal set of criteria. In order to prepare the data for the analysis, several steps first needed to be followed. Study area boundaries were manually delineated using high-resolution digital imagery (EagleView Technologies, Inc., 2008) and converted to polygons in the GIS using the NAD 1983 UTM Zone 4N projected coordinate system. Feature classes were created in the GIS for each of the datasets collected in the rapid field assessment. For datasets that contained null values, a proxy was assigned to prevent ArcGIS Pro from excluding the site from the analysis. Each dataset was then spatially joined to the wetland site polygons. Each data attribute was then converted to a raster (cell size of 3 m) with the Polygon to Raster tool. Due to the soil data being collected at two pits within each study area boundary, single rankings for each site had to be calculated for use in the final model scenarios to match the study area boundaries of the other sub-models. After the soil sub-model was run at the pit level, the ranks for each site were determined by averaging the soil pit ranks. The new ranks were then assigned to their respective study area boundary polygons and then converted to a raster (cell size of 3 m) with the Polygon to Raster tool. All the raster data were then uploaded to the ArcGIS Pro (version 3.0.2) Site Suitability Modeler tool.
Because some criteria had higher importance than others, the multiplier weighting method was used (White and Fennessy, 2005) in the site suitability analysis to weight the criteria relative to one another within each sub-model and in the overall suitability model. Any weighting within the individual sub-models was already described above. Weighting among the sub-models for the overall site suitability analysis was carried out in three ways: 1) equal weighting for each sub-model, 2) SLR and community support weighted 2x as high as all the other sub-models, and 3) SLR and community support weighted 3x as high as all the other sub-models. All other parts of the suitability analysis remained the same for the three different runs.
During rapid assessments, we determined that all the wetland sites receive at least some groundwater inflow. Because many of the springs are located outside of the wetland boundaries of our sites, we relied on the spring survey by Stearns and MacDonald (1947), which is the most recent to date, to identify springs mauka from our sites. Additional springs/seeps were noted by us at the upland edge of MOKU (Table 1 for site names and their abbreviations). For mauka of KOK, there must be springs or seeps as the groundwater discharge was the strongest of all the sites. However, none were found by Stearns and MacDonald (1947), suggesting either an oversight or a new flow path. Streamflow is intermittent at all sites except PUNA, MOKU, KOK, IPUKA, and KAIR, which have no streams (US Geological Survey, 2019). The measurements of depth to groundwater and salinity illustrate the impact of the ongoing drought on the lowland coastal zone of Molokaʻi (Figure 3). Although the water table is usually near the surface in coastal wetlands, the mean depth to groundwater at the sites was 36.36 cm ± 25.00 (sd). At three soil pits, PAIA1, POHO1, and POHO2, the bottom was dry at 80 cm (Supplementary Table S3). The mean groundwater salinity at all the sites was 30.35 psu ±34.25 (sd) and at soil pits KAMA1, KAUN, OHI2, and PAHUA2 salinities were in the hypersaline range (>40 psu) (Figure 3B). In contrast, the low salinities and shallow depths to groundwater at KOK1, KOK2, KNWR1, OHI1, and IPUKA demonstrate a high discharge of fresh groundwater at several places along the southern coastline (Supplementary Table S3, Figure 3C). The wetland sites that ranked the highest overall (5) for hydrology were IPUKA, KNWR, KOK, KAIR, and MOKU (Figure 3C, Supplementary Table S3).
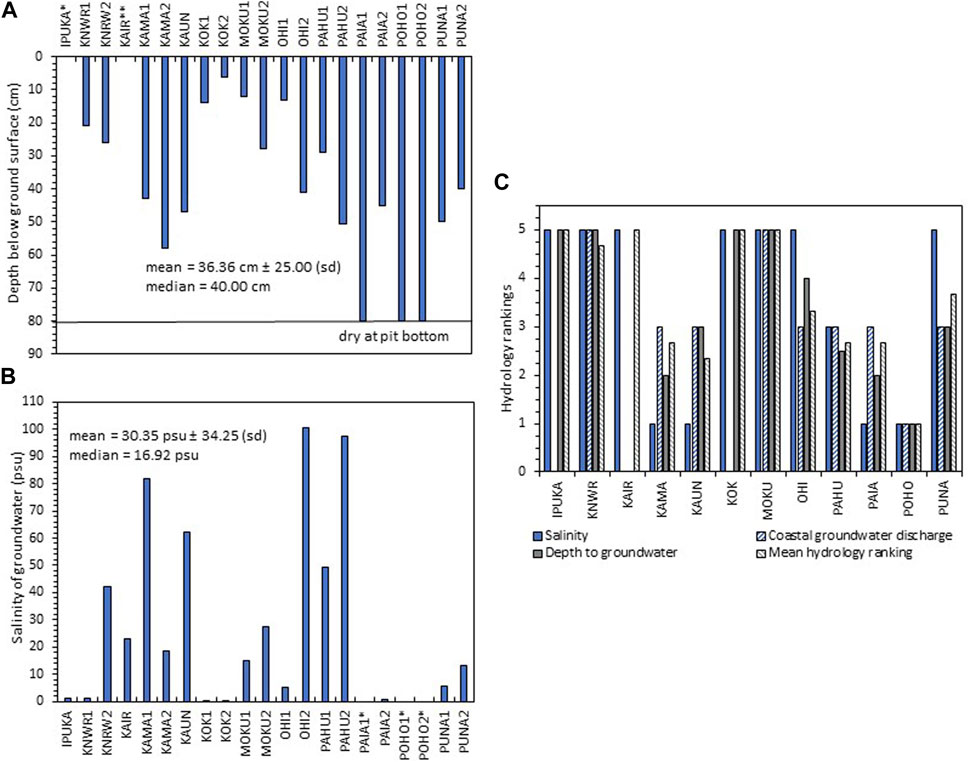
FIGURE 3. (A) Depth to groundwater (the water table) at soil pits at each wetland site during April 2022. Site abbreviations are shown in Table 1. *The water table was at the ground surface at IPUKA. **At KAIR, there was no water table because the site was on lithified sand. For PAIA1, POHO1, and POHO2, the depth to groundwater was below the depth of the pit (80 cm); (B) salinity of groundwater in soil pits in April 2022. Sites without salinity measurements had no water in soil pits; and (C) rankings for salinity, coastal groundwater discharge rate, depth to groundwater, and overall mean hydrology for each of the 12 wetland sites. For sites without available data for one of the three categories, the remaining two categories were averaged instead of all three.
In the analysis of wetland resilience to future sea-level rise, there were major differences in the migration space and elevation capital among the sites. The mean distance to the nearest upland road (167 m ± 173 (sd)) ranged from 9 m at KOK to almost 600 m at PAHU (Figure 4A). The resilience of the wetland sites to sea-level rise was strong in 2050, as almost all the sites maintained their elevation above MSL except for KAIR (Figure 4B). In 2100, resilience waned with 10 out of 12 sites having projected surface elevations below MSL, which is likely near the lower end of the vegetation elevation range (Figure 4B). Overall, the highest overall sea-level rise rankings (3 or higher) were found for KNWR, KOK, and PAHU (Supplementary Table S4; Figure 4C).
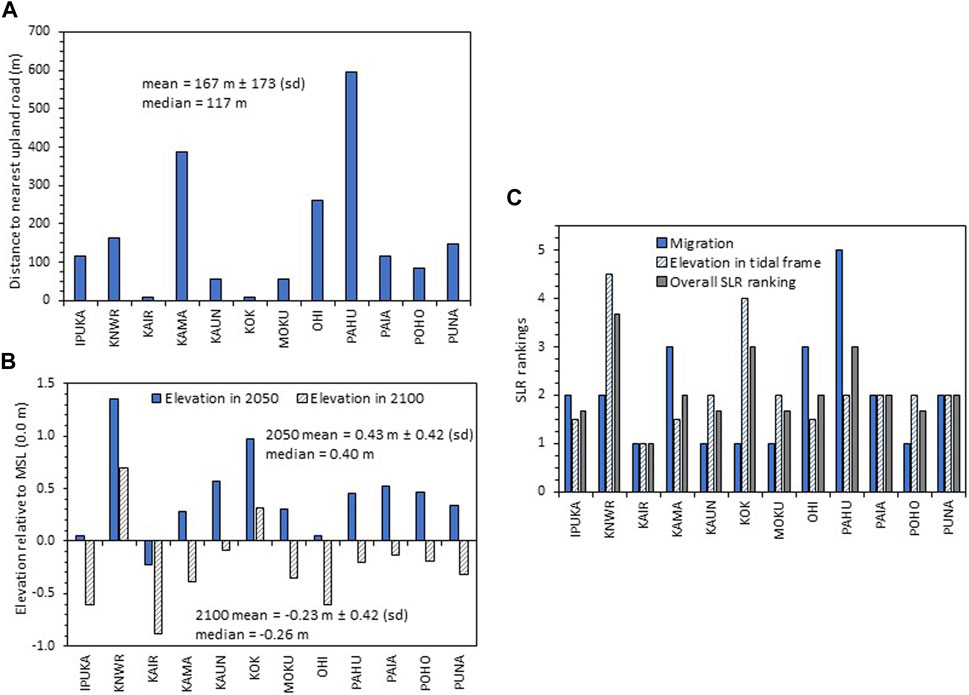
FIGURE 4. (A) Distance to the nearest upland road from the upland border of each of the 12 wetland sites, (B) estimated surface elevation relative to mean sea level (MSL) (0.0 m) for each wetland assuming 3 mm/yr of vertical accretion and incorporating sea-level rise (SLR) projections for 2050 and 2100 from Table 3, and (C) overall mean SLR rankings based on migration potential (weighted 1x) and mean elevation relative to MSL for 2050 and 2100 (weighted 2x).
Basic soil characteristics varied broadly across the sites. Soil texture ranged from loamy sands to silt and silty clays (Supplementary Table S5). The mean % OC across the wetland sites was 10.93% ± 12.24 (sd) (Figure 5A). IPUKA, which had no soil per se, had a floating mat of vegetation estimated to contain ∼44% OC (Byrd et al., 2018). Most sites contained mineral soil except KOK and PUNA, which have organic soils due to their high % OC content (Figure 5A) (USDA-NRCS, 2014). All of the sites except for KOK and IPUKA are situated under reddish brown steep slopes described by gSSURGO as “very stony land-eroded” (Soil Survey Staff, 2021). Reddish brown material was seen in the top layers of many soil pits and the coastal waters, demonstrating chronic erosion and transport of materials from the uplands to the sea. Six sites had overall soil rankings above 4 (Figure 5B).
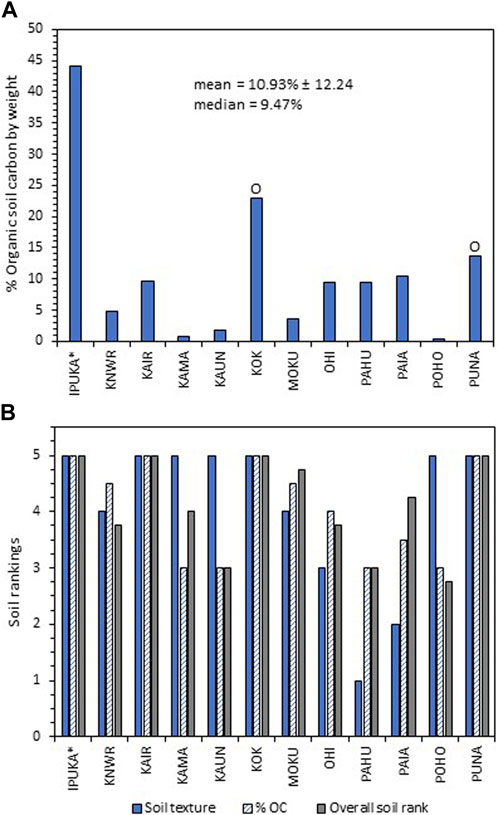
FIGURE 5. (A) Mean % OC in soil samples from 0–2 and 24–26 cm in depth from each site. The “O”s signify organic soils with the rest of the sites having mineral soils (USDA Natural Resources Conservation Service, 2014). *Although IPUKA had very high % OC, it contains a floating mat, which is not classified as soil. (B) Rankings for soil texture, %OC, and the mean soil rank for each of the sites.
The vegetation survey demonstrated that the coastal flora on Molokaʻi contains a high proportion of non-native species dominated by mangroves, pickleweed, and Indian fleabane (Supplementary Tables S6–S10). There were 39 plant species found overall at the wetland sites. Of this total, 22% or 13 were not wetland species. Of the 26 wetland plant species, 11 were native, one was introduced by Polynesians, and 14 were non-native (Supplementary Table S7). The most diverse plant life form was trees. However, seven of the nine tree species were exotic (non-native) in origin (Supplementary Table S7). Sedges were the next most numerous plant form (seven species), with three native species. Overall, the non-native wetland plant species richness (mean = 3.33 ± 1.92 (sd)) at the wetland sites was slightly greater than the native wetland plant species richness (mean = 2.08 ± 2.02 (sd)) (Figure 6A, Supplementary Table S8), but the difference was not statistically significant (Student’s t-test, p > 0.05). The number of native species and/or the proportion of native to non-native wetland species resulted in KAIR, KOK, and OHI ranking the highest overall for vegetation (all >4; Figure 6B, Supplementary Table S9).
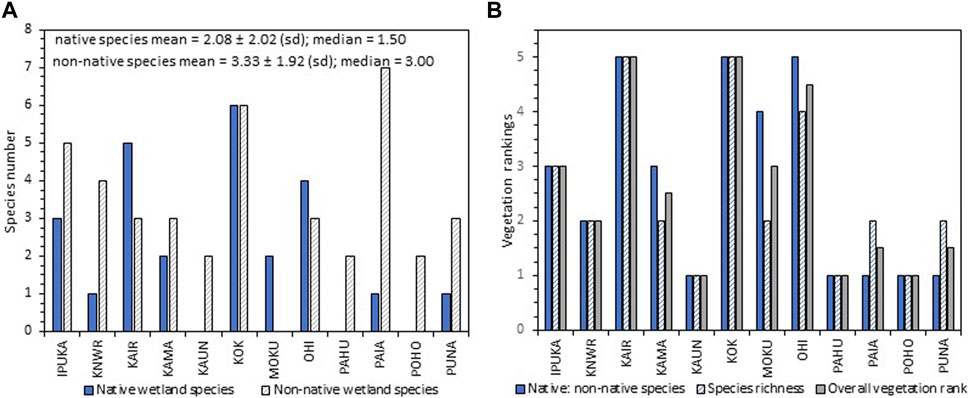
FIGURE 6. (A) Numbers of native and non-native wetland plant species at each site and (B) ranks for the proportion of native: non-native wetland plant species, species richness of native wetland plants, and the overall vegetation rank for each of the sites.
The assessment of bird habitat value, which consisted of 12 separate criteria (Table 3), ranged from a total score of 55 at POHO to 105 at OHI (Table 4, Supplementary Table S11). It is important to note that PAIA was not included in the rankings due to strong community opposition to restoration of the site (see below). The criteria with the highest consistent rankings among the sites were potential suitability for T&E birds (mean = 3.5) and managed human disturbance and hazards (means of both = 3.4). The criteria with the lowest scores across the sites were restoration status (mean = 1.9) and adequate predator control (mean = 2.1) (Table 4, Supplementary Table S11). Four sites (KNWR, KAMA, PAHU, and PUNA) ranked above “4” in “potential suitability after restoration for all threatened and endangered waterbirds, migratory shorebirds, and migratory waterfowl” (Table 4). The top ranking sites based on suitability for birds were OHI (5), PUNA (5), KAMA (4), PAHU (4), and KNWR (4) (Table 4).
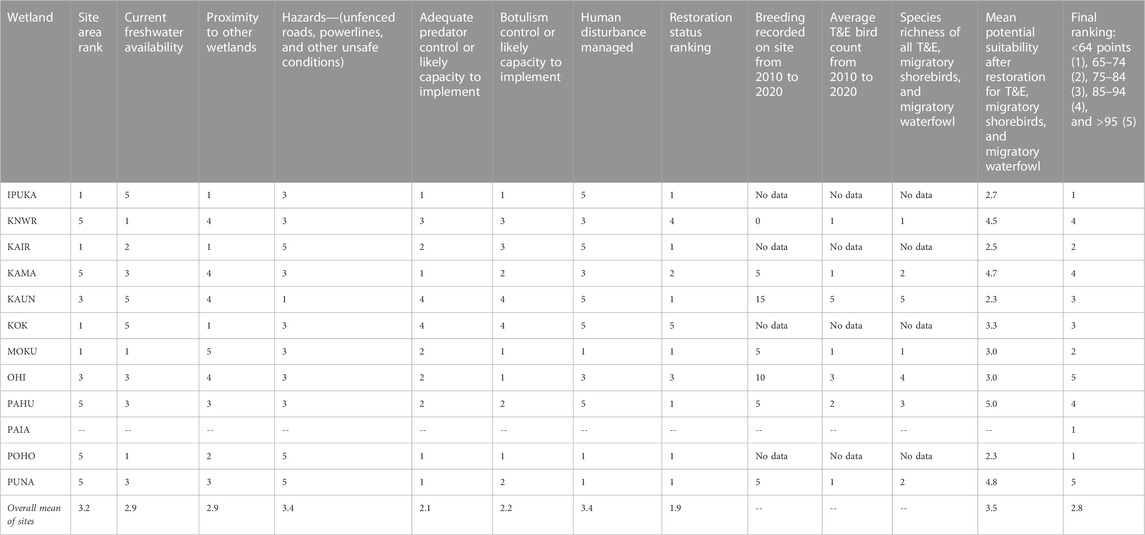
TABLE 4. Ranks for bird habitat value for threatened and endangered waterbirds (T&E).
The local community expressed support for coastal wetland restoration at eight of the 12 wetland sites (Figure 7). The site rankings were particularly high (rank of 5) for KNWR, KAMA, and KOK. This high level of support was indicative of a broad, shared community vision of restoration at these sites. In contrast, for PAIA, there was no shared vision for restoration and, thus, no discussion of support due to past trauma from island development efforts, issues around maintaining access for hunting and fishing, and a lack of trust regarding state and federal agencies (Figure 7; Supplementary Table S12). The main concerns raised about wetland restoration included maintaining access for hunting and fishing, protecting sites with iwi kupuna (ancestral bones), the need to include the community in the planning and restoration process, and a desire to see indigenous agro-ecology (loʻi kalo and loko iʻa) included in wetland restoration planning (Supplementary Table S12).
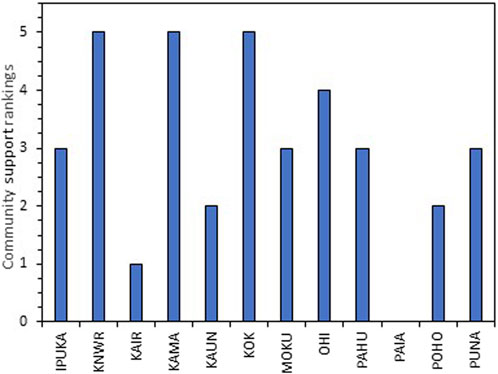
FIGURE 7. Community support rankings for each of the wetland sites.
The overall rankings of the 12 wetland sites for restoration suitability were quite similar across the three different weighting approaches (Table 5). The top three sites were KOK, KNWR, and OHI. KOK scored 5’s in hydrology, soils, vegetation, and community support and 3’s in birds and SLR. KNWR scored 5’s in hydrology and community support, 3.75 in soil, 2 in vegetation, 4 in birds, and 3.67 in SLR. OHI scored a 5 in birds, 3.33 in hydrology, 3.75 in soils, 4.5 in vegetation, 2.0 in SLR, and 4 in community support. The bottom three sites, KAUN, PAIA, and POHO, held steady across the three approaches. All three of these sites scored particularly low in SLR and community support and should not be considered further for restoration. The top six sites across all six sub-models, KOK, KNWR, OHI, PUNA, KAMA, and MOKU, constitute an actionable blueprint for restoration actions on Molokaʻi.
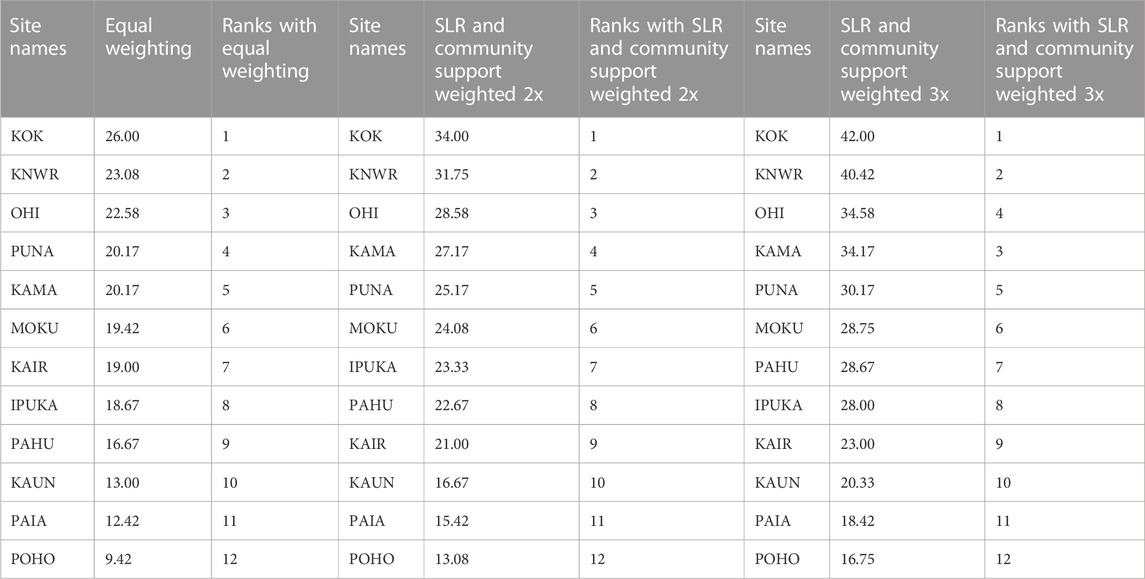
TABLE 5. Overall site scores and ranks from the site suitability analysis using three different weighting approaches.
We conducted a comprehensive analysis to prioritize the restoration of 12 coastal wetlands on the island of Molokaʻi using available spatial data, rapid field assessments of site hydrology, soils, birds, and vegetation, a comprehensive bird habitat assessment, sea-level rise projections for 2050 and 2100, and a GIS site suitability analysis using all assembled data (Table 5). In the rapid field assessment, we found a high level of wetland degradation across the 12 sites, which is not surprising as coastal wetlands across Hawaiʻi, the Pacific region, and elsewhere have long been altered from their original condition or lost completely due to development, conversion to agriculture, and other forms of land use change (Erickson and Puttock, 2006; McGlone, 2009; Murray et al., 2022). Overall, our study reveals a great potential to restore coastal wetlands into ecosystems “thriving with life” as described long ago in the waters of Kāne mele (Figure 2). The following sections describe what we learned about these understudied systems and how our site suitability analysis provides the first step in actualizing a vision for wetland restoration across the island.
We found a range of Hawaiian coastal wetlands in our rapid field assessments with diverse hydrology, salinity, geomorphology, vegetation, and soils (Figures 3–6, Supplementary Table S3, Supplementary Tables S5–S10). Because of this, our results expand upon the previous “tidal flat” classification of coastal wetlands by Erickson and Puttock (2006), which were all described as groundwater driven, saline or brackish, situated in a floodplain, and containing mineral soils (Figure 8). Our study demonstrates that the characteristics of Hawaiian coastal wetlands are much broader: 1) hydrology is typically either groundwater and tidally driven or precipitation and groundwater driven, 2) salinity ranges from fresh to saline, (3) geomorphology includes coastal lowlands (flats) and coastal depressions, and (4) substrate can consist of organic soil, mineral soil, or lithified sand. The most common types of wetlands are mudflats, coastal shrub wetlands, non-native mangrove swamps, and herbaceous marshes (Figure 8).
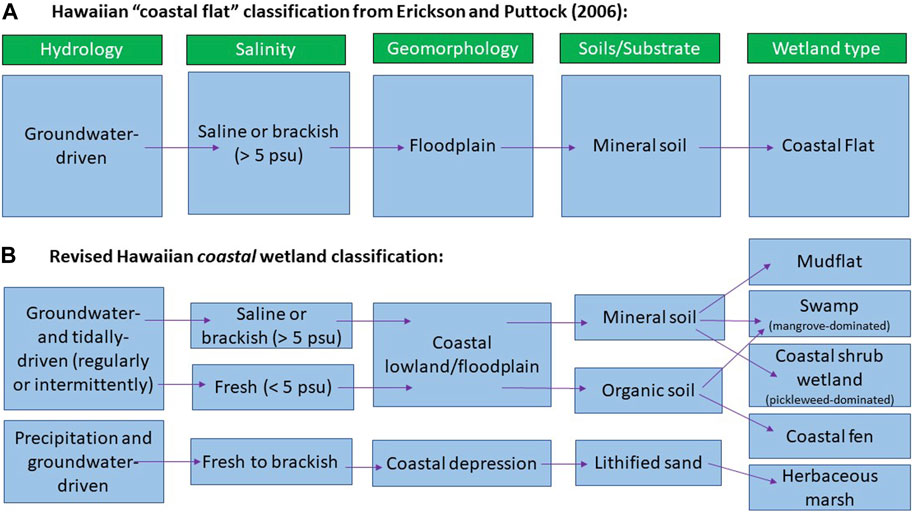
FIGURE 8. (A) Classification of Hawaiian coastal flats by Erickson and Puttock (2006) and (B) revised classification for Hawaiian coastal wetlands based on this study.
In addition to these common wetland types, we found two unusual kinds of wetlands. The first is a groundwater-fed, coastal freshwater herbaceous marsh containing organic “peat” soil (KOK), otherwise known as a coastal fen. Peatlands have long been known to occur on summits and relatively flat montane areas in the Hawaiian Islands, but these wetlands are supported by precipitation, causing them to fall into the category of bogs (MacCaughey, 1916; Vogl and Henrickson, 1971). Although groundwater is known to support coastal wetlands in Hawaiʻi (Hill, 1996), coastal fens, which are common in temperate, boreal, and some tropical climates (Dommain et al., 2014; Toro et al., 2022), have yet to be noted in the Hawaiian Islands. The success of the loʻi kalo (taro patch) at KOK demonstrates that such Hawaiian coastal fens are highly complementary for producing this staple food source. This is no surprise to Native Hawaiians, who have traditionally used such ecosystems to grow taro and refer to them as loʻipūnāwai (spring ponds; Pukui and Elbert, 1986). Coastal groundwater-fed wetlands, both fens and marshes with mineral soils, were likely numerous across the Hawaiian Islands before conversion to other uses, but now only few remain at reserves such as the James Campbell National Wildlife Refuge on Oahu and the Waiheʻe Coastal Dunes and Wetlands Refuge on Maui (Henry and Frederickson, 2013; Hawaiian Islands Land Trust, 2023).
The second unusual wetland type from our assessment is a novel coastal depressional wetland containing herbaceous vegetation, shrubs, and trees, which lies on a very thin veneer (a few cm) of soil over rock hard, lithified sand. The wetland (KAIR) is supported by precipitation and brackish groundwater. It was thought to have been an ancient fish pond and was rebuilt as one in the 1920s but fell out of operation by 1928 (Wyban, 1993; Fung Associates Inc. and SWCA Environmental Consultants, 2010). It is unclear exactly when the sand hardened into an impenetrable surface, but it could have formed during or after the construction of the newer pond. These days, KAIR floods after major rain storms and stays inundated for many months a time (Wyban, 1993; Supplementary Figure S1).
The presence of two highly unusual wetlands among just 12 sites strongly suggests that more study may be needed to describe the full diversity of coastal wetlands in Hawaiʻi.
All of the sites receive at least some groundwater inflow. However, erosion from the uplands has resulted in some springs and seeps being at least partially buried under deposited materials (e.g., MOKU and KNWR) and fine silts being carried across the wetlands to nearshore environments (Stock et al., 2011). At some of the sites, the restoration process will need to include the excavation of springs and regrading of the wetland surface so that the site can sit closer to the water table. The degradation of springs from sedimentation and drought has caused salinity levels to climb to the hypersaline range in four of the sites (KAMA, KAUN, OHI, and PAHU; Figure 3B). This situation will need to be remedied in order to create conditions conducive for native plant recruitment (Zedler, 1982; Alexander and Dunton, 2002). Half the sites had % cover of bare ground greater than 10% (Supplementary Table S7) and in most of these sites, there was precipitated salt on the soil surface (Supplementary Figure S1). Despite these impacts, however, half the sites had soil texture and % OC highly suitable for restoration (a ranking of “4” or above, Figure 5B).
At several sites, the water quality was fresh due to high groundwater discharge along the coastline (Figure 3). Previous work on Molokaʻi has shown that a great volume of groundwater travels along flow paths from the ridge to the reef (Oki et al., 2019). As a case in point, groundwater salinity at the KOK soil pits, practically adjacent to the sea, were both 0.5 psu, which is indicative of a freshwater ecosystem (Cowardin et al., 1979). The ubiquitous presence of groundwater resulted in half the sites scoring a “4” or higher in their overall hydrologic ranking (Figure 3C).
The results of the sea-level rise analysis showed that the elevation capital of the microtidal coastal wetlands on Molokaʻi appears to be modest. Most sites are likely resilient to SLR until 2050, but after that, resilience will likely wane dramatically (Figure 4, Supplementary Table S4). It is important to note that these projections for sustainability under sea-level rise have large uncertainties. Due to a major deficit in wetland data such as the vertical accretion rates of sediments and peat, elevation ranges in the tidal frame suitable for dominant vegetation, and primary productivity of coastal wetlands, no marsh sustainability modeling could be performed. Furthermore, the sea-level rise estimates used were for passive flooding only and, thus, did not include wave-induced flooding, yearly variability of sea-level from natural processes including the El Niño–Southern Oscillation, or any additional impacts due to coastal erosion, which can all increase the extent and depth of flooding (Drexler and Ewel, 2001; Anderson et al., 2018; Goodman et al., 2018).
Despite these limitations, the SLR analysis raises some important points about the state of knowledge concerning coastal wetlands on Molokaʻi. First, there are some key opportunities (e.g., KAMA and PAHU) for marsh migration (Figure 4) on the island. Second, there is a great need to improve the process-level understanding of coastal wetlands of Hawaiʻi. In particular, greater knowledge of the two components of vertical accretion, organic matter accumulation and inorganic sedimentation rates, is needed as the first step toward improving projections of coastal wetland resilience.
Non-native, invasive plant species were ubiquitous at the sites, particularly mangroves and pickleweed (Table 1). Mangrove cover was ≥36% at KAMA, KAUN, PAHU, PAIA, and PUNA. Monotypic cover of pickleweed was ≥26% at KAMA, KAUN, OHI, PAHU, POHO, and PUNA (Supplementary Table S6). Invasive vegetation will need to be controlled and native species will need to be planted in order to regain some of original plant diversity. Only three sites (OHI, KAIR, and KOK) scored “4” or higher in the vegetation rankings, demonstrating that even having a handful of native wetland species is a high bar (Supplementary Table S7). Overall, plant species richness across all the sites was low (39 species), with only 11 native wetland plants (Figure 6; Supplementary Tables S7–S9). This may be due to competition from invasive plants, or similar to native Hawaiian forests, low plant diversity may have always been the case due to the extreme isolation of the Hawaiian archipelago (Barton et al., 2021).
Although proper hydrology, vegetation, soils, and resilience to SLR are critical for restoring tidal wetlands, these basic wetland components are insufficient to adequately support sensitive wildlife. Endangered species, such as the Hawaiian stilt, Hawaiian coot, and Hawaiian duck, are conservation reliant (Harmon et al., 2022), requiring special protections against predators, avian botulism, the encroachment of invasive plant species, and human disturbance (Greer, 2005; US Fish and Wildlife Service, 2011a; Underwood et al., 2014; Malachowski et al., 2022). Predator control, in particular, is of critical importance to protect endangered waterbirds from a suite of non-native species including cats (Felis catus), dogs (Canis familiaris), pigs (Sus scrofa), mongooses (Herpestus javanicus), Black, Norwegian, and Polynesian rats (Rattus rattus, Rattus norvegicus, and Rattus exulans), bullfrogs (Rana catesbeiana), introduced barn owls (Tyto alba), cattle egrets (Bubulcus ibis), and the common myna (Acridotheres tristis) (Greer, 2005; US Fish and Wildlife Service, 2011a; Underwood et al., 2014). Our analysis showed that breeding and bird counts were low for endangered waterbirds across the sites (Table 4). Furthermore, several of the top rated sites for bird habitat (OHI, PUNA, KNWR, KAMA, and PAHU) had low ratings for predator and botulism control due to a lack of management (Table 4). Although even simple ponds can provide habitat for endangered waterbirds (including wastewater treatment ponds containing raw sewage (KAUN)), unmanaged sites can act as ‘sinks’ with high mortality, especially for chicks, due to the abovementioned threats (Christensen et al., 2021; Harmon et al., 2021). The recovery of endangered waterbirds in Hawaiian wetlands depends on restoring and expanding high-quality habitat combined with strong protections from predators, hazards, and diseases.
Public support and local stakeholder involvement have been shown to be critical for conservation efforts, restoration projects, and sustainable resource management (Lee, 2011; Doyle-Capitman et al., 2018; Wilkins et al., 2018). We engaged with the Molokaʻi community at multiple times in our study in order to achieve coproduction of knowledge (Meadow et al., 2015). This process relied strongly on our community liaison and the Molokaʻi Wetland Partnership to effectively engage with residents. This effort allowed us to gain valuable insights about community support regarding our sites. For example, in the beginning of our work, we considered PAIA to be a strong contender for restoration, but as mentioned above, the failed development efforts at this site caused deep trauma for local residents, causing them to omit PAIA from consideration. Ultimately, PAIA received very low scores overall (Table 5). Knowledge of site history and perspectives on “landscape frame,” the environmental vision for the landscape of a person or community, are essential for truly understanding community preferences for restoration (Aggestrom, 2014). Furthermore, there must be strong consideration of local community needs (Doyle-Capitman et al., 2018), which for Molokaʻi include hunting, fishing, and socio-cultural resources.
The three different weighting approaches used in the site suitability analysis resulted in KOK, KNWR, OHI, PUNA, KAMA, and MOKU being ranked as the top six sites and KAUN, PAIA, and POHO as the lowest, effectively removing them from further consideration (Table 5). The specific sub-models we used to arrive at this prioritization of sites differ in important ways from most previous studies, which have ranked wetlands for restoration based solely on watershed attributes and specific wetland properties (White and Fennessey, 2005; Ouyang et al., 2011; Horvath et al., 2017; Qu et al., 2018; Medland et al., 2020). In our study, we incorporated community support in addition to wetland attributes and did so before any new restoration activities. The few studies we found that incorporated public opinion did so after wetland restoration was completed, which is useful for improving future actions, but may result in lost opportunities to build trust and community support during the process (Aggestrom, 2014; Sun et al., 2015; Doyle-Capitman et al., 2018). Our approach was the first, to our knowledge, to incorporate projected sea-level rise, which is critical for estimating future coastal wetland resilience. In the future, when more coastal wetland data become available for Molokaʻi and neighboring islands, our suitability “tool” could be improved by directly incorporating projections from marsh sustainability models and migration models into the analysis (e.g., Fagherazzi et al., 2020; Morris et al., 2022). Finally, although some studies prioritizing sites for wetland restoration have included bird habitat suitability (Hua et al., 2016; Maleki et al., 2018), our extensive analysis, particularly for endangered waterbirds, outlines specific habitat requirements needed to set the stage for recovery of these endemic Hawaiian species (Table 4; Supplementary Table S11).
The suitability analysis created in this study can be used to rank any additional coastal wetlands on Molokaʻi. It can also be applied elsewhere in Hawaiʻi, but it would need to be adapted to the more developed landscape and the particular needs of the local communities and stakeholders. Beyond application in other places, there is also the option to use this approach for prioritizing the cultural value of sites or various management actions such as increasing carbon sequestration on the landscape or employing nature-based solutions to reduce flooding, nutrient loading, and/or sedimentation. Clearly, one of the main strengths of the suitability analysis approach is that it can be expanded and adapted to accommodate particular uses depending on user needs (Lovette et al., 2018).
Although wetland restoration has been conducted in Hawaiʻi since at least the early 1980s (Tummons, 2011), we are not aware of any landscape-scale restoration efforts. The top six sites in this study represent over 66 ha (163 acres) of coastal wetlands along the south shore, and all of them are within a few kms from at least one other site (Figure 2). Three of the six highly ranked sites are already owned by the state or federal government (Table 1; Figure 2), which could facilitate restoration actions because land purchase would not be needed. There are other potential sites in this area that have yet to be assessed for restoration. The opportunity to restore multiple sites along the south shore of Molokaʻi is a rare chance to enact a landscape-scale recovery of wetland habitat in the Hawaiian Islands (Henry, 2016).
The top ranked sites offer an opportunity to restore essential habitat for endangered waterbirds, invertebrates, and native plants as well as re-ignite the socio-ecological ties of the largely Native Hawaiian community to coastal wetlands. Historically, managed wetlands or loʻi kalo were “keystone” components of the Native Hawaiian socio-ecological system because they constituted the major source of complex carbohydrates in the diet and dominated the lowland landscape in all areas wet enough to sustain them (Gon III et al., 2018; Winter et al., 2018). Recently, there has been renewed interest in traditional agro-ecology as a way to reduce dependence on imported food, regain island sustainability, and reach biodiversity goals (Gon III and Winter, 2019; Harmon et al., 2021). The restoration of coastal wetlands on Molokaʻi could be a major component of this renaissance. In particular, the restoration of wetland mosaics containing loʻipūnāwai, loko iʻa, and tidal marshes could provide food and cultural resources for local communities and a range of habitat types for flora and fauna.
Much of the lost wetland area across Hawaiian Islands has already been developed (Van Rees and Reed, 2013). Furthermore, sea-level rise threatens urbanized wetland complexes across the state (Henry, 2016). The wetland restoration opportunities available on Molokaʻi could reverse some of the degradation and habitat loss resulting from previous land uses and inspire further restoration along the ridge to reef continuum (Stock et al., 2011; Jacobi and Stock, 2017). The restoration of tidal wetlands is preferable sooner than later due to the need to procure migration space and establish wetland functions before the anticipated acceleration in SLR later in the century (Morris et al., 2022; Sweet et al., 2022). Our site rankings are just the first steps in a long process, but hopefully they will serve as a catalyst for revitalization of coastal wetlands on Molokaʻi for the benefit of the Native Hawaiian community and a wide range of native wetland species.
Data on soils, hydrology, vegetation, sea-level rise and migration potential, bird habitat value, and community support are provided in Supplementary Tables S1–S12. The data collected by the U.S. Geological Survey on wetland soils, hydrology, and vegetation are also available in Drexler et al. (2023) at the ScienceBase Repository, https://doi.org/10.5066/2FP99XSP28.
All authors except SH participated in the collection of field data. JD wrote the paper with assistance from HR, JJ, PL, and SH. JJ, HR, PL, AD-Y, WH, BW, and JD prepared the rankings and SH carried out the site suitability analysis. All authors contributed to the article and approved the submitted version.
This work was funded by the USGS Pacific Islands Climate Adaptation Science Center. In-kind support was provided by the affiliations of each of the co-authors.
The authors are grateful to Gordon Tribble and Delwyn Oki for their hydrologic expertise, Phil Scoles for his extensive knowledge of wetland soils, and the two journal reviewers and Ken Krauss for improving the manuscript. They thank Nancy McPherson (Department of Hawaiian Home Lands) for helping them understand and incorporate Native Hawaiian perspectives. They acknowledge the importance of the Molokaʻi Wetland Partnership in bringing this effort to fruition. Any use of trade, firm, or product names is for descriptive purposes only and does not imply endorsement by the U.S. Government. The authors dedicate this first paper of the Molokaʻi Wetland Partnership to the memory of Fern P. Duvall II, a 38-year employee of the Hawaiʻi DLNR Division of Forestry and Wildlife and a long-time board member of the Pacific Birds Habitat Joint Venture, who had long envisioned the possibilities for wetland restoration on the island of Molokaʻi.
The authors declare that the research was conducted in the absence of any commercial or financial relationships that could be construed as a potential conflict of interest.
All claims expressed in this article are solely those of the authors and do not necessarily represent those of their affiliated organizations, or those of the publisher, the editors, and the reviewers. Any product that may be evaluated in this article, or claim that may be made by its manufacturer, is not guaranteed or endorsed by the publisher.
The Supplementary Material for this article can be found online at: https://www.frontiersin.org/articles/10.3389/fenvs.2023.1212206/full#supplementary-material
Aggestrom, F. (2014). Wetland restoration and the involvement of stakeholders: An analysis based on value-perspectives. Landsc. Res. 39, 680–697. doi:10.1080/01426397.2013.819076
Alexander, H. G., and Dunton, K. H. (2002). Freshwater inundation effects on emergent vegetation of a hypersaline salt marsh. Estuaries 25 (6B), 1426–1435. doi:10.1007/bf02692236
Anderson, T. R., Fletcher, C. H., Barbee, M. M., Romine, B. M., Lemmo, S., and Delevaux, J. M. S. (2018). Modeling multiple sea level rise stresses reveals up to twice the land at risk compared to strictly passive flooding methods. Sci. Rep. 8, 14484. doi:10.1038/s41598-018-32658-x
Athens, J. S., Ward, J. V., and Wickler, S. (1992). Late Holocene lowland vegetation. Oʻahu, Hawaiʻi. New Zeal. J. Arch. 14, 9–34.
Bamber, J. L., Oppenheimer, M., Kopp, R. E., Aspinall, W. P., and Cooke, R. M. (2019). Ice sheet contributions to future sea-level rise from structured expert judgment. Proc. Natl.Acad. Sci. U.S.A. 116, 11195–11200. doi:10.1073/pnas.1817205116
Barton, K. E., Westerband, A., Ostertag, R., Stacy, E., Winter, K., Drake, D. R., et al. (2021). Hawai‘i forest review: Synthesizing the ecology, evolution, and conservation of a model system. Perspect. Plant Ecol. Evol. Syst. 52, 125631. doi:10.1016/j.ppees.2021.125631
Berkes, F., and Folke, C. (1998). “Linking social and ecological systems for resilience and sustainability,” in Linking social and ecological systems: Management practices and social mechanisms for building resilience. Editors F. Berkes, and C. Folke (Cambridge, England: Cambridge University Press).
Burney, D. A., James, H. F., Burney, L. P., Olson, S. L., Kikuchi, W., Wagner, W. L., et al. (2001). Fossil evidence for a diverse biota from Kauai and its transformation since human arrival. Ecol. Monogr. 71 (4), 615–641. doi:10.1890/0012-9615(2001)071[0615:fefadb]2.0.co;2
Burney, D. A. (1997). Tropical islands as paleoecological laboratories: Gauging the consequences of human arrival. Hum. Ecol. 25, 437–457. doi:10.1023/a:1021823610090
Byrd, K. B., Ballanti, L., Thomas, N., Nguyen, D., Holmquist, J. R., Simard, M., et al. (2018). A remote sensing-based model of tidal marsh aboveground carbon stocks for the conterminous United States. ISPRS J. Photogramm. Remote Sens. 139, 255–271. doi:10.1016/j.isprsjprs.2018.03.019
Cahoon, D. R., McKee, K. L., and Morris, J. T. (2020). How plants influence resilience of salt marsh and mangrove wetlands to sea-level rise. Estuaries Coast 44, 883–898. doi:10.1007/s12237-020-00834-w
Christensen, D., Harmon, K., Wehr, N., and Price, M. (2021). Mammal-exclusion fencing improves the nesting success of an endangered native Hawaiian waterbird. PeerJ 9, e10722. doi:10.7717/peerj.10722
Chutz, J. (2014). Kakahai‘a national Wildlife refuge - Hawai‘i wetland information network. Wetland site description. California, CA, United States: Pacific Coast Joint Venture.
County of Maui, (2020). County of Maui office of economic development. https://www.hisbdc.org/business-research-library/maui-county-data-book/.
Cowardin, L. M., Carter, V., Golet, F. C., and LaRoe, E. T. (1979). Classification of wetlands and deepwater habitats of the United States. FWS/OBS-79/31. Washington, DC, United States: US Fish and Wildlife Service. Available at http://www.npwrc.usgs.gov/resource/1998/classwet/classwet.htm.
Craft, C. B. (2016). “Tidal marshes,” in Creating and restoring wetlands from theory to practice (Amsterdam, Netherlands: Elsevier).
Cuddihy, L. W., and Stone, C. P. (1990). Alteration of native Hawaiian vegetation: Effects of humans, their activities, and introductions. Honolulu, Hawaii, United States: University of Hawaiʻi Press.
Dommain, R., Couwenberg, J., Glasser, P. H., Joosten, H., and Suryadiputra, I. N. N. (2014). Carbon storage and release in Indonesian peatlands since the last deglaciation. Quat. Sci. Rev. 97, 1–32. doi:10.1016/j.quascirev.2014.05.002
Doyle-Capitman, C. E., Decker, D. J., and Jacobson, C. A. (2018). Toward a model for local stakeholder participation in landscape-level wildlife conservation. Hum. Dimens. Wildl. 23, 375–390. doi:10.1080/10871209.2018.1444215
Drexler, J. Z., and Ewel, K. C. (2001). Effect of the 1997-1998 ENSO-related drought on hydrology and salinity in a Micronesian wetland complex. Estuaries 24 (3), 347–356. doi:10.2307/1353237
Drexler, J. Z., Jacobi, J. D., and House, S. F. (2023). Molokaʻi, Hawaiʻi rapid assessment of hydrology, soils, and vegetation in coastal wetlands 2022. U.S. Geological Survey data release. doi:10.5066/P99XSP28
Drexler, J. Z., Khanna, S., and Lacy, J. R. (2021). Carbon storage and sediment trapping by Egeria densa, Planch., a globally invasive, freshwater macrophyte. Sci. Total Environ. 755, 142602. doi:10.1016/j.scitotenv.2020.142602
EagleView Technologies Inc., (2008). EagleView Reveal [orthomosaic map]. Retrieved from https://explorer.pictometry.com/.
Edwards, T. L., NowickiMarzeionHock, S. B. R., Goelzer, H., Seroussi, H., et al. (2021). Projected land ice contributions to twenty-first-century sea level rise. Nature 593 (7857), 74–82. doi:10.1038/s41586-021-03302-y
Emerson, N. B. (1909). Unwritten literature of Hawaiʻi: The sacred songs of the hula. Smithsonian institution. Bulletin. Washington, D.C., United States: Bureau of American Ethnology.
Erickson, T. A., and Puttock, C. F. (2006). Hawai`i wetland field guide. Honolulu, Hawaii, United States: Bess Press Books.
Fagherazzi, S., Mariotti, G., Leonardi, N., Canestrelli, A., Nardin, W., and Kearney, W. S. (2020). Salt marsh dynamics in a period of accelerated sea level rise. JGR. Earth Surf. 125, e2019JF005200. doi:10.1029/2019jf005200
Fish, U. S., and Service, Wildlife (2011b). Kakahai‘a national wildlife refuge comprehensive conservation plan and environmental assessment. https://www.fws.gov/pacific/planning/main/docs/HIPI/Maui/Kakahai’a%20NWR%20DCCP-EA.pdf.
Fish, U. S., and Service, Wildlife (2021). National wetlands inventory. Available at https://www.fws.gov/wetlands/Data/State-Downloads.html.
Fish, U. S., and Service, Wildlife (2022). National wetlands inventory. Washington, D.C, United States: U.S. Department of the Interior, Fish and Wildlife Service.
Fish, U. S., and Service, Wildlife (2011a). Recovery plan for Hawaiian waterbirds, second revision. Portland: U.S. Fish and wildlife service. https://www.fws.gov/pacificislands/ch_rules/hawaiian%20waterbirds%20rp%202nd%20revision.pdf.
Fox-Kemper, B., Hewitt, H. T., Xiao, C., Aðalgeirsdóttir, G., Drijfhout, S. S., Edwards, T. L., et al. (2021). “Ocean, cryosphere and sea level change,” in Climate change 2021: The physical science basis. Contribution of working group I to the sixth assessment Report of the intergovernmental Panel on climate change. (Cambridge, England: Cambridge University Press). doi:10.1017/9781009157896.011
Fung Associates Inc, , and Swca Environmental Consultants, (2010). Assessment of natural resources and watershed conditions for kalaupapa national historical Park. Scotts Valley, California, United States: Natural Resource.
Garner, G. G., Hermans, T., Kopp, R. E., Slangen, A. B. A., Edwards, T. L., Levermann, A., et al. (2021). IPCC AR6 Sea-Level rise projections. Version 20210809. PO.DAAC. Available at https://podaac.jpl.nasa.gov/announcements/2021-08-09-Sea-level-projections-from-the-IPCC-6th.
Giambelluca, T. W., Chen, Q., Frazier, A. G., Price, J. P., Chen, Y.-L., Chu, P.-S., et al. (2013). Online rainfall atlas of Hawaii. Bull. Amer. Meteor. Soc. 94, 313–316. doi:10.1175/BAMS-D-11-00228.1
Giambelluca, T. W., Shuai, X., Barnes, M. L., Alliss, R. J., Longman, R. J., Miura, T., et al. (2014). Evapotranspiration of Hawai‘i. Final report submitted to the U.S. Army corps of engineers—honolulu district, and the commission on water resource management, state of Hawai‘i. Available athttp://evapotranspiration.geography.hawaii.edu/assets/files/PDF/ET%20Project%20Final%20Report.pdf.
Gon, S. O., Tom, S. L., and Woodside, U. (2018). ʻĀina momona, honua Au loli—productive lands, changing world: Using the Hawaiian footprint to inform biocultural restoration and future sustainability in Hawai‘i. Sustainability 10, 3420. doi:10.3390/su10103420
Gon, S. O., and Winter, K. (2019). A Hawaiian renaissance that could save the world. Amer. Sci. 107, 232–239. Available at https://www.americanscientist.org/article/a-hawaiian-renaissance-that-could-save-the-world.
Gon, S. O., Winter, K. B., and Demotta, M. (2021). Kua-lako-moʻo: A methodology for exploring indigenous conceptualisations of nature and conservation in Hawaiʻi. Pac. Conserv. Biol. 27, 320–326. doi:10.1071/PC20020
Goodman, A. C., Thorne, K. M., Buffington, K. J., Freeman, C. M., and Janousek, C. N. (2018). El Niño increases high-tide flooding in tidal wetlands along the U.S. Pacific coast. J. Geophys. Res-Biogeo. 123, 3162–3177. doi:10.1029/2018JG004677
Greer, N. M. (2005). Ethnoecology of taro farmers and their management of Hawaiian wetlands and endangered waterbirds in taro agroecosystems. Ph.D. thesis. Tacoma, WA, United Sates: University of Washington.
Harmon, K. C., Winter, K. B., Kurashima, N., Fletcher, C. H., Kane, H. H., and Price, M. R. (2021). The role of indigenous practices in expanding waterbird habitat in the face of rising seas. Anthr 34, 100293. doi:10.1016/j.ancene.2021.100293
Harmon, K., Opie, E., Miner, A., Paty-Miner, I., Kukea-Shultz, J., Winter, K., et al. (2022). Successful nesting by 2 endangered Hawaiian waterbird species in a restored Indigenous wetland agroecosystem. Wilson J. Ornithol. 134, 102–105. doi:10.1676/20-00064
Hawaii Department of Land and Natural Resources, (2008). Surface water hydrologic unit boundaries (watersheds) for the eight major Hawaiian islands. Available at https://geoportal.hawaii.gov/datasets/HiStateGIS::watersheds/about.
Hawaii Statewide Gis Program, (2021). TMK Parcels for the State of Hawaii, [ESRI polygon shapefiles]. Available at https://geoportal.hawaii.gov/datasets/parcels-hawaii-statewide/explore.
Hawaiian Islands Land Trust, (2023). Waiheʻe coastal Dunes and wetlands refuge. Available at https://climatechange.lta.org/case-study/hilt_waihee_restoration/.
Hawaiʻi Department of Land and Natural Resources, (2017). Hawaii biannual waterbird survey instructions. Available at https://dlnr.hawaii.gov/files/2019/12/Survey-Instructions.pdf.
Henry, A., and Fredrickson, L. (2022). Managing lowland wetlands in the main Hawaiian islands. Technical guide version 1.0. Honolulu, Hawaii, United States: U. S. Fish and Wildlife Service.
Henry, A., and Fredrickson, L. (2019). Recommendations for wetland enhancement at Kakahai‘a national Wildlife refuge. Honolulu, Hawaii, United States: U. S. Fish and Wildlife Service.
Henry, A. (2016). Molokaʻi wetlands: Landscape conservation project. Honolulu, Hawaii, United States: Pacific Birds Joint Venture.
Henry, A. R., and Fredrickson, L. H. (2013). Hydrogeomorphic evaluation of ecosystem restoration and management options for James Campbell national Wildlife refuge. Honolulu, Hawaii, United States: U. S. Fish and Wildlife Service.
Heron, (2023). Conservation design and printing./Users/jdrexler/Desktop/HGMReport_JamesCampbell%20(1).pdf.
Hill, B. R. (1996). “Hawaii wetland resources,” in National water summary on wetland resources. United states geological survey water-supply paper. Editors J. D. Fretwell, J. S. Williams, and P. J. Redman (Washington, D.C., United States: Geological Survey).
Horvath, E. K., Christensen, J. R., Mehaffey, M. H., and Neale, A. C. (2017). Building a potential wetland restoration indicator for the contiguous United States. Ecol. Indic. 83, 463–473. doi:10.1016/j.ecolind.2017.07.026
Hua, Y., Cui, B., He, W., and Cai, Y. (2016). Identifying potential restoration areas of freshwater wetlands in a river delta. Ecol. Indic. 71, 438–448. doi:10.1016/j.ecolind.2016.07.036
Jackson, N. L. (2013). “Estuaries,” in Treatise on geomorphology. Editor J. F. Shroder (Cambridge, England: Academic Press). doi:10.1016/B978-0-12-374739-6.00285-2
Jacobi, J. D., Price, J. P., Fortini, L. B., Gon, S. M., and Berkowitz, P. (2017). Carbon assessment of Hawaii. Washington, D.C., United States: Geological Survey.
Jacobi, J. D., and Stock, J. (2017). Vegetation response of a dry shrubland community to feral goat management on the island of Moloka‘i, Hawai‘i. Hawai‘i U S. Geol Surv Sci. Investig. doi:10.3133/sir20175136
Kane, H. H., Fletcher, C. H., Frazer, L. N., and Barbee, M. M. (2014). Critical elevation levels for flooding due to sea-level rise in Hawaii. Reg. Environ. Change 15, 1679–1687. doi:10.1007/s10113-014-0725-6
Kirch, P. V. (1982). The impact of the prehistoric Polynesians on the Hawaiian ecosystem. Pac. Sci. 36, 1–14.
Kirwan, M. L., and Megonigal, J. P. (2013). Tidal wetland stability in the face of human impacts and sea-level rise. Nature 504, 53–60. doi:10.1038/nature12856
Krauss, B. (2001). Plants in Hawaiian culture. Honolulu, Hawaii, United States: University of Hawaii Press.
Kroeger, K. D., Crooks, S., Moseman-Valtierra, S., and Tang, J. (2017). Restoring tides to reduce methane emissions in impounded wetlands: A new and potent blue carbon climate change intervention. Sci. Rep. 7, 11914. doi:10.1038/s41598-017-12138-4
Lee, C. W. (2011). The politics of localness: Scale-bridging ties and legitimacy in regional resource management partnerships. Soc. Nat. Resour. 24, 439–454. doi:10.1080/08941920903463820
Levermann, A., Winkelmann, R., Albrecht, T., Goelzer, H., Golledge, N. R., Greve, R., et al. (2020). Projecting Antarctica’s contribution to future sea level rise from basal ice shelf melt using linear response functions of 16 ice sheet models (LARMIP-2). Earth Syst. Dyn. 11 (1), 35–76. doi:10.5194/esd-11-35-2020
Lovette, J. P., Duncan, J. M., Smart, L. S., Fay, J. P., Olander, L. P., Urban, D. L., et al. (2018). Leveraging big data towards functionally-based, catchment scale restoration prioritization. Environ. Manage. 62, 1007–1024. doi:10.1007/s00267-018-1100-z
Malachowski, C. P., and Dugger, B. D. (2018). Hawaiian duck behavioral patterns in seasonal wetlands and cultivated taro. J. Wildl. Manag. 82, 840–849. doi:10.1002/jwmg.21.429
Malachowski, C. P., Dugger, B. D., Uyehara, K. J., and Reynolds, M. H. (2022). Avian botulism is a primary, year-round threat to adult survival in the endangered Hawaiian Duck on Kaua‘i, Hawai‘i, USA. Ornithol. Appl. 124. doi:10.1093/ornithapp/duac007
Malachowski, C. P., Dugger, B. D., Uyehara, K. J., and Reynolds, M. H. (2018). Nesting ecology of the Hawaiian duck, Anas wyvilliana on northern Kauaʻi, Hawaiʻi, USA. Wildfowl 68, 123–139.
Maleki, S., Soffianian, A. R., Soltani-Koupaei, S., Pourmanafi, S., and Saatchi, S. (2018). Wetland restoration prioritizing, a tool to reduce negative effects of drought; an application of multicriteria-spatial decision support system (MC-SDSS). Ecol. Eng. 112, 132–139. doi:10.1016/j.ecoleng.2017.12.031
McGlone, M. S. (2009). Postglacial history of New Zealand wetlands and implications for their conservation. N. Z. J. Ecol. 33 (1), 1–23.
Meadow, A. M., Ferguson, D. B., Guido, Z., Horangic, A., Owen, G., and Wall, T. (2015). Moving toward the deliberate coproduction of climate science knowledge. Weather Clim. Soc. 7 (2), 179–191. doi:10.1175/WCAS-D-14-00050.1
Medland, S. J., Shaker, R. R., Forsythe, K. W., Mackay, B. R., and Rybarczyk, G. (2020). A multi-criteria wetland suitability index for restoration across Ontario’s mixedwood plains. Sustainability 2, 9953. doi:10.3390/su12239953
Menne, M. J., Durre, I., Korzeniewski, B., McNeill, S., Thomas, K., Yin, X., et al. (2012). Global historical climatology network - daily (GHCN-Daily). Carolina, CA, United States: National Climatic Data Center.
Mitsch, W. J., and Gosselink, J. G. (2007). “Treatment wetlands,” in Wetlands (Hoboken, NJ, United States: John Wiley and Sons, Inc).
Moffett, K. B., and Gorelick, S. M. (2016). Relating salt marsh pore water geochemistry patterns to vegetation zones and hydrologic influences. Water Resour. Res. 52, 1729–1745. doi:10.1002/2015WR017406
Morris, J. T., Drexler, J. Z., Vaughn, L. J., and Robinson, A. H. (2022). An assessment of future tidal marsh resilience in the San Francisco Estuary through modeling and quantifiable metrics of sustainability. Front. Environ. Sci. 10, 1039143. doi:10.3389/fenvs.2022.1039143
Munkholm, L. J. (2011). Soil friability: A review of the concept, assessment and effects of soil properties and management. Geoderma 167-168, 236–246. doi:10.1016/j.geoderma.2011.08.005
Murray, N. J., Phinn, S. R., DeWitt, M., Ferrari, R., Johnston, R., Lyons, M. B., et al. (2019). The global distribution and trajectory of tidal flats. Nature 565, 222–225. doi:10.1038/s41586-018-0805-8
Murray, N. J., Worthington, T. A., Buntings, P., Duce, S., Hagger, V., Lovelock, C. E., et al. (2022). High-resolution mapping of losses and gains of Earth’s tidal wetlands. Science 376, 744–749. doi:10.1126/science.abm9583
Nasery, S., Matci, D. K., and Avdan, U. (2021). GIS-Based wind farm suitability assessment using fuzzy AHP multi-criteria approach: The case of herat, Afghanistan. Arab. J. Geosci. 14, 1091. doi:10.1007/s12517-021-07478-5
National Centers for Coastal Ocean Science, (2021). Digital elevation models (DEMs) for the main 8 Hawaiian islands. Available at https://catalog.data.gov/dataset/digital-elevation-models-dems-for-the-main-8-hawaiian-islands.
National Oceanic and Atmospheric Administration, (2021). Hawaii sea level rise [data file]. Available at https://coast.noaa.gov/slrdata/.
National Oceanic and Atmospheric Administration (Noaa), (2022a). National integrated drought information system. Available at https://www.drought.gov/states/hawaii/county/maui.
National Oceanic and Atmospheric Administration (Noaa), (2022b). Tides and currents. Available at https://tidesandcurrents.noaa.gov/datums.html?datum=MHHW&units=1&epoch=0&id=1613198&name=Kaunakakai+Harbor&state=HI.
National Park Service, (2010). National Park service. Available at http://www.nature.nps.gov/water/wrdpub.cfm.
Oki, D. S., Engott, J. A., and Rotzall, K. (2019). Numerical simulation of groundwater availability in central Moloka‘i, Hawai‘i: U.S. Geol. Surv. Sci. Investig. Rep. 95. doi:10.3133/sir20195150
Otte, M., Fang, W-T., and Jian, M. (2021). A framework for identifying reference wetland conditions in highly altered landscapes. Wetlands 41, 40. doi:10.1007/s13157-021-01439-0
Ouyang, N. L., Lu, S., Wu, B., Zhu, J., and Wang, H. (2011). Wetland restoration suitability evaluation at the watershed scale-a case study in upstream of the Yongdinghe River. Procedia Environ. Sci. 10, 1926–1932. doi:10.1016/j.proenv.2011.09.302
Pacific Coast Joint Venture, (2006). Strategic plan for wetland conservation in Hawai`i. Available at https://www.pacificbirds.org/wp-content/uploads/2014/12/HWJVStrategicPlan-3.pdf.
Price, J. P., Jacobi, J. D., Gon, S. M., Matsuwaki, D., Mehrhoff, L., Wagner, W., et al. (2012). Mapping plant species ranges in the Hawaiian islands – developing a methodology and associated GIS layers. http://pubs.usgs.gov/of/2012/1192/.
Pukui, M. K., and Elbert, S. H. (1986). Hawaiian dictionary: Hawaiian-English English Hawaiian revised and enlarge addition. Honolulu, Hawaii, United States: University of Hawaii Press.
Qu, U., Luo, C., Zhang, H., Ni, H., and Xu, N. (2018). Modeling the wetland restorability based on natural and anthropogenic impacts in Sanjiang Plain, China. Ecol. Indic. 91, 429–438. doi:10.1016/j.ecolind.2018.04.008
Roman, C. T., and Burdick, D. M. (2012). “A synthesis of research and practice on restoring tides to salt marshes,” in Tidal marsh restoration: A Synthesis of Science and management. Editors C. T. Roman, and D. M. Burdick (Washington, D.C., United States: Island Press).
Sanderson, M. (1994). Prevailing trade winds; weather and climate in Hawai‘i. Honolulu, Hawaii, United States: University of Hawaiʻi Press.
Soil Survey Staff, (2021). Natural resources conservation service, United States department of agriculture. Available at https://websoilsurvey.nrcs.usda.gov/.
Sprecher, S. W. (2001). “Basics concepts of soil science,” in Wetland soils: Genesis, hydrology, landscapes, and classification. Editors J. L. Richardson, and M. J. Vepraskas (Boca Raton, FL, United States: CRC Press).
Staples, G. W., and Cowie, R. H. (2001). Hawaii's invasive species: A guide to invasive plants and animals in the Hawaiian islands. Honolulu, Hawaii, United States: Bishop Museum Press.
State of Hawaii, (1996). Hawaiʻi's coastal nonpoint pollution control Program management plan. Hawaii office of state planning, pursuant to national oceanic and atmospheric administration award nos. NA47OZ0264 and NA57OZ0270. Available at https://files.hawaii.gov/dbedt/op/czm/initiative/nonpoint/cnpcp_mgmt_plan_sections/III_7-Wetlands.pdf.
Stearns, H. T., and Macdonald, G. A. (1947). Geology and ground-water resources of the island of Molokai. Honolulu, Hawaii, United States: U.S. Geological Survey.
Stock, J. D., Cochran, S. A., Field, M. E., Jacobi, J. D., and Tribble, G. (2011). From Ridge to reef—linking erosion and changing watersheds to impacts on the coral reef ecosystems of Hawai`i and the pacific ocean. http://pubs.usgs.gov/fs/2011/3049/.
Sun, X., Xiong, S., Zhu, J., Zhu, X., Li, Y., and Li, B. L. (2015). A new indices system for evaluating ecological-economic-social performances of wetland restorations and its application to Taihu Lake Basin, China. Ecol. Modell. 295, 216–226. doi:10.1016/j.ecolmodel.2014.10.008
Sustainable Resources Group International, (2018). Comprehensive management plan for ʻŌhiʻapilo ponds enhancement site, kalamaula, Molokaʻi. https://srgii.com/resource-management.
Sweet, W. V., Hamlington, B. D., Kopp, R. E., Weaver, C. P., Barnard, P. I., Bekaert, D., et al. (2022). Global and regional sea level rise scenarios for the United States: Updated mean projections and extreme water level probabilities along U.S. Coastlines. NOAA technical report NOS 01. https://oceanservice.noaa.gov/hazards/sealevelrise/noaa-nos-techrpt01-global-regional-SLR-scenarios-US.pdf.
Toro, M., Ptak, T., Massmann, G., Sültenfuß, J., and Janssen, M. (2022). Groundwater flow patterns in a coastal fen exposed to drainage, rewetting and interaction with the Baltic Sea. J. Hydrol. 615, 128726. doi:10.1016/j.jhydrol.2022.128726
Tummons, P. (2011). Hawai`i, mangrove’s drawbacks outweigh benefits. Environmental Hawaiʻi. Available at https://www.environment-hawaii.org/?p=7092.
Underwood, J. G., Silbernagle, M., Nishimoto, M., and Uyehara, K. J. (2014). Non-native mammalian predator control to benefit endangered Hawaiian waterbirds. Proc. Vertebrate Pest Conf. 26. doi:10.5070/V426110653
U.S. Census Bureau, (2021). Topologically integrated geographic encoding and referencing system (TIGER), TIGER/line and TIGER-related products electronic resource: Map. Available at https://www.census.gov/cgi-bin/geo/shapefiles/index.php.
Usda, (2014). Keys to soil taxonomy. https://www.nrcs.usda.gov/sites/default/files/2022-09/Keys-to-Soil-Taxonomy.pdf.
U.S. Geological Survey, (2019). National hydrography dataset (ver. USGS national hydrography dataset plus high resolution (published 20191209)). Available at https://services.arcgis.com/P3ePLMYs2RVChkJx/arcgis/rest/services/NHDPlusV21/FeatureServer.
U.S. Geological Survey, (2018a). USGS NED 1/3 arc-second contours for Maui NE, Hawaii 20180211 1 X 1 degree shapefile. Retrieved from https://data.usgs.gov/datacatalog/data/USGS:3a81321b-c153-416f-98b7-cc8e5f0e17c3#idp1908403156.
U.S. Geological Survey, (2018b). USGS NED 1/3 arc-second contours for Oahu E, Hawaii 20180211 1 X 1 degree shapefile. Retrieved from https://data.usgs.gov/datacatalog/data/USGS:3a81321b-c153-416f-98b7-cc8e5f0e17c3#idp1908403156.
Van Rees, C. B., and Reed, M. J. (2013). Wetland loss in Hawaiʻi since human settlement. Wetlands 34, 335–350. doi:10.1007/s13157-013-0501-2
VanderWerf, E. A. (2012). Hawaiian bird conservation action plan. Honolulu: Pacific rim conservation. https://pacificrimconservation.org/wp-content/uploads/2013/10/Introduction%202.pdf.
Vogl, R. J., and Hendrickson, J. (1971). Vegetation of an alpine bog on East Maui, Hawaiʻi. Pac. Sci. 25, 475–483.
Wagner, W. L., Herbst, D. R., and Lorence, D. H. (2005). Flora of the Hawaiian islands website. Available at http://botany.si.edu/pacificislandbiodiversity/hawaiianflora/index.htm.
White, D., and Fennessy, S. (2005). Modeling the suitability of wetland restoration potential at the watershed scale. Ecol. Eng. 24, 359–377. doi:10.1016/j.ecoleng.2005.01.012
Wilkins, E. J., Sinclair, W., Miller, H. M., and Schusters, R. M. (2018). Does proximity to wetlands matter? A landscape-level analysis of the influence of local wetlands on the public’s concern for ecosystem services and conservation involvement. Wetlands 39, 1271–1280. doi:10.1007/s13157-018-1076-8
Winter, K. B., Lincoln, N. K., and Berkes, F. (2018). The social-ecological keystone concept: A quantifiable metaphor for understanding the structure, function, and resilience of a biocultural system. Sustainability 10, 3294. doi:10.3390/su10093294
World Climate Research Program, (2020). CMIP6 - coupled model intercomparison project phase 6. Available at https://pcmdi.llnl.gov/CMIP6/.
Wyban, C. A. (1993). Report on the kalaupapa fishpond. On file with the national Park service. Washington, D.C., United States: U.S. Department of the Interior.
Younes, A., Koth, K. M., Ghazala, M. O. A., and Elkadeem, M. R. (2022). Spatial suitability analysis for site selection of refugee camps using hybrid GIS and fuzzy AHP approach: The case of Kenya. Int. J. Disaster Risk Reduct. 77, 103062. doi:10.1016/j.ijdrr.2022.103062
Zedler, J. B. (1982). The ecology of southern California coastal salt marshes: A community profile. Washington, D.C., United States: U.S. Fish and Wildlife Service.
Zimmerman, C. F., Keefe, C. W., and Bashe, J. (2007). Determination of carbon and nitrogen in sediments and particulates of estuarine/coastal waters using elemental analysis. http://www.caslab.com/;EPAMethods/PDF/EPA-Method-440.pdf.
Keywords: coastal fen, GIS site suitability analysis, Hawaiian islands, indigenous community, sea-level rise, traditional ecological knowledge, wetland restoration, Native Hawaiians
Citation: Drexler JZ, Raine H, Jacobi JD, House S, Lima P, Haase W, Dibben-Young A and Wolfe B (2023) A prioritization protocol for coastal wetland restoration on Molokaʻi, Hawaiʻi. Front. Environ. Sci. 11:1212206. doi: 10.3389/fenvs.2023.1212206
Received: 25 April 2023; Accepted: 06 June 2023;
Published: 11 July 2023.
Edited by:
Junhong Bai, Beijing Normal University, ChinaCopyright © This work is authored by employees of the US federal government and is therefore in the public domain. This is an open-access article distributed under the terms of the Creative Commons Attribution License (CC BY). The use, distribution or reproduction in other forums is permitted, provided the original author(s) and the copyright owner(s) are credited and that the original publication in this journal is cited, in accordance with accepted academic practice. No use, distribution or reproduction is permitted which does not comply with these terms.
*Correspondence: Judith Z. Drexler, amRyZXhsZXJAdXNncy5nb3Y=
Disclaimer: All claims expressed in this article are solely those of the authors and do not necessarily represent those of their affiliated organizations, or those of the publisher, the editors and the reviewers. Any product that may be evaluated in this article or claim that may be made by its manufacturer is not guaranteed or endorsed by the publisher.
Research integrity at Frontiers
Learn more about the work of our research integrity team to safeguard the quality of each article we publish.