
94% of researchers rate our articles as excellent or good
Learn more about the work of our research integrity team to safeguard the quality of each article we publish.
Find out more
ORIGINAL RESEARCH article
Front. Environ. Sci., 31 August 2023
Sec. Environmental Economics and Management
Volume 11 - 2023 | https://doi.org/10.3389/fenvs.2023.1211454
This article is part of the Research TopicAir Pollution as a Risk Factor Affecting Human Health and Economic CostsView all 18 articles
 Małgorzata Bielenia1*
 Anna Podolska2
One of the objectives of European Union policy, as well as the assumptions of cooperation as part of United Nations, is to ensure sustainable development. The gradual decarbonisation of the economy is a significant element in this case. This is particularly important in transport, including maritime transport. That is why the concept of Green Ports is so important. It contains various infrastructure solutions that maximize the benefits of maritime transport while minimizing environmental damage. However, the term Green Ports is defined in the literature it is difficult to have a clear definition, a formula that defines the term and there is still a place for scientific research in this area. The purpose of the research is to analyze the assumptions of the Green Ports concept in economic terms, but also in legal terms. The authors want to focus on Internet infrastructure as a link in reducing the carbon footprint in maritime transport. For this purpose, they studied the carbon footprint generated by the websites of selected seaports (seaports considered by the Transport and Environment report (https://www.transportenvironment.org/discover/port-carbon-emissions-ranking/) the most polluting European ports and ports considered by the Leading Maritime Cities 2022 report to be the most technologically advanced (DNV, Menon Economics, 2022 https://www.dnv.com/maritime/publications/leading-maritime-cities-of-the-world-2022.html). Both at the United Nations and at the level of organizations of a regional nature (such as the European Union), the use of new technologies is closely linked to economic development or social progress. For example, access to the Internet has been recognized by the United Nations General Assembly as a human right. This is because it has been recognized that the Internet provides an opportunity to realize other rights, such as freedom of expression, the right to information, and education. However, there are also risks associated with the use of new technologies, if only in terms of the right to privacy, intellectual property, security or a clean environment. According to the authors, far less attention is paid to the risks than to the benefits. That’s why it’s worth building awareness to prevent harm rather than repair it. An important aspect of the research is to show that websites consume large amounts of energy. In addition, they have a negative impact on the environment, influencing the production of a significant amount of carbon dioxide. The main finding from the empirical part is that there is a certain relationship between the generation of CO2 by the ports and the “cleanliness” of their websites.
This is not an article arguing for the discontinuation of the Internet and the technologies that use it. The digital acceleration, which can be seen, for example, in the emergence and diffusion of the GPT 3 generative AI model and now the (generally available) GPT-4, has also led to a revival of discussions (imminent) about the risks associated with the use of artificial intelligence. On a normative level, the result of these discussions is a draft regulation establishing harmonized rules on artificial intelligence (Artificial Intelligence Act, 2021). The dangers of new technologies, no longer limited to addiction, are therefore recognized. However, there is still not enough talk about the environmental damage that results from digital devices.
One of the global challenges of modern economic policy is to ensure sustainable development, i.e., economic and civilizational progress, which would be the least harmful to the natural environment. Tasks in this direction have been set at the international level (i.e., by the United Nations and the European Union).
In the first of these areas, the UN Sustainable Development Goals (United Nations, 2022) provide a matrix of actions. From the perspective of the subject of the article, attention should be paid primarily to Goal 13: “Take urgent action to combat climate change and its impacts” and Goal 7: “Ensure access to affordable, reliable, sustainable and modern energy for all”.
At the European level, the EU has taken an initiative in the area of sustainable development by creating the concept of the Green Deal (European Parliament, 2022). This concept presents a roadmap that covers ideas, plans, legal acts aimed at strengthening the European economy while caring for the natural environment (European Commission, 2022). The primary objective of the Deal is to achieve climate neutrality by 2050. Social and economic transformation is necessary, based on the assumptions of cost-effectiveness, justice and social balance. The concept of the Green Deal also clearly applies to the maritime economy. The EU has comprehensive rules on the environmental aspects of maritime transport, and the European Commission has published a package of legislative changes, called the Fit for 55 package.
Sustainable development requires many comprehensive actions, taking into account international cooperation, changes in the functioning of the economy, but also rethinking individual attitudes (entrepreneurs and consumers). One of the problematic areas is transport, which on the one hand is indispensable, on the other hand generates significant carbon dioxide emissions into the atmosphere, contributing to global warming.
A study by Transport & Environment (https://www.transportenvironment.org/discover/port-carbon-emissions-ranking/) points to the carbon footprint of the maritime transport industry. Due to the rapid growth of trade associated with the development of e-commerce sales, the shipping industry has become a very fast-growing sector, accompanied by an increase in the prices of cargo volumes (an increase in the price of container transport). The record high financial performance of shipping companies is not only profitable for a number of companies in the supply chain, but also generates revenues on the order of magnitude equal to such well-known companies as Apple and Facebook. The entire supply chain of just one industrial area, which is the port, has a direct impact on climate change. When analysing this supply chain (i.e., ships and tankers entering and leaving ports), it should be kept in mind that this process is responsible for significant emissions of harmful gases. This industry also leaves its mark on the environment and climate when the ship is already on the port quay (i.e., during loading, unloading or refuelling). The European Environment Agency report’s authors also noted that it will be necessary to adapt port infrastructure to the expected rise in sea levels due to climate change (https://www.eea.europa.eu/highlights/eu-maritime-transport-first-environmental).
Moreover, scholars have discussed also the impacts of the COVID-19 epidemic on the shipping industry (Xu et al., 2023).
The COVID-19 epidemic have changed the maritime transport significantly, compared with the year 2019 total carbon emissions in 2020 from oil tanker, bulk carrier increase but carbon emissions from cruise ship and vehicle carriers have turned overall situation of carbon emissions and were reduced during this time (Xu et al., 2021a).
The main purpose of the article is to point out that attention on carbon footprint generation is mainly focused on transportation, roads and buildings while emissions from the Internet remain often unnoticed (Guerrero-ibanez, Zeadally, Contreras-Castillo, 2015; Ozcan and Apergis, 2018; Wang and Xu, 2021). It is important to remember that on the road to net zero, every action counts.
The authors focus on a very narrow issue—the generation of a carbon footprint by websites. Furthermore, they have chosen the maritime transport sector, which has ambitions to achieve climate neutrality in the near future. This example is intended to be a starting point for a discussion on the fact that we cannot separate the pollution generated by the using of the internet from the benefits we can achieve through it in another sector. It is therefore important to approach the problem holistically and not to overlook any link leading to the final chain.
The authors show one element of port operations (port infrastructure) that generates a carbon footprint, and also point out that new technologies, even as simple as a website, generate a carbon footprint. Given the growth of the new technology industry and its encroachment into virtually every activity of human activity, one needs to work on the cost consciousness resulting from the use of these technologies.
Currently, the political (UN’s and EU’s) efforts do not include strategies related to reducing the carbon footprint of new technologies. Even the Artificial Intelligence Act focuses mainly on the positive impact of artificial intelligence in high-impact sectors, including climate change, environment (see point 3 of the recitals, Articles 47(1) and 54(1) of the Artificial Intelligence Act). However, the Explanatory Memorandum of the draft emphasizes that the benefits of artificial intelligence must be balanced with the need to ensure fundamental rights including the right to a high level of environmental protection and the improvement of the quality of the environment, as enshrined in Article 37 of the Charter of Fundamental Rights of the European Union and implemented in Union policies. (see also point 28 of the recitals, Article 3(44) of the Artificial Intelligence Act). The lack of adequate regulation on environmental sustainability has been pointed out by the European Economic and Social Committee: compliance with the requirements set for medium- and high-risk AI does not necessarily mitigate the risks of harm to health, safety and fundamental rights for all high-risk AI. The EESC recommends that the AIA provide for this situation. At the very least, the requirements of 1) human agency, 2) privacy, 3) diversity, non-discrimination and fairness, 4) explainability and 5) environmental and social wellbeing of the Ethics guidelines for trustworthy AI should be added. (para. 8; the European Economic and Social Committee, 2021). For high-risk artificial intelligence systems, see also point 4.10 of the Opinion. The proposed conditions are included in the Ethics Guidelines for Trustworthy Artificial Intelligence (the High-Level Expert Group on AI, 2019).
Also the European Committee of the Regions has indicated that the members of the European Artificial Intelligence Board should reflect the interests of European society. These interests include, inter alia, climate and the energy-efficient use of AI systems (Amendment 12, he European Committee of the Regions, 2022).
The purpose of the article (empirical part) is to present the problem of generating a carbon footprint by seaport websites. This problem, of course, applies to all websites and tools related to the use of the Internet. The authors took up the subject of seaports to indicate a certain paradox—both at the level of individual countries and at the international level, initiatives related to the pursuit of climate neutrality of maritime transport are undertaken, for this purpose, first of all, solutions based on new technologies (using the Internet as a necessary component) are implemented, not noticing that they also emit carbon dioxide and have a harmful impact on the environment, for example, by creating e-waste. Of course, the purpose of the article is not to deny the digitalization of ports and the use of the Internet, but to make people aware that at the moment the Internet is not a climate-neutral tool.
The article deals with both theoretical issues and presents the results of own research. The authors briefly presented the impact of maritime transport on the environment and the solutions adopted at the UN and EU level in the area of reducing the environmental harm of maritime transport. What is more, the authors base their considerations on the concept of Green Ports. The issue of digitalization was also addressed, with particular focus placed on ports. To check to what extent the use of Internet tools generates carbon dioxide into the atmosphere, empirical studies were carried out. The authors selected the websites of the ports that were subject to the study. First, European ports were selected, which, according to the Transport & Environment ranking (https://www.transportenvironment.org/discover/port-carbon-emissions-ranking/), generate the most pollution. The second stage involved checking the sites of ports, which according to the ranking of The Leading Maritime Cities of the World 2022 are considered the most technologically advanced (DNV, Menon Economics, 2022 https://www.dnv.com/maritime/publications/leading-maritime-cities-of-the-world-2022.html).
In general, theoretical and empirical studies concern combating climate change in the maritime sector. The environmental and carbon impacts of new technologies (including Information and Communication Technology—ICT) are much less often analyzed. There are some studies that indicate a positive relationship between ICT usage and CO2 emissions (Erdmann and Hilty, 2010; Ishida, 2015; B.V; Mathiesen, Lund, Connolly, Wenzel, Ostergaard, Moller, 2015; Pamlin and Pahlman, 2008; Chavanne et al., 2015; Toffel and Horvath, 2004; Wissner, 2011). Others find that the use of ICT puts pressure on energy consumption (Moyer and Hughes, 2012; Salahuddin and Alam, 2015) which is the main source of CO2 emissions (Hamdi, Sbia, Shahbaz, 2014).
The structure of the article is as follows. In the introduction described will be the nature of our research problem—carbon footprint generated by port websites and the background of the concept of the Green Port. Further discussed will be the environmental impact of maritime transport with particular emphasis on carbon emissions. Then will be presented, based on the literature studies conducted, the approaches of various researchers to capture the essence of the concept of Green Ports. The method section will provide sufficient details regarding authors own research on carbon footprint generated by the websites of individual ports. It is worth mentioning that the empirical part is based on two parts. The first part relates to the explanation that authors choose ports considered in the T&A report as the most polluting ports in Europe and examined the websites of those ports. The second part of the study covered ports that are considered to be the most technologically advanced versus websites that generate the greatest load on the environment. In the authors’ study, it became apparent that there is a connection between the CO2 generation of ports and the “cleanliness” of their websites.
Emissions related to port infrastructure are becoming an increasingly frequent subject of research. It is estimated that 90% of everything we consume is transported by sea (https://www.weforum.org/agenda/2021/10/global-shortagof-shipping-containers/). This translates into 940,000,000 tons of CO2 per year, which constitutes 2.5% of global carbon dioxide emissions into the atmosphere (https://www.ukri.org/news/shipping-industry-reduces-carbon-emissions-with-space-technology/). It has not been known for a long time that an increase in shipping activity will result in an increase in carbon dioxide emissions (Xu et al., 2023).
The European Environment Agency indicates that approximately 1/4 of the EU’s total CO2 emissions in 2019 came from the transport sector (https://www.eea.europa.eu/en/topics/in-depth/transport-and-mobility), of which 71% from road transport, 13,5% from maritime transport, 14.4% from civil aviation, 0.5% from other transport and 0.5% from rail (European Environment Agency, European Maritime Safety Agency, 2021, pp. 40). According to the EMTER 2021 Report (EMTER 2021), maritime transport (maritime and inland waterway transport) was responsible for 13.5% of greenhouse gas emissions in the EU (European Environment Agency, European Maritime Safety Agency, Raport EMTER 2021; Stefaniak, 2022). The report indicates that maritime and inland waterway transport are responsible for greenhouse gas emissions. Therefore, the EU Fit for 55 package also covers the transport sector, including maritime transport.
Analyses of the relationship of the federation of green organizations in the EU—Transport & Environment indicate the 10 ports that recorded the highest carbon dioxide emissions in 2020. CO2 emissions cover three scopes, i.e., scope 1 direct emissions (from the core activities of ports—loading of goods, unloading, refuelling), scope 2 indirect emissions (generated during the production of purchased electricity and heat) and scope 3 indirect emissions, i.e., throughout the supply chain caused by ships entering and leaving European ports (Greenhouse Gas Protocol, 2022). The division of emissions into three scopes was introduced by the Greenhouse Gas Protocol initiative (Greenhouse Gas Protocol, 2022; DNV; Menon Economics and Publication, 2022).
The carbon footprint is one way to measure human impact on the environment. The publication of T&E’s ranking of the ten most polluting European ports calls for reducing carbon dioxide emissions to avoid catastrophic climate change and demonstrates the high climate impact of these entities. According to the T&E report (https://www.transportenvironment.org/wp-content/uploads/2022/02/2202_Port_Rankings_briefing-1.pdf), the port of Rotterdam is the most polluting seaport in Europe (the only greenhouse gas reported was CO2). The first infamous place on the list of so-called top-10 largest ports in Europe when it comes to CO2 emissions was taken by the largest port in Europe, i.e., the port of Rotterdam with a result of 13.7 million tons. The second place in the ranking for transhipments larger by less than 30 percent was taken by the port of Antwerp. The level of emissions of the port of Antwerp amounted to 7.4 million tons. It is worth mentioning here that the Dutch port in relation to its largest competitor—Antwerp emits almost twice as much carbon dioxide per year. To show the enormous impact of the port of Rotterdam on the climate, it is compared with the fifth largest industrial polluter in Europe—the German Weisweiler coal-fired power plant.
Another European port that should significantly reduce its carbon footprint is the port of Hamburg, which ranks third among the largest CO2 emitters with a result of 4.7 million tons. Three Spanish ports are also very high on the Top-10 list of the largest CO2 emitters. Fourth place is taken by Algeciras, the highest rank among Spanish ports, with a volume of discharges of 3.3 million tons. While fifth and seventh places were taken by Barcelona and Valencia respectively, they follow Algeciras with a discharge volume of 2.8 and 2.7 million tonnes respectively. In the ranking with the same volume of discharges as the port of Valencia of 2.7 million tons per year, the Greek port of Piraeus was also included.
The eighth to ninth places are occupied by the German port of Bremen/Bremerhaven (2.3 million tons) and the French port located in Marseille (2.3 million tons) respectively. Among the 10 ports that recorded the highest carbon dioxide emissions in 2020, the port of Amsterdam achieved the lowest volume of discharges at 2.1 million tonnes per year. The presented results on the most poisonous European ports served as a reference for conducting the authors’ own research.
Ports located all over the world want to become as green as possible, meaning environmentally friendly. Recently, scientific studies have emerged describing the operation and management policies of ports and shipping companies in emergency situations and daily management, providing a basis and reference for the development of green shipping development strategies (Xu et al., 2023). The concept of Green Port is difficult to define due to the multiple attempts to classify activities aimed at the so-called greening of ports, resulting in the fact that there is no unambiguous definition of this phenomenon in the literature. Certainly, however, it is a process involving port activities, which include, management, introduction of regulations and undertaking investments that raise environmental standards. According to Czermański, Pawłowska and Oniszczuk-Jastrząbek “The Green Port concept includes the idea of protecting the environment in all its infrastructure works, in the sustainable development policies that it follows, and in all the activities and operations conducted in the area” (Czermański, 2019, pp. 6). Żukowska noticed that the concept of Green Ports focuses on undertaking pro-ecological initiatives in three main areas—environment, economy and society. Green Ports are the growth poles intensifying projects aimed at reducing their negative impact, while implementing a set of actions to improve conditions and quality of life, in particular at the port-city interface (Żukowska, 2021). Promoting energy conservation, reducing emissions, and improving the port’s end-to-end competitiveness through the use of shore-to-ship (SSE) electricity technology is increasingly resounding in the scientific literature (Xu et al., 2021b).
In the literature, the concept of Green Ports is also presented as a direction for the development of seaports, taking into account the achievement of the following priorities: improvement of air quality, reduction of energy consumption, reduction of noise emissions, improvement of water quality, improvement of waste, waste and sewage management and improvement of relations with the environment (Czermański, 2019). The concept of Green Ports very often appears in the context of sustainable development, which took the form of a global trend of the turn of the 20th century (Bergqvist, Monios, 2019; UNESCAP, 2021). It is believed that this issue has developed in recent years in connection with the study of the impact of maritime transport on environ-mental degradation. In this context, Green Ports are most often mentioned as sources of noise, dust, waste and water pollution (Ng, Song 2010; Lam, Notteboom, 2014). The maritime transport sector and in particular clean infrastructure solutions at the port level are of particular importance in view of the European Union’s ambitious objectives for the decarbonisation of maritime transport. Ports have an impact on the climate change and it is huge (https://www.eea.europa.eu/highlights/eu-maritime-transport-first-environmental). The authors of the article wanted to show that the UN but especially the EU is introducing solutions to ensure climate neutrality in the future, these measures are based on the use of new technologies (such as the Internet). Green Ports, which by con-ducting their basic activity, applying development and investment strategies, providing adequate infrastructure to improve energy efficiency, implementing new eco-friendly solutions and implementing intelligent digital solutions, can achieve climate neutrality and zero pollutant emissions. The Green Port concept relies heavily on advanced technological solutions associated with the use of technologically modern infrastructure in port and terminal operations, which is related to the use of the Internet.
The concept of Green Ports is closely related to the use of new technologies in port functioning. The European Commission indicates digital technologies as the main pillar of the green transition. The main objective of the European Green Deal is for the European Union to achieve climate neutrality by 2050. Innovative digital technologies such as artificial intelligence, machine learning, 5G, cloud, edge computing or the Internet of Things are increasingly mentioned as a transition to green tracks and the key to green transformation. At the same time, it should be kept in mind that advanced technologies, also called in the literature ‘The fourth Industrial Revolution (4IR) technologies’ were considered to be a key factor in achieving the Sustainable Development Goals (SDGs). A smart port is a port that uses automation and innovative technologies, including AI, Big Data, IoT and Blockchain to improve its performance (UNESCAP, 2021, pp. 15). The use of these tools requires the use of the Internet.
The digitalization of the economy is an aspect that raises the hope of reducing/stopping environmental degradation. The role of modern technologies and the use of artificial intelligence is to improve processes in every area of the economy, but they also introduce solutions that facilitate everyday life (as exemplified by smart home solutions and optimizing the use of energy in households) These instruments are based on Internet access, the universality and importance of which have translated into the recognition of Internet access as a human right by the United Nations. The figures show a steady increase in Internet access, which currently covers more than 63.1% of the population. Of course, there are still significant disparities between regions, as in the Scandinavian countries it reaches 98%, and in Central Africa it covers only about 25% of the population (We Are Social Ltd, 2022).
The benefits of using new technologies are indisputable. An increased level of relocation of economic and private activities is also inevitable. However, it should be kept in mind that solutions based on the Internet also generate a burden on the environment. Every click has a huge impact on the climate (or to put it better, has a great importance for the climate change), as it is associated with the emission of greenhouse gases into the atmosphere. On the one hand, a fairly significant carbon footprint left by the use of electronic devices (computers, phones, tablets) or the functioning of websites should be noticed. On the other hand, using the Internet causes leaving waste also in the digital sphere (e-waste) Shorter product lifespans, rapidly advancing technological development and ever-lower prices for IT products mean that billions of metric tons of electronic products are being discarded. To present the severity of the situation and the scale of the problem, the data on the number of current users of the websites of the selected ports (10 ports that recorded the highest carbon dioxide emissions in 2020—analyses performed by Transport and Environment and ports considered by the Leading Maritime Cities 2022 report to be the most technologically advanced) and the associated estimates of greenhouse gas emissions will be summarized below.
Using the Web Site Calculator, it was checked how many grams of carbon dioxide are emitted into the environment when visiting a given site (Wholegrain Digital, Scamper Ltd., 2022 https://www.websitecarbon.com/faq/). The authors used two existing solutions to test carbon emissions of web pages. The Website Carbon Calculator designed by world leaders in digital sustainability aiming to develop and refine a methodology for this purpose. WebsiteCarbon.com is a project of Wholegrain Digital (Scamper Ltd), the developer of this tool claims that to calculate the energy and emission of a web page they use the following data points: data transfer over the wire; energy intensity of web data; energy source used by the data centre; carbon intensity of electricity and website traffic. The tool also makes it possible to calculate pollution generated by a single visit as well annual emissions with an average monthly number of visits of 10,000 and indicate how many trees are needed to neutralise such a carbon footprint. Of course, the assumption of 10,000 visits per month is not reliable, so it was necessary to obtain data on the actual number of visits to a given website.
The average monthly number of visits to a given website was calculated using the SimilarWeb tool (SimilarWeb, 2022). This way, it was possible to approximate the actual environmental load on a given website. It should be noted that all SimilarWeb data are estimates and approximations. The tool does not have exact data on site traffic (only site owners know that), but it collects publicly available information on web traffic and builds reports from it. Similarweb Ltd., together with its group companies. The tool has been researching for over 10 years the digital world. It collects daily 10 TB digital signals and analyses 2 TB data. However, the data obtained from SimilarWeb should be treated only as a signal, a clue to take further pro-environmental measures.
Obtaining data as to the pollution generated by a single input and the level of the number of hits on a given page, the authors presented the amount of CO2 emissions into the atmosphere generated by individual seaport websites. The research was conducted from June to September 2022.
In a study carried out by the authors, the carbon footprint of 11 websites of ports, considered in the T&A report as the most polluting ports in Europe and, for comparison, the port of Shanghai (see Figure 1). The Website Carbon Calculator (WCC) is a measurement tool. After entering the address of the website, the emission data of a single visit to the website is displayed. It also specifies an estimate of the pollution generated annually by a given website, assuming that 10,000 users visit the website per month. The WCC also shows the energy source used by the website and indicates the scale of the generated pollution, indicating at least the number of trees needed to neutralise emissions. The port in Bremen/Bremerhaven has the cleanest website, whose one-time visits will generate only 0.14 g of CO2. This represents 16.84 kg of carbon dioxide emissions per year, which consume 1 tree (see Figure 2). Not much worse is the port of Barcelona, whose website generates 0.25 g per visit and the port in Amsterdam (0.39 g). The top five also included Antwerp (0.4 g) and Valencia (0.68 g). In terms of the average annual footprint generated by a website in kg, the port of Barcelona generated 29.54 kg, which takes two trees to absorb. Another growing trend was the port in Amsterdam—46.93 kg (three trees are needed). A similar result was obtained by Antwerp 48.3 kg (and also three trees). Similarly, presenting the results in kg in the top five, there was also the port in Valencia 81.75 kg. Slightly worse in the comparison was the port of Athens, whose single visit generates 0.74 g of CO2. This amounts to 89.05 kg of carbon dioxide emissions per year, which can be neutralised by 4 trees. Next in the ranking is the port of Algeciras, which generates 0.78 g of CO2 with one visit. This represents 93.12 kg of carbon dioxide emissions per year, which should absorb 5 trees. Marseille is next (0.85 g). This amounts to 101.42 kg of carbon dioxide emissions per year, which will neutralise 5 trees, similarly to the previous place in the ranking. Rotterdam (1.16 g), Hamburg (1.2 g) and Shanghai (3.2 g) are among the most emitting ports. This constitutes an annual carbon dioxide emission in the amount of: Rotterdam (139.09 kg), Hamburg (143.44 kg) and Shanghai (383.42 kg) with an average annual number of visits of 10,000. More figuratively, in order to reduce the carbon dioxide produced by port websites, two trees are needed (in the case of Rotterdam and Hamburg, in the extreme case—Shanghai, it would be 18 trees). The fact that it's not that much of a burden compared to others doesn’t mean that you shouldn’t pay attention to it.
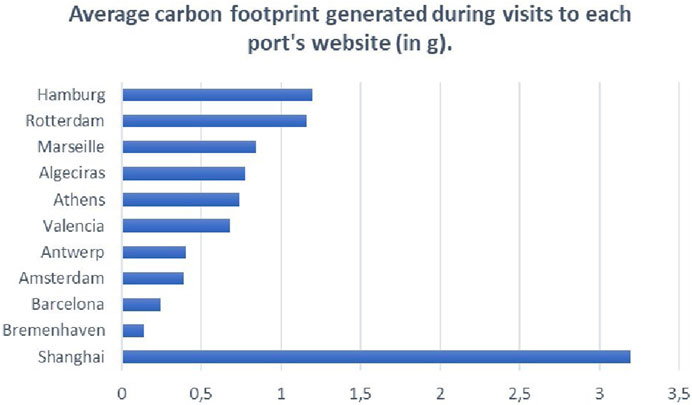
FIGURE 1. Average carbon footprint generated during visits to each port’s website (in g).
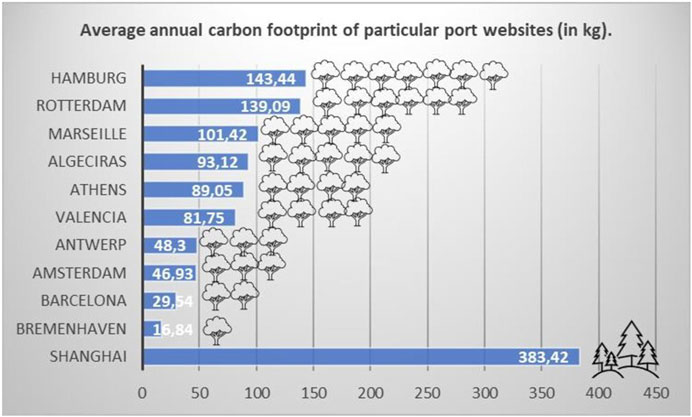
FIGURE 2. Average annual carbon footprint of particular port websites (in kg).
Examination of the amount of carbon dioxide generated by the websites of the ports that, according to T&E, emit the most carbon dioxide has shown that there is a certain relationship between the generation of CO2 by the ports and the “cleanliness” of their websites. The higher the port is in the infamous T&A ranking, the more solutions used on the website do not take into account the possibility of minimizing the carbon footprint generated by their websites.
It is worth noting, however, that in many cases the actual share in the production of the carbon footprint will be much greater than assumed by the Website Carbon Calculator. It all depends on the actual traffic on the site. Another tool used for research—SimilarWeb—makes it possible to examine the monthly number of page views. The amount of pollution generated annually given in Figure 2 assumes that a given website will be visited 10,000 times a month. In fact, the traffic on a given website turns out to be much greater (see Figures 3, 4). In the case of Rotterdam it will be almost 44 times the assumed number, so it will not be 139.09 kg per year but instead, 6,160.80 kg. Only in two cases (Bremerhaven and Athens), the monthly traffic on the website was lower than assumed in the carbon footprint calculator of websites. This leads to a simple conclusion that the actual carbon footprint is very likely to be greater than the WCC predicted. In addition, the inclusion of data from Figures 1–4 shows that more emitting websites (ports in Rotterdam and Hamburg) are also relatively more frequently visited than other websites included in the study. No similar pattern was observed for the other sites. The third and fourth places in terms of the number of visits were taken by the websites of ports in Barcelona and Amsterdam, and which took second and third places respectively in terms of environmental friendliness. It is worth noting, however, that the website of the port in Bremerhaven is the cleanest and least visited one.
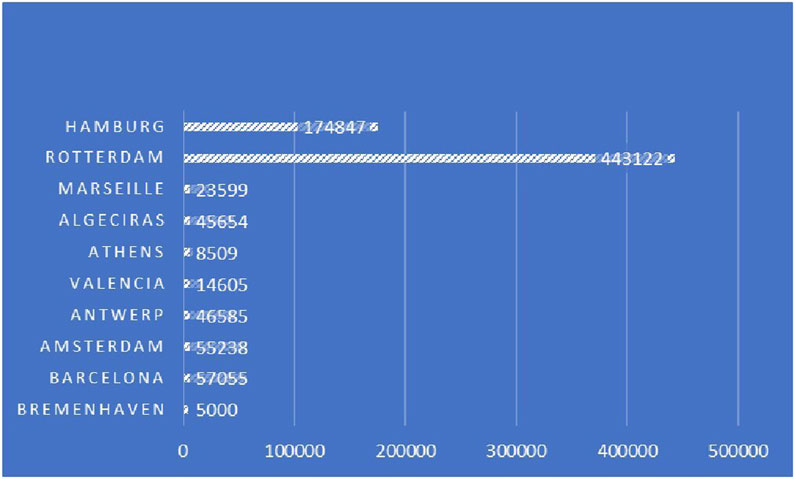
FIGURE 3. Monthly number of visits to websites in the period from June to August 2022.
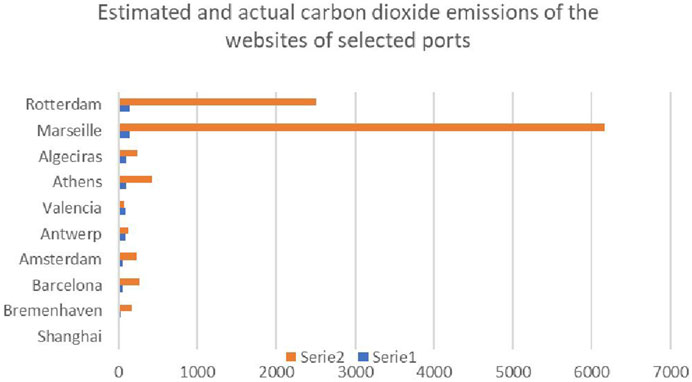
FIGURE 4. Estimated (in orange) and actual (in blue) carbon dioxide emissions of the websites of selected ports.
The second part of the study covered ports that are considered to be the most technologically advanced based on the Leading Maritime Cities 2022 report. It is worth noting that one of the factors affecting the results were solutions that have an impact on the port’s climate neutrality. The port of Singapore was considered as the most technologically advanced port, followed by ports in Oslo and Busan. Then there were ports in London, Shanghai, Tokyo, Rotterdam, Hamburg and Beijing. By definition, the digitisation of ports should have a smaller negative impact on the environment. From this point of view, it was interesting to examine the carbon footprint of the most technologically advanced ports left by websites. Figure 5 shows the estimated CO2 emissions generated by a single visit to the website, specified in grams. The infamous first place went to the website of the port of Shanghai. In the ranking lead the port websites in Singapore and Korean Busan.
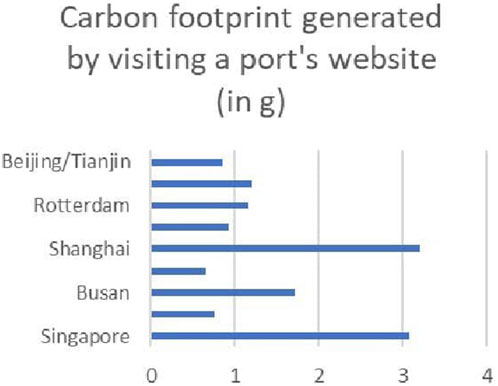
FIGURE 5. Carbon footprint generated by visiting a port’s website (in grams).
Figure 6 shows the annual burden on the atmosphere of individual websites, assuming that 10,000 Internet users visit them every month. The data do not reflect reality without referring to the actual traffic on a given page. Table 1 presents data that allow for a more realistic estimation, calculated according to the formula: C3 = C2 x (V/10.000), where it means the actual amount of CO2 generated during the year with traffic on the website at the level in the period from June to August 2022, C2 - the amount of CO2 generated per year when visiting the website on average 10,000 times a month (in kg) and V - the number of visits in August 2022.
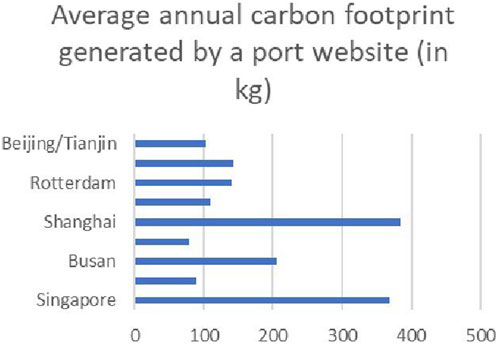
FIGURE 6. Average annual carbon footprint generated by a port’s website (in kilograms).
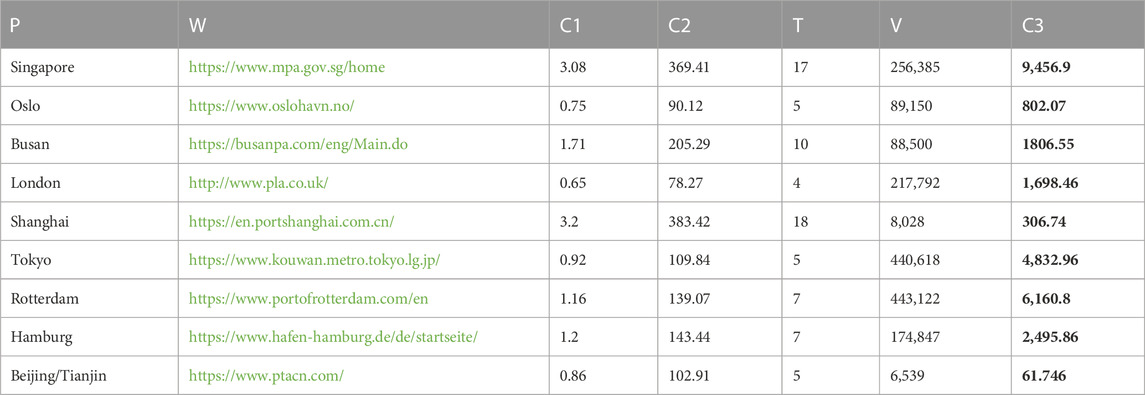
TABLE 1. The actual carbon footprint generated by a port’s website. P, Port; C1, Amount of CO2 generated by a single visit to a website (in g); C2, Amount of CO2 generated during the year when visiting the website on average 10,000 times a month (in kg); T, Number of new trees needed to eliminate the CO2 generated annually by the website; W, Number of new trees needed to eliminate the CO2 generated annually by the website; V, Number of visits in August 2022; C3, Actual amount of CO2 generated during the year with website traffic at the August 2022 level.
The table above shows a significant discrepancy between the amount of CO2 emitted into the atmosphere by visiting a given website determined by the Website Calculator Carbon and the actual load on specific websites. However, there is not much discrepancy when it comes to the order in the ranking of the amount of pollutant emitted. The websites that generate the greatest load on the environment are as follows (in order): Singapore, Busan and Rotterdam, while due to the number of views, the “most contaminated” pages are the websites of ports in Singapore, Rotterdam and Tokyo (see Figure 7).
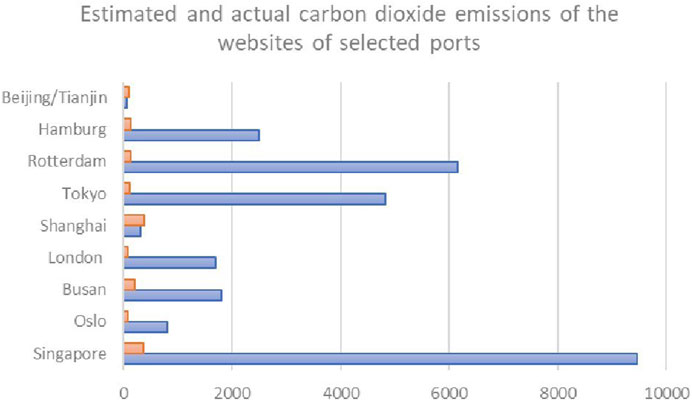
FIGURE 7. Estimated (in orange) and actual (in blue) carbon dioxide emissions of the websites of selected ports.
It is worth noting that the ports that are considered to be the most technologically developed, including due to work on tools aiming to reduce greenhouse gas emissions, do not pay proper attention to solutions that reduce the amount of carbon dioxide generated by their websites. In addition, it is interesting that the two ports that have been identified as the most environmentally harmful ports in Europe (Hamburg and Rotterdam) are simultaneously among the most technologically advanced and environmentally aware. In other words it means that the authors wanted to emphasize that the overall impact of the use of new technologies on the state of the climate is not studied, the benefits are taken into account first of all, while it is not taken into account whether the mechanism itself (saving shipping emissions) generates a burden on the climate. In the report we have very advanced solutions, while already such a basic element as a website is not created in an environmentally “economical” way. These data are derived from reports, not from our calculations. This is an interesting situation worth noting, while the explanation of the reason is beyond the matter of the article.
Of course, the load generated by individual port websites is a drop in the ocean when it comes to the amount of carbon dioxide emitted by ports. This does not mean, however, that this source should be ignored. For example, the use of a greener energy source or a more transparent structure of the website would allow to reduce emissions in a fairly easy and low-cost way.
The digitalization of ports and the use of new technologies bring many benefits, making maritime transport more efficient, while ensuring that it has the least negative impact on the environment. However, it should be kept in mind that new technologies based on the use of the Internet are also energy-intensive and generate a carbon footprint. Being aware of this fact can contribute to noticing the sources of the threat and minimize the negative effects of using the Internet.
The carbon footprint generation of websites analysed in the article is an exemplification of a broader problem. The authors are aware of the fact that in maritime transport the use of seaport websites is not a priority. The amount of information contained on individual pages varies and for some ports individual terminals have separate pages. In the forwarding process, one of the main tools are emails and tools created by individual ship owners (e.g., Tango). The size of the carbon footprint generated by port websites is therefore only a fraction of the carbon footprint of digital instruments used in maritime transport. The choice of websites to conduct research only allowed to indicate the existing problem.
Although the scale of pollution generated by websites is much smaller than that generated by individual ports, it is worth being aware that digital tools are also responsible for carbon dioxide emissions. Based on the research, it can be concluded that the websites of seaports generate significant amounts of carbon dioxide into the atmosphere. This applies both to ports that are considered the “most contaminated” in Europe, as well as those that are considered technologically advanced and striving for climate neutrality. This problem is not sufficiently taken into account at the level of climate policy. Clean transport is a goal outlined by both the UN and the European Union. The same applies to the digitalisation of the economy, including maritime transport. However, there are no references to the sustainable use of digital devices that are not climate neutral, which is a significant dissonance between the above organisations’ goals. As a result of this study, authors formulated recommendations and paths that should be followed. First, programs and policies at the European Union level should pay some attention to the impact that new technologies have on the environment. Secondly, clean energy would also be an adequate response to global challenges. Broadly speaking, changing habits so that they become more environmentally friendly. In the case of the port websites analyzed by the authors of the article, a good path for ports to follow is green website design (minimal loading times, intuitive design, ease of finding key information on the site higher SEO ranking). Reducing the carbon footprint of the website in the case in question can be done if only by keeping the size and weight of the website as low as possible. The aforementioned page weight is influenced by the images placed and the font used.
The purpose of the study was not to question the legitimacy of the development of the Internet and new technologies but raise awareness and encourage more eco-friendly approaches among politicians, entrepreneurs, including the web design industry, but also individual users. It's about using more energy-saving tools, prudent use of the Internet. Renewable energy sources are also a key issue, without them new technologies are not able to ensure climate neutrality. Unfortunately, the research does not cover the whole use of the Internet by the maritime sector, but only focuses on the websites of the selecte seaports. In the future, it would be worth examining the real impact on the climate of maritime transport taking into account emissions of the CO2 generated by new technologies used in this sector.
The original contributions presented in the study are included in the article/Supplementary Material, further inquiries can be directed to the corresponding author.
All authors listed (MB and AP) have made a substantial, direct, and intellectual contribution to the work and approved it for publication.
The authors declare that the research was conducted in the absence of any commercial or financial relationships that could be construed as a potential conflict of interest.
All claims expressed in this article are solely those of the authors and do not necessarily represent those of their affiliated organizations, or those of the publisher, the editors and the reviewers. Any product that may be evaluated in this article, or claim that may be made by its manufacturer, is not guaranteed or endorsed by the publisher.
Artificial Intelligence Act (2021). Proposal for a regulation 2021, proposal for a regulation of the European Parliament and of the Council laying down harmonised rules on the artificial intelligence (Artificial Intelligence Act) and amending certain Union legislative acts, COM/2021/206 final. Available at: https://eur-lex.europa.eu/legal-content/EN/TXT/?uri=celex%3A52021PC0206.
Bergqvist, R., and Monios, J. (2019). Green ports in theory and practice. Inland Seaside Sustain. Transp. Strategies 17, 1. doi:10.1016/B978-0-12-814054-3.00001-3
Chavanne, X., Schinella, S., Marquet, D., Frangi, J. P., and Le Masson, S. (2015). Electricity Consumption of telecommunication equipment to achieve a telemeeting. Appl. Energy 137, 273–281. doi:10.1016/j.apenergy.2014.10.027
Czermański, E. (2019). Morska żegluga kontenerowa a zrównoważony rozwój transportu. Gdańsk: Wydawnictwo Instytutu i Transportu Morskiego Uniwersytetu Gdańskiego, 55–58.
Digital, Scamper Ltd (2022). Available at: https://www.websitecarbon.com/ (Accessed September 23, 2022).
Erdmann, L., and Hilty, L. M. (2010). Scenario analysis; exploring the macroeconomic impacts of information and communication technologies on greenhouse gas emissions. J. Ind. Econ. 14, 826–843. doi:10.1111/j.1530-9290.2010.00277.x
European Commission (2022). Available at: https://ec.europa.eu/info/strategy/priorities-2019-2024/european-green-deal_en (Accessed September 22, 2022).
European Economic and Social Committee (2021). Opinion of the European Economic and Social Committee on Proposal for a Regulation of the European Parliament and of the Council laying down harmonised rules on artificial intelligence (Artificial Intelligence Act) and amending certain union legislative acts (COM(2021) 206 final—2021/106 (COD)), EESC 2021/02482. OJ C. 517, 61–66.
European Environment Agency (2021). European maritime transport environmental report 2021. Available at: https://www.eea.europa.eu/publications/maritime-transport/ (Accessed September 17, 2022).
European Environment Agency. (2021). European maritime transport environmental report 2021. - facts and figures. Available at: https://www.eea.europa.eu/publications/maritime-transport/emter-facts-and-figures/emter-facts-and-figures-pl.pdf/view[Accessed September 17, 2022].
European Parliament (2022). Available at: https://www.europarl.europa.eu/news/en/headlines/society/20180703STO07129/eu-responses-to-climate-change (Accessed August 31, 2022).
European Parliament (2022). Available at: https://www.europarl.europa.eu/news/pl/headlines/society/20190313STO31218/emisje-co2-z-samochodow-fakty-i-liczby-infografiki (Accessed September 10, 2022).
Greenhouse Gas Protocol (2022). A corporate accounting and reporting standard. Available at: https://ghgprotocol.org/corporate-standard (Accessed September 10, 2022).
Greenhouse (2022). Greenhouse gas Protocol. Available at: https://quantis-suite.com/Scope-3-Evaluator/ (Accessed September 21, 2022).
Guerrero-ibanez, J. A., Zeadally, S., and Contreras-Castillo, J. (2015). Integration challenges of intelligent transportation systems with connected vehicle, cloud computing, and internet of things technologies. IEEE Wirel. Commun. 22 (6), 122–128. doi:10.1109/mwc.2015.7368833
Hamdi, H., Sbia, R., and Shahbaz, M. (2014). The nexus between electricity consumption and economic growth in Bahrain. Econ. Model. 38, 227–237. Available at: https://www.weforum.org/agenda/2021/10/global-shortagof-shipping-containers/.
Ishida, H. (2015). The effect of ICT development on economic growth and energy consumption in Japan. Jpn. Telemat. Inf. 32, 79–88. doi:10.1016/j.tele.2014.04.003
Lam, J. S. L., and Notteboom, T. (2014). The greening of ports: A comparison of port management tools used by leading ports in asia and Europe. Transp. Rev. 34 (2), 169–189. doi:10.1080/01441647.2014.891162
Mathiesen, B. V., Lund, H., Connolly, D., Wenzel, H., Ostergaard, P. A., Moller, B., et al. (2015). Smart Energy Systems for coherent 100% renewable energy and transport solutions. Appl. Energy 145, 139–154. doi:10.1016/j.apenergy.2015.01.075
Moyer, J. D., and Hughes, B. B. (2012). ICTs: Do they contribute to increased carbon emissions?. Technol. Forecast Soc. Change 79, 919–931. doi:10.1016/j.techfore.2011.12.005
Menon Economics, A., and Publication, D. N. V. (2022). The leading maritime Cities of the world 2022. Available at: https://www.dnv.com/maritime/publications/leading-maritime-cities-of-the-world-2022.html (Accessed September 29, 2022).
Ng, A. K. Y., and Song, S. (2010). The environmental impacts of pollutants generated by routine shipping operations on ports. Ocean Coast. Manag. 53, 301–311. doi:10.1016/j.ocecoaman.2010.03.002
Opinion of the European Economic Opinion of the European economic and social committee on the 'proposal for a regulation of the European parliament and of the Council laying down harmonised rules on artificial intelligence (artificial intelligence act) and amending certain union legislative acts' (2021) 206 final - 2021/106 (COD)) EESC 2021/02482, OJ C 517, 22–12.2021,
Oniszczuk-Jastrząbek, A., Pawlowska, B., and Czermanski, E. (2018). Polish sea ports and the Green Port concept. SHS Web Conf., 1. doi:10.1051/shsconf/20185701023
Opinion of the European (2022). Opinion of the European Committee of the Regions—European approach to artificial intelligence—Artificial Intelligence Act (revised opinion), COR 2021/02682, OJ C 97, 60–85.
Ozcan, B., and Apergis, N. (2018). The impact of internet use on air pollution: Evidence from emerging countries. Environ. Sci. Pollut. Res. 25, 4174–4189. doi:10.1007/s11356-017-0825-1
Pamlin, D., and Pahlman, S. (2008). Outline for the first global IT strategy for CO2 reductions. A billion tons of CO2 reductions and beyond through transformative change. China: WWF Sweden.
Proposal for a regulation 2021, Proposal for a regulation of the European Parliament and of the Council laying down harmonised rules on the artificial intelligence (Artificial Intelligence Act) and amending certain Union legislative acts, COM/2021/206 final
Salahuddin, M., and Alam, K. (2015). Internet usage, electricity consumption and economic growth in Australia, A time series evidence. Telematics Inf. 32, 862–878. doi:10.1016/j.tele.2015.04.011
SimilarWeb (2022). SimilarWeb. Available at: https://pro.similarweb.com/#/digitalsuite/home (Accessed September 23, 2022).
Stefaniak, P. (2022). Co porty mogą zrobić na rzecz ochrony klimatu. Available at: https://intermodalnews.pl/2022/02/02/co-porty-moga-zrobic-na-rzecz-ochrony-klimatu/ (Accessed September 28, 2022).
The High-Level Expert Group on AI (2019). Ethics guidelines for trustworthy AI. Available at: https://www.europarl.europa.eu/meetdocs/2014_2019/plmrep/COMMITTEES/JURI/DV/2019/11-06/Ethics-guidelines-AI_PL.pdf.
Toffel, M. W., and Horvath, A. (2004). Environmental implications of wireless technologies: News delivery and business meetings. Environ. Sci. Technol. 38, 2961–2970. doi:10.1021/es035035o
UNESCAP (2021). Smart port development policies in Asia and the Pacific. Available at: https://www.unescap.org/sites/default/d8files/event-documents/SmartPortDevelopment_Feb2021.pdf (Accessed September 1, 2022).
United Nations (2022). Available at: https://sdgs.un.org/ (Accessed September 20, 2022).
Wang, J., and Xu, Y. (2021). Internet usage, human capital and CO2 emissions: A global perspective. Sustainability 13, 8268. doi:10.3390/su13158268
We Are Social Ltd (2022). Digital 2022 july global statshot report. Available at: https://wearesocial.com/us/blog/2022/07/the-global-state-of-digital-in-july-2022/ (Accessed October 2, 2022).9 - 19
Wissner, M. (2011). The smart grid – A saucerful of secrets?. Appl. Energy 88, 2509–2518. doi:10.1016/j.apenergy.2011.01.042
Xu, L., Di, Z. J., and Chen, J. H. (2021a). Evolutionary game of inland shipping pollution control under government co-supervision. Mar. Pollut. Bull. 171 (2021), 112730. Article 112730. doi:10.1016/j.marpolbul.2021.112730
Xu, L., Yang, Z., Chen, J., and Zou, Z. (2021b). Evolutionary game analysis on supply side of the implement shore-to-ship electricity Ocean Coast. Ocean Coast. Manag. 215 (4), 105926. doi:10.1016/j.ocecoaman.2021.105926
Xu, L., Yang, Z., Chen, J., and Zou, Z. (2023). Impacts of the COVID-19 epidemic on carbon emissions from international shipping. Mar. Pollut. Bull. 189, 114730. doi:10.1016/j.marpolbul.2023.114730
Keywords: green ports, carbon footprint, new technologies, pollution, environment
Citation: Bielenia M and Podolska A (2023) Carbon footprint generated by individual port websites. The missing idea in the concept of green ports. Front. Environ. Sci. 11:1211454. doi: 10.3389/fenvs.2023.1211454
Received: 24 April 2023; Accepted: 17 August 2023;
Published: 31 August 2023.
Edited by:
Artur Badyda, Warsaw University of Technology, PolandReviewed by:
Nitin Agarwala, National Maritime Foundation, IndiaCopyright © 2023 Bielenia and Podolska. This is an open-access article distributed under the terms of the Creative Commons Attribution License (CC BY). The use, distribution or reproduction in other forums is permitted, provided the original author(s) and the copyright owner(s) are credited and that the original publication in this journal is cited, in accordance with accepted academic practice. No use, distribution or reproduction is permitted which does not comply with these terms.
*Correspondence: Małgorzata Bielenia, bWFsZ29yemF0YS5iaWVsZW5pYUB1Zy5lZHUucGw=
Disclaimer: All claims expressed in this article are solely those of the authors and do not necessarily represent those of their affiliated organizations, or those of the publisher, the editors and the reviewers. Any product that may be evaluated in this article or claim that may be made by its manufacturer is not guaranteed or endorsed by the publisher.
Research integrity at Frontiers
Learn more about the work of our research integrity team to safeguard the quality of each article we publish.