 Hannah S. Rabinowitz
 Sophia Dahodwala
 Sophie Baur
 Alison Delgado
95% of researchers rate our articles as excellent or good
Learn more about the work of our research integrity team to safeguard the quality of each article we publish.
Find out more
ORIGINAL RESEARCH article
Front. Environ. Sci. , 02 November 2023
Sec. Interdisciplinary Climate Studies
Volume 11 - 2023 | https://doi.org/10.3389/fenvs.2023.1206039
This article is part of the Research Topic Innovations in Climate Resilience View all 6 articles
In recent years, incorporating climate change considerations has become an important focus of organizations’ resilience planning and risk assessment efforts, including United States federal agencies. This has led to an increasing demand for higher-resolution and higher-quality climate projection information that is easy to understand for non-expert users. In particular, there is a demand for information about how climate change may affect high-impact, low-frequency (HILF) hazards that are central to risk assessments focused on infrastructure. While national-level resources like the National Climate Assessment provide information on climate impacts for different sectors and regions in the United States, downscaled information with location-specific context is often required for site-level resilience planning. As higher-resolution and higher-quality climate resources continue to be developed at the state level, it is imperative to understand ongoing and planned efforts, as well as key drivers for developing these state-level resources. Based primarily on stakeholder input from climate experts from 31 states, we identify key state-level climate resources, as well as drivers accelerating the development of these resources. We assess the availability of climate change resources, specifically those with information about HILF events that have been developed at the state level and can support users in conducting site-level resilience planning. We identify three key drivers or predictors for the development of climate change resources at the state level: (1) existence of state laws, mandates, Executive Orders, and other state policies, (2) existence of university partnerships; and (3) the makeup of the stakeholder groups (in terms of dominant discipline/expertise) participating in the effort. The diverse state strategies and resources surveyed in this study could support the incorporation of higher-resolution climate information into site-level planning.
The impacts of climate change undermine the resilience and sustainability of infrastructure and operations at global, national, regional, and local scales. As governments, organizations, and communities continue to witness extreme weather and climate impacts, they are increasingly concerned with assessing and strengthening the resilience of their infrastructure and operations to these impacts. One of the key requirements for effectively incorporating climate change considerations into local-level planning and assessments is access to high-quality climate information, including climate change projections. However, significant challenges exist for organizations and communities working to incorporate this data into their local-level or site-level resilience planning efforts. Here, we identify and evaluate the availability of climate assessment resources and tools that can be used to assist organizations in incorporating climate change considerations into site-level resilience planning. We present examples of tools developed to guide federal facilities through the resilience planning process and discuss how these tools incorporate climate change data. We provide an overview of climate change projections and available climate resources, drawing from a literature review of existing resources as well as insights from surveys and interviews with key stakeholders, including authors of state-level climate reports and state climatologists. These types of resources are sometimes referred to as “climate services” (Findlater, Webber et al., 2021), however, we use the term climate projection resources to more specifically refer to sources of information that can be directly used by site-level resilience planners. Finally, we discuss the landscape of available resources across the United States, including the different types of resources and drivers of resource development.
While there is an extensive literature of studies that have produced higher-resolution projections for sub-national regions and states (e.g., Gao et al., 2012; Komurcu, Emanuel et al., 2018; Liess, Twine et al., 2022), these remain largely isolated efforts for particular states or regions and are generally technical rather than geared towards non-technical users looking for information about how high impact low frequency events may change as a result of climate change. Some efforts have worked to identify user-friendly resources for limited regions in the United States [e.g., the Western US (Vano and Lukas, 2022)]. Other resources, such as the National Climate Assessment (NCA) provide high-level overviews of climate change impacts on extreme hazards, such as those evaluated in many infrastructure-focused resilience assessments, at the state level but may not provide enough detail for site-level risk analysis. The goal of this study was to improve our understanding of the current availability of state-level resources across the United States, as well as an understanding of the current existing institutions and processes by which states produce climate resources. This analysis provides insight into the underlying factors driving the availability of resources that help understand and incorporate the impacts of climate change into overall site-level risk assessment and resilience planning efforts.
Climate change has been discussed in the literature as an “emerging risk” which is defined as a risk that is new or has only recently been formally incorporated into risk assessments and where the components of risk are poorly characterized (Graham et al., 2010; Flage and Aven, 2015; Shortridge and Camp, 2019). Emerging risks are associated with significant uncertainty that can make risk characterization challenging (Weaver, Moss et al., 2017). The uncertainties associated with climate projections fall into three main categories: internal variability of the climate system (i.e., how much variability would be expected on a daily, annual, or decadal time scale, even if the system were not changing), model uncertainty (i.e., uncertainties inherent to the climate models being used), and scenario uncertainty (e.g., uncertainty as to whether a climate scenario for greenhouse gas emissions and policy pathways will be realized). These uncertainties become even more significant at granular regional or local scales that are most relevant to resilience planning for policymakers and for organizations (Hawkins and Sutton, 2009; Wilby and Dessai, 2010). In spite of these uncertainties, however, it is important to consider climate change in resilience planning efforts. Without the inclusion of climate change projections, resilience planners must assume stationarity, i.e., the assumption that the climate system will continue to operate within the bounds of the natural variability that have been observed in the past (National Research Council, 1982; Milly, Betancourt et al., 2008). As extreme events like hurricanes and wildfires (Gilford, 2021; United Nations Environment Programme 2022) continue to break records, it is evident that this assumption does not hold (e.g., Clarke, Otto et al., 2022), and that climate change must be considered for effective forward-looking resilience planning.
Strategies for incorporating climate change considerations into resilience planning must address the deep uncertainty associated with these projections. One approach focuses on scenario planning, where the resilience planning team considers a range of different, but still plausible, futures (Mahmoud, Liu et al., 2009). The team can consider whether the organization would meet their criteria of resilience (or avoid unacceptable consequences) if each of the possible futures were realized (Miller, Schuurman et al., 2022). This approach does not formally account for the likelihood of each of these potential future scenarios but allows the planning process to move forward in a way that focuses on providing risk insights to enable decision-making (Weaver, Moss et al., 2017), even when dealing with hazards that are difficult to quantify or subject to significant uncertainty (Star, Rowland et al., 2016). A similar approach, known as decision-scaling (Brown, Ghile et al., 2012), requires the identification of climate conditions relevant to a particular decision, followed by modeling of relevant climate parameters as well as the climate sensitivity of the system of interest. This allows a rough probability to be assigned to the sets of climate scenarios (e.g., problematic or not problematic) corresponding to different decision pathways (e.g., take action or do not take action). However, even this approach cannot fully account for the range of uncertainty associated with climate risk which is particularly important when making large-scale investment decisions. This can be further addressed through the development of robust decision frameworks through which resilience strategies are designed which would be effective over a wide range of possible climate futures. This strategy avoids implementing solutions that are only effective under one possible future (Shortridge and Camp, 2019). Additionally, researchers have promoted developing resilience solutions for climate change using an adaptive planning framework (Marchau et al., 2019). Through this approach, resilience planners develop flexible solutions that can be adjusted over time as the true climate trajectory becomes clearer. When developing solutions, planners can identify key decision points at which adjustments to the planned solution may need to be adopted based on updated information about the climate trajectory that is being realized (Haasnoot, Kwakkel et al., 2013).
For organizations and communities that have adopted a best practices approach to incorporating climate change into their resilience planning, it is still important to contend with difficulties in communicating key technical details to non-experts who are critical contributors to or leaders of the resilience planning process (Weaver, Moss et al., 2017; Infanti, Kirtman et al., 2020). These challenges are essential to overcome for climate change to be effectively incorporated into decision-making at the community or organizational level for infrastructure and operational projects. For example, an ICF International review of state-level transportation department resilience planning efforts highlighted that many departments collaborated with people from partner agencies or academic institutions to provide the required technical expertise for dealing with climate change projections (ICF International, 2016).
Resilience planning has been a key priority for federal agencies for years, leading agencies to develop processes for identifying and addressing critical resilience gaps at their sites. Resilience planning can be enhanced by the application of properly structured risk-informed methodologies which capture key risk drivers using a technically robust and replicable approach. Such methodologies can range between qualitative and quantitative risk assessment and have been applied in a range of tools across the United States government. While some of this resilience planning has considered hazards impacted by climate change, recent policy is driving federal agencies to make climate change impacts a more central component of their resilience planning efforts.
As of June 2023, the Biden Administration has published 13 Executive Orders (E.O.s) aimed at addressing the climate crisis. Notably, E.O. 14008 (The White House, 2021) set forth government-wide requirements for integrating climate considerations into resilience planning. The E.O. emphasized that as part of a government-wide approach, the federal government must play a critical role in assessing and mitigating climate risks in every sector. The E.O. also requires the head of each federal agency to develop, submit, and report annually on a climate action plan that details the agency’s facilities’ climate vulnerability and describe how the agency will adapt to climate change and increase its facility and operational climate resilience. These climate action plans describe steps to bolster adaptation and increase resilience for agency facilities and operations and address climate adaptation capacity building, an updated climate vulnerability assessment, and adaptation criteria in the management of real property, goods, and services. Resilience planning that incorporates high-quality climate data will enable federal agencies and other stakeholders to consider the impacts of climate change and ensure that agencies deploy clean energy technologies, resilient infrastructure, and other land management measures at the site-level. Climate change mitigation actions (i.e., actions to reduce greenhouse gas emissions), although an element of resilience planning, are not specifically considered within this paper (Figure 1). Rather, this paper focuses on resources that support climate adaptation planning.
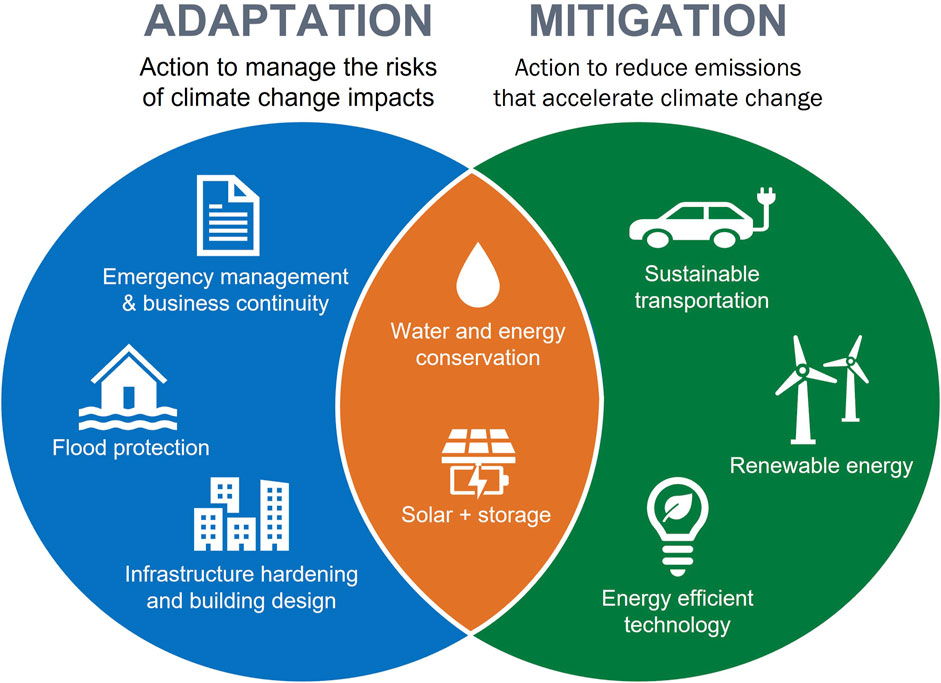
FIGURE 1. Venn diagram showing relationship between climate adaptation and mitigation. Some solutions support either adaptation or mitigation goals, while a subset of solutions can address both. Relevant federal E.O.s that serve as drivers for federal agencies to pursue climate adaptation include E.O.s 14008, 14057, and 14072. A major E.O. driving federal action towards mitigation goals is E.O. 14057.
Below, we describe two examples of resilience planning tools developed for use by federal facilities and discuss how climate change projections are incorporated into these tools. Given the importance of incorporating climate change considerations into risk assessment, these tools have taken different approaches to characterizing and evaluating how climate change may impact the risks faced by a site. However, one common theme is that site-level users for these tools require access to high-quality information about projected climate change impacts for their location in a format that is easy for a non-expert audience to understand.
One example of a relatively qualitative approach to risk-informed resilience planning is the Department of Energy’s (DOE) Vulnerability Assessment and Resilience Plan (VARP), used by DOE sites to conduct required resilience planning for their infrastructure and workforce. The VARP’s primary focus is the risks to a site’s assets (including both infrastructure, such as water and wastewater, energy generation and distribution, IT/telecommunications, and buildings; and personnel) resulting from climate change. It allows sites to identify and plan for a range of disruptive events with a focus on adaptation to climate hazards.
Part of VARP reporting involves conducting a risk assessment for the site using its Risk Assessment Tool. Users can access information about climate change projections for their location and indicate whether the hazard is likely to increase, decrease or not change in frequency relative to the historic hazard frequency as a result of climate change. The tool uses order-of-magnitude categories to characterize hazard frequency and shifts the frequency estimate as indicated by the user, which allows the tool to provide the user with a rough approximation of the frequency of each evaluated hazard under a climate change scenario. If the user can find specific projections of hazard frequency under a climate scenario of interest, they are able to use that information as a direct input. In many situations, however, these types of quantitative projections reflecting the projected frequency and severity of a specific hazard relevant to a site under climate change scenarios are unavailable. In these cases, the rough order-of-magnitude shift relative to historical data may be the best available approach to characterizing the hazard frequency without assuming stationarity under climate change (Rabinowitz et al., 2022).
Another example of a resilience planning tool developed for the federal government is the Federal Energy Management Program’s (FEMP) Technical Resilience Navigator (TRN) tool (Federal Energy Management Program, 2022; Rabinowitz et al., 2023). This tool was developed for use by federal sites to help them through the resilience planning process for their energy and water systems, though it is available for use by other organizations as well. Though the TRN does not have an explicit focus on climate resilience planning, the tool provides the ability for users to evaluate risk in response to a range of climate scenarios.
The TRN takes a semi-quantitative risk-informed approach to energy and water resilience planning (Unwin et al., 2020; Rabinowitz et al., 2023). This methodology allows quantification of vulnerability and consequence but uses a more data-driven approach and uses a different hazard characterization strategy than the VARP tool. In the TRN, hazards can be characterized either as “grouped hazards” which are outages of energy or water supply systems regardless of the specific cause, or “dual-impact hazards,” which are hazards that have the potential to impact both off-site supply of energy or water as well as on-site redundant energy or water systems. To identify frequency estimates for natural hazards that can be included as dual-impact hazards in a TRN assessment, users are provided a resource called the “Identify Potential Hazards Tool.” This tool provides a list of relevant hazards with county-level hazard frequency estimates based on the Federal Emergency Management Agency’s (FEMA) National Risk Index (NRI) dataset. Though the average TRN user incorporates hazards into their risk analysis based on historical data, such as that provided based on the NRI, they are encouraged to use the sensitivity analysis functionality of the tool to explore the effect that climate change could have on the risks faced by their site (Delgado and Rabinowitz, 2021; Rabinowitz et al., 2022) Like in the VARP, users must have access to relevant climate change projections to decide on the sensitivity cases that they wish to evaluate.
Resilience planning tools, such as those described above, provide a mechanism for users to incorporate climate change considerations into their planning processes. However, the key requirement for this incorporation to be successful is access to high-resolution climate data that provides insight into expectations for how climate change may impact the area where a site is located (OSTP, 2023). Access to high-resolution climate change projection data is required for users of tools such as the VARP and TRN, to effectively incorporate climate change considerations into risk assessments and resilience planning. There are three major sources of climate projections that have been widely used by decision makers: 1) global-scale climate evaluations from the Climate Model Intercomparison Project (CMIP); 2) regional-scale dynamic downscaled models; and 3) empirical statistical downscaling models. CMIP is an international effort that generates output from a large ensemble of climate models to estimate likely climate change impacts at global, continental, and broad regional scales. The most recent NCA (USGCRP, 2018) used CMIP Phase 5 (CMIP5) simulations which were primarily performed with models that have a resolution of 100 km or more (Kotamarthi et al., 2016)—too coarse for state- or local-level climate impact analyses. While these models can produce mean temperature changes at regional scales, as well as mean precipitation (albeit with less confidence), due to their coarse spatial resolution, they are not able to capture features of the climate that are influenced by processes or physical features of the earth system that operate at smaller spatial scales (Kotamarthi et al., 2016; Klein, Jackson et al., 2021). Examples include variability of precipitation, tornadoes, thunderstorms, and other similar severe weather events.
As a result of the limitations from using data from these larger-scale resources, many analysts and planners who are assessing climate changes in their region or state look to downscaled climate data. There are broadly two main methods used to arrive at higher-resolution climate model projections: dynamical and statistical downscaling. Dynamical downscaling uses a limited-area, high-resolution model to simulate climate processes at a regional scale. Statistical downscaling captures historical relationships between large-scale weather features and local climate and uses these relationships to translate future projections down to the scale of individual weather stations, as well as the regular grid cells of the model. Both methods present trade-offs. Dynamical downscaling can provide simulations of impacts that are not adequately captured by statistical downscaling (e.g., extreme wind and extreme humidity), but this method requires much larger computational requirements (Hamlet, Byun et al., 2020). These computational requirements often limit this type of downscaling to using a single large-scale climate forcing scenario, meaning that it does not accommodate evaluating uncertainty as easily as statistical downscaling. This also means that dynamical downscaling is often more expensive than statistical downscaling. The latest NCA (USGCRP, 2018) used downscaling methods to provide climate change projections for eight U.S. regions, but these projections are also often presented at too coarse a resolution for the purpose of helping to inform site-level decision making. As an example, in-state differences in temperature at higher elevations (e.g., Olympic Mountains in Washington State) are not highlighted. The U.S. Global Change Research Program (USGCRP), which produces the NCA, recently introduced state climate summaries which will help address this gap. However, overall, NCA resources do not always provide a nuanced discussion of sub-state and local differences in how extreme hazards, such as those evaluated in many infrastructure-focused resilience assessments, may change as a result of climate change.
In this paper, we discuss the availability of resources developed at the state level to fill this gap.
While climate change projection resources are readily available in the U.S. at the national and regional level (OSTP, 2023), it can be difficult for sites conducting risk assessments to find climate change projection information at a finer geographic scale. To assess the availability of such resources, we conducted a survey of climate change resources at the state level. Specifically, we looked for resources that would allow site-level resilience planners to identify their potential local climate change impacts based on finer-scale analysis than is available from national- or regional-scale climate change projection resources.
As part of this study, we considered the two common downscaling approaches described earlier: statistical and dynamical downscaling. Dynamical downscaling uses regional climate models with a resolution of 20–60 km which are driven by global climate model output or reanalysis data to generate regionalized climate information (Giorgi, 1990; Mass, Ovens et al., 2002; Wang, Leung et al., 2004; Rockel, 2015; Tang, Niu et al., 2016). With statistical downscaling, researchers draw statistical relationships from large-scale climate variables to predict local climate variables (Salathe, Mote et al., 2007; Fan, Chen et al., 2013).
To identify resources relevant for site-level risk assessment and resilience planning, we conducted an assessment of state-level climate change resources in two stages (Figure 2).
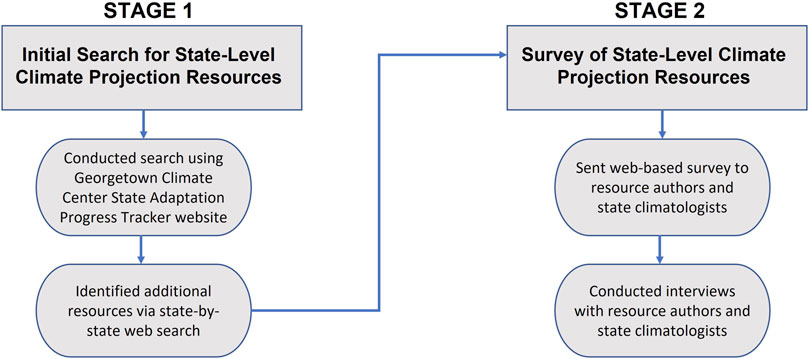
FIGURE 2. Flow chart showing two-stage approach to data collection. The first stage focused on identifying climate change resources through web searches. The second stage focused on gathering stakeholder feedback through a survey and interviews.
First, we conducted an initial search for resources available at the state level that contain information about climate change projections. The main tool used for this initial screening was the Georgetown Climate Center’s State Adaptation Progress Tracker (Georgetown Climate Center, 2022). This website, published in 2015, contains a summary of climate change related policies and reports for each state and the District of Columbia (D.C.), with a focus on climate adaptation. The compilation primarily tracked climate change laws and policies, state plans, and local/regional plans in each state (Ray and Grannis, 2015). Therefore, the State Adaptation Progress Tracker’s focus is broader than documenting climate change projections to support resilience planning. Listed resources include policy documents and documents related to climate change topics such as decarbonization and identification of adaptation solutions. Though 42 states had state-level or local climate change resources available on the website, only about 30 had resources that explicitly discuss how climate change is likely to impact hazards. Indeed, in their analysis of state-level policies documented in the State Adaptation Progress Tracker, Ray and Grannis (2015) observed that these policies were less focused on the “Emergency Preparedness” sector than other sectors. This leaves a gap for organizations within the state that are working to incorporate climate change into their resilience planning and need access to information about how hazards impacting infrastructure at their site may change in frequency or severity due to climate change.
The tracker was regularly maintained for 2 years after initial publication (Ray and Grannis, 2015), though the website was recently refreshed in January. Climate adaptation and the development of resources to support it is a rapidly evolving area of policy and research where states that may not have had state-level climate projection resources several years ago could have developed or could be actively working to develop such resources now. As a result, we supplemented the review of the State Adaptation Progress Tracker by conducting a state-by-state search for climate plans, assessments, and other resources that may include climate change projections or describe climate impacts in a state.
To gather more up-to-date information about progress in developing state-level climate change resources, we created a web-based survey using the Survey Monkey platform to elicit information about the status of efforts related to climate projections for each state for the high-impact, low-frequency (HILF) hazards defined in the NRI dataset (Supplementary Material S1). This survey was geared toward understanding whether the state has conducted state-level downscaling (and if so, what type of downscaling) and whether the state has developed resources with this information. Additionally, we asked whether there were any such resources in development. The goal was to identify additional state-level climate projection resources that we had not found through our web search (including our review of the State Adaptation Progress Tracker), as well as to identify whether there had been or were planned to be any updates to existing resources.
We conducted our outreach using two strategies. First, we sent the survey to authors of existing resources. In case some of these authors were not currently involved in the development of climate change resources for that state, we also contacted the state climatologist of each U.S. state to ensure that we were collecting the most up-to-date information. For several states in this category, we determined that additional insight could be obtained through an interview, so in some cases, multiple forms of data gathering were used. In addition, we gathered information on states with no identified resources using an alternative approach. We determined that the survey was not relevant in the absence of an existing resource, since the questions were primarily targeted toward characterizing information and the type of downscaling analysis used in a pre-existing resource. Therefore, in these cases, we reached out to the applicable state climatologist to check the existence of other resources not captured by our initial search. During all interviews, we discussed how the state drives the development of resources and communication to stakeholders of information on climate change impacts on hazards. Between the survey, email conversations, and interviews, we received feedback from 31 states (Table 1). This total includes some survey responses that were incomplete (i.e., the respondent did not click “Submit”) or were submitted but left the majority of the questions unanswered. However, even in these cases, the survey responses were able to inform part of the analysis.
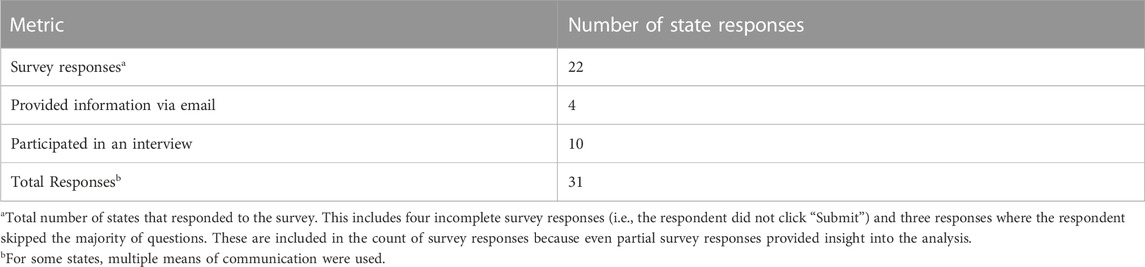
TABLE 1. Summary of responses to requests for information on climate change projection resources.
Based on the information collected through the desk review, survey, and interviews, we compiled a list of relevant and applicable climate change resources that could be useful to an organization or community undertaking a resilience planning or risk assessment process within a state. Resources included in this paper are based heavily on survey and interview feedback; we have supplemented these identified resources with additional findings from a desk review, but we have not provided a comprehensive list of all state-level climate change resources that are available. Instead, this paper is intended to identify key resources used by state officials, along with additional context about how these resources have been developed and what kinds of information they provide.
We considered only resources that provide information about how climate change may impact hazards experienced within the state. In other words, we did not include climate mitigation resources, plans, or strategies that lacked this type of information (e.g., strategies for reducing greenhouse gas emissions within the state, Figure 1.) Additionally, resources that explicitly contradict the findings from the NCA and established climate science consensus (e.g., IPCC assessments, WMO reports, etc.) were not included.
In the review, we identified multiple types of resources, including reports, tools, model outputs and datasets. While all of these fall under the category of “resources,” we primarily focus on reports and tools that are targeted toward non-expert users. This is because our goal in compiling climate change resources is to identify resources that are useful to personnel at a site who are conducting a resilience or risk assessment. While some organizations may have access to climate scientists who have the expertise to interpret technical data such as climate model results, we assume that many organizations do not and thus require information that has already been interpreted from model results. Therefore, the primary focus of this analysis is not whether states have conducted their own modeling (though we do identify where that is the case), but rather whether states have produced resources that interpret climate change projection data in the context of how climate change may impact the hazards to which the state (and therefore a site within the state) is exposed. In some cases, survey responses indicated a strategy for obtaining data for climate projection resources that differed from the strategy identified within those resources. This disconnect was often associated with the survey response including resources that were not aligned with the type of analysis that supports climate adaptation planning as described above. In our analysis of the modeling approach, we considered the approach described in the identified climate projection resource to be the one that supported climate hazard projections. Additionally, where state-specific resources were not available, some regional assessments have been conducted that offer more detailed information into potential climate change impacts than are available in the NCA report. These resources were also included in our analysis.
Finally, through both the survey and interviews, we identified key factors driving the development and availability of climate resources at the state-level. Understanding how these drivers differ between states is important as it impacts the type, availability, and granularity of climate change projections (e.g., changes in temperature and precipitation means and extremes versus changes in the characteristics of extreme hazards) as well as the capacity available for both developing and coordinating the development of resources. Additionally, it can provide insight for state policymakers as to what types of policy drivers and stakeholders are important for developing climate change resources that can be used for site-level resilience planning within their state.
The review of available resources for all 50 states and DC on climate change showed that approximately 71 percent (35 states and DC, 36 in total) have state-level plans, assessments, analyses, tools or other resources (Figure 3). Of the states that have developed state-level resources, 89 percent (32) include the discussion of high-resolution previously downscaled data or original modeled data at the state level.
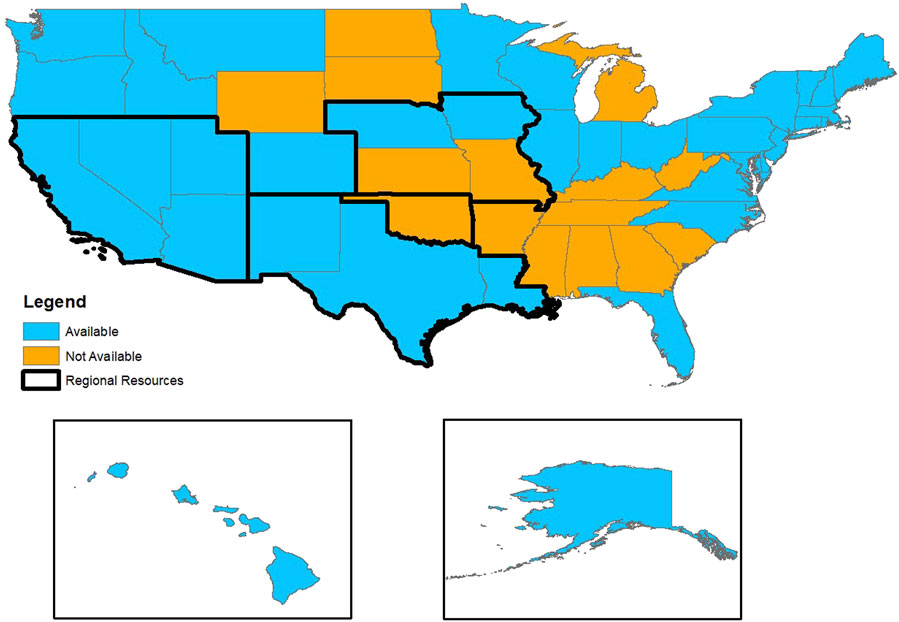
FIGURE 3. Map of the United States showing states that have state-level climate change resources available (blue) and states that do not have such resources (orange). Note that Tennessee and Wyoming are in the process of developing climate change resources. Regional resources that provide information about climate change impacts on hazards for multiple states are indicated in thick black outline. The regional resources highlighted here are the Southwest Climate Adaptation Science Center factsheets, the South Central Climate Adaptation Science Center report, and the Climate in the Heartland report. Note that for the Climate in the Heartland report, climate change impacts are discussed for five example cities: Iowa City, IA; Lincoln, NE; Lawrence, KS; Columbia, MO; Oklahoma City, OK. (Map made using ESRI ArcMap software.)
Regional assessments such as those found in the NCA may be sufficient for some states while others may considerably benefit from state-level analyses to accurately evaluate climate change impacts. For example, it is possible that some Midwestern states are affected by similar impacts that can be sufficiently examined at a regional level. On the other hand, our interviews identified that the impacts of climate change on Florida are so particular, due to factors such as the strong marine impact on the state’s climate, that a state-level or finer-scale analysis significantly improves the accuracy and relevancy of the assessment and is greatly preferable to a regional analysis. In the review of available climate change resources (Supplementary Material S2), it was found that 35 states and DC (36 total) have state-level resources, 32 of which included discussion at the state level of high-resolution previously downscaled data from existing sources (e.g., Localized Constructed Analogs (LOCA) or Multivariate Adaptive Constructed Analogs (MACA)) or data from new downscaled modeling. States that incorporated the state-level discussion of downscaled data in a resource were included in this total regardless of the extent to which these climate projections were discussed. Some state resources included comprehensive analyses of downscaled data, while others included only a brief discussion limited to less than a page of text. The type of downscaled data used and other relevant notes are included in the table in Supplementary Material S2.
For states that used high resolution downscaled projections, the statistical downscaling method alone was used by 20 states and DC (21 total), while a combination of statistical and dynamical methods (either within one resource or with different methods used for different resources within that state) was used for 10 states (Figure 4). The dynamical downscaling method alone was not used for any of the states and an unknown method was used for one state. The majority of the states included in this total did not produce original projections, but instead performed state-level analyses of existing downscaled datasets, such as the LOCA and MACA datasets, as discussed above. The Cal-Adapt climate data web tool, for example, combines a new analysis of LOCA downscaled data with additional dynamically downscaled data to support analyses for California’s Fourth Climate Change Assessment.
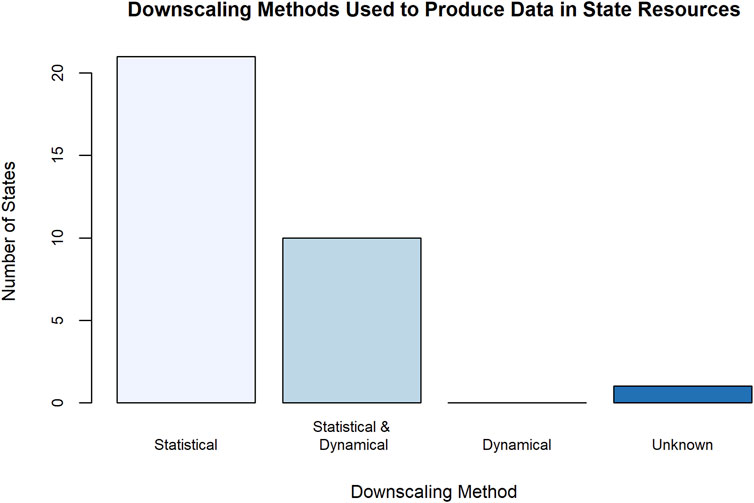
FIGURE 4. Bar graph of the number of states (including DC) with resources discussing high-resolution downscaled data that were produced by different downscaling methods: statistical (21), statistical and dynamical (10), dynamical (0), or unknown methods (1).
The four states with resources that do not contain state-level downscaled data discuss regional projections, such as those provided in the NCA, or extrapolation from historical climate trends rather than high resolution downscaled data. In addition to the state-level resources, three regional resources were found that cover 12 states in total. Of the 15 states that do not have state-level resources, 3 are included in one of these regional resources (Figure 3). The Climate in the Heartland report (Anderson et al., 2015), for example, examines the impacts of climate change in the Great Plains region and provides city-level, but not state-level, statistically downscaled climate projections for five different cities across Iowa, Missouri, Nebraska, Kansas, and Oklahoma (Figure 3). Information for states that do not have state-level resources can still be found in the NCA report (USGCRP, 2017) as discussed above. National web tools and mesonet-type systems can also provide useful data for states that lack sufficient state-level resources and are described in more depth in the next section. A recent web guide published by the Aspen Global Change Institute also provides a portal to search for climate change resources in the Mountain West states (Vano and Lukas, 2022).
The majority of the state resources considered in this review describe anticipated changes in hazard frequency and severity as a result of climate change at the state level, as well as possible mitigation and adaptation strategies, although few states have performed comprehensive vulnerability assessments or examined impacts to infrastructure extensively. Additionally, many focus on hazards such as drought and heat waves and do not thoroughly examine other HILF hazards other than to say that they are likely to change in frequency. These types of hazards are important for site-level risk and resilience assessments focused on infrastructure impacts as described above. An example of a resource that does examine impacts of changing hazards on infrastructure in detail is New York state’s Responding to Climate Change in New York State (ClimAID) report (Rosenzweig et al., 2011), which investigates projected changes in temperature, precipitation, and hazards such as flooding, ice storms, and coastal storms and dedicates multiple chapters to discussing consequences of climate change and adaptation strategies for eight sectors. This resource provides quantitative projections for some of these hazards and qualitative projections for others, depending on the available models and data.
Although this paper’s focus is on resources that have been developed at the state level and include local context about downscaled climate projections and the impacts of HILF hazards, there are several national developed web tools and other resources that may be used to supplement state resources, particularly for those states that do not have existing resources. In this section, some examples of these resources are discussed; however, there exist additional resources outside of the following examples that may be used to provide higher-resolution climate projections or other forms of climate change data.
In addition to national climate change data provided by the Fourth NCA report, there are several resources, specifically web-based tools, that may be used to assess the impact of climate change on hazard characteristics for locations across the United States. The federal Climate Mapping for Resilience and Adaptation website (USGCRP, 2022), for example, features an assessment tool that examines future climate conditions of user-inputted locations, with the intention of assisting sites with developing climate resilience plans and improving local infrastructure resilience. After the user has inputted their location, the tool provides early-, mid-, and late-century projections for temperature, precipitation, and sea level rise conditions related to extreme heat, drought, wildfire, flooding, and coastal inundation. These results are communicated through charts, tables, and interactive maps showing changes in precipitation and temperature under RCP 4.5 and 8.5.
The Climate Toolbox website (University of California Merced, 2022) operates similarly, providing a variety of web tools with historical and projected climate information such as climate projection maps, plots, and dashboards. Fire danger and drought projections are included. Some tools also specialize in specific hazards, such as those provided by NOAA, which look primarily at flooding. The Coastal Flood Exposure Mapper (Office for Coastal Management, 2022), for example, has map layers available to examine the impacts of coastal flooding, tsunamis, storm surges, and sea level rise. Users can also use this tool to look at the exposure of infrastructure development and critical facilities to hazards.
The National Aeronautics and Space Administration’s Socioeconomic Data and Applications Center (SEDAC) has also developed a U.S. Climate Risk Projections by County, 2040–2049 data set (Kc et al., 2021) which provides county-level climate risk projection data for the contiguous U.S, including exposure information for built infrastructure. This data is available to download and additionally presented in map format, allowing users to assess the climate change-informed hazard exposure level at their site.
The Department of Defense (DOD) has also developed an online climate exposure and resilience planning tool to assess the impact of a changing climate on its operations and installations (accessible by DOD Common Access Card holders only). The Defense Climate Assessment Tool (DCAT), launched in 2021 and originally developed by the U.S. Army Corps of Engineers, leverages nationally consistent data to provide screening-level assessments of climate exposure and sensitivity across DOD’s over 5,000 sites worldwide (Department of Defense, 2021; Vergun, 2021). While the tool does not evaluate the consequence component of risk, only climate exposure and sensitivity, it is enhancing the military’s understanding of an installation’s overall exposure to specific climate hazards. No new data was downscaled or developed as part of this tool (except for Alaska and Hawai’i), but the tool does use existing global hydro-climate datasets (Pinson et al., 2021) to present climate hazard exposure for three timeframes and both higher and lower emissions scenarios. While this tool is an example of incorporation of climate projection data, DCAT was developed to address high-level screening questions only, since not all climate hazard exposure data was available for all geographies. Finer-scale data may still be necessary for installations to conduct site-level resilience planning.
In addition to these national-level resources, the United States Geological Survey (USGS) operates nine Climate Adaptation Science Centers (CASCs). The CASCs are partnerships between universities and the USGS and aim to provide resources for understanding climate change impacts. While many of these resources are focused on ecological impacts of climate change, there are a few CASCs that provide resources that summarize the potential changes in HILF hazards that may impact infrastructure, such as the Southwest CASC’s Assessment of Climate Change in the Southwest United States report (Garfin et al., 2013). Particularly in states that have not performed detailed hazard assessments, these types of national and regional tools and resources can provide valuable information about hazards related to climate change and assist with assessing site-level risk.
A mesonet is a network of automated weather monitoring stations that provides crucial weather and climate data related to temperature, wind speed and direction, humidity, precipitation, and other meteorological variables. On the state level, historical data collected from these stations can be used by scientists and local officials to identify changing climate trends and inform future climate projections. In the United States, 29 states have an official online state mesonet operated by a local entity, such as a public university or state climate office (Supplementary Material S3). Three additional states have a working prototype or have announced plans to create a state mesonet, and another state maintains a weather database but does not currently operate a mesonet. All 29 state mesonets provide a map that displays the locations of stations within the network; however, some maps lack interactive functionality and do not allow the user to pan over a station to view metadata or current weather conditions. Additionally, all state mesonets offer current and historical data for download, a key capability for use in understanding trends in climate data. The majority provide immediately downloadable and publicly accessible data but some offer download only by user request. Out of the 29 state mesonets, 23 provide the capability to visually analyze the data—such as through plots, graphs, and maps—using a web interface, although several are limited in the type of data they display or the visual means used to display the data. The Nebraska state mesonet, for example, displays real-time maps that show current conditions such as air temperature and hourly liquid precipitation but does not have the capability to visualize changing conditions over time. Improved data visualization capabilities, such as the automated data plotting feature in the Iowa Environmental Mesonet, may facilitate the interpretation and communication of climate and weather trend data to a broader range of users.
For states that do not have a local mesonet, publicly accessible weather data can still be found on the University of Utah MesoWest website, which provides data from “weather observing networks that are managed by government agencies, private firms, and educational institutions” across the U.S. (often exceeding 10 per state) (University of Utah, 2022). The MesoWest website provides an interactive map and data download capabilities for each state but does not offer any data visualization features.
While useful for a variety of applications, state mesonets may play a particularly important role in aiding climate change and hazard research in states that lack the political environment or resources to develop climate projections or detailed mitigation plans. The publicly accessible nature of the data allows interested individuals or groups to perform their own analyses even when lacking state-provided funds or initiatives. Specifically, long-term trends and averages obtained from mesonet data can be used to provide climatic and environmental context for changes in hazard severity and frequency and to evaluate likely future trends. Challenges may arise in cases where only short-term data is available due to a lack of recording capabilities or the recent establishment of the mesonet.
In this section, we present an example of how a site could approach data gathering for climate change impacts on hazards that could impact their systems. While the risk assessment methodology employed may differ based on the specific goals of the assessment (e.g., breadth of infrastructure analyzed) and agency requirements, any risk assessment requires high-quality information about the hazards assessed. In this example, consider a hypothetical site in New York County. The site can obtain historical hazard frequencies by analyzing historical data, such as referencing mesonet data, or by using a tool, such as the TRN Identify Potential Hazards tool (https://trn.pnnl.gov/toolkit/potential-hazards), which leverages data from the NRI. Hazards with non-negligible frequencies are shown in Table 2 along with their historical frequencies. This historical data can inform the site’s risk assessment. However, in order to consider the risk to the site under different climate change scenarios, it is critical to gather information about how the hazards considered may change. As a starting point for investigation, the site can use relevant state-level and national resources listed in Supplementary Material S2. In the case of New York, a climate change resource is available that provides climate projections for seven regions within the state (Rosenzweig et al., 2011). These projections include both quantitative projections for some climate variables (e.g., temperature and precipitation) and extreme events (e.g., heat waves) as well as qualitative projections for other types of extreme events (e.g., hurricanes). Climate change insights from this resource are shown in Table 2 for each hazard considered in the risk assessment.
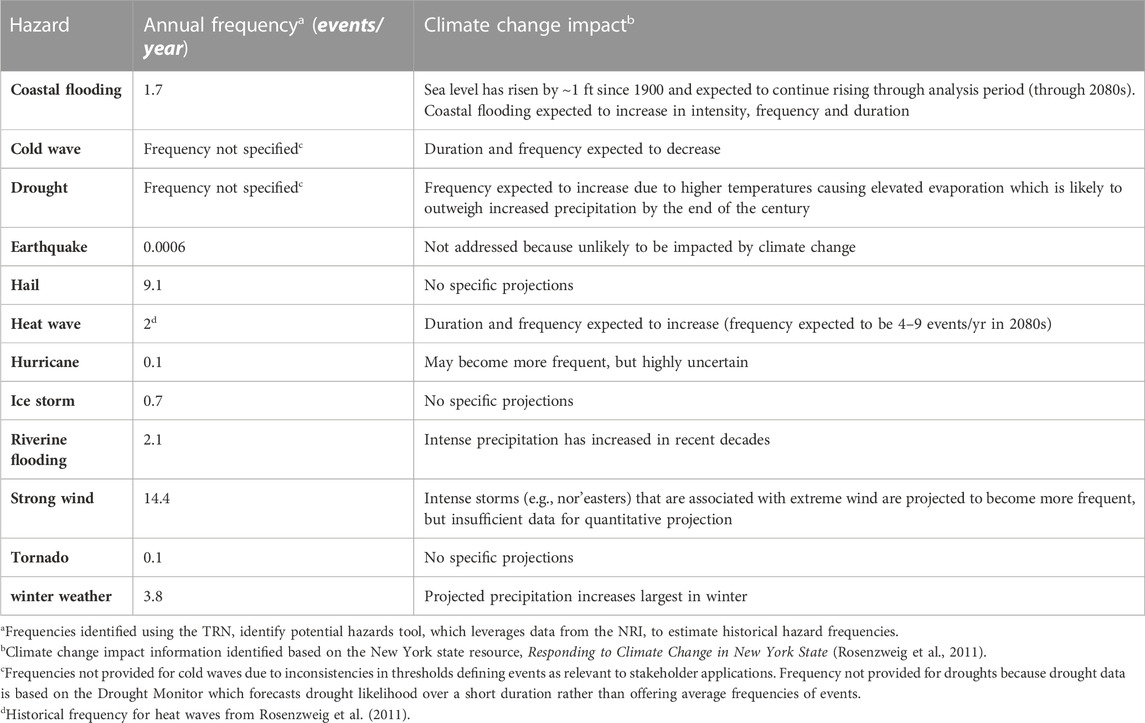
TABLE 2. Example hazard data collected for a site-level risk assessment at a hypothetical site in New York county in New York state.
The types of resources and available climate projection data, as well as the way in which climate information is presented was found to be largely driven by three factors: policy drivers, stakeholder demand (e.g., sector-specific, agency-specific), and academic and research organization engagement (Figure 5). Figure 5 depicts the percentage of states that indicated different drivers for resource development. The majority of available resources are the result of grassroots collaboration between state agencies, state climatologists or climate experts, university researchers, and/or federal scientists. All fifty states and DC have appointed state climatologists. These state climatologists hold a number of responsibilities that differ based on policy drivers and available resources within the state. For example, in some states, the state climatologist is a paid position whereas in other states, the role is filled by an academic at a state university as part of their unpaid service. Overall, state climatologists coordinate climate efforts for the state, liaise between public and private stakeholders (e.g., state departments and universities), act as a clearinghouse for available resources within the state, and work to understand and communicate the climate hazards facing the state to stakeholders and the public.
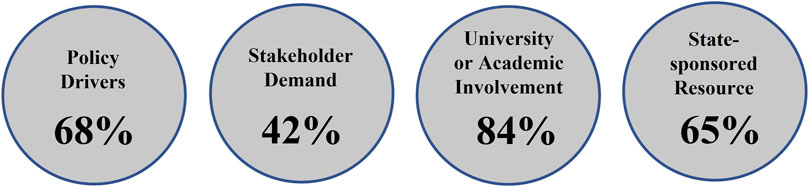
FIGURE 5. Percentages of states (either surveyed or interviewed) that indicated different drivers for development of climate change resources. Percentages do not total 100% as respondents were able to indicate multiple drivers. Stakeholder demand includes: 1) local and/or regional actor-led (municipalities, countries, etc.) initiatives to develop resources; 2) hazard-driven demand for resources; and, 3) sector-driven demand for resources (e.g., agriculture).
Though states have different levels of resources available related to climate change projections as discussed above, there are fundamental challenges to providing projections for many HILF hazards. From a review of the hazards highlighted in the NRI dataset, we find that in most cases, high confidence projections are not available. In some cases (e.g., lightning), there is even disagreement in the literature about the directionality of the projected change in the hazard (Price, 2009; Finney, Doherty et al., 2018). However, even in cases where quantitative projections are not available at a national scale, some states put forth qualitative projections for relevant hazards (e.g., Rosenzweig et al., 2011; Widhalm et al., 2018). These qualitative discussions of HILF hazards provide information for organizations within the state, contextualized with state-specific considerations as discussed in the example above.
Additionally, some states undertake more detailed studies for such hazards. For example, California has resources (Westerling, 2018) and associated tools (Thomas, Mukhtyar et al., 2018) that have been developed to better understand projected wildfire exposure in the state. These types of resources provide key information for people who may not have significant background in hazard analysis or climate science to understand how the hazards included in their risk and resilience planning are likely to change for their organization at a state or sub-state level. Even if significant uncertainty around these geographically granular projections remains, they can form the basis for supporting risk assessment and resilience planning using a scenario-based approach.
State laws, mandates, E.O.s, and other state policies continued to be key drivers facilitating the development of climate assessments and plans at the state-level (Ray and Grannis, 2015). Indeed, in 2021–2022, state governments continued to pursue resilience, with 42 states enacting over 200 bills dealing with resilience to natural hazards, including hazards impacted by climate change (Bragg et al., 2022). Survey respondents and interviewees from 21 states indicated that these were important factors driving the creation of state-sponsored resources, while 4 other state respondents indicated a lack of state-sponsored mandates or legislation, and 6 did not cite policies as an impetus for generating climate information (Table 3). The governments of California, Connecticut, Hawai’i, Maine, Minnesota, Nevada, New Jersey, New Mexico, New York, Oregon, Vermont, and Wisconsin, for example, have established commissions, councils, task forces, and/or working groups to lead and/or coordinate climate planning across the state and serve as a hub for climate information and collaboration at the state-level. The University of Minnesota formally established the Minnesota Climate Adaptation Partnership (MCAP) originally as a grassroots program conducting research to further the availability of downscaled data in Minnesota and support the integration of climate data and information in policy and decision making. The State Legislature of Minnesota provided funding for MCAP to generate dynamically downscaled future climate projection data and associated resources to support the use and application of these data. Similarly, Maine’s legislature formally established the Maine Climate Council which is charged with updating sea-level rise projections for coastal areas every 4 years and creating maps to provide information about storm surge, coastal and riverine flooding, and extreme weather events (Maine Legislature, 2019). Alabama is an example where the state does not have any direct or explicit state-level climate change plans or policies. The state climatologist provides scientific and policy information to the state; after conducting research and analysis on greenhouse gas emissions and climate impacts, he did not identify climate stressors or impacts that warranted the development of additional state-level plans to address climate change (Christy, 2022), but did recommend increased resilience to better address historical extremes. Other regional and national studies cite sea level rise as a significant climate stressor along Alabama’s coast (Runkle et al., 2022).
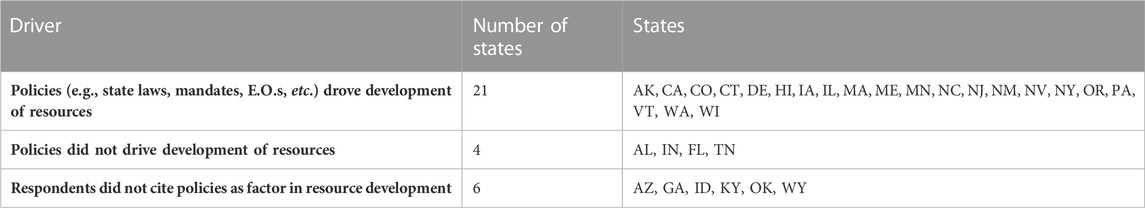
TABLE 3. States where policies drove the development of climate change resources.
Survey respondents and interviewees from 26 states cited academia, including universities and other research organizations, as heavily involved, and in select cases, as the primary drivers and/or authors of state-level climate assessments, modelling, and analyses. Climate programs and offices in at least 13 states are housed within universities (e.g., MCAP) and universities often support the technical basis of any quantitative assessments. The state of Indiana has no mandate or legislation driving climate planning; however, one respondent from Indiana identified that climate change resources were still developed, but “the assessment was carried out largely on a pro bono basis by various university researchers.” The Indiana assessment was designed, coordinated, and produced primarily by Purdue University’s Climate Change Research Center and supported by Purdue University, the University of Notre Dame, and Indiana University, Bloomington. In other cases, state offices and departments were the lead entity, with limited direct involvement from academic institutions.
State climatologists also collaborate with academic institutions (and in many states are employed by academic institutions) on analyzing the causes and drivers of climate change in the state. In some cases, this allows the state climatologist to focus to a greater extent on the impacts and communicating the information and impacts to stakeholders (ex. Iowa). In Oregon, the state legislature established the Oregon Climate Change Research Institute, housed at Oregon State University, in 2007 and state agencies developed the state’s climate change adaptation framework in 2020 and 2021 in response to an executive order from the governor. The institute conducts biennial assessments on the state of the science of climate change as it applies to Oregon and the likely effects of climate change in Oregon, typically over the next 10–50 years.
The survey results and interviews identified that policy drivers, such as federal or state E.O.s and related legislation, often either mandated or spurred the development of state-level climate-related plans and assessments. However, stakeholder demand and an urgency to respond to specific hazards were major drivers in the development of climate change resources and new downscaled, state-level climate projections. In cases where there was no explicit or official state climate mandate or policy, local and regional actors, including county, municipal, and district governments, led the development of local climate action plans, assessments, and in some cases, tools. One example is the City of Juneau which has key hydropower resources that are susceptible to climate hazards. Additionally, the communities are isolated, and the city and surrounding areas have been experiencing extreme precipitation events that threaten the hydropower infrastructure and residents. In response, the city is developing its own climate change plan. Similarly, in the absence of a statewide effort, the South Florida Water Management District launched an initiative in collaboration with multiple university partners to understand sea level rise in a changing climate; the district developed the Resilience Metrics Hub in response to requests from water control districts, cities operating flood control systems, water utilities, local governments, agencies, and USACE. The tool includes metrics on flood control, water access, and ecosystem restoration, information on hazard severity and frequency, and was supported by an academic effort to enhance Florida’s climate change projections.
Iowa, Kentucky, Oregon, Tennessee, and Vermont are examples of states where hazard mitigation forms a significant portion of the state-level response to climate change (either in addition to climate planning, or in its absence). Hazard mitigation planning can incorporate short-term to moderate-term climate projections and historical trends. Tennessee’s emergency management community is a key stakeholder, and as such, state officials are working to understand climate impacts on hazards. The state is currently developing a state-level hazard mitigation plan, which is a FEMA requirement, that explicitly considers climate change, including trends seen in historical data. In the absence of state-level climate policies or planning, this requirement has provided an opportunity for the state to incorporate climate information into hazard mitigation efforts.
In states with a significant emergency management driver, there is also a palpable urgency to respond and increase resilience to extreme hazards, which has driven the demand and need for climate data, information, and planning. To address drought, one of Kentucky’s most concerning hazards given the state’s increasing drought susceptibility, the state’s climate office and state climatologist are working with partners to generate relevant climate and weather information (see discussion of state mesonets above); the office is also involved in the development of the state-level drought mitigation plan, which will likely include either climate projections or a statement describing climate and drought trends in the state. Additionally, municipalities in Iowa are working with the state climatologist to develop downscaled models for riverine flooding and impacts on buildings and infrastructure to determine necessary infrastructure upgrades over the coming decades.
Finally, sector-specific demands and needs were found to be drivers of climate planning, assessments, and modeling in several states. Priority sectors impacted by climate change are the key stakeholders driving demand for climate planning and determining the type of available climate data and resources. New York, for example, has conducted sector plans for oceans, wildlife, health, buildings, and transportation. In Iowa, agriculture is the most important sector and a key driver of the type of available climate information; most of the hazards that the state is looking at through assessments, modeling, and plans are driven by the agriculture sector’s need, including drought, flash/areal flooding, runoff, humidity, and aridity. Sea level rise is the top climate stressor in Hawai’i, and as such, the state’s department of transportation developed a climate change adaptation action plan to make Hawai’i’s highways more climate resilient. The plan includes an assessment of the highway assets and their exposure to climate-related hazards; the report was accompanied by a decision-support tool to inform planning and adaptation actions (Georgetown Climate Center, 2022).
Resilience planning is a critical process for federal agencies and recent federal policy has created a stronger drive toward incorporating climate change considerations into these planning processes. One of the key inputs required for such analyses is high quality, location-specific climate change projections that include information about how HILF hazards analyzed in many infrastructure-focused resilience plans are expected to change under different climate change scenarios. In this analysis, we identified key resources containing information on climate projections at the state level with the goal of compiling a list of resources that can be used to inform the incorporation of climate change into site-level resilience planning. We found that over half of the U.S. states have conducted original downscaled climate modeling or performed analyses of existing downscaled data to support the development of their own state-specific projections. States with resources that do not contain state-specific projections instead leveraged national or regional downscaled model results or state-level historical trends to provide context for a more detailed state-level analysis of expected changes resulting from climate change. Additionally, 29 states currently host official state mesonets which collect weather data that can be used to consider trends in climate variables. Such strategies can be important for states that do not have the resources or policy drivers to conduct more in-depth assessments of climate projections.
As part of our analysis, we also identified three key drivers for the development of climate change resources at the state level. First, we found that state laws, mandates, and E.O.s, and other state policies were important considerations in determining whether a state would develop climate change resources. Next, we found that there is commonly a close connection between universities within states and the development of climate change resources. This can range from a partnership between the state climatologist and a university team that incorporates more technical expertise into the effort to having the position of the state climatologist filled by a faculty member within a university. Finally, we found that one of the most important factors in determining the type of information available in state-level climate projection resources was the makeup of the stakeholder groups involved in the effort. This included stakeholders who were primary drivers for the development of resources (e.g., resources developed due to stakeholder demand) as well as stakeholders that were consulted through the process of developing the resources. For example, states with a large drive from the emergency management community tended to have a deeper focus on considering climate change impacts on HILF events, whereas states with a large drive from the agricultural community tended to focus largely on precipitation and soil conditions in their climate change resources. Of course, in many cases, there were multiple critical stakeholder groups, leading to a broader focus of the climate change resources.
The review of climate change projection resources for this study was motivated by a desire to compile resources that organizations can use to inform the incorporation of climate projections into site-level resilience planning. This focus meant that the effort was directed toward compiling an initial list of resources rather than conducting an in-depth analysis and comparison of the methodologies used by different states. Additionally, due to the limited response (61 percent of states plus DC), it is possible that relevant state-level resources containing information about how climate change may lead to changes in the hazards impacting sites were overlooked. Future research could involve capturing insights from states from which responses were not received in this study. Additionally, many states are actively developing or updating resources. For the states from which we obtained feedback, we captured their progress toward developing new resources. However, it is likely that other states that we did not hear back from are similarly working to improve and update the mechanisms for sharing climate projection data with residents and organizations within the state and that progress will continue to be made for all states in the future. Since resources are continuously being updated, sites that want to use any of the resources identified through this study in their resilience planning should check to see if any updates or additional resources are available. Finally, in some cases climate change resources are available at the county or city level. This type of resource could be helpful for sites conducting resilience planning within these counties or near these cities. Future work could evaluate these local resources.
The original contributions presented in the study are included in the article/Supplementary Material, further inquiries can be directed to the corresponding author.
HR and AD conceived of the study. HR, SD, and AD devised the survey and conducted interviews. All authors contributed to the web-based search for resources. All authors contributed to the article and approved the submitted version.
Funding for this study was provided by the Department of Energy (DOE) Federal Energy Management Program (FEMP).
The authors would like to thank all of the stakeholders who took the time to respond to our survey or participate in an interview, including authors of state-level climate change resources and state climatologists. We would like to express a special thanks to Kenneth Kunkel from the North Carolina State University for his valuable input during the initial stages of this study. We are also grateful to Marcy Whitfield and Cahley Jaekel at Pacific Northwest National Laboratory for their assistance with the survey and interviews. Additionally, we would like to thank Kalyn Dorheim and Julia Rotondo from Pacific Northwest National Laboratory as well as two reviewers for their reviews of the paper. The authors gratefully acknowledge the Department of Energy’s Federal Energy Management Program (FEMP) for its support in conducting this research. This manuscript corresponds to PNNL document PNNL-SA-180244.
The authors declare that the research was conducted in the absence of any commercial or financial relationships that could be construed as a potential conflict of interest.
All claims expressed in this article are solely those of the authors and do not necessarily represent those of their affiliated organizations, or those of the publisher, the editors and the reviewers. Any product that may be evaluated in this article, or claim that may be made by its manufacturer, is not guaranteed or endorsed by the publisher.
The Supplementary Material for this article can be found online at: https://www.frontiersin.org/articles/10.3389/fenvs.2023.1206039/full#supplementary-material
Anderson, C., Gooden, J., Guinan, P. E., Knapp, M., McManus, G., and Shulski, M. D. (2015). Climate in the heartland: historical data and future projections for the Heartland regional network. Urban Sustainability Directors Network.
Bragg, L., McBride, G. K., Schlegelmilch, J., and Esposito, L. D. (2022). State policy report - disaster resilience: 2022 session recap. Columbia Climate School: Columbia University, National Center for Disaster Preparedness.
Brown, C., Ghile, Y., Laverty, M., and Li, K. (2012). Decision scaling: linking bottom-up vulnerability analysis with climate projections in the water sector. Water Resour. Res. 48, W09537. doi:10.1029/2011wr011212
Christy, J. R. (2022). A practical guide to climate change in Alabama. Guntersville, Alabama: The University of Alabama in Huntsville, 43.
Clarke, B., Otto, F., Stuart-Smith, R., and Harrington, L. (2022). Extreme weather impacts of climate change: an attribution perspective. Environ. Res. Clim. 1 (1), 012001. doi:10.1088/2752-5295/ac6e7d
Delgado, A., and Rabinowitz, H. S. (2021). Considering climate change scenarios in site resilience planning. Richland, WA (United States): Pacific Northwest National Laboratory PNNL.
Department of Defense, (2021). Department of Defense climate assessment tool. Available at: https://media.defense.gov/2021/Apr/05/2002614579/-1/-1/0/DOD-CLIMATE-ASSESSMENT-TOOL.PDF August 16, 2021).
Fan, L., Chen, D., Fu, C., and Yan, Z. (2013). Statistical downscaling of summer temperature extremes in northern China. Adv. Atmos. Sci. 30 (4), 1085–1095. doi:10.1007/s00376-012-2057-0
Federal Energy Management Program, (2022). Technical Resilience Navigator. Available at: https://trn.pnnl.gov/home December 23, 2022).
Findlater, K., Webber, S., Kandlikar, M., and Donner, S. (2021). Climate services promise better decisions but mainly focus on better data. Nat. Clim. Change 11, 731–737. doi:10.1038/s41558-021-01125-3
Finney, D. L., Doherty, R. M., Wild, O., Stevenson, D. S., MacKenzie, I. A., and Blyth, A. M. (2018). A projected decrease in lightning under climate change. Nat. Clim. Change 8 (3), 210–213. doi:10.1038/s41558-018-0072-6
Flage, R., and Aven, T. (2015). Emerging risk–Conceptual definition and a relation to black swan type of events. Reliab. Eng. Syst. Saf. 144, 61–67. doi:10.1016/j.ress.2015.07.008
Garfin, G., Jardine, A., Merideth, R., Black, M., and LeRoy, S. (2013). “Assessment of climate change in the Southwest United States: a report prepared for the national climate assessment,” in A report by the Southwest Climate alliance. Retrieved February 2, 2022.
Gao, Y., Fu, J. S., Drake, J. B., Liu, Y., and Lamarque, J.-F. (2012). Projected changes of extreme weather events in the eastern United States based on a high resolution climate modeling system. Environ. Res. Lett. 74 (4). doi:10.1088/1748-9326/7/4/044025
Georgetown Climate Center (2022). State adaptation progress tracker. Available at: https://www.georgetownclimate.org/adaptation/plans.html February 2, 2022).
Gilford, D. (2021). Tropical cyclone potential intensity during the record-breaking 2020 hurricane season, EGU general assembly 2021, online, 19-30 apr 2021. EGU21-3311.
Giorgi, F. (1990). Simulation of regional climate using a limited area model nested in a general circulation model. J. Clim. 3 (9), 941–963. doi:10.1175/1520-0442(1990)003<0941:sorcua>2.0.co;2
Graham, J. D., Fineberg, H., Helbing, D., Homer-Dixon, T., Kroger, W., Maila, M., et al. (2010). The emergence of risks: contributing factors. International Risk Governance Council IRGC.
Haasnoot, M., Kwakkel, J. H., Walker, W. E., and ter Maat, J. (2013). Dynamic adaptive policy pathways: a method for crafting robust decisions for a deeply uncertain world. Glob. Environ. change 23 (2), 485–498. doi:10.1016/j.gloenvcha.2012.12.006
Hamlet, A. F., Byun, K., Robeson, S. M., Widhalm, M., and Baldwin, M. (2020). Impacts of climate change on the state of Indiana: ensemble future projections based on statistical downscaling. Clim. Change 163 (4), 1881–1895. doi:10.1007/s10584-018-2309-9
Hawkins, E., and Sutton, R. (2009). The potential to narrow uncertainty in regional climate predictions. Bull. Am. Meteorological Soc. 90 (8), 1095–1108. doi:10.1175/2009bams2607.1
ICF International (2016). 2013–2015 climate resilience pilot program: outcomes, lessons learned, and recommendations.
Infanti, J. M., Kirtman, B. P., Aumen, N. G., Stamm, J., and Polsky, C. (2020). Aligning climate models with stakeholder needs: advances in communicating future rainfall uncertainties for South Florida decision makers. Earth Space Sci. 7 (7), e2019EA000725. doi:10.1029/2019ea000725
Kc, B., Shepherd, J. M., King, A. W., and Gaither, C. J. (2021). Multi-hazard climate risk projections for the United States. Nat. Hazards 105, 1963–1976. doi:10.1007/s11069-020-04385-y
Klein, C., Jackson, L. S., Parker, D. J., Marsham, J. H., Taylor, C. M., Rowell, D. P., et al. (2021). Combining CMIP data with a regional convection-permitting model and observations to project extreme rainfall under climate change. Environ. Res. Lett. 16 (10), 104023. doi:10.1088/1748-9326/ac26f1
Komurcu, M., Emanuel, K. A., Huber, M., and Acosta, R. P. (2018). High-resolution climate projections for the northeastern United States using dynamical downscaling at convection-permitting scales. Earth Space Sci. 5 (11), 801–826. doi:10.1029/2018ea000426
Kotamarthi, R., Mearns, L., Hayhoe, K., Castro, C. L., and Wuebbles, D. (2016). Use of climate information for decision-making and impacts research: state of our understanding. Argonne National Laboratory Argonne United States.
Liess, S., Twine, T. E., Snyder, P. K., Hutchison, W. D., Konar-Steenberg, G., Keeler, B. L., et al. (2022). High-resolution climate projections over Minnesota for the 21st century. Earth Space Sci. 9 (3). doi:10.1029/2021ea001893
Mahmoud, M., Liu, Y., Hartmann, H., Stewart, S., Wagener, T., Semmens, D., et al. (2009). A formal framework for scenario development in support of environmental decision-making. Environ. Model. Softw. 24 (7), 798–808. doi:10.1016/j.envsoft.2008.11.010
Marchau, V. A., Walker, W. E., Bloemen, P. J., and Popper, S. W. (2019). Decision making under deep uncertainty: from theory to practice. Cham: Springer Nature.
Mass, C. F., Ovens, D., Westrick, K., and Colle, B. A. (2002). Does increasing horizontal resolution produce more skillful forecasts? the results of two years of real-time numerical weather prediction over the Pacific Northwest. Bull. Am. Meteorological Soc. 83 (3), 407–430. doi:10.1175/1520-0477(2002)083<0407:dihrpm>2.3.co;2
Miller, B. W., Schuurman, G. W., Symstad, A. J., Runyon, A. N., and Robb, B. C. (2022). Conservation under uncertainty: innovations in participatory climate change scenario planning from US national parks. Conservation Sci. Pract. 4 (3), e12633. doi:10.1111/csp2.12633
Milly, P. C., Betancourt, J., Falkenmark, M., Hirsch, R. M., Kundzewicz, Z. W., Lettenmaier, D. P., et al. (2008). Stationarity is dead: whither water management? Science 319 (5863), 573–574. doi:10.1126/science.1151915
National Research Council (1982). Scientific basis of water-resource management. Washington, D.C: National Research Council.
Office for Coastal Management, (2022). Coastal flood exposure mapper. Available https://coast.noaa.gov/digitalcoast/tools/flood-exposure.html.
OSTP, (2023). Selecting climate information to use in climate risk and impact assessments: guide for federal agency climate adaptation planners. Washington, D.C: White House Office of Science and Technology Policy.
Pinson, A. O., White, K. D., Ritchie, E. E., Conners, H. M., and Arnold, J. R. (2021). DoD installation exposure to climate change at home and abroad. Washington, DC: U.S. Army Corps of Engineers.
Price, C. (2009). Will a drier climate result in more lightning? Atmos. Res. 91 (2-4), 479–484. doi:10.1016/j.atmosres.2008.05.016
Rabinowitz, H. S., Delgado, A., Elliot, D. B., Rotondo, J. A., and Whitfield, M. (2022). “Incorporating climate change into risk-informed resilience planning,” in ACEEE summer study on energy efficiency in buildings. Editors N. M. Frick, and D. Roberts (Pacific Grove, CA: American Council for an Energy-Efficient Economy).
Rabinowitz, H. S., Elliot, D. B., Unwin, S. D., Rotondo, J. A., Hudson, H. R., and Keene, K. M. (2023). The Technical Resilience Navigator: Risk-informed decision making to support resilience planning. Richland, WA, United States: Pacific Northwest National Laboratory.
Ray, A. D., and Grannis, J. (2015). From planning to action: implementation of state climate change adaptation plans. Mich. J. Sustain. 3. doi:10.3998/mjs.12333712.0003.001
Rockel, B. (2015). The regional downscaling approach: a brief history and recent advances. Curr. Clim. Change Rep. 1 (1), 22–29. doi:10.1007/s40641-014-0001-3
Rosenzweig, C., Solecki, W., DeGaetano, A., O’Grady, M., Hassol, S., and Grabhorn, P. (2011). “Responding to climate change in New York State: the ClimAID integrated assessment for effective climate change adaptation,” in Synthesis report (Albany, New York: New York State Energy Research and Development Authority NYSERDA).
Runkle, J., Kunkel, K. E., Stevens, L. E., Frankson, R., and Rayne, S. (2022). Alabama state climate summary 2022. NOAA/NESDIS, Silver Spring, MD, 4.
Salathe, E. P., Mote, P. W., and Wiley, M. W. (2007). Review of scenario selection and downscaling methods for the assessment of climate change impacts on hydrology in the United States pacific northwest. Int. J. Climatol. 27 (12), 1611–1621. doi:10.1002/joc.1540
Shortridge, J., and Camp, J. S. (2019). Addressing climate change as an emerging risk to infrastructure systems. Risk Anal. 39 (5), 959–967. doi:10.1111/risa.13234
Star, J., Rowland, E. L., Black, M. E., Enquist, C. A., Garfin, G., Hoffman, C. H., et al. (2016). Supporting adaptation decisions through scenario planning: enabling the effective use of multiple methods. Clim. Risk Manag. 13, 88–94. doi:10.1016/j.crm.2016.08.001
Tang, J., Niu, X., Wang, S., Gao, H., Wang, X., and Wu, J. (2016). Statistical downscaling and dynamical downscaling of regional climate in China: present climate evaluations and future climate projections. J. Geophys. Res. Atmos. 121 (5), 2110–2129. doi:10.1002/2015jd023977
Thomas, N., Mukhtyar, S., Galey, B., and Kelly, M. (2018). Cal-adapt, linking climate science with energy sector resilience and practitioner need: a report for California's Fourth climate change assessment. California: California Energy Commission.
United Nations Environment Programme (2022). Spreading like Wildfire—the rising threat of extraordinary landscape fires Nairobi: A UNEP Rapid Response Assessment.
University of Utah, (2022). MesoWest. Available at: https://mesowest.utah.edu/.
University of California Merced (2022). The climate Toolbox. Available at: https://climatetoolbox.org/September 15, 2022).
Unwin, S. D., Elliot, D. B., and Rotondo, J. A. (2020). “A tool for the risk-informed management of critical mission resilience,” in ACEEE summer study on energy efficiency in buildings. Editors J. Granderson, and D. Hun (Pacific Grove, CA.
USGCRP (2017). in Climate science special report: Fourth national climate assessment, volume I. D. J. Wuebbles, D. W. Fahey, K. A. Hibbard, D. J. Dokken, B. C. Stewart, and T. K. Maycock (Washington, DC, USA: U.S. Global Change Research Program), 470.
USGCRP (2018). in Impacts, risks, and adaptation in the United States: Fourth national climate assessment, volume II. D. R. Reidmiller, C. W. Avery, D. R. Easterling, K. E. Kunkel, K. L. M. Lewis, T. K. Maycocket al. (Washington, DC, USA: U.S. Global Change Research Program), 1515.
USGCRP (2022). Climate mapping for resilience and adaptation. Available at: https://resilience.climate.gov.
Vano, J., and Lukas, J. (2022). A user guide to climate change portals, prepared for those seeking climate change information by the Aspen Global Change Institute. Available at: www.agci.org/climate-portal-guide.
Vergun, D. (2021). DoD using climate assessment tool to understand impacts of climate change. Available at: https://www.defense.gov/News/News-Stories/Article/Article/2576382/dod-using-climate-assessment-tool-to-understand-impacts-of-climate-change/August 16, 2021).
Wang, Y., Leung, L. R., McGregor, J. L., Lee, D. K., Wang, W. C., Ding, Y., et al. (2004). Regional climate modeling: progress, challenges, and prospects. J. Meteorological Soc. Jpn. Ser. II 82 (6), 1599–1628. doi:10.2151/jmsj.82.1599
Weaver, C. P., Moss, R. H., Ebi, K. L., Gleick, P. H., Stern, P. C., Tebaldi, C., et al. (2017). Reframing climate change assessments around risk: recommendations for the US National Climate Assessment. Environ. Res. Lett. 12 (8), 080201. doi:10.1088/1748-9326/aa7494
Westerling, A. L. (2018). “Wildfire simulations for California’s Fourth climate change assessment: projecting changes in extreme wildfire events with a warming climate,” in California’s Fourth climate change assessment (California: California Energy Commission).
White House, T. (2021). Executive order 14008: tackling the climate crisis at home and abroad (jan. 27, 2021). Environ. Prot. Agency, Dep. Energy 86.
Widhalm, M., Hamlet, A., Byun, K., Robeson, S., Baldwin, M., Staten, P., et al. (2018). Indiana’s climate trends: a resource for the Indiana climate change impacts assessment. Indiana climate change impacts assessment. Purdue Climate Change Research Center.
Keywords: resilience planning, climate projections, risk assessment, state-level analysis, site-level assessment, natural hazards
Citation: Rabinowitz HS, Dahodwala S, Baur S and Delgado A (2023) Availability of state-level climate change projection resources for use in site-level risk assessment. Front. Environ. Sci. 11:1206039. doi: 10.3389/fenvs.2023.1206039
Received: 14 April 2023; Accepted: 16 October 2023;
Published: 02 November 2023.
Edited by:
Amy Heintz, Battelle, United StatesReviewed by:
Jennifer Freya Helgeson, Jennifer Helgeson, United StatesCopyright © 2023 Rabinowitz, Dahodwala, Baur and Delgado. This is an open-access article distributed under the terms of the Creative Commons Attribution License (CC BY). The use, distribution or reproduction in other forums is permitted, provided the original author(s) and the copyright owner(s) are credited and that the original publication in this journal is cited, in accordance with accepted academic practice. No use, distribution or reproduction is permitted which does not comply with these terms.
*Correspondence: Sophia Dahodwala, c29waGlhLmRhaG9kd2FsYUBwbm5sLmdvdg==
Disclaimer: All claims expressed in this article are solely those of the authors and do not necessarily represent those of their affiliated organizations, or those of the publisher, the editors and the reviewers. Any product that may be evaluated in this article or claim that may be made by its manufacturer is not guaranteed or endorsed by the publisher.
Research integrity at Frontiers
Learn more about the work of our research integrity team to safeguard the quality of each article we publish.