- 1College of Environmental Science and Engineering, Ocean University of China, Qingdao, China
- 2Chinese Research Academy of Environmental Sciences, Beijing, China
Excess nitrate (NO3−) of water is a worldwide environmental problem. Therefore, identifying the sources and analyzing respective contribution rates are of great importance for improving water quality. The current study was carried out to identify the potential sources of NO3− pollution in Cao-E River basin, in Eastern China. Surface water samples were collected during the dry season and wet season. Multiple hydrochemical indices, dual NO3− isotopes (δ15N–NO3− and δ18O–NO3−) and a Bayesian model (stable isotope analysis in R, MixSIAR) were applied to identify NO3− sources and estimate the proportional contributions of multiple NO3− sources. During the sampling period, nitrification was a dominant nitrogen transformation process in the study area. The results of the NO3− isotopes suggested that manure and sewage (M&S), soil nitrogen (SN) and nitrogen fertilizer (NF) were the major contributors to NO3−. Moreover, the results obtained from the MixSIAR model showed that the proportional contributions of atmospheric deposition (AD), NF, M&S and SN to NO3− were 2.82, 15.45, 44.25, 37.47% and 3.14, 23.39, 31.78, 41.69% in the dry and wet season, respectively. This study provided evidence to further understand the sources, transport, and transformation of N in Cao-E River basin, which deepens the understanding of the management of N contaminant.
1 Introduction
In recent decades, the discharge of point source pollutants through industrial and domestic wastewater, as well as the use of large amounts of fertilizers in agricultural systems, have led to increased nitrate (NO3−) concentrations in river water (Bu et al., 2019; Zhang et al., 2021). For example, the Taihu Lake basin (Vidal et al., 2020), the Yellow River (Xie et al., 2021), the Liao River (Yu et al., 2021), the Amazon River (Bijay and Craswell, 2021) and so on are also polluted to varying degrees. NO3− is considered a worrying pollutant in river ecosystems because the discharge to rivers exceeds the self-purification capacity of water bodies (Xue et al., 2009). Increased NO3− concentrations in water can lead to eutrophication and algal blooms, negatively impacting aquatic ecosystems (Cao et al., 2022), entering the ocean through estuaries poses a serious threat to the stability of their ecosystems (Yu et al., 2021). Long-term consumption of drinking water containing high concentrations of NO3− can cause serious harm to human health and pose risks to human health, such as methemoglobinemia, diabetes, spontaneous abortion, thyroid disease and stomach cancer (Burns, 2011; Danni et al., 2019; Xia et al., 2019).
Determining the NO3− source in the river basin is essential for effective control and treatment of river NO3− pollution. The traditional source analysis method of NO3− in rivers is mainly done by studying regional land use types and combining river water chemistry characteristics. This method is cumbersome and circumscribed. NO3− source is complex, related to season, flow, rainfall and other factors (Ding et al., 2015), and is also affected by social factors such as exogenous input and a series of biogeochemical reactions that occur during the nitrogen cycle, such as ammoniation, nitrification and denitrification, etc., which are difficult to identify by traditional source analysis methods.
Different NO3− sources have different isotopic characteristics (Wang et al., 2018). The source of river NO3− can be traced according to its unique stable isotopic characteristics through the analysis of N and O (15N-NO3− and 18O-NO3−) isotopes of NO3−(Ji et al., 2022). However, NO3− isotopes (15N-NO3− and 18O-NO3−) can only indicate the source of NO3−, not the proportion of sources of pollution (e.g., atmospheric deposition, soil N reservoir, fertilizer, manure and sewage). Combining bistable isotope information with Bayesian statistics (i.e., MixSIAR) can effectively quantify NO3− sources with unique isotopic characteristics (Xue et al., 2009). For example, Soto et al. (2019) used NO3− isotopes and SIAR models to determine NO3− sources in Assiniboine and Red rivers (Canada). Their results showed that manure and wastewater discharge contributed 62% of NO3− sources in the Assiniboine River, while inorganic agricultural fertilizers contributed 40% of NO3− sources in the Red River (Soto et al., 2019). Ji et al. (2022) used the SIAR model to quantify the contribution of NO3− sources in the Wenruitang River Basin of China, and determined that urban sewage was the main source of NO3− (58.5–75.7%), followed by nitrogen fertilizer (8.6–20.9%) and soil nitrogen (7.8–20.1%), and atmospheric deposition was (<0.1–7.9%) (Ji et al., 2022). Furthermore, the Bayesian stable isotope mixing model was also applied to reveal the source contributions of nitrate in the Ganga river (Kumar et al., 2023), the western coast of Guangdong Province, South China (Lao et al., 2019), East China Sea (Wang et al., 2023), a rural karst basin in Chongqing, southwestern China (Chang et al., 2022), Han, Rong and Lian river basins (Ye et al., 2021), and the eastern coast of Hainan Island (Chen et al., 2020a). Chen et al. (2020a) uesd the dual isotopes and some ion tracers to study NO3− sources and watershed denitrification. Their results indicated that nitrification in soil zones was the main NO3− source in dry winter, the lowest denitrification (10%) occurred in April and the highest denitrification (48%) took place in August (Chen et al., 2020a). Chang et al. (2022) analysed hydrochemistry and dual NO3− isotopes of water samples from a rural karst basin in Chongqing, southwestern China, their results indicated that the change of land use patterns and enhanced rural tourism activities alter the dominant NO3− sources in the rural karst river basin (Chang et al., 2022). Characterizing NO3− sources and biogeochemical processes have been increasingly more common and resultful through use of hydrochemistry and δ15N-NO3− and δ18O-NO3−(Chen et al., 2020b; Valiente et al., 2020).
In eastern China, non-point source pollution is of great importance due to its prevalence on water quality impairment with excessive chemical fertilizer application and rapid economic development in recent years (Ji et al., 2017; Chang et al., 2022). Studies have attempted to understand the distribution of different nitrogen forms and their spatial and temporal variations in different pollution types of tributaries or reaches based on catchment characteristics and nitrogen forms in Cao-E River Basin (Jin et al., 2009; Shen et al., 2011). Ji et al. (2017) adopted the environmental isotope (δD-H2O, δ18O-H2O, δ15N-NO3− and δ18O-NO3−) analysis and the Markov Chain Monte Carlo (MCMC) mixing model to determine the proportions of riverine NO3− inputs from four potential NO3− sources (AD, NF, SN, M&S) in ChangLe River which was tributary of Cao-e River Basin (Ji et al., 2017).
The analysis of the source of NO3− will help to further understand the impact of environmental changes in the basin on water quality, and provide a data basis for the development of hydrological and water resources research in the Cao-e River Basin. The objectives of this study were: 1) to qualitatively explore the source changes of NO3− in river water and its possible biological and chemical transformation processes based on the changes of δ15N-NO3− and δ18O-NO3− values according to the water chemical characteristics of the samples; 2) The MixSIAR model was used to quantitatively analyze the contribution rate of each NO3− source by calculating the nitrogen and oxygen isotope values; 3) According to the pollution sources obtained from the analysis, put forward reasonable suggestions for the treatment and protection of the river basin.
2 Manuscript
2.1 Materials and methods
2.1.1 Study area
The Cao-E River belongs to the Qiangtang River system and is the main tributary of the estuary section of the Qiangtang River, with a total length of 193 km and a basin area of 6,080 km2. The basin ranges from 120°30′E−121°15′E and 29°08′N-30°15′N. Originating from Changwu in the Dayan Mountain Range in Wang Village, Shanghu Town, Pan’an County, it flows from south to north through Xinchang, Shengzhou, Shangdu District and Keao District, and flows into Hangzhou Bay at the lower reaches of the Xinsanjiang Gate below the mouth of the Sanjiang River in Shaoxing. Above Shengzhou Pass is the upstream, Shengzhou pass to Shangdu Baiguan is the middle stream, and below the Baiguan is downstream. The upper section is a mountain-stream river, and the middle reaches of Shangdu Lock is a tidal river section, which is affected by the tide of Hangzhou Bay. There are a large number of industrial enterprises distributed in the river basin, and in addition to industrial wastewater discharge, there are also domestic sewage and non-point source pollution of farmland.
2.1.2 Sampling and pre-treatment
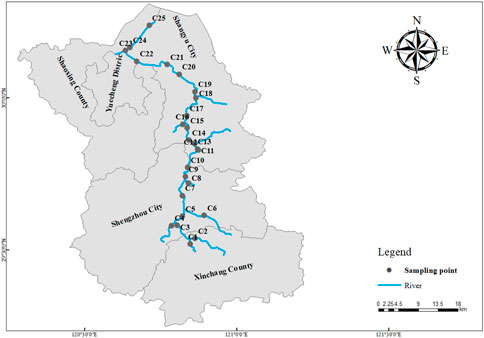
A total of 25 river water samples were collected from free-flowing reaches (FFRs) in January 2022 (the dry season), and the same samples were collected in June 2022 (the wet season). Collecting samples in two seasons to study the effects of seasonal changes on NO3− sources. Considering the river system distribution and hydrological characteristics. One sampling point was laid in the upper reaches of the Cao-e River Basin, 8 sampling points were laid in the middle reaches of the Cao-e River Basin, 5 sampling points were laid in the lower reaches of the Cao-e River, 1 main tributary Qianxi River, 2 Xinchang River, 1 Chengtan River, 1 Huangze River, 1 Yintan Stream, 1 Xiaguan Stream, 1 Xiaoshunjiang, 1 Hangzhou-Ningbo Canal, 1 Dongxiaojiang. The sampling point range covered the whole basin of the Cao-e River. All samples collected in the main stream after the tributaries merged are located 1.52km–6.93 km downstream from the confluence, where the nitrogen from the tributaries has been mixed completed (Fischer et al., 1979), and the location of the sampling points is shown in Figure 1. All water samples were collected at 0.5 m below the water surface, the collected water samples were stored separately in 500 mL polyethylene bottles that were prerinsed with distilled water and were then put into a portable incubator for temporary storage. They were then taken back to the laboratory and analyzed within 24 h.
2.1.3 Isotopic and chemical analyses
The river water pH, temperature (T, ˚C), electrical conductivity (EC), dissolved oxygen (DO), and oxidation-reduction potential (ORP/Eh, mV) were measured in situ using a multiparameter portable meter (Hach HQ40d, United States), the precision for these analyses were 0.1, 0.1 °C, 0.01 μS/cm, 0.01 mg/L, 0.1 mV, respectively. The collected water samples were returned to the laboratory on the same day of collection to measure the NH4+, NO3−, and NO2− concentrations. These parameters were analyzed according to standard methods approved by the National Environmental Protection Agency of China (Administration, 2002). NH4+ was determined by the Nesslerization colorimetric spectrophotometric method, NO3− was measured by the phenol disulfonic acid ultraviolet spectrophotometric method, NO2− was measured by the N-(1-naphthyl)-ethylenediamine spectrophotometric method (Zhang et al., 2017), with an ultraviolet and visible spectrophotometer (UV 2450,Shimadzu, Japan). The detection limits for NH4+, NO3− and NO2− being 0.02, 0.02, 0.01 mg/L−1, respectively. Concentrations of chloride (Cl−) was analyzed using ion chromatography (Dionex ICS-600), the analytical precision was 0.01 mg/L.
The δ15N-NO3− and δ18O-NO3− values were obtained using the chemical conversion method. First, 20 mL of filtered water sample was placed in a 40 mL headspace vial, 0.1 mL of cadmium chloride (CdCl) (20 g/L) solution and 0.8 mL of ammonia chloride (NH4Cl) (250 g/L) solution were added, 3 to 4 zinc tablets of 3 × 10 cm were wiped clean with alcohol was added, and the headspace vial was placed on a shaker and oscillated at 220 r/min for 15 min. After the full reaction, the zinc tablets were removed, the headspace vial was sealed, and the NO2− reduction step was completed. Add 1 mL of sodium azide (NaN3) solution (2 mol/L) and acetic acid (CH3COOH) (20%) 1:1 mixture to the headspace vial and mix the sample and reagents by vigorous shaking. After that, it was oscillated at 220 r/min for 30 min, and finally 0.6 mL of sodium hydroxide (NaOH) solution (6 mol/L) was added as a terminator (the solution was alkaline and not conducive to azidification reaction) to end the azidation reaction. The NO3− was converted into N2O gas by the above chemical process reaction. δ15N and δ18O values of N2O were analyzed by an Isotope Ratio Mass Spectrometer (IRMS, Thermo Fisher MAT 253) equipped with a Gas-Bench ІІ device (Thermo Fisher). The reproducibility was within ±0.2‰ for δ15N-NO3− and δ18O- NO3−.
For the measurements of δ18O-H2O, the filtered water sample was transferred into a 2 mL chromatographic bottle, the height of the sample volume is ensured to be > 0.5mm, covered with a hollow cap, and placed on the sample holder. The δ18O-H2O values were analyzed by IRMS (Thermo Scientific Delta V Advantage). The analytical precision was ±0.3‰ for δ18O-H2O.
The nitrogen and oxygen isotopic analysis followed (Lawniczak et al., 2016) by the chemical conversion of NO3− and NO2− to N2O. International standards (USGS-32 and USGS-34) were applied to calibrate “blank” samples. The stable isotopic rates were expressed in parts per thousand (‰) relative to N2 in the atmosphere and Vienna Standard Mean Ocean Water for δ15N and δ18O, respectively:
In Eq. 1, δsample is the stable isotope ratio in the samples. Rsample and Rstandard are the ratios of 15N/14Nor 18O/16O in the samples and the standards, and the reference standards of N and O are atmospheric nitrogen and Vienna standard mean ocean water (V-SMOW), respectively. Sample analysis had an average precision of±0.2‰ for δ15N and δ18O (Breitburg et al., 2018).
2.1.4 Multivariate statistical analysis
Principal component analysis (PCA) simplifies the complexity in high-dimensional data while retaining trends and patterns. It does this by transforming the data into fewer dimensions, which act as summaries of features (Lever et al., 2017). PCA takes a small number of comprehensive indicators to characterize the research objective through dimensionality reduction and obtains the components of eigenvalues greater than 1, defined as the main components (PCs). The Kaiser normalized orthogonal rotation were used to obtain the load of each component. When using the PCA model, the raw data is first converted to a dimensionless standardized form to eliminate the impact of different dimensions (Jenkins and Doney, 2008).
where zij is the normalized value; cij is the concentration of element i in sample j, i = 1,2,3, … , n, j = 1,2,3, … , m; ci and σi are the mean concentration and standard deviation for element i, respectively.
Then, the PCA model can be expressed as:
where k = 1, … , p, represents the different sources of pollution, gik represents the concentration of element i in the pollution source k, also known as the factor load and hkj represents the contribution of the pollution source k to the sample j, called the factor score.
2.1.5 MixSIAR model
In order to reduce the uncertainty of source registration due to the overlap of multisource NO3− stable isotopes and the fractionation of δ15N-NO3− and δ18O- NO3− during transition, the contribution ratio of different sources was quantitatively evaluated using Bayesian isotope mixing model (MixSIAR) (Archana et al., 2018). In this study, the MixSIAR model (https://github.com/brianstock/MixSIAR/issues) was applied to estimate proportional contributions of NO3− sources to river water samples. MixSIAR model is also applicable when multiple pollution sources exist simultaneously, and the uncertainty of the data is taken into account. By defining J isotopes of K sources and N mixtures, the equations were as follows (Xia et al., 2018).
In Eq. 4, Xij is the isotope value j of the water sample i (i = 1, 2, 3 … ,N; j = 1,2,3 … ,J); Pk is the proportional contribution of source k, which is calculated using MixSIAR; Sjk is the isotope value j of source k (k = 1, 2, 3 … , K) and followed a normal distribution with mean µjk and standard deviation ω2jk; Cjk is the fractionation factor for isotope j on source k and followed a normal distribution with mean λjk and standard deviation τ2 jk; and εij is the residual error for isotope value j in mixed sample and followed a normal distribution with mean = 0 and standard deviation σ2.
In the study of predecessors, atmospheric deposition (AD), nitrogen from soil (SN), nitrogen fertilizer (NF), and manure and sewage (M&S) these four sources are generally used to analyze NO3−(Chen et al., 2020b; Chang et al., 2022; Shi et al., 2022). And Ji et al. (2017) used these four sources to analyze NO3−in Changle river which was one of the main tributaries of the Cao-E River (Ji et al., 2017). In this study, we assumed that all riverine NO3−-N contamination derived from these four sources. As shown in Table 1, the mean δ15N value was 5.0‰ ± 1.5‰ for SN(Diaz and Rosenberg, 2008), which was in the reported ranges summarized by (Tobari et al., 2010). Then, measured the δ15N of synthetic fertilizers when studying several rivers located in the Loess Plateau (Zhao et al., 2020). The δ15N range of ammonium bicarbonate/urea/ammonium sulfate was 0.3‰ ± 3.0‰. Finally, the mean δ15N value of M&S was 11.3‰ ± 0.2‰ (Zhang et al., 2018b).
2.2 Results and discussion
2.2.1 Characterization of hydrochemistry in dry and wet season
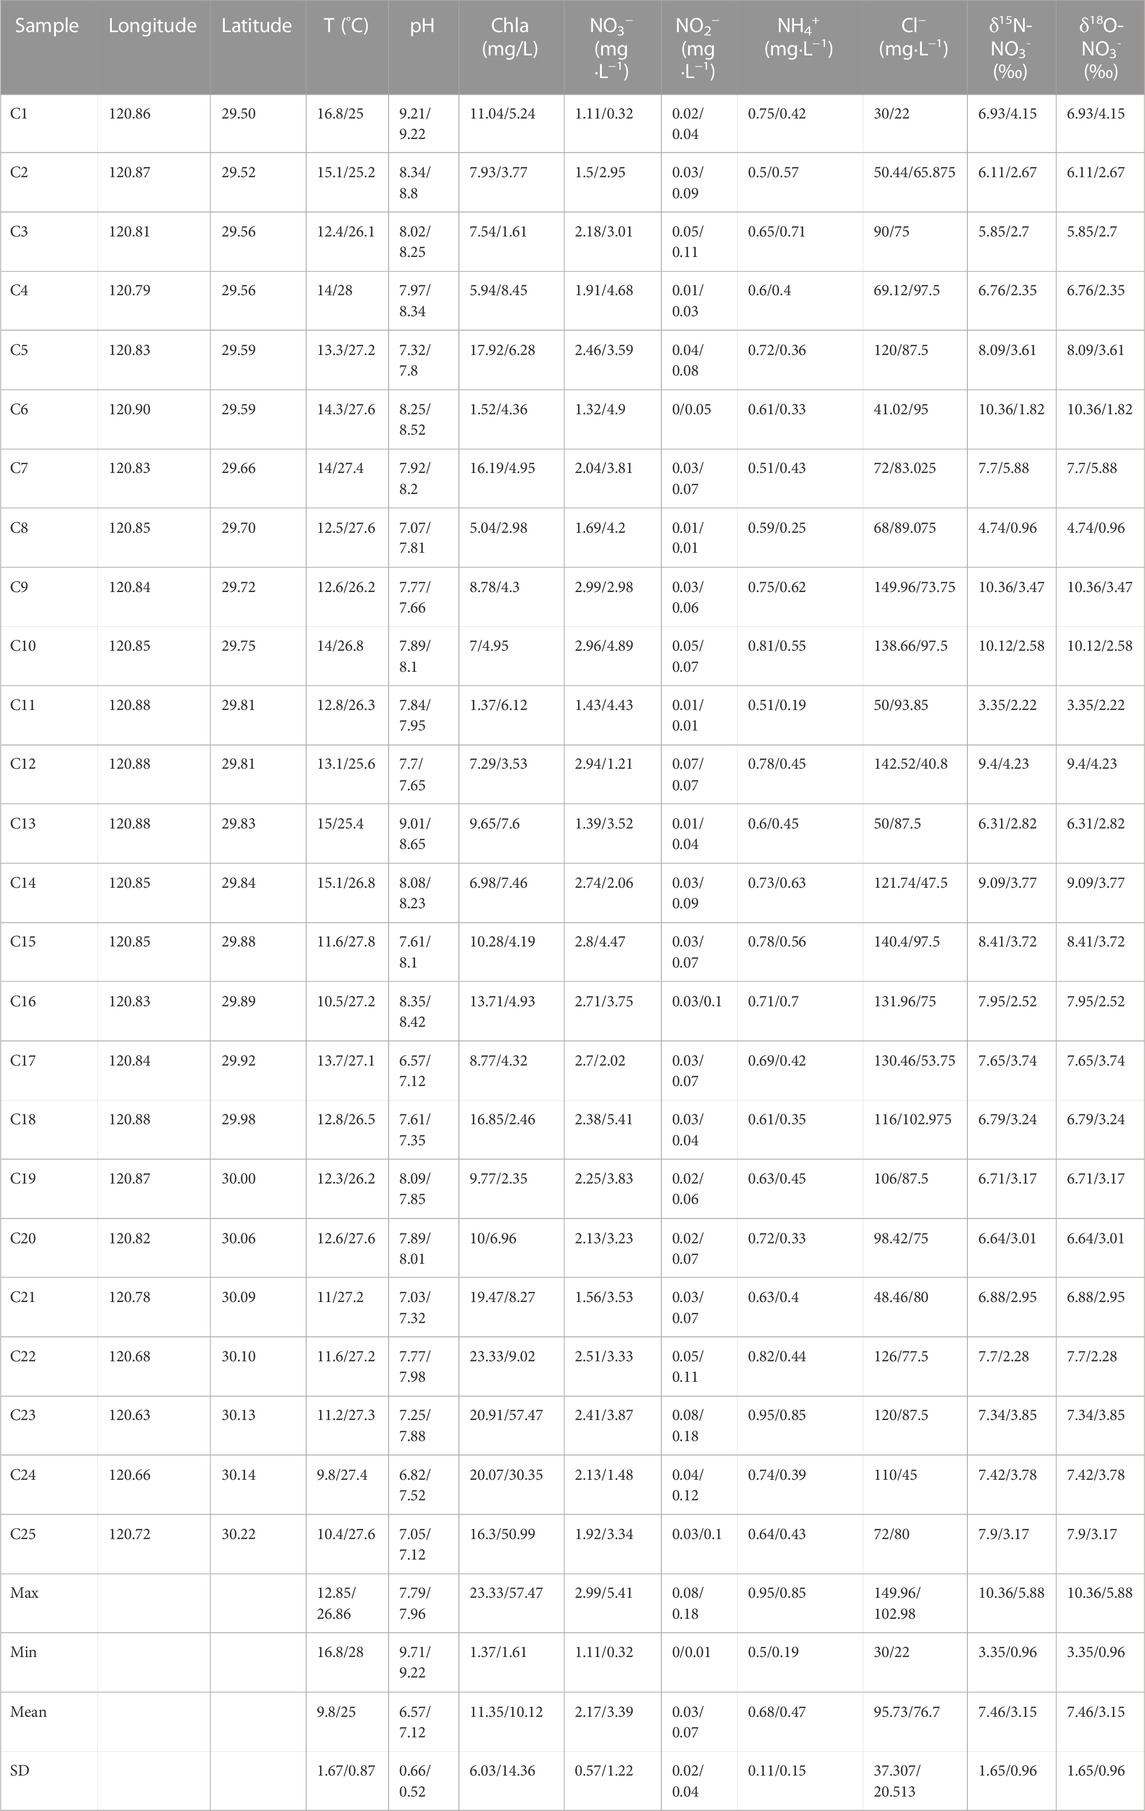
A summary of water quality variables measured at the 25 sampling sites in dry/wet season of the Cao-E River is provided in Table 2. In dry season, NO3− concentrations of samples collected in the water body ranged from 1.11 to 2.99 mgL−1, with an average concentration of 2.17 mgL−1, the concentration of NO2− is from 0.004 to 0.08 mgL−1, with an average of 0.03 mgL−1, and the concentration of NH4+ ranges from 0.50 to 0.95 mgL−1, with an average value of 0.68 mgL−1. In wet season, NO3− concentrations of samples collected in the water body ranged from 0.32 to 5.41 mgL−1, with an average concentration of 3.39 mgL−1, the concentration of NO2− is from 0.01 to 0.18 mgL−1, with an average of 0.07 mgL−1, and the concentration of NH4+ ranges from 0.19 to 0.85 mgL−1, with an average value of 0.47 mgL−1. The concentration of NO3− in water in wet season was higher than that in dry season. In general, NO3− accounted for the highest concentration of inorganic nitrogen (Figure 2) and was the main pollutant, followed by NH4+ and then NO2 -.
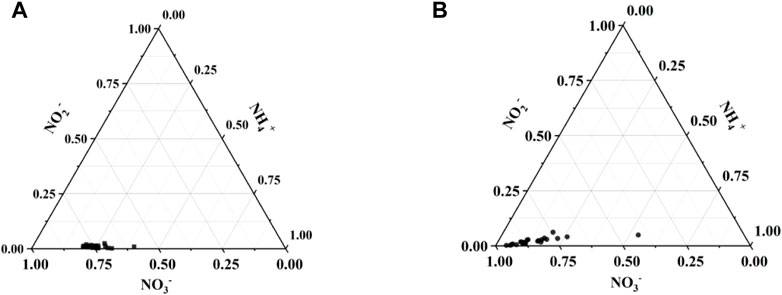
FIGURE 2. Triangular phase diagrams of three inorganic nitrogen concentrations; (A) dry season, (B) wet season.
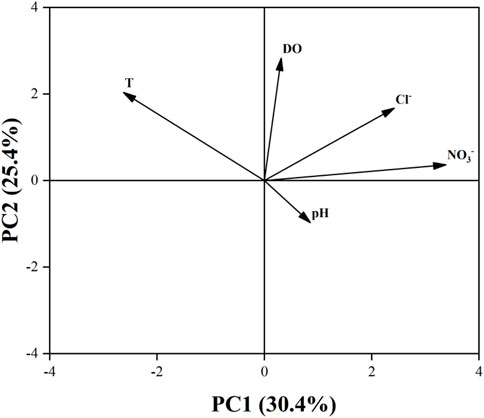
Through principal component analysis of the original data of five water chemical components (pH、DO、NO3−、Cl−、T) at 25 sampling points of Cao-E River, the result shows that the contribution of the five PCs is 30.42, 25.39, 19.84, 15.01% and 9.34%, respectively, (Table 3). Figure 3 shows five water chemistry parameters of the first two PCs. The greater the projection of this parameter on the axis, the greater the load of this parameter on the PC. Parameters that are ipsilateral on the x- or y-axis indicate that there is a positive correlation between these parameters, while there is a negative correlation in other cases. In PC 1, Cl− and DO are the larger loads, and there is a positive correlation between them (Figure 3). The strong correlation between DO and NO3− suggests that the concentration of NO3− in the Cao-E River Basin may be affected by the redox environment. Ruiza et al. (2003) studied the behaviour of the nitrification system during consecutive changes in DO values. The results showed that DO had no influence on NO3− accumulation at values of 2.7–5.7 mg/L. The DO concentrations of the basin averaged at 10.15 mg/L in dry season, and at 9.03 mg/L in wet season, suggesting oxidation environment (Ruiz et al., 2003). So NO3− can exist stably in the basin, not reduced to NO2−, nor affected by redox in water.

TABLE 3. Eigenvalue, Variance, Cumulative Variance, and loading values in PC1 and PC2 of PCA analysis.
Cl− is a stable tracer that is not affected by changes in NO3− content (Xia et al., 2016), and it can often be used as an indicator of different pollution sources (KELLMAN and HILLAIRE-MARCEL, 1998; Mengis et al., 1999) due to the good stability of Cl−. Potential sources of Cl− in rivers may be industry, domestic sewage and manure, application of agricultural fertilizer, etc. It can be seen from Figure 4 that the NO3−concentration basically varies with the Cl− concentration in the dry season and the wet season is basically consistent. So the correlation analysis between Cl− and NO3− is carried out, as shown in Figure 5, Cl− have a positive relationship with NO3− (R2 = 0.96 in the dry season, R2 = 0.954 in the wet season). Therefore, the source of NO3− can be roughly revealed based on the source of Cl−. Combined with the distribution of factories and soil utilization in the Cao-E River Basin, it is speculated that the source of NO3− pollution may come from fertilizer, manure or sewage.

FIGURE 4. Trend of NO3− and Cl− concentrations at each sampling point; (A) dry season, (B) wet season.
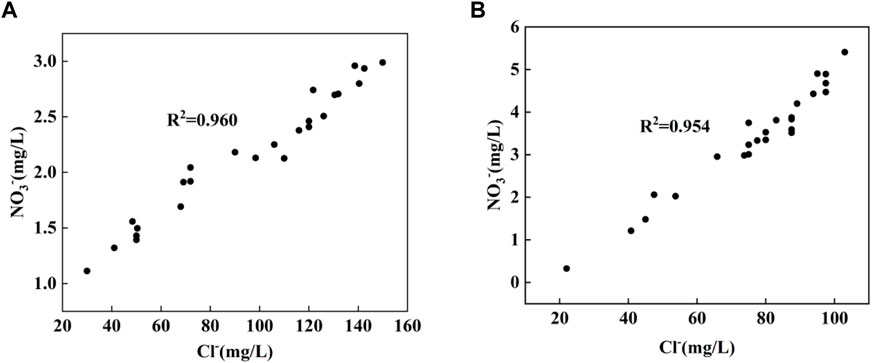
FIGURE 5. Correlation between NO3− and Cl− concentrations in the study area; (A) dry season, (B) wet season.
2.2.2 Study on the law of NO3− migration and transformation in water
The use of dual NO3− isotopes (δ15N–NO3− andδ18O–NO3−) to identify the source of NO3− in rivers is based on the fact that NO3− can maintain a certain stability after entering the water body. However, there is a difficulty that possible denitrification in rivers will cause the fractionation of NO3− to change the composition of NO3− source isotopes (Paredes et al., 2018; Paredes et al., 2019). Therefore, the migration and transformation of NO3− in rivers needs to be studied. Recent studies have shown that nitrification is the main process of nitrogen conversion in aquatic systems (Ye et al., 2015).
Denitrification refers to the process of reducing NO3− to N2 and N2O under anaerobic conditions, which can effectively reduce the pollution degree of NO3− in water (Mayer et al., 2002). In this process, the δ15N and δ 18O value of residual NO3− in the water body increases (Kendall et al., 2007). Relevant studies have shown that denitrification leads to a ratio of δ15N and δ18O in aquatic systems of 1: 1 (Ye et al., 2021). The ratio of the two in all samples is not 1:1. And from Figure 6, it can be seen that there is no significant negative correlation between δ15N and δ18O (dry season, R2 = 0.062; wet season, R2 = 0.040). Therefore, denitrification is not the dominant process of nitrogen conversion in the study area during sampling. The DO concentrations of the basin averaged at 10.15 mg/L in dry season, and at 9.03 mg/L in wet season. This also suggested that denitrification was not likely to occur and was not the process responsible for causing the enrichment of δ15N- NO3− in study area, since denitrification generally occurs at low DO (<5 mg/L−1) conditions. This is consistent with the results of Xing and Liu(Xing and Liu, 2016).
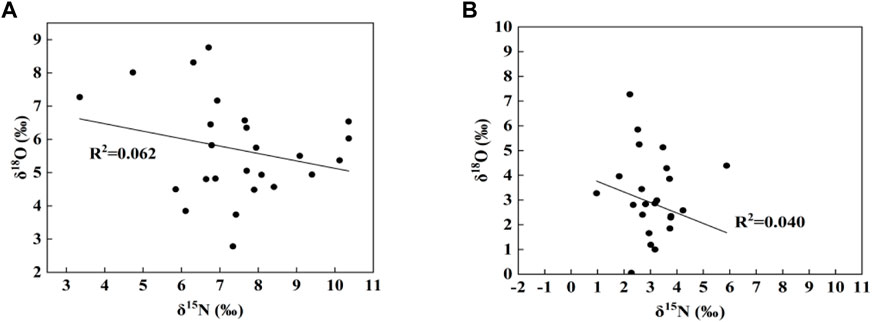
FIGURE 6. Characteristic values of δ15N-NO3− and δ18O-NO3− isotopes in the study area; (A)dry season, (B)wet season.
The relationship between δ18O-NO3− and δ15N-NO3− further demonstrates the nitrification process. In the nitrification process, one-third of the oxygen atoms of the nitrified NO3− come from atmospheric oxygen and two out of three oxygen atoms come from H2O in the environment (Kendall et al., 2007; Xue et al., 2009). Therefore, the theoretical value of δ18O-NO3− obtained from nitrification reaction can be calculated from Equation 5.
Among them, δ18O-NO3− is the theoretical δ18O value of NO3− derived from nitrification, δ18O-H2O is the δ18O value of water samples measured in this study, and δ18O-O2 is the δ18O value of atmospheric oxygen, which is generally considered to be 23.5‰(Kendall et al., 2007).
The exchange of oxygen atoms occurs during nitrification reactions, especially in the final nitrification step of nitrate generation, where oxygen atoms are added from water (Wells et al., 2019). The results of the oxidation reaction showed that the δ18O-NO3− value was closer to the δ18O-H2O value (Sigman et al., 2009; Casciotti et al., 2010). In addition, studies have reported that less than one-sixth of the oxygen atoms in the NO3− after nitrification come from atmospheric oxygen and the rest from H2O(Kool et al., 2011). According to Xuan et al. (2020) study, another theoretical formula for δ18O-NO3− Equation 6 (Xuan et al., 2020).
The function plots of theoretical δ18O-NO3− and δ18O-H2O are shown in Figure 7 with theoretical lines 1) and 2), respectively, and almost all samples are located between the two theoretical lines. δ18O-NO3− and δ18O-H2O increased at the same time in the Cao-E River Basin, indicating that nitrification process occurred in the basin. According to the above δ18O-NO3−, δ18O-H2O and δ15N- NO3− isotope analysis results, nitrification occurs in almost all surface water as the main NO3− conversion process.
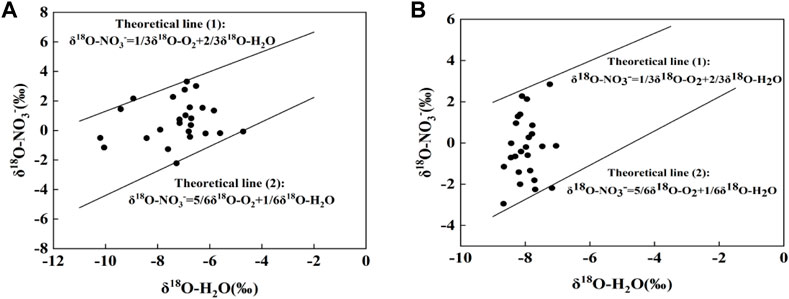
FIGURE 7. Point plot (δ18O-NO3− versus δ18O-H2O) of surface water and theoretical Eqs 5, 6 to indicate the presence of nitrification in study area; (A)dry season, (B)wet season.
2.2.3 Identification of NO3− sources by dual isotopes
Different NO3− sources show different isotopes signals and can be used to qualitatively evaluate the source of NO3− inputs (Ji et al., 2017). The traditional dual isotope bi-plot method made it easier to identify the main factors influencing NO3− concentrations in the river system. Typical δ15N range from −3‰ to +7‰ in precipitation NO3−(Zhang et al., 2019). Nitrogen fertilizer is a commonly used synthetic fertilizer, which is produced by atmospheric N2 fixation. Therefore, the δ15N values of these fertilizers are similar, ranging from −6‰ to +6‰ (Gibson et al., 2005; Xue et al., 2009; Yang et al., 2013). The δ15N-NO3− deposited through soil nitrogen exhibited a large variation, with values ranging from 0 to +8‰ (Kendall, 1998). δ15N-NO3− of M&S are generally high, ranging from +3 to +17‰ (Zhi-Wei et al., 2014). For δ18O, NO3− in precipitation and NO3− fertilizer had the typical value ranging from +25 to +70‰ and +17 to +25‰, respectively (Amberger and Schmidt, 1987; Kendall, 1998), the δ18O- NO3− value from nitrogen fertilizer, N soil and M&S microbial nitrification tends to vary between −5‰ and +15‰(Kendall, 1998; MAYER et al., 2001).
As shown in Figure 8, the δ15N-NO3− and δ18O-NO3− values of most water samples were in the range of manure and sewage, soil nitrogen and nitrogen fertilizer, indicating that the main sources of NO3− in the Cao-E River Basin were these three sources, which was consistent with the results of 3.1 analysis. The isotopic fingerprints of several samples on the three main nitrate sources overlap, which is also important to note. Comparing the source analysis of the wet season and the dry season, it is found that the nitrate sources of soil nitrogen in the wet season are more than those in the dry season, which may be due to more precipitation in the flood period, and the rainwater washes the soil and then flows into the river, resulting in an increase in the nitrate source of soil nitrogen in the Cao-e River Basin.
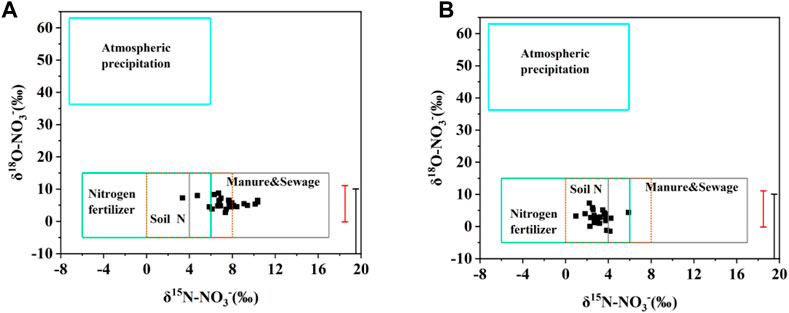
FIGURE 8. Cross plot of δ15N-NO3− and δ18O- NO3− in surface water with typical ranges of stable isotopic composition; (A)dry season, (B)wet season.
2.2.4 Quantification of the dominant sources of NO3−
In order to further quantitatively estimate the proportional contributions of different potential NO3− sources to the riverine NO3− pollution, MixSIAR model was employed. Similarly, we classified the NO3− sources into four groups, i.e., AD, NF, SN and M&S. In this study, we assumed that all riverine NO3− contamination derived from these four sources. For the surface water, the fractionation factor Cjk was set based on Yu et al. (2020) (Zhang et al., 2018a). The MixSIAR model was used to calculate the contribution range of each NO3− source, as shown in Figure 9. The average contribution rate of NO3− in the dry season of Cao-e River is M&S (44.25%)> SN (37.47%)> NF (15.45%)> AD (2.83%), the average contribution rate of NO3− in the wet season is SN (41.69%)> M&S (31.78%)> NF (23.39%)> AD (3.14%).
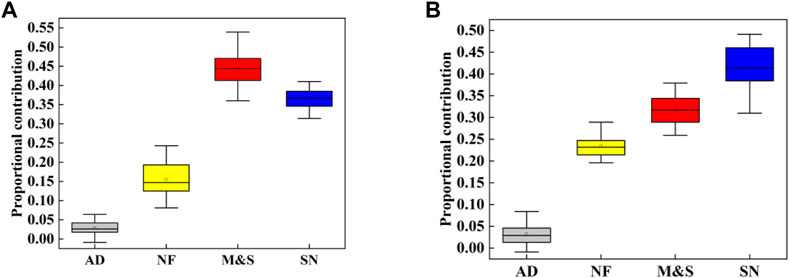
FIGURE 9. Proportional contributions of each pollution source, boxplot denotes the fifth, 95th, mode, and mean values; (A)dry season, (B)wet season.
Studies have shown that NO3− pollution in this basin is mainly due to local direct human activities and soil nitrogen losses (Bowes et al., 2020). As shown in Figure 9, these three sources (i.e., M&S, SN and NF) contribute about 97% of the river’s NO3−. There are many industrial plants in printing and dyeing, chemical industry, tanning, paper making and other industries in the Cao-E River Basin, with a population of 1.53 million living in the basin, which leads to a high M&S contribution rate of 31.78%–44.25%.
The valley plain of the Cao-E River Basin accounts for 18%, hills and mountains account for 82%. The forest coverage rate is as high as 54% (Shen et al., 2011), and water-soluble organic nitrogen in forest soil occupies an important position in soil nitrogen reservoir. For many forests, soil-soluble organic nitrogen levels are more than 100 times higher than NH4+ and NO3− levels (Kalbitz et al., 2000; Wu et al., 2010). Due to the increase of precipitation during the wet season, water-soluble organic nitrogen enters the Cao-E River with the washing rainwater, and they are converted into NO3− under nitrification, resulting in a significant increase in the SN contribution rate during the wet season.
There are 593.33 km2 mu of arable land in the basin, including 48.67 km2 of paddy land and 16.67 km2 of dry land, and the contribution rate of NF in the two seasons (15.45%–23.39%) is smaller than that of SN and M&S. The contribution of NF in the wet season is significantly higher than that in the dry season, which may be due to the fertilization amount in the wet season is more than that in the dry season. The precipitation filters the fertilizer, fertilizer flowing into the Cao-E River with rainwater, resulting in a significant increase in the contribution of NF in the wet season.
In this study, there is a large range for the estimation of the probability of contribution to a single source, which indicates a large uncertainty in the allocation results of the model (Figure 8). However, the MixSIAR model can still effectively calculate the proportional contribution of NO3− sources, which is basically consistent with the analysis results. However, the contribution of AD is not shown in the distribution plot of the contribution rate of a single source, and the analysis results of the MixSIAR model show that the contribution rate of the wet season (3.14%) is slightly greater than that of the dry season (2.28%), which may be due to the increased atmospheric N wet deposition by precipitation (Leeuw et al., 2001) during the wet season.
The uncertainty of the quantitative allocation of NO3− pollution sources mainly come from two factors: 1) the temporal and spatial changes of NO3− sources and their isotopic composition in the basin, and 2) the changes in NO3− isotope values caused by the fractionation process (nitrification, denitrification, assimilation). Therefore, quantitatively determining the initial isotopic composition of different NO3− sources and estimating the isotope fractionation coefficient of each NO3− source is an important task to reduce uncertainty. In future studies, in order to reduce the uncertainty of the results, future research can consider the in-situ fractionation factor to improve the Bayesian mixing model applications, more accurate source isotope data, such as small variance ω2jk, can be used to reduce the uncertainty of the distribution results.
2.3 Conclusion
In this study, water quality parameters, δ15N–NO3− and δ18O–NO3− and MixSIAR models were used to evaluate the conversion and sources of inorganic nitrogen in the Cao-E River Basin. The results showed that NO3− was the main pollutant in the inorganic nitrogen form. After water chemical analysis and the distribution characteristics of δ15N–NO3− and δ18O–NO3−, the nitrogen conversion process of river system was mainly nitrification, and there was no obvious denitrification effect. In addition, the results of the dual isotope method combined with MixSIAR model showed that the contribution of M&S in the dry season was relatively high (44.25%), followed by SN (37.47%), NF (15.45%) and AD (2.83%). The contribution of SN during the wet season was relatively high (41.69%), followed by M&S (31.78%), NF (23.39%), and AD (3.14%). According to the analysis results, it is necessary to strengthen sewage treatment and sewage pipe network construction in the Cao-E River Basin in the future, improve the sewage collection rate, and strengthen water and soil conservation in the basin, so as to reduce the discharge of pollutants in the basin and improve the water ecological environment.
In order to further reduce the uncertainty of isotope allocation, the isotopic characteristic range and isotope fractionation factor of the main NO3− source should be further determined in future studies to more accurately calculate the contribution of NO3− sources. In addition, this study only considers the sources and transformations of NO3− in the wet and dry seasons, and the effects of seasonal changes and spatial distribution will be considered in the next study.
Data availability statement
The raw data supporting the conclusion of this article will be made available by the authors, without undue reservation.
Author contributions
JL: Conceptualization, Investigation, Writing—original draft. QS: Edited Manuscript. KL: Methodology, Supervision, Review. LC: Review, Edited Manuscript. XL: Supervision, Revise. All authors contributed to the article and approved the submitted version.
Funding
This research is financially supported by the National Key Research and Development Program (2021YFC3101700).
Acknowledgments
The authors thank the Chinese Research Academy of Environmental Sciences for their assistance in sample collection.
Conflict of interest
The authors declare that the research was conducted in the absence of any commercial or financial relationships that could be construed as a potential conflict of interest.
Publisher’s note
All claims expressed in this article are solely those of the authors and do not necessarily represent those of their affiliated organizations, or those of the publisher, the editors and the reviewers. Any product that may be evaluated in this article, or claim that may be made by its manufacturer, is not guaranteed or endorsed by the publisher.
References
Administration, T. S. E. P. (2002). The water and wastewater monitoring analysis method editorial board. Beijing: China Environmental Science Press.
Amberger, A., and Schmidt, H. L. (1987). Natürliche Isotopengehalte von Nitrate als Indikatoren für dessen Herkunft. Geochimica Cosmochimica Acta 51, 2699–2705. doi:10.1016/0016-7037(87)90150-5
Archana, A., Thibodeau, B., Geeraert, N., Xu, M. N., Kao, S. J., and Baker, D. M. (2018). Nitrogen sources and cycling revealed by dual isotopes of nitrate in a complex urbanized environment. Water Res. 142, 459–470. doi:10.1016/j.watres.2018.06.004
Bijay, S., and Craswell, E. (2021). Fertilizers and nitrate pollution of surface and ground water: An increasingly pervasive global problem. SN Appl. Sci. 3, 518. doi:10.1007/s42452-021-04521-8
Bowes, M. J., Read, D. S., Joshi, H., Sinha, R., Ansari, A., Hazra, M., et al. (2020). Nutrient and microbial water quality of the upper Ganga river, India: Identification of pollution sources. Environ. Monit. Assess. 192, 533. doi:10.1007/s10661-020-08456-2
Breitburg, D., Levin, L. A., Oschlies, A., Gregoire, M., Chavez, F. P., Conley, D. J., et al. (2018). Declining oxygen in the global ocean and coastal waters. Science 359, eaam7240. doi:10.1126/science.aam7240
Bu, H., Song, X., and Zhang, Y. (2019). Using multivariate statistical analyses to identify and evaluate the main sources of contamination in a polluted river near to the Liaodong Bay in Northeast China. Environ. Pollut. 245, 1058–1070. doi:10.1016/j.envpol.2018.11.099
Burns, D. (2011). Guidelines for drinking-water quality - 4th edition. Asian water Asia's J. Environ. Technol. 27.
Cao, M., Hu, A., Gad, M., Adyari, B., Qin, D., Zhang, L., et al. (2022). Domestic wastewater causes nitrate pollution in an agricultural watershed, China. Sci. Total Environ. 823, 153680. doi:10.1016/j.scitotenv.2022.153680
Casciotti, K. L., McIlvin, M., and Buchwaldb, C. (2010). Oxygen isotopic exchange and fractionation during bacterial ammonia oxidation. Limnol. Oceangr. 55, 753–762. doi:10.4319/lo.2010.55.2.0753
Chang, L., Ming, X., Groves, C., Ham, B., Wei, C., and Yang, P. (2022). Nitrate fate and decadal shift impacted by land use change in a rural karst basin as revealed by dual nitrate isotopes. Environ. Pollut. 299, 118822. doi:10.1016/j.envpol.2022.118822
Chen, F., Lao, Q., Zhang, S., Bian, P., Jin, G., Zhu, Q., et al. (2020a). Nitrate sources and biogeochemical processes identified using nitrogen and oxygen isotopes on the eastern coast of Hainan Island. Cont. Shelf Res. 207, 104209. doi:10.1016/j.csr.2020.104209
Chen, X., Jiang, C., Zheng, L., Dong, X., Chen, Y., and Li, C. (2020b). Identification of nitrate sources and transformations in basin using dual isotopes and hydrochemistry combined with a Bayesian mixing model: Application in a typical mining city. Environ. Pollut. 267, 115651. doi:10.1016/j.envpol.2020.115651
Danni, S. O., Bouchaou, L., Elmouden, A., Brahim, Y. A., and N'da, B. (2019). Assessment of water quality and nitrate source in the Massa catchment (Morocco) using delta (15)N and delta (18)O tracers. Appl. Radiat. Isot. 154, 108859. doi:10.1016/j.apradiso.2019.108859
Diaz, R. J., and Rosenberg, R. (2008). Spreading dead zones and consequences for marine ecosystems. Science 321, 926–929. doi:10.1126/science.1156401
Ding, J., Xi, B., Xu, Q., Su, J., Huo, S., Liu, H., et al. (2015). Assessment of the sources and transformations of nitrogen in a plain river network region using a stable isotope approach. J. Environ. Sci. 30, 198–206. (China). doi:10.1016/j.jes.2014.10.006
Fischer, H. B., List, E. J., Koh, R., Imberger, J., and Brooks, N. H. (1979). Chapter 5-Mixing in rivers. Mix. Inland Coast. Waters, 104–147. doi:10.1016/B978-0-08-051177-1.50009-X
Gibson, J. J., Edwards, T. W. D., Birks, S. J., St Amour, N. A., Buhay, W. M., McEachern, P., et al. (2005). Progress in isotope tracer hydrology in Canada. Hydrol. Process. 19, 303–327. doi:10.1002/hyp.5766
Jenkins, G., and Doney, S. (2008). Principal component and factor analysis. Modeling Methods for Marine Science, 81–117.
Ji, X., Xie, R., Hao, Y., and Lu, J. (2017). Quantitative identification of nitrate pollution sources and uncertainty analysis based on dual isotope approach in an agricultural watershed. Environ. Pollut. 229, 586–594. doi:10.1016/j.envpol.2017.06.100
Ji, X., Shu, L., Chen, W., Chen, Z., Shang, X., Yang, Y., et al. (2022). Nitrate pollution source apportionment, uncertainty and sensitivity analysis across a rural-urban river network based on δ15N/δ18O-NO3− isotopes and SIAR modeling. J. Hazard Mater 438, 129480. doi:10.1016/j.jhazmat.2022.129480
Jin, S., Lu, J., Chen, D., Shen, Y., and Shi, Y. (2009). Relationship between catchment characteristics and nitrogen forms in Cao-E River Basin, eastern China. J. Environ. Sci. 21, 429–433. (China). doi:10.1016/s1001-0742(08)62287-1
Kalbitz, K., Solinger, S., Park, J. H., Michalzik, B., and Matzner, E. (2000). Controls on the dynamics of dissolved organic matter in soils: A review. Soil Sci. 165, 277–304. doi:10.1097/00010694-200004000-00001
Kellman, L., and Hillaire-Marcel, C. (1998). Nitrate cycling in streams: Using natural abundances of NO3- -δ15N to measure in-situ denitrification. Biogeochemistry 43, 273–292. doi:10.1023/a:1006036706522
Kendall, C., Elliott, E. M., and Wankel, S. D. (2007). “Tracing anthropogenic inputs of nitrogen to ecosystems,” in Stable isotopes in ecology and environmental science, second edition.
Kool, D. M., Wrage, N., Oenema, O., Van Kessel, C., and Van Groenigen, J. W. (2011). Oxygen exchange with water alters the oxygen isotopic signature of nitrate in soil ecosystems. Soil Biol. Biochem. 43, 1180–1185. doi:10.1016/j.soilbio.2011.02.006
Kumar, A., Ajay, A., Dasgupta, B., Bhadury, P., and Sanyal, P. (2023). Deciphering the nitrate sources and processes in the Ganga river using dual isotopes of nitrate and Bayesian mixing model. Environ. Res. 216, 114744. doi:10.1016/j.envres.2022.114744
Lao, Q., Chen, F., Liu, G., Chen, C., Jin, G., Zhu, Q., et al. (2019). Isotopic evidence for the shift of nitrate sources and active biological transformation on the Western coast of Guangdong Province, South China. Mar. Pollut. Bull. 142, 603–612. doi:10.1016/j.marpolbul.2019.04.026
Lawniczak, A. E., Zbierska, J., Nowak, B., Achtenberg, K., Grzeskowiak, A., and Kanas, K. (2016). Impact of agriculture and land use on nitrate contamination in groundwater and running waters in central-west Poland. Environ. Monit. Assess. 188, 172. doi:10.1007/s10661-016-5167-9
Leeuw, G. D., Cohen, L., Frohn, L. M., Geernaert, G., Vignati, E., Jensen, B., et al. (2001). Atmospheric input of nitrogen into the north Sea: ANICE project overview. Cont. Shelf Res. 21, 2073–2094. doi:10.1016/s0278-4343(01)00043-7
Lever, J., Krzywinski, M., and Altman, N. (2017). Principal component analysis. Nat. Methods 14, 641–642. doi:10.1038/nmeth.4346
Mayer, B., Bollwerk, S. M., Mansfeldt, T., Hutter, B., and Veizer, J. (2001). The oxygen isotope composition of nitrate generated by nitrification in acid forest floors. Geochimica Cosmochimica Acta 65, 2743–2756. doi:10.1016/s0016-7037(01)00612-3
Mayer, B., Boyer, E. W., Goodale, C., Jaworeki, N. A., Breemen, N. V., Howarth, R. W., et al. (2002). Sources of nitrate in rivers draining sixteen watersheds in the northeastern U.S.: Isotopic constraints. Biogeochemistry 57, 171–197. doi:10.1023/a:1015744002496
Mengis, M., Schif, S. L., Harris, M., English, M. C., Aravena, R., Elgood, R. J., et al. (1999). Multiple geochemical and isotopic approaches for assessing ground water NO3- elimination in a riparian zone. Ground Water 37, 448–457. doi:10.1111/j.1745-6584.1999.tb01124.x
Paredes, I., Ramírez, F., Forero, M. G., and Green, A. J. (2018). Stable isotopes in halophytes reflect anthropogenic nitrogen pollution in entry streams at the Doñana World Heritage Site. Ecol. Indic. 97, 130–140. doi:10.1016/j.ecolind.2018.10.009
Ruiz, G., Jeison, D., and Chamy, R. (2003). Nitrification with high nitrite accumulation for the treatment of wastewater with high ammonia concentration. Water Res. 37, 1371–1377. doi:10.1016/s0043-1354(02)00475-x
Shen, Y.-N., Lü, J., Chen, D.-J., and Shi, Y.-M. (2011). Response of stream pollution characteristics to catchment land cover in Cao-E River Basin, China. Pedosphere 21, 115–123. doi:10.1016/s1002-0160(10)60086-0
Shi, W.-m., Zhang, Y., Zhang, C.-q., and Zhang, W.-r. (2022). Sources and health risks of nitrate pollution in surface water in the Weihe River watershed, China. J. Mt. Sci. 19, 2226–2240. doi:10.1007/s11629-021-7301-6
Sigman, D. M., DiFiore, P. J., Hain, M. P., Deutsch, C., Wang, Y., Karl, D. M., et al. (2009). The dual isotopes of deep nitrate as a constraint on the cycle and budget of oceanic fixed nitrogen. Deep Sea Res. Part I Oceanogr. Res. Pap. 56, 1419–1439. doi:10.1016/j.dsr.2009.04.007
Soto, D. X., Koehler, G., Wassenaar, L. I., and Hobson, K. A. (2019). Spatio-temporal variation of nitrate sources to Lake Winnipeg using N and O isotope (δ15N, δ18O) analyses. Sci. Total Environ. 647, 486–493. doi:10.1016/j.scitotenv.2018.07.346
Tobari, Y., Koba, K., Fukushima, K., Tokuchi, N., Ohte, N., Tateno, R., et al. (2010). Contribution of atmospheric nitrate to stream-water nitrate in Japanese coniferous forests revealed by the oxygen isotope ratio of nitrate. Rapid Commun. Mass Spectrom. 24, 1281–1286. doi:10.1002/rcm.4498
Valiente, N., Gil-Márquez, J. M., Gómez-Alday, J. J., and Andreo, B. (2020). Unraveling groundwater functioning and nitrate attenuation in evaporitic karst systems from southern Spain: An isotopic approach. Appl. Geochem. 123, 104820. doi:10.1016/j.apgeochem.2020.104820
Vidal, E. A., Alvarez, J. M., Araus, V., Riveras, E., Brooks, M. D., Krouk, G., et al. (2020). Nitrate in 2020: Thirty years from transport to signaling networks. Plant Cell. 32, 2094–2119. doi:10.1105/tpc.19.00748
Wang, A., Fang, Y., Chen, D., Phillips, O., Koba, K., Zhu, W., et al. (2018). High nitrogen isotope fractionation of nitrate during denitrification in four forest soils and its implications for denitrification rate estimates. Sci. Total Environ. 633, 1078–1088. doi:10.1016/j.scitotenv.2018.03.261
Wang, W., Yu, Z., Song, X., Chi, L., Wu, Z., and Yuan, Y. (2023). Nitrate dynamics and source apportionment on the East China Sea shelf revealed by nitrate stable isotopes and a Bayesian mixing model. Sci. Total Environ. 869, 161762. doi:10.1016/j.scitotenv.2023.161762
Wells, N. S., Clough, T. J., Johnson-Beebout, S. E., Elberling, B., and Baisden, W. T. (2019). Effects of denitrification and transport on the isotopic composition of nitrate (δ18O, δ15N) in freshwater systems. Sci. Total Environ. 651, 2228–2234. doi:10.1016/j.scitotenv.2018.10.065
Wu, J. S., Jiang, P. K., Chang, S. X., Xu, Q. F., and Lin, Y. (2010). Dissolved soil organic carbon and nitrogen were affected by conversion of native forests to plantations in subtropical China. Can. J. Soil Sci. 90, 27–36. doi:10.4141/cjss09030
Xia, Y., Weller, D. E., Williams, M. N., Jordan, T. E., and Yan, X. (2016). Using Bayesian hierarchical models to better understand nitrate sources and sinks in agricultural watersheds. Water Res. 105, 527–539. doi:10.1016/j.watres.2016.09.033
Xia, X., Zhang, S., Li, S., Zhang, L., Wang, G., Zhang, L., et al. (2018). The cycle of nitrogen in river systems: Sources, transformation, and flux. Environ. Sci. Process Impacts 20, 863–891. doi:10.1039/c8em00042e
Xia, X., Li, S., Wang, F., Zhang, S., Fang, Y., Li, J., et al. (2019). Triple oxygen isotopic evidence for atmospheric nitrate and its application in source identification for river systems in the Qinghai-Tibetan Plateau. Sci. Total Environ. 688, 270–280. doi:10.1016/j.scitotenv.2019.06.204
Xie, H., Li, J., and Liu, D. (2021). Characteristics and traceability analysis of nitrate pollution in the Yellow River Delta, China. IOP Conf. Ser. Earth Environ. Sci. 821, 012020. doi:10.1088/1755-1315/821/1/012020
Xing, M., and Liu, W. (2012). Variations in the concentration and isotopic composition of nitrate nitrogen in wet deposition and their relation with meteorological conditions in Xi'an city, Northwest China. Applied Geochemistry 4, 831–840.
Xing, M., and Liu, W. (2016). Using dual isotopes to identify sources and transformations of nitrogen in water catchments with different land uses, Loess Plateau of China. Environ. Sci. Pollut. Res. Int. 23, 388–401. doi:10.1007/s11356-015-5268-y
Xing, M., Liu, W. G., and Hu, J. (2010). Using nitrate isotope to trace the nitrogen pollution in Chanhe and Laohe river. Huan jing ke xue= Huanjing kexue / [bian ji, Zhongguo ke xue yuan huan jing ke xue wei yuan hui “Huan jing ke xue” bian ji wei yuan hui 31, 2305–2310.
Xuan, Y., Tang, C., and Cao, Y. (2020). Mechanisms of nitrate accumulation in highly urbanized rivers: Evidence from multi-isotopes in the Pearl River Delta, China. J. Hydrology 587, 124924. doi:10.1016/j.jhydrol.2020.124924
Xue, D., Botte, J., De Baets, B., Accoe, F., Nestler, A., Taylor, P., et al. (2009). Present limitations and future prospects of stable isotope methods for nitrate source identification in surface- and groundwater. Water Res. 43, 1159–1170. doi:10.1016/j.watres.2008.12.048
Yang, L., Han, J., Xue, J., Zeng, L., Shi, J., Wu, L., et al. (2013). Nitrate source apportionment in a subtropical watershed using Bayesian model. Sci. Total Environ. 463-464, 340–347. doi:10.1016/j.scitotenv.2013.06.021
Ye, F., Ni, Z., Xie, L., Wei, G., and Jia, G. (2015). Isotopic evidence for the turnover of biological reactive nitrogen in the Pearl River Estuary, south China. J. Geophys. Res. Biogeosciences 120, 661–672. doi:10.1002/2014jg002842
Ye, H., Tang, C., and Cao, Y. (2021). Sources and transformation mechanisms of inorganic nitrogen: Evidence from multi-isotopes in a rural-urban river area. Sci. Total Environ. 794, 148615. doi:10.1016/j.scitotenv.2021.148615
Yu, J., Zhang, W., Tan, Y., Zong, Z., Hao, Q., Tian, C., et al. (2021). Dual-isotope-based source apportionment of nitrate in 30 rivers draining into the Bohai Sea, north China. Environ. Pollut. 283, 117112. doi:10.1016/j.envpol.2021.117112
Zhang, W., Jin, X., Liu, D., Lang, C., and Shan, B. (2017). Temporal and spatial variation of nitrogen and phosphorus and eutrophication assessment for a typical arid river - Fuyang River in northern China. J. Environ. Sci. 55, 41–48. doi:10.1016/j.jes.2016.07.004
Zhang, M., Zhi, Y., Shi, J., and Wu, L. (2018a). Apportionment and uncertainty analysis of nitrate sources based on the dual isotope approach and a Bayesian isotope mixing model at the watershed scale. Sci. Total Environ. 639, 1175–1187. doi:10.1016/j.scitotenv.2018.05.239
Zhang, Y., Shi, P., Li, F., Wei, A., Song, J., and Ma, J. (2018b). Quantification of nitrate sources and fates in rivers in an irrigated agricultural area using environmental isotopes and a Bayesian isotope mixing model. Chemosphere 208, 493–501. doi:10.1016/j.chemosphere.2018.05.164
Zhang, Y., Shi, P., Song, J. X., and Li, Q. (2019). Application of nitrogen and oxygen isotopes for source and fate identification of nitrate pollution in surface water: A review. Appl. Sciences-Basel 9, 18. doi:10.3390/app9010018
Zhang, X., Zhang, Y., Shi, P., Bi, Z., Shan, Z., and Ren, L. (2021). The deep challenge of nitrate pollution in river water of China. Sci. Total Environ. 770, 144674. doi:10.1016/j.scitotenv.2020.144674
Zhao, Y., Dang, J., and Wang, F. (2020). Sources of nitrogen pollution in upstream of fence river reservoir based on the nitrogen and oxygen stable isotope. J. Chem. 2020, 1–8. doi:10.1155/2020/6574210
Zhi-Wei, X. U., Xin-Yu, Z., Gui-Rui, Y. U., Xiao-Min, S., and Xue-Fa, W. (2014). Review of dual stable isotope technique for nitrate source identification in surface-and groundwater in China. Huan jing ke xue= Huanjing kexue/[bian ji, Zhongguo ke xue yuan huan jing ke xue wei yuan hui "Huan jing ke xue" bian ji wei yuan hui] 35, 3230–3238. doi:10.13227/j.hjkx.2014.08.056
Keywords: Nitrogen, isotopes sources, transformation, MixSIAR model, source trace atmospheric deposition, soil N reservoir, fertilizer, manure and sewage. combining
Citation: Li J, Sun Q, Lei K, Cui L and Lv X (2023) Using dual stable isotopes method for nitrate sources identification in Cao-E River Basin, Eastern China. Front. Environ. Sci. 11:1200481. doi: 10.3389/fenvs.2023.1200481
Received: 05 April 2023; Accepted: 20 June 2023;
Published: 30 June 2023.
Edited by:
Aiju Liu, Shandong University of Technology, ChinaCopyright © 2023 Li, Sun, Lei, Cui and Lv. This is an open-access article distributed under the terms of the Creative Commons Attribution License (CC BY). The use, distribution or reproduction in other forums is permitted, provided the original author(s) and the copyright owner(s) are credited and that the original publication in this journal is cited, in accordance with accepted academic practice. No use, distribution or reproduction is permitted which does not comply with these terms.
*Correspondence: Kun Lei, a3VubGVpX2NyYWVzQDE2My5jb20=
 Jiangnan Li
 Qianhang Sun1,2