 Zihan Guo
 Lijuan Cao
 Jianping Guo
 Mengjiao Shang
 Xiaoran Guo1
- 1State Key Laboratory of Severe Weather, Chinese Academy of Meteorological Sciences, Beijing, China
- 2National Meteorological Information Center, China Meteorological Administration, Beijing, China
Our knowledge of sea breeze remains poor in the coastal area of East China, due largely to the high terrain heterogeneity. Five–year (2016–2020) consecutive wind observations from a 10-m wind tower and radar wind profiler are used to characterize the sea–land breeze at Qingdao, a coastal city in East China. The sea surface temperatures at the nearby buoy station in the Yellow Sea are further used to elucidate the land–sea thermal contrast. First of all, three types of sea breeze are determined according to the temporal evolution of wind direction, including pure sea breeze (PSB), corkscrew sea breeze (CSB) and backdoor sea breeze (BSB). Statistically, there are 522 days experiencing sea breezes, of which 61 days belong to pure sea breeze, 40 days witness corkscrew sea breeze, and only 2 days see the backdoor sea breeze. The occurrence of sea breeze is found to peak from April to September and the average wind speed lies at 3–5 m s−1. This suggests a salient seasonality of sea breeze at Qingdao, which is likely caused by the seasonal dependence of land–sea thermal contrast. In terms of the diurnal variability, the sea breezes tend to occur more frequently and have more intensity in the afternoon compared with in the morning, irrespective of sea breeze types. Interestingly, the backdoor sea breeze is merely observed in autumn, whereas corkscrew sea breeze and pure sea breeze can be found year round. Among all types of sea breeze, the pure sea breeze has the highest intensity and most frequency throughout the daytime, same in the seasons of spring, summer and autumn. Further analyses are conduced of the atmospheric circulation, lower troposphere stability and bulk Richard number (Ri) for three types of sea breeze. Both pure sea breeze and corkscrew sea breeze in Qingdao are characterized by prevailing westerlies at 500 hPa. In contrast, the backdoor sea breeze is generally accompanied with easterlies at 850 hPa. Meanwhile, the backdoor sea breeze has the lowest lower troposphere stability, in sharp contrast to the highest lower troposphere stability for the pure sea breeze. This indicates that the backdoor sea breeze (pure sea breeze) tends to occur in an unstable (stable) lower troposphere. The findings obtained here highlight the importance of typing sea breeze.
1 Introduction
Offshore wind is one of the most important sources of renewable energy. The global offshore wind report 2021 released by the Global Wind Energy Council (GWEC) pointed out that the global offshore wind power installation has maintained a stable growth momentum in the past year. From now to 2050, offshore wind energy will become the focus of global decarbonization. Wind power has been affected by the re-cent drop observed in near–surface wind speed, which is mainly attributed to global warming (Tian et al., 2019). Nevertheless, the efficient utilization of sea–land breeze can to some ex-tent fill up the gap of wind power generation caused by the reduction of surface wind speed. The sea–land breeze circulation is a mesoscale atmospheric circulation phenomenon (Fisher, 1960; Zhu and Lin, 2000; Fujibe and Fumiaki, 1985) at the junction of sea and land in the lower atmosphere due to the land–sea thermal contrast. There are many previous studies devoted to the field of sea–land breeze, which can be summarized into three categories: observational analyses (Ma et al., 2021; Zhao et al., 2022), theoretical calculation (Jeffreys, 1922) and numerical simulation (Pearce, 1955). In the early phase, meteorological balloons and ships were the main instruments used for observational research (Fisher, 1960; Feit, 1969; Simpson et al., 1977; Kozo, 1982; Kraus et al., 1990; Kingsmill, 1995; Laird et al., 1995). Later on, it developed into a complex numerical simulation after the 1950s (Pearce, 1955; Rani et al., 2010; Lin et al., 2019).
As a unique mesoscale and microscale circulation system in coastal areas, sea–land breeze will affect the distribution of local temperature (Pokhrel and Lee, 2011; Naor et al.,. 2017), humidity and wind field (Zhuang et al., 2005; Gao et al., 2013), thus affecting the local climate and ecological environment (Garrett and Zhao, 2006; Garrett et al., 2010; Ryu and Baik, 2013; Ganbat et al., 2015; Yang et al., 2018). In addition, sea–land breeze circulation is recognized to dramatically affect the diffusion and transport of aerosols, which further interact with strong convective clouds, thereby bringing about various meteorological disasters to coastal areas (Guo et al., 2016; Meng and Tang, 2019; Li et al., 2019) and cause damage to people, urban buildings and economy (Phan and Manomaiphiboon, 2012). Huang and Chan (2011, 2012) showed that the interaction between southwest monsoon and East Asian continental sea–land breeze contributes to the formation of morning and afternoon convection in the South China Sea. Sheng et al. (2009) and Huang and Wang (2014) found that the sea–land breeze system can promote the formation of precipitation. As one of the pioneer study, Adams (1997) identified and defined three main types of sea breeze: pure sea breeze (PSB), corkscrew sea breeze (CSB) and backdoor sea breeze (BSB). A brief de-scription is given here, and a detailed explanation will be given in Section 2.3. The PSB has the largest gradient wind component, and the direction is perpendicular to the coast. The arrival of CSB(BSB) indicates that the wind direction gradually deflects counterclockwise (clockwise). In order to reflect the wind energy utilization of different types of sea–land breeze, Xia et al. (2021) analyzed the sea breeze on the northeast coast of the United States. The simulation shows that the power output related to CSB is almost 3 to 4 times that of PSB and BSB. The result highlights the importance of correctly predicting different types of sea breeze for wind energy application. Different types of sea breeze generally show different characteristics, but few previous studies paid attention to this. The analysis of different types of sea–land breeze is conducive to the rational development and utilization of climate resources. Therefore, it is imperative to conduct observational analysis by taking the sea breeze types into account. The results of this paper could provide refined scientific support for the application of wind energy resources and provide a useful reference for understanding the local circulation in Qingdao.
Then we use a variety of observation data (automatic weather station data, buoy data, wind profile data) to analyze the sea–land breeze in Qingdao and classifies the sea–land breeze. The synoptic chart and several typical thermodynamic variables, including lower tropospheric stability (LTS) and bulk Richard number (Ri), for each type of sea breeze have been analyzed as well in attempt to figure out the favorable atmospheric environment for the occurrence of each specific sea breeze. The rest of this paper proceeds as follows. Data and methodology are presented in Section 2. Section 3 introduces the monthly variation and seasonally variation of sea breeze and land breeze at Qingdao. The diurnal statistical characteristics of the four seasons of the three main sea breeze types and upper air conditions are also introduced. Section 4 illustrates the evolution process of three typical sea breezes. This study ends with summaries and conclusions in Section 5.
2 Data and methods
2.1 Data
In order to ensure the data quality of surface observational station and reduce the impact of topographic changes on it, we choose the national meteorological station in Qingdao and the altitude of station belongs to the plain altitude range (altitude<200 m). Adopt the principle of proximity, we select a buoy station (Changmenyan buoy station) with high data quality as the sea surface station for calculating the land-sea thermal contrast. The nearby coastline runs from northeast to southwest, and the location of the station is also identified on the map (Figure 1A). Figures 1B, C show the topo-graphic map, showing relatively homogenous terrain surrounding Qingdao weather station. The data used in this study is the surface observation data of Qingdao national meteorological station (Station number: 54,857, 120.33°E, 36.07°N) of 2016–2020 which comes from the observation of China Meteorological Administration (CMA), including surface wind (hourly data of 2-min average wind direction and speed) and temperature, with a time resolution of 1 h. Sea surface temperature data from Changmenyan buoy station (Station number: 54,859, 120.22°E, 36.18°N), with a time resolution of 1 h. The radar data comes from the product data file on the real–time sampling height of Qingdao wind profile radar station (120.2°E, 36.3°N, at 12 m height), including sampling height, horizontal wind direction, horizontal wind speed, vertical wind speed and other elements. The time in the data format is expressed in universal time with a time resolution of 6 min. The spatial resolution below 840 m height is 60 m and above 840 m the resolution is 120 m. According to the research content of this study and other scholars, the height range is 60–1,560 m in this paper. All these data obtaining from National Meteorological Information Center of CMA were quality controlled and released for operational usage. In order to obtain more reliable and accurate data, the original data will be screened and processed. We also use ERA–5 data to explore the atmospheric environment of sea breezes. The time was chosen from 2016 to 2020 with a time resolution of 1 h and a spatial resolution of 0.25°*0.25°. The calculation data of LTS and Ri only use the grid point of Qingdao station.
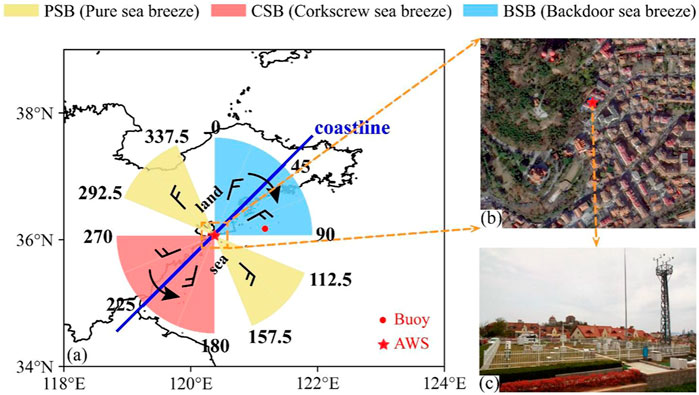
FIGURE 1. (A) Schematic of sea breeze classification, superimposed by the coastline of Qingdao city. The corkscrew sea breeze (CSB) is dominated by counterclockwise wind and shaded by the light red, the backdoor sea breeze (BSB) is dominated by clockwise wind and shaded by the light blue, and the pure sea breeze (PSB) dominated by the wind flowing perpendicular to the coastal line and shaded in light yellow. The red dot represents Qingdao national meteorological station and the star represents Changmenyan buoy station. (B) Topographic map near the station. (C) Photos of instrument monitoring.
Quality control of hourly data of selected station: if the missing data in a day (0000–2,300 local standard time, LST) reaches 7 h or more, it will not participate in the diurnal average statistics. Otherwise, the hours (less than 7) with missing observations are excluded for further analysis except for the remaining hours with valid observations. The number of samples at the station is the total number of remaining hours after eliminating the missing hours. Missing date has been eliminated in this study. Sea-land breeze refers to the breeze blowing from the sea to the land during the daytime in coastal areas. In this paper, the selection of data only includes the period from sunrise to sunset, and the nighttime data is ignored.
2.2 Calculation methodology
Sea-land breeze is mainly a thermal circulation unique to coastal areas, which caused by the thermal contrast between sea and land. We define the land-sea thermal contrast as ∆T, ∆T = Tland–Tsea > 0, which meets the criteria for occurrence of sea-land breeze. The Tland represents the diurnal average temperature of the land surface during the daytime from sunrise to sunset. The Tsea represents the diurnal average temperature of the sea surface during the daytime.
In order to better exhibit the atmospheric environment of sea breezes, the LTS and Ri are given. The data used for the calculation includes the grid points where the station is located. The LTS is calculated by Eq.:
LTS defined by the differences in potential temperature at 700 (
Ri is a dimensionless meteorological variable and can be calculated as the ratio of buoyance produced turbulence and shear-induced turbulence. A low Ri value is generally used to indicate weak instability and/or strong vertical shear. The Ri is calculated by Eq.:
Where
2.3 Determination of sea–land breeze
On the one hand, we select the day when thermal contrast is greater than zero (∆T = Tland–Tsea > 0, Furberg et al., 2002). Tland is 39 sunrise to sunset on the land–surface and Tsea is the diurnal average temperature from sunrise to sunset on the sea–surface. On the other hand, when the wind speed before the onset of sea breeze is less than 1.5 m s−1 and the maximum wind speed during the day is less than 10 m s−1, the day under investigation is deemed as a day with sea breeze. As such, this criterion taken from previous studies (Steyn and Faulkner, 1986;Furberg et al., 2002), to some extent, can eliminate the influence of large–scale synoptic system. Next, we will discuss the sea breeze days in two scenarios.
Scenario 1: sea and land breeze alternate throughout the day. It is specified that 0100–0800 LST is the land breeze period, 0900–1200 LST is the land breeze to sea breeze conversion period, 1,300–2000 LST is the sea breeze period, and 2,100–2,400 LST is the sea breeze to land breeze conversion period (Zhang et al., 2015; Xun et al., 2017).
(1) During the land breeze period in 0100–0800 LST, the land breeze occurs more than 4 times, the sea breeze occurs less than twice;
(2) During the sea breeze period in 1,300–2,000 LST, the sea breeze occurs more than 4 times, the land breeze occurs less than twice;
(3) After sunrise, there are significant changes in wind direction and speed, and the wind direction mutation angle is greater than 30°; when the sea breeze has been established, the wind direction tends to be more stable towards the shore (Wang et al., 2016). The wind speed of sea breeze is greater than or equal to 0.5 m s−1;
(4) If the wind speed is high before the sea breeze starts, it cannot satisfy the limit value of 1.5 m s−1 specified in precondition, but the mutation angle is obvious when the wind direction changes from offshore to onshore (Wang et al., 2018).
Scenario 2: if the whole day is a sea breeze day and the wind speed is significantly increased and lasts for more than or equal to 3 h (Wang et al., 2016).
Criteria for identifying the ending of sea breeze time periods:
(1) At the te time, the wind direction is within the angle range of the sea breeze, while at the te+1 time the wind direction is not, it is decided that the sea breeze ends at the te;
(2) The wind speed at te time is less than te-1 or te+1, or the wind speed at te time is less than or equal to 0.5 m s−1, it is decided that the sea breeze ends at the te.
2.4 Classification of sea breeze
Adams (1997) divided the sea breeze into four categories: PSB, CSB, BSB and synoptic sea breeze (SSB). Miller et al., 2003 only elaborated on the first three types of sea breezes. The PSB occurs under the condition of weak prevailing wind. The sea breeze circulation has the largest gradient wind component, and the direction is perpendicular to the coast. The CSB occurs when the prevailing wind has both coastal and cross shore components. It is assumed that the coastal wind component blows a south wind on the east coast of the continent in the northern hemisphere. According to the baric wind law, the south wind means low pressure on land and high pressure on the sea. There is a low–level divergence area near the coast, and the upper air sinks into the divergence area and assists in the occurrence of sea breeze. The arrival of CSB indicates that the wind gradually turns from southwest to southeast with a counterclockwise rotation. The BSB occurs when the prevailing wind has both coastal and cross shore components. It is assumed that the coastal wind component blows a north wind on the east coast of the continent in the northern hemisphere. According to the baric wind law, it means that there is a high pressure on land and a low pressure on the sea surface. Low level convergence occurs near the coast, which hinders the sinking of upper air and inhibits the movement of sea breeze to land. The arrival of the BSB indicates that the wind gradually turns from northwest to northeast with a clockwise rotation. This paper focuses on the analysis of the first three types of sea breeze.
According to the special coastline of the coastal area where Qingdao station is located and the angle classification method of Lin (2018), the types of sea–land breezes at Qingdao station are classified, and the diurnal variations and case analysis are carried out. Based on the spatial shape of coastline (Figure 1), the prevailing wind blowing from the direction 45°–225° is thought to be sea breeze, whereas those from 0° to 45° and 225°–360° are land breeze. As shown in Figure 1, the PSB starts from the land breeze angle of 292.5°–337.5° which is almost perpendicular to the coastline before the sea breeze starts, and then turns to the sea breeze angle of 112.5°–157.5° which is almost perpendicular to the coastline. The CSB starts from the land breeze angle of 225°–270° before the sea breeze starts, then rotates counterclockwise, and the wind direction turns to the sea breeze angle of 180°–225°. The BSB starts from the land breeze angle of 0°–45° before the sea breeze starts, then rotates clockwise, and the wind direction turns to the sea breeze angle of 45°–90°. If two of the first 3 h after the occurrence of a sea breeze belong to a particular sea breeze, and the subsequent changes meet the criteria for changes in that type of sea breeze, it is defined as that type of sea breeze occurring on that day.
3 Temporal variations of sea–land breeze
3.1 Monthly variations of sea-land breeze
According to the identification method of sea breeze days defined by wind and temperature elements in this paper, it is calculated that there are 522 days with sea breeze from 2016 to 2020, which is 28.73% of the total number of days (1,817 days) in the study period.
As shown in Figure 2A, the black solid line is the annual average of the monthly number of sea breeze days in the study period and the red and blue solid lines represent the annual average of the sea breeze and land breeze speed (hourly mean wind speed) in the daytime of the sea breeze day. The results show that the number of days with sea breeze for the period from April to September is more than 11 days. This suggests that this season corresponds to a period of high sea breeze occurrence, and the intensity of sea breeze is greater than that of land breeze. In particular, there are 14.6 days of sea breeze in September, which is the most in the whole year. In winter, there are relatively few from December to the followed January, of which only 1.2 days of sea breeze occurred in December. The highest speed of sea breeze occurs in March which was 3.31 m s−1 and the lowest value occurs in December which was only 1.36 m s−1. The maximum value of land breeze speed in August is 2.75 m s−1 and the minimum value in December is 1.76 m s−1. One of the potential causes leading to temporal difference of sea breeze frequency between September and December is the different land–sea thermal contrast, which is calculated by the Tland minus Tsea. As expected, in September, thermal contrast is more than 0°C (Figure 2C), which is favorable for the dominance of sea breeze. While the thermal contrast in December is negative and well below 0°C, which does not meets the criterion for the determination of one sea breeze event as described in Section 2, so the occurrence frequency is very low.
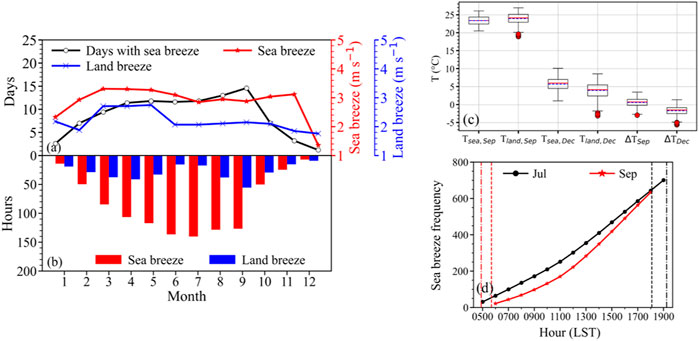
FIGURE 2. (A) Monthly variations of annual mean sea breeze days (Days, black solid line), sea breeze speed (Sea breeze, red solid line) and land breeze speed (Land breeze, blue solid line) during 2016–2020. (B) Monthly variations of annual mean sea breeze sea breeze (Sea breeze) and land breeze (Land breeze) hours. (C) Annual mean Tsea, Tland and ∆T during the daytime in September and December (the red solid line is the median, the blue dotted line is the average, and the red dot is the outlier). (D) Cumulative frequency of sea breeze occurring during daytime hours in July and September (the red (black) dotted and dashed lines, respectively indicate the sunrise (sunset) times in July and September).
Figure 2B shows the annual average hours of sea and land breeze during the day-time on the sea breeze day of each month, from which we can see that the hours of sea breeze and land breeze vary greatly, especially in the summer half year. The maximum number of hours experiencing sea breeze is 140.2 in July, as compared with 55.6 h with land breeze occurrence in September. In order to explore the anomaly of sea breeze days and hours in July and September in Figures 2A, B, the cumulative frequency of sea breeze during the daytime in July and September is calculated, respective, which is shown in Figure 2D. The reasons for these seasonal variations could be twofold: 1) the sunrise and sunset time in July are 1 h longer than those in September, resulting in longer daytime; 2) the increase in occurrence frequency of sea breeze during daytime is higher in July than in September.
On the days when the land–sea thermal contrast is greater than zero, sea breeze occurs more frequently. While the days when the land–sea thermal contrast is less than zero, the sea breeze only appears in a few days. This situation is consistent with the description of sea breezes on Sardinia by Furberg et al., 2002. Meanwhile, it seems that there exists the largest land–sea thermal contrast in September in our study area, leading to most frequently occurring sea breeze in this month (Figure 2C). By comparison, the largest land–sea thermal contrast was found in May over the region of Sardinia (Furberg et al., 2002). Interestingly, Jiangsu province (Huang et al., 2016), located in the eastern coastal region of China, witnessed the most frequent sea breeze events in summer except for a few in autumn and winter. This could be because summer monsoon that frequently appeared as on-shore wind tended to favor the formation of sea breeze. Likewise, over Hainan Island in southern China, Zhang et al. (2014) revealed the maximum frequency of sea breeze in summer (49%) and the minimum frequency in autumn (29%). All these results indicate that the occurrence of sea breeze exhibits strong seasonal and spatial dependence.
3.2 Seasonal variations of sea–land breeze
Figure 3 shows the percentage of wind speed in each section of sea breeze, with the highest percentage of moderate wind speed section of 3–4 and 4–5 m s−1, a slightly lower percentage of wind speed section of 2–3 m s−1, followed by the 5–6 m s−1. Wind speed below 2 m s−1 rarely occurs. The sea breeze direction is mainly concentrated in east–southeast to south wind. The south wind component in spring is the largest and exceeds 40%. The wind in the other three seasons accounts for about 30%. The results of land breeze (Figure S1) show that the largest fraction of the wind speed is 1–4 m s−1 and the wind direction is mainly concentrated in northwest to northeast. The northwest wind component in spring accounts for the largest 30%. The comparison of the two figures shows that the sea breeze is stronger than the land breeze.
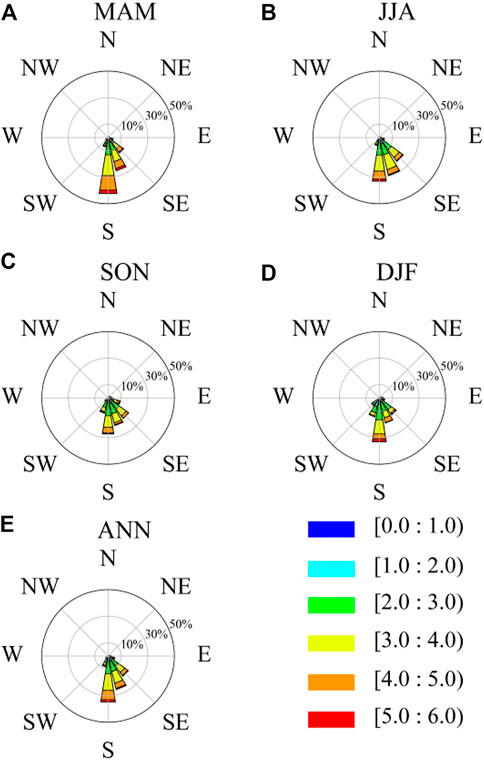
FIGURE 3. Wind rose plots for the seasonal (A–D) and annual (E) averaged sea breeze observed for the period 2016 to 2020 in Qingdao, China (the axis label of the wind rose diagram indicate the wind direction and the legend label indicate the wind speed range).
3.3 Seasonal variations of three types of sea breeze
Simple statistical analysis show that the number of PSB, CSB and BSB days is 61, 40, and 2, respectively. PSB occurs more frequently from April to September for more than 5 days per month. The CSB occurs in May, June, and September for 5 days or more per month. As shown in Figures 4, 5, it shows the occurrence frequency and speed of the sea breeze from sunrise to sunset in different seasons (only the sea breeze is considered, and the land breeze is not included in the statistics). In spring, PSB and CSB appear continuously in the daytime. The two types of sea breeze occur at the same time and the frequency increase gradually reaching the maximum frequency at 1,500 LST. PSB occurs more frequently than CSB. In summer, only PSB and CSB occur frequently. The frequency in the morning is low and gradually increases afterwards. At 1,500 LST, the frequency of the two sea breezes reach the maximum which is the highest in the whole year. The frequency of the PSB is close to 5.0%, which is nearly twice of the CSB. In autumn, three types of sea breeze occur simultaneously, and PSB and BSB have a breakpoint at 0700 LST. The PSB and CSB have obvious growth trend, while the BSB has almost no change. The frequency of PSB is the highest among the three. In winter, the frequency of PSB and CSB is low, and the maximum frequency is below 2.5%. The change is not obvious. The PSB is still slightly higher than CSB. The PSB in winter occurs 2 h later than the CSB. The change of sea breeze speed in the four seasons is similar to the trend of frequency. The wind speed in the morning is low and in the afternoon increases gradually. There are significant variations in spring, summer and autumn. The maximum speed of sea breeze occurs in summer and varies only slightly in winter. The PSB reaches the maximum speed at 1,500 LST in spring, at 1,400 LST in summer, at 1,600 LST in autumn and at 1,700 LST in winter. The CSB reaches the maximum speed at 1,400 LST in spring, at 1,700 LST in summer, at 1,600 LST in autumn and at 1,600 LST in winter. The speed of PSB is stronger than that of CSB, and the time to reaches the maximum wind speed is earlier than CSB. The BSB is rarely observed and the speed is low.
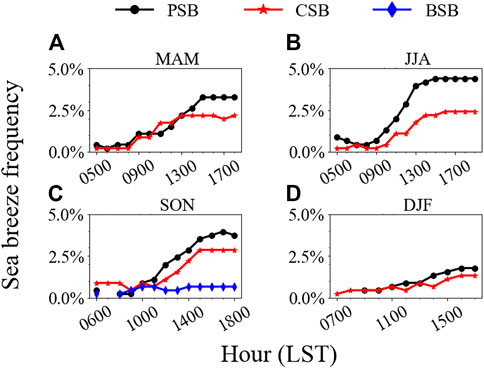
FIGURE 4. Hourly variations of the occurrence frequency of three types of sea breeze: PSB (in black), CSB (in red) and BSB (in blue) during the daytime for fours seasons: (A) spring (MAM), (B) summer (JJA), (C) autumn (SON) and (D) winter (DJF) during the period 2016 to 2020 in Qingdao, China.
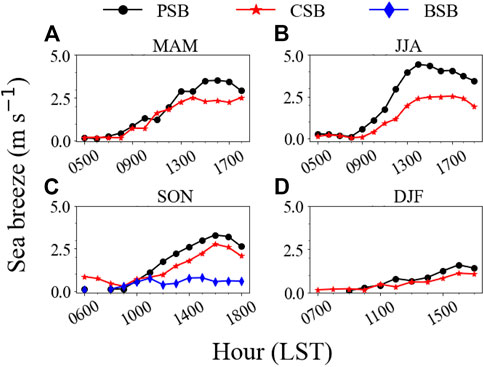
FIGURE 5. Hourly variations of the intensity of three types of sea breeze: PSB (in black), CSB (in red) and BSB (in blue) during the daytime for fours seasons: (A) spring (MAM), (B) summer (JJA), (C) autumn (SON) and (D) winter (DJF) during the period 2016 to 2020 in Qingdao, China.
It can be seen that the sea breeze occurs within 2 h after sunrise and the peak of the sea breeze development is from 1,200 LST to 1,600 LST. In winter, the sea breeze is less frequent, discontinuous, low in intensity, and the wind speed fluctuation is not obvious. In spring, summer and autumn, the frequency of sea breeze increases with good consistency and the speed increases obviously, especially the PSB. The frequency and speed in summer are the highest in the whole year and the PSB intensity is the strongest among the three. In conclusion, the sea breeze from afternoon to night in Qingdao is in a good condition, especially at 1,300–1,700 LST, which is more conducive to wind turbine power generation. In addition, the sea breeze lasts for a long time and the effective utilization period increased.
3.4 Favorable atmospheric environment for three types of sea breeze
As BSB only appeared in autumn, the atmospheric circulation of three types of sea breeze in autumn is plotted using ERA–5 data (Figure 6). The geopotential height of the three types of sea breeze has no obvious trough and ridge, and the large–scale circulation background was stable, which is consistent with the conditions for the occurrence of sea breeze. However, the BSB is the least stable of the three due to the uneven distribution of contours at middle and low latitudes and the presence of multiple synoptic systems at low altitudes that causes vertical and horizontal movements of air masses, which is also verified later in Figure 7 using LTS and Ri. The wind convergence line of PSB is around 35°N and a high pressure appears in southeastern part of Shandong and 40°N sea surface. A weak wind shear line exists coastal waters. The wind convergence line of CSB is also around 35°N and a high pressure appears in the southwestern part of Shandong. A wind shear line exists in the far sea area. Qingdao station is in the eastern periphery of the high pressure at 850 hPa when the two types of sea breeze occur. In this case, west wind prevail at Qingdao Station. Compared to the PSB, the synoptic system of the CSB is further away from the coastline. It is different from PSB and CSB that the convergence line of BSB appears inland and Qingdao station is dominated by northeast wind with convergence of cold advection. The convergence area of PSB and CSB is the convergence of warm and humid air on the sea surface.
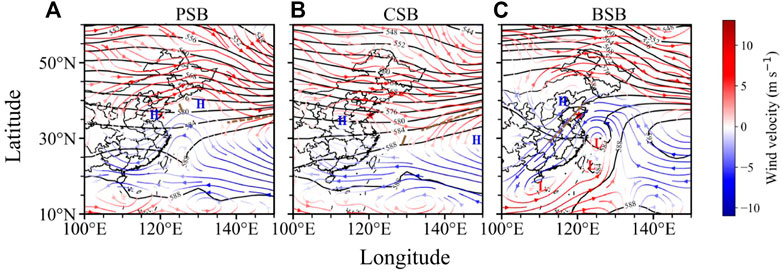
FIGURE 6. 500 hPa geopotential height field (black contour line) superimposed on the 850 hPa wind field (in colored streamline, red streamline for west wind and blue streamline for east wind) for three types of sea breeze: (A) PSB, (B) CSB and (C) BSB in the autumn of 2016–2020. The brown solid line represents the shear line, the brown dotted line represents the convergence line and the blue H (red L) represents the 850 hPa high (low) pressure center.
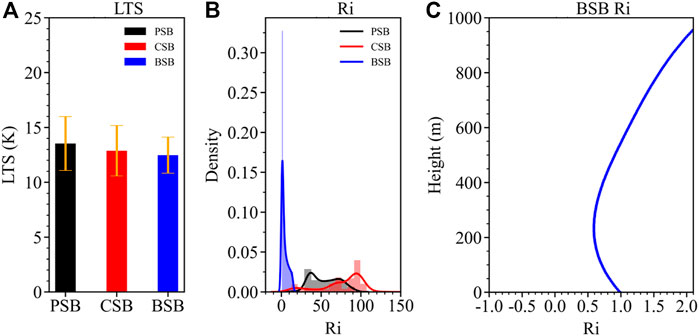
FIGURE 7. (A) Probability density distribution of lower tropospheric stability (LTS) for three types of sea breeze (PSB, CSB and BSB), where the error bar denotes one standard deviation. (B) Probability density distribution of bulk Richard number (Ri) for three types of sea breeze (PSB, CSB and BSB) in the autumn of 2016–2020 and (C) the profiles Ri of BSB starting from ground level up to 1 km altitude.
After that, the static stability of lower troposphere for the three types of sea breeze has been discussed in depth. Mean LTS and Ri for the daytime of three types of sea breezes are calculated using ERA–5 data for the autumn of 2016–2020. It can be seen from Figure 7A that the LTS of PSB reaches the largest whereas the BSB is the smallest. Typically, the LTS values are higher, the lower troposphere is more stable. This indicates that the atmosphere is the most stable when the PSB occurs, while the lower troposphere is the least stable when the BSB occurs. Ri is a dimensionless meteorological variable and can be calculated as the ratio of buoyance produced turbulence and shear-induced turbulence. A low Ri value is generally used to indicate weak instability and/or strong vertical shear. Figure 7B shows the probability density distributions of Ri for the three types of sea breeze. Noticeable is that the BSB has the lowest Ri, suggesting a strong vertical wind shear for the occurrence of BSB. Figure 7C presents the vertical variation of Ri starting from the ground up to 1 km above ground level (AGL). Ri is less than 1 in the lower range (below 600 m), indicating that the atmospheric stability is in a weak stable state. This is generally consistent with Miller et al., 2003 that the BSB had a sur-face–layer convergence area near the coast and needed a stronger thermal contrast.
3.5 Thermal contrast for three types of sea breeze
From Figure 8, it can be seen that the range of concentration of land-sea thermal contrast of BSB is greater than that of PSB and CSB by about 3°C, while the maximum probability of occurrence of land-sea thermal contrast is about 1.5°C for PSB, and about 1°C for CSB. The median of BSB is also greater than the median of PSB and CSB. It indicates that greater land-sea thermal contrast and thermal pressure gradient are required for the occurrence of BSB. The land-sea thermal contras of PSB and BSB are more inclined to be above 0°C, and the opposite for CSB. The median of land-sea thermal contrast of CSB is smaller than that of PSB, and the data amount is more inclined to be below 0°C. The above two findings are consistent with the conclusions obtained by Adams (1997).
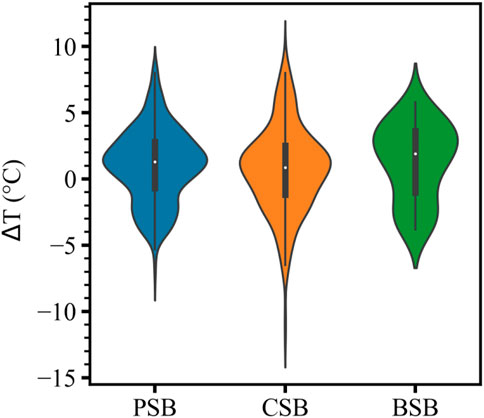
FIGURE 8. The land-sea thermal contrast during the daytime of three types of sea breeze in 2016–2020, the center white dot represents the median.
4 Case analyses of three types of sea-land breaze
4.1 A PSB case on 24 August 2019
Figure 9A shows the diurnal variations of wind speed and direction of PSB on 24 August 2019. The region shaded in pink represents the hours with sea breeze. The average sunrise and sunset times for each month are marked in red and black in dotted line. Figure 9B presents the time–height cross–section of wind profile acquired from radar wind profiler in Qingdao on 24 August 2019.
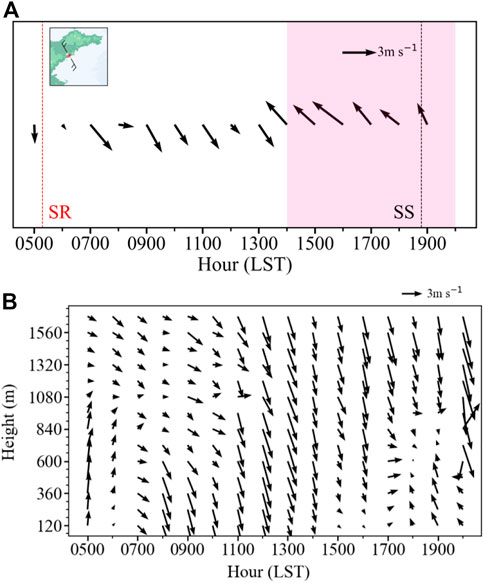
FIGURE 9. (A) Diurnal variations of wind speed and direction of PSB on 24 August 2019. The region shaded in pink represents sea breeze duration. The average sunrise and sunset times for each month are marked in red and black in dotted line. The wind direction is shown in the upper left corner. (B) Time-height cross-section of wind profile acquired from radar wind profiler in Qingdao on 24 August 2019.
As shown in Figure 9A, the wind direction is stable in the range of 292.5°–337.5° in the land breeze period and transition period before 1,400 LST, and the wind direction is almost vertical to the coastline. At 1,400 LST the wind direction changes to 138°, indicating that the sea breeze begins to develop, and then the wind direction stabilizes in the range of 115.5°–157.5° that is perpendicular to the coastline. According to the angle conversion of land breeze and sea breeze and the conditions mentioned above, it is determined that a PSB event occurs on that day. When the sea breeze occurs, the wind speed is high but there is obvious angular deflection. At 1,600 LST, the maximum sea breeze speed is 3.4 m s−1, which decreases from 2,100 LST, but the sea breeze continued to occur. At 0800–1,300 LST (Figure 9B), the high–altitude wind direction is consistent with the surface wind direction, with southwest wind. At 1,400 LST, the high–altitude wind speed decreases significantly. At 1,700 LST, the wind direction changes. And at 1,800 LST, it is the same as the surface wind direction, blowing southeast wind. The maximum height is about 720 m AGL.
4.2 A CSB case on 28 May 2019
As shown in Figure 10A, the land breeze continues before 1,300 LST. At 1,100 LST, the wind direction is between 225° and 270°, and then it rotates counterclockwise. At 1,300 LST, the wind direction changes to sea breeze and the angle is 217° belonging to 180°–225°. After that, it remains within this range, and the wind direction changes to 266° at 2,000 LST indicating the end of the sea breeze. According to the angle conversion of land and sea breeze on that day, and the conditions mentioned above. It is determined that a CSB event occurs on that day. The sea breeze begins at 1,300 LST and develops to the maximum speed of 4.7 m s−1 at 1,800 LST, and then the wind speed decreases. As of 2,000 LST, the wind direction does not belong to the sea breeze range and the sea breeze ends. Before 1,200 LST (Figure 10B), there is northwest wind in the upper air, which is consistent with the surface wind speed. At 1,200 LST, it deflects counterclockwise and turns to southwest wind, when the surface breeze simultaneously turns to southwest wind. The south wind is maintained until 2,200 LST and could reach as high as 1,560 m AGL.
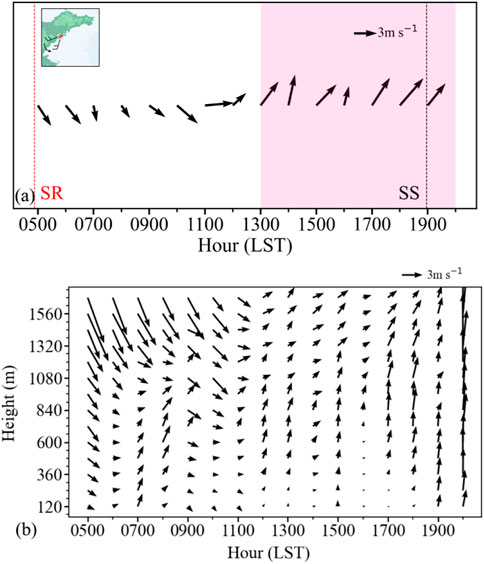
FIGURE 10. (A) Diurnal variations of wind speed and direction of CSB on May 28, 2019. The region shaded in pink represents sea breeze duration. The average sunrise and sunset times for each month are marked in red and black in dotted line. The wind direction is shown in the upper left corner. (B) Time-height cross-section of wind profile acquired from radar wind profiler in Qingdao on May 28, 2019.
4.3 A BSB case on 3 September 2019
Figure 11A shows that the land wind continues to blow before 0900 LST and the angle range is in the range of 0°–45°. Then it rotates clockwise. At 0900 LST, the wind direction changes to sea breeze with an angle of 80° belonging to 45°–90° and the sea breeze continues. At 1,900 LST, the wind direction changes to 268°, blowing land breeze, which marks the end of the sea breeze. According to the angle conversion of land and sea breeze on that day and conditions mentioned above, it is determined that the BSB occurs on that day. The sea breeze starts at 0900 LST and develops to the maximum sea breeze wind speed of 4.5 m s−1 at 1,100 LST, and then the wind speed fluctuates greatly. As of 1,900 LST, the wind direction does not belong to the sea breeze angle and thus the sea breeze is deemed ending. The high–altitude wind direction varies on that day and the sea breeze develops to the height of 600 m AGL at 1600 LST (Figure 11B).
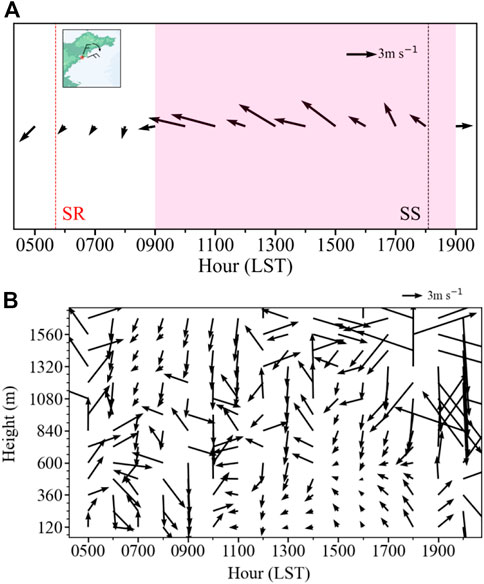
FIGURE 11. (A) Diurnal variations of wind speed and direction of BSB on September 3, 2019. The region shaded in pink represents sea breeze duration. The average sunrise and sunset times for each month are marked in red and black in dotted line. The wind direction is shown in the upper left corner. (B) Time-height cross-section of wind profile acquired from radar wind profiler in Qingdao on September 3, 2019.
5 Conclusion and discussion
Based on the high-quality controlled surface wind and temperature measurements, along with the wind profile radar observations and ERA–5 reanalysis at Qingdao station from 2016 to 2020, three types of sea breeze in Qingdao have been comprehensively analyzed. To our knowledge, this work is one of the first articles in China to analyze the classification of sea–land breeze from an observational perspective. Overall, there are 522 sea breeze days for the whole study period from 2016 to 2020, which accounts for 28.73% of the total number of days. There are 61 days belonging to PSB, 40 days witnessing CSB, and only 2 days experiencing BSB. This indicated that PSB was predominant in Qingdao. The peak period of sea breeze is from April to September and the wind speed is concentrated at 3–5 m s−1. The strongest sea breeze appears in March, which is 3.31 m s−1 and the lowest appears in December which is only 1.36 m s−1. One of the potential causes for the seasonal difference of sea breeze frequency and sea breeze hours is land–sea thermal contrast, which is calculated as the 2-m air temperature at Qingdao station minus the sea–surface temperature at Changmenyan buoy station. It is shown that positive land-sea thermal contrast is more conducive to the development of sea breezes.
Subsequently, we further compare the synoptic–scale circulation, LTS and Ri for three types of sea breeze. It is found that the contours for the geopotential height at 500 hPa are relatively flat for PSB and CSB, with prevailing westerly wind above Qingdao. In contrast, the BSB has an uneven distribution of geopotential height contours at middle and low altitudes. At this time, Qingdao is dominated by northeast wind, and inland convergence line causes cold advection convergence. The BSB corresponds to the least LTS values, which suggests that BSB tends to occur in the static unstable lower troposphere. By comparison, PSB tends to occur in the most static stable lower tropo-sphere.
Further analysis on the diurnal variation of sea breeze show that the sea breeze occurs most frequently for the period 1,200 to 1,600 LST. In winter, the sea breeze is less frequent, discontinuous and low in intensity. The frequency and wind speed in summer are the highest in the whole year. Among all three types of see breeze, the PSB has the highest intensity and most frequency throughout the daytime, especially in the seasons of spring, summer and autumn. The sea breeze cases show the shift of direction visually and clearly at last. When the PSB occurs, the sea breeze and land breeze were almost perpendicular to the coastline. At 1400 LST, the sea breeze begins to develop and reaches its maximum wind speed of 3.4 m s−1 after 2 h. On the CSB day, it rotates counterclockwise after 1,100 LST and the wind direction changes to sea breeze at 1,300 LST. At 1,800 LST, the maximum speed reaches 4.7 m s−1 LST. On the BSB day, a clockwise rotation occurs before 0900 LST. The maximum speed reaches 4.5 m s−1 at 1,100 LST. The variation patterns of upper air winds for both PSB and CSB are well consistent with the surface, except for the BSB for which the upper air wind is messy and highly variable.
In conclusion we have achieved the following innovative research results. 1) A standardized definitions for classifications of three types of sea breeze was defined and discussed in detail. The disk method is used to visualize the occurrence and transition angles of different types of sea breeze. The findings are more detailed and reliable and can provide refined scientific support for the application of wind energy resources, useful reference for understanding the local circulation in the coastal area of Qingdao, and meaningful for understanding the formation of local weather and pollution. 2) In this paper, a unified data source and unified judgments standard were used to explore the characteristics and influencing factors of occurrence of sea breeze at Qingdao station. It is more beneficial to the compare the basic characteristics of different types of sea breeze and draw reliable conclusions. The vertical structure of sea breeze has not been analyzed and discussed yet. In the future, it is proposed to conduct analysis of vertical data to explore the vertical structure and variation of sea -land breeze. In this paper, only surface wind and temperature data were selected for the determination of sea breeze judgment. In future research we will consider incorporating pressure data, humidity data, cloud amount and precipitation data into the calculation method to design a more accurate sea breeze separation method.
Data availability statement
The original contributions presented in the study are included in the article/supplementary material, further inquiries can be directed to the corresponding authors.
Author contributions
Conceptualization, JG, LC, and ZG; methodology, ZG; software, ZG; validation, ZG; formal analysis, ZG and MS; investigation, ZG; resources, ZG; data curation, ZG and LC; writing—original draft preparation, ZG; writing—review and editing, ZG, LC, JG, MS, and XG; visualization, ZG and MS; supervision, JG and LC; funding acquisition, LC. All authors have read and agreed to the published version of the manuscript.
Funding
This study is financially supported by the National Key R&D Program of China under grant 2022YFC3004201, the Natural Science Foundation of China under grant U2142209 and National Meteorological Information Center Fund Project under grant NMICJY202310.
Acknowledgments
We appreciate the wind and temperature data provided by the National Meteorological Information Center of China Meteorological Administration (https://data.cma.cn). Last but not least, the authors would like to thank the editor and the reviewers for their constructive comments which help improve this manuscript.
Conflict of interest
The authors declare that the research was conducted in the absence of any commercial or financial relationships that could be construed as a potential conflict of interest.
Publisher’s note
All claims expressed in this article are solely those of the authors and do not necessarily represent those of their affiliated organizations, or those of the publisher, the editors and the reviewers. Any product that may be evaluated in this article, or claim that may be made by its manufacturer, is not guaranteed or endorsed by the publisher.
Supplementary material
The Supplementary Material for this article can be found online at: https://www.frontiersin.org/articles/10.3389/fenvs.2023.1188952/full#supplementary-material
References
Feit, D. M. (1969). Analysis of the Texas Coast land breeze. USA: Atmospheric Science Group University of Texas, 1–52.
Fisher, E. L. (1960). An observational study of the sea breeze. J. Atmos. ences 17 (6), 645–660. doi:10.1175/1520-0469(1960)017<0645:aosots>2.0.co;2
Fujibe, , and F., (1985). Air Pollution in the Surface Layer Accompanying a Local Front at the Onset of the Land Breeze. Journal of the Meteorological Society of Japan. 63 (2), 226–237.
Furberg, M., Steyn, D. G., and Baldi, M. (2002). The climatology of sea breezes on Sardinia. Int. J. Climatol. 22 (8), 917–932. doi:10.1002/joc.780
Ganbat, G., Baik, J. J., and Ryu, Y. H. (2015). A numerical study of the interactions of urban breeze circulation with mountain slope winds. Theor. Appl. Climatol. 120 (1), 123–135. doi:10.1007/s00704-014-1162-7
Gao, J., Miao, J., and Xu, Q. (2013). Research on progress in methods for identifying sea and land breezes. Meteorological Sci. Technol. (1), 97–102.
Garrett, T. J., and Zhao, C. (2006). Increased Arctic cloud longwave emissivity associated with pollution from mid-latitudes. Nature 440 (7085), 787–789. doi:10.1038/nature04636
Garrett, T., Zhao, C., and Novelli, P. (2010). Assessing the relative contributions of transport efficiency and scavenging to seasonal variability in Arctic aerosol. Tellus B Chem. Phys. Meteorology 62 (3), 190–196. doi:10.3402/tellusb.v62i3.16525
Guo, J., Deng, M., Lee, S. S., Wang, F., Li, Z., Zhai, P., et al. (2016). Delaying precipitation and lightning by air pollution over the Pearl River Delta. Part I: Observational analyses. J. Geophys. Res. Atmos. 121, 6472–6488. doi:10.1002/2015JD023257
Guo, J., Zhang, J., Yang, K., Liao, H., Zhang, S., Huang, K., et al. (2021). Investigation of near-global daytime boundary layer height using high-resolution radiosondes: First results and comparison with ERA-5, MERRA-2, JRA-55, and NCEP-2 reanalyses. Atmos. Chem. Phys. 21, 17079–17097. doi:10.5194/acp-21-17079-2021
Huang, M., Gao, Z., Miao, S., and Xu, X. (2016). Characteristics of sea breezes over the Jiangsu coastal area, China: sea breezes in jiangsu province, China. China Int. J. Climatol. 36, 3908–3916. doi:10.1002/joc.4602
Huang, W. R., and Chan, J. C. (2011). Maintenance mechanisms for the early-morning maximum summer rainfall over southeast China. Q. J. R. Meteorological Soc. 137 (657), 959–968. doi:10.1002/qj.815
Huang, W. R., and Chan, J. C. (2012). Seasonal variation of diurnal and semidiurnal rainfall over Southeast China. Clim. Dyn. 39 (7), 1913–1927. doi:10.1007/s00382-011-1236-5
Huang, W. R., and Wang, S. Y. (2014). Impact of land–sea breezes at different scales on the diurnal rainfall in Taiwan. Clim. Dyn. 43 (7), 1951–1963. doi:10.1007/s00382-013-2018-z
Jeffreys, H. (1922). On the dynamics of wind. Q. J. R. Meteorological Soc. 48 (201), 29–48. doi:10.1002/qj.49704820105
Kingsmill, D. E. (1995). Convection initiation associated with a sea–breeze front, a gust front, and their collision. Mon. weather Rev. 123 (10), 2913–2933. doi:10.1175/1520-0493(1995)123<2913:ciawas>2.0.co;2
Kozo, T. L. (1982). A mathematical model of sea breezes along the alaskan beaufort sea coast: Part II. J. Appl. Meteorology Climatol. 21 (7), 906–924. doi:10.1175/1520-0450(1982)021<0906:ammosb>2.0.co;2
Kraus, H., Hacker, J., and Hartmann, J. (1990). An observational aircraft–based study of sea–breeze frontogenesis. Boundary–layer Meteorol. 53 (3), 223–265. doi:10.1007/bf00154443
Laird, N. F., Kristovich, D. A., Rauber, R. M., Ochs, H. T., and Miller, L. J. (1995). The Cape Canaveral sea and river breezes: Kinematic structure and convective initiation. Mon. weather Rev. 123 (10), 2942–2956. doi:10.1175/1520-0493(1995)123<2942:tccsar>2.0.co;2
Li, Z., Wang, Y., Guo, J., Zhao, C., Cribb, M. C., Dong, X., et al. (2019). East Asian study of tropospheric aerosols and their impact on regional clouds, precipitation, and climate (EAST–AIRCPC). J. Geophys. Res. Atmos. 124 (23), 13026–13054. doi:10.1029/2019jd030758
Lin, Y., Cao, D., Lin, N., Li, G., He, Y. X., Zhang, P. C., et al. (2019). N1 and P1 components associate with visuospatial-executive and language functions in normosmic Parkinson's disease: An event-related potential study. J. Geophys. Res. Atmos. 124 (1), 18–34. doi:10.3389/fnagi.2019.00018
Liu, J., Yang, S., Chu, K., and Tan, Z. M. (2019). Evolution of convective systems across Hangzhou Bay during a sea-breeze-effect thunderstorm event. Meteorology Atmos. Phys. 131, 1415–1428. doi:10.1007/s00703-018-0646-x
Ma, Y., Xin, J., Zhang, X., Dai, L., Schaefer, K., Wang, S., et al. (2021). Land–sea breeze circulation structure on the west coast of the Yellow Sea, China. Atmos. Ocean. Sci. Lett. 14, 100003. doi:10.1016/j.aosl.2020.100003
Meng, Z., and Tang, S. (2019). Analysis of severe convective weather process triggered by a sea land breeze. Agric. Technol. Serv. 36, 88–90.
Miller, S. T. K., Keim, B. D., Talbot, R. W., and Mao, H. (2003). Sea breeze: Structure, forecasting, and impacts. Rev. Geophys. 41 (3). doi:10.1029/2003rg000124
Naor, R., Potchter, O., Shafir, H., and Alpert, P. (2017). An observational study of the summer Mediterranean Sea breeze front penetration into the complex topography of the Jordan Rift Valley. Theor. Appl. Climatol. 127 (1), 275–284. doi:10.1007/s00704-015-1635-3
Pearce, R. (1955). The calculation of a sea–breeze circulation in terms of the differential heating across the coastline. Q. J. R. Meteorological Soc. 81 (349), 351–381. doi:10.1002/qj.49708134906
Phan, T. T., and Manomaiphiboon, K. (2012). Observed and simulated sea breeze characteristics over Rayong coastal area, Thailand. Meteorology Atmos. Phys. 116 (3), 95–111. doi:10.1007/s00703-012-0185-9
Pokhrel, R., and Lee, H. (2011). Estimation of the effective zone of sea/land breeze in a coastal area. Atmos. Pollut. Res. 2 (1), 106–115. doi:10.5094/apr.2011.013
Rani, S. I., Ramachandran, R., Subrahamanyam, D. B., Alappattu, D. P., and Kunhikrishnan, P. (2010). Characterization of sea/land breeze circulation along the west coast of Indian sub-continent during pre–monsoon season. Atmos. Res. 95 (4), 367–378. doi:10.1016/j.atmosres.2009.10.009
Ryu, Y. H., and Baik, J. J. (2013). Daytime local circulations and their interactions in the Seoul metropolitan area. J. Appl. Meteorology Climatol. 52 (4), 784–801. doi:10.1175/jamc-d-12-0157.1
Sheng, C., Xue, M., and Gao, S. (2009). The structure and evolution of sea breezes during the Qingdao Olympics sailing test event in 2006. Adv. Atmos. Sci. 26 (1), 132–142. doi:10.1007/s00376-009-0132-y
Simpson, J., Mansfield, D., and Milford, J. (1977). Inland penetration of sea–breeze fronts. Q. J. R. Meteorological Soc. 103 (435), 47–76. doi:10.1002/qj.49710343504
Steyn, D., and Faulkner, D. (1986). The climatology of sea-breezes in the lower fraser valley. B. C. Climatol. Bull. 20, 21–39.
Tian, Q., Huang, G., Hu, K., and Niyogi, D. (2019). Observed and global climate model based changes in wind power potential over the Northern Hemisphere during 1979–2016. Energy 167, 1224–1235. doi:10.1016/j.energy.2018.11.027
Vogelezang, D., and Holtslag, A. (1996). Evaluation and model impacts of alternative boundary-layer height formulations. Boundary-Layer Meteorol. 81, 245–269. doi:10.1007/bf02430331
Wang, J., Miao, J., and Feng, W. (2016). An observational analysis of sea breeze characteristics over the hainan island. J. Meteorological Sci. 36 (2), 244–255.
Wang, S., He, X., Ren, M., and Zhang, X. (2018). Statistical characteristics and standards of the sea and land wind in the west bank of bohai. Clim. Change Res. Lett. 7, 205–212. doi:10.12677/ccrl.2018.74023
Xia, G., Draxl, C., Optis, M., and Redfern, S. (2021). Detecting and characterizing sea breezes over the US northeast coast with implication for offshore wind energy. Wind Energy Science. , 1–23.
Xu, Q., Miao, J., Liu, Y., Huang, L., and Wang, D. (2013). Response of sea and land breeze characteristics to urban heat island over the west coast of Bohai Bay. J. Meteorological Sci. 33 (4), 408–417.
Xun, A., Huang, H., and Chen, D. (2017). Observation and characteristic analysis of sea and land wind circulation in Xiamen area. Strait Sci. (12), 3–7.
Yang, X., Zhao, C., Zhou, L., Li, Z., Cribb, M., and Yang, S. (2018). Wintertime cooling and a potential connection with transported aerosols in Hong Kong during recent decades. Atmos. Res. 211, 52–61. doi:10.1016/j.atmosres.2018.04.029
Zhang, W., Chen, S., and Chen, D. (2015). Analysis of climatological characteristics of sea land breeze along Western coast regions of Taiwan Strait and its large–scale circulation. Mar. Forecasts (6), 58–65.
Zhang, Z., Cai, X., Song, Y., Kang, L., et al. (2014). Statistical characteristics and numerical simulation of sea land breezes in Hainan island. Journal of Tropical Meteorology 20 (3), 267–278.
Zhao, D., Xin, J., Wang, W., Jia, D., Wang, Z., Xiao, H., et al. (2022). Effects of the sea–land breeze on coastal ozone pollution in the Yangtze River Delta, China. Sci. Total Environ. 807, 150306. doi:10.1016/j.scitotenv.2021.150306
Keywords: Qingdao, sea breeze, sea breeze classification, lower tropospheric stability, bulk Richard number (Ri), wind profile
Citation: Guo Z, Cao L, Guo J, Shang M and Guo X (2023) On three types of sea breeze in Qingdao of East China: an observational analysis. Front. Environ. Sci. 11:1188952. doi: 10.3389/fenvs.2023.1188952
Received: 18 March 2023; Accepted: 12 April 2023;
Published: 05 May 2023.
Edited by:
Zhiyuan Hu, Sun Yat-sen University, ChinaReviewed by:
Bin Chen, Lanzhou University, ChinaQianrong Ma, Yangzhou University, China
Wei You, NUDT, China
Copyright © 2023 Guo, Cao, Guo, Shang and Guo. This is an open-access article distributed under the terms of the Creative Commons Attribution License (CC BY). The use, distribution or reproduction in other forums is permitted, provided the original author(s) and the copyright owner(s) are credited and that the original publication in this journal is cited, in accordance with accepted academic practice. No use, distribution or reproduction is permitted which does not comply with these terms.
*Correspondence: Lijuan Cao, Y2FvbGpAY21hLmdvdi5jbg==; Jianping Guo, anBndW9jYW1zQGdtYWlsLmNvbQ==