- 1College of Electrical and Information Engineering, Quzhou University, Quzhou, Zhejiang, China
- 2Quzhou Academy of Metrology and Quality Inspection, Quzhou, Zhejiang, China
- 3Macau University of Science and Technology, Macau, China
- 4Florida International University, Miami, FL, United States
Centralized heating is an energy-saving and environmentally friendly way that is strongly promoted by the state. It can improve energy utilization and reduce carbon emissions. However, Centralized heating depends on accurate heat demand forecasting. On the one hand, it is impossible to save energy if over producing, while on the other hand, it is impossible to meet the heat demand of enterprises if there is not enough capacity. Therefore, it is necessary to forecast the future trend of heat consumption, so as to provide a reliable basis for enterprises to reasonably deploy fuel stocks and boiler power. At the same time, it is also necessary to analyze and monitor the steam consumption of enterprises for abnormalities in order to monitor pipeline leakage and enterprise gas theft. Due to the nonlinear characteristics of heat load, it is difficult for traditional forecasting methods to capture data trend. Therefore, it is necessary to study the characteristics of heat loads and explore suitable heat load prediction models. In this paper, industrial steam consumption of a paper manufacturer is used as an example, and steam consumption data are periodically analyzed to study its time series characteristics; then steam consumption prediction models are established based on ARIMA model and LSTM neural network, respectively. The prediction work was carried out in minutes and hours, respectively. The experimental results show that the LSTM neural network has greater advantages in this steam consumption load prediction and can meet the needs of heat load prediction.
1 Introduction
While generating electricity, the cogeneration plant also uses the steam extraction or exhaust steam from the turbine to supply heat to the customers. Due to the large scale of heat supply, large boilers with high parameters and high efficiency can be used. Compared with decentralized heat supply, energy utilization efficiency is greatly improved, fuel is saved, and emissions are reduced. Therefore, centralized heat supply is an energy-saving and environmentally friendly way that is strongly promoted by the state. However, due to the ineffective energy use of thermoelectricity, the heat loss is great. On the one hand, energy cannot be saved if there is overproduction, while on the other hand, heat demand of enterprises cannot be met if there is not enough capacity. Therefore, accurate steam consumption prediction becomes an important issue.
Load forecasts for thermoelectric company can usually be divided into four categories based on the length of the forecast: long-term forecasts, medium-term forecasts, short-term forecasts and ultra-short-term forecasting (Du et al., 2019; Li et al., 2020). Short-term forecasting refers to forecasting data for one to a few days in the future and is the focus of this paper (Längkvist et al., 2014). In thermoelectric load forecasting, classical methods include regression analysis (Qing et al., 2013), time series methods, mathematical and statistical methods such as Kalman filtering (Dong et al., 2015). Machine learning was gradually introduced into short-term load forecasting (Greff et al., 2016; Geysen et al., 2018), such as expert systems (Chen et al., 1991), fuzzy forecasting (Jović, 2021), wavelet analysis (Kumbinarasaiah et al., 2023), chaos theory (Al-Shammari et al., 2016), support vector machines (Kuzishchin and Ismatkhodzhaev, 2020; Razzak et al., 2020), cluster analysis models (Liu et al., 2020) and artificial neural networks (Mao et al., 2021; Wang et al., 2022a; Wang et al., 2022b; Yang et al., 2022).
Potocnik (Potočnik et al., 2014) investigated static and adaptive models for short-term natural gas load forecasting, constructing linear models, neural network models and support vector machine regression models. Forecasts of gas consumption by individual customers and local gas companies show that the adaptive model has better forecasting performance. Ervural et al. (Ervural et al., 2016) developed a combined forecasting model based on MA and ARMA, in which a genetic algorithm was used to determine the p, q values in ARMA (p, q). The single model and the combined model were used to forecast natural gas consumption in Turkey, and the results showed that the combined model had a higher prediction accuracy. Beyca (Beyca et al., 2019) forecasted natural gas consumption in Istanbul, Turkey. Multiple linear regression (MLR), artificial neural network (ANN) and support vector regression (SVR) were used in the study, and the results showed that SVR had the lowest forecasting error.
Yu et al. (Yu and Xu, 2014) improved the traditional BP neural network, increased the adaptive learning rate of the BP neural network, and applied a genetic algorithm to optimally determine the initial weights and thresholds of the BP neural network, and proposed the BPNN-GA natural gas load forecasting model. The model takes into account the effects of maximum temperature, minimum temperature, average temperature, date type and weather conditions, and predicts the natural gas load in Shanghai. The experimental results show that the MAPE value of the BPNN-GA model is 4.59%, and the optimized combined model has better prediction results.
The goal of deep learning is to stack multiple modules together to form deep net-works in order to create more expressive models that can learn more abstract representations of data and achieve better learning performance (Muzaffar and Afshari, 2019; Li et al., 2020). As a type of deep learning neural network, recurrent neural networks (RNN) rely on their own hidden layer recurrent structure to capture temporal correlations between data well and have been widely used in various time series prediction problems. However, RNNs are prone to gradient disappearance when training network parameters, and therefore cannot handle long-term dependence between data (Wang et al., 2018; Wang et al., 2019; Wang and Song, 2019). Currently, several RNN architectures have been derived to solve the gradient disappearance problem, including gate architectures, cross-timescale connections, initialization constraints and regularization methods, etc. The most influential of these are the gate architectures represented by the LSTM (Hochreiter and Schmidhuber, 1997).
Pang et al. (Pang et al., 2021) integrated the historical load and various load influencing factors to build a load prediction model. Using the feature extraction capability of neural networks and the temporal memory capability of LSTM, the long-term change pattern of load and the non-linear influence of various influencing factors on load are identified, and the load prediction performance of different historical time windows and different network architectures are verified based on actual load data. Zhuang et al. (Zhuang et al., 2020) studied and analyzed various popular RNN architectures, and designs a cross-time scale sub-modular recurrent neural network architecture by combining the Zoneout technique, focusing on the random update strategy of the hidden layer modules, which effectively solves the RNN gradient disappearance problem and substantially reduces the network parameters to be trained (Fang et al., 2022; Wang et al., 2020; Shen et al., 2022; Duan et al., 2022; He et al., 2021).
The data in this paper are derived from the actual steam consumption data of a local paper mill from 2020 to 2021. Firstly, the steam consumption data of this enterprise for the past 2 years were pre-processed for annual and monthly visualization analysis; then, the time series characteristics of the steam consumption load data were fully investigated; finally, to investigate the forecasting of steam consumption and optimal control methods, forecasting models were established based on the differential autoregressive moving average model (ARIMA) and the long and short-term memory model (LSTM), respectively. The objectives are: i) to supply heat on demand, save energy and reduce emissions, conserve resources and protect the environment; ii) to understand the habits and conditions of enterprises and adjust steam supply in time; and iii) to reduce energy consumption and operating costs and improve the steam revenue of thermoelectric company.
2 Data sample description and pre-processing
2.1 Data sources
The data in this paper is real data from a local thermoelectric company, which provides heat and gas to hundreds of companies. In this paper, the industrial steam consumption of a paper company is selected for analysis and forecasting. The table information records some basic information on the amount of steam used by this paper company, with an original sampling interval of 1 min, describing the company’s industrial steam consumption over the last 2 years.
In order to facilitate analysis of steam consumption, prevent gas theft and gas leakage, as well as guide the production of the company, the total daily steam consumption and the average steam consumption per hour were chosen to represent the data characteristics.
2.2 Data pre-processing
Common problems in time series data are unordered time stamps, missing values, outliers and noise in the data, and we will deal with each of these below.
(1) Null and outlier handling. Null and outlier values were identified and removed during the data collation. Missing values were deleted, and duplicates were removed. Since steam consumption is always positive, there were no cases where steam consumption was zero. Therefore, outlier values were not present.
(2) Set the time index. The date time column has a default string data type and must first be converted to a datetime data type. Because this paper is analyzed by time series, so the index of DataFrame must be time type. This paper selects recTime as the index of data.
(3) Normalization. Normalization was performed to improve model training accuracy and convergence speed. The normalization method used is detailed in Eq. 1.
Where: xnorm denotes the normalized data; x denotes the original data; xmin denotes the minimum value of the sample data; xmax denotes the maximum value of the sample data.
2.3 Data visualization and analysis
Visual presentation includes: data import, time series generation, data down-sampling, etc.
Data of 2020 and 2021 are stored in excel and now need to be exported from 12 excel files to a python environment to be presented as a data-frame. Due to the amount of data and the repetitive nature of the operation, a programmatic loop is used to import.
As the data is recorded once a minute, when visualizing the data, the display in minutes is not only extensive but also too microscopic, so it is necessary to down sample the data. A visual analysis was then carried out by matplotlib, and the average monthly steam consumption in 2020 is shown in Figure 1.
To present the data as a Python data frame, data from 12 Excel files from 2020 to 2021 were programmatically looped. To down-sample the data, monthly steam consumption was visualized using Figure 1. The company’s daily steam consumption was about 0.37 tons and remained stable in all months except for February, May, and December, with the most significant fluctuations in February due to low consumption during the New Year holidays.
3 Steam consumption prediction
Heat load forecasting, from a large perspective, can reduce energy waste, shrink excess capacity and deepen structural reform on the energy supply side; from a small perspective, by achieving accurate heat supply and heat delivery on demand, it can further achieve energy saving and emission reduction effects, and improve the operational efficiency of the entire heat network.
One need for heat load forecasting is to predict heat consumption data from one to 7 days in the future, so as to guide recent production planning. This paper examines the problem of short-term data forecasting. Steam usage varies over time and can be viewed as a set of time series data, so a time series analysis model can be used to analyze and forecast steam usage. The following prediction analysis is performed using a linear regression model and a machine learning model, respectively.
3.1 ARIMA model
3.1.1 ARMA
ARMA (Autoregressive Moving Average Model) is a combination of autoregressive model (AR) and moving average model (MA).
3.1.1.1 Autoregressive model (AR)
AR uses the variable’s own historical values to predict itself by determining the relationship between current and historical values. The model requires the data to have smooth characteristics, and if not smooth, it needs to be differenced, and the number of differences depends on the value of p.
p denotes the time interval, e.g., p = 1 means it is today and yesterday’s data, and p = 2 means today and the previous day’s data. p-order autoregressive process is defined by the following expression:
Where
3.1.1.2 Moving Average model (MA)
MA is a linear combination of the data at the current moment being the past q order white noise, and is mainly concerned with the accumulation of the error term (
The equation for the q-order autoregressive process of MA is as follows.
3.1.1.3 Autoregressive moving average model (ARMA)
ARMA (Autoregressive moving average model) is a combination of autoregressive model (AR) and moving average model (MA). The equation for of ARMA is as follows.
3.1.2 ARIMA
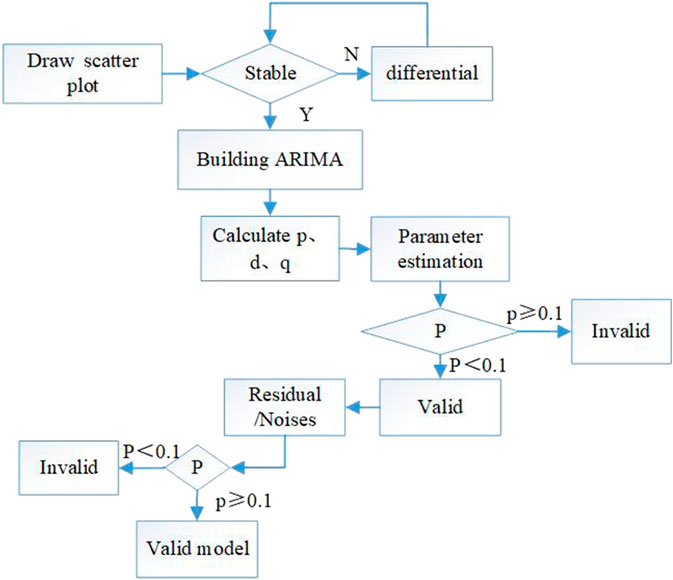
ARIMA (Autoregressive Integrated Moving Average Model), also noted as ARIMA (p, d, q), is one of the most common statistical models used for time series forecasting, where AR is “autoregressive” and p is the number of autoregressive terms, MA is “sliding average” and q is the number of sliding average terms. ARIMA is based on ARMA with the addition of the differential order I. The basic idea is to transform an unstable time series into a stable time series to obtain a stable time series, thus building the model, as shown in Figure 2.
3.1.3 Modeling process
3.1.3.1 Obtain a smooth time series
A smooth time series is obtained. The data for the whole day of 2 January 2021 was used as the training data. The potential requirement for time series autoregressive analysis is that the time series analyzed shall meet the requirement of smoothness. Therefore, the stability of the data needs to be judged first, and if it is not good, it needs to be differenced. For series plotting, ADF test is performed to observe whether the series is smooth or not; for non-smooth time series, d-order differencing is to be performed first to transform into a smooth time series, as shown in Figure 3.
From the result graph, it can be seen that both the original data tot_cha and the data diff_1 after differencing the first order do not fluctuate much, within 1.0, and the smoothness is good, so we can consider not to differ the original data and take tot_cha for prediction.
3.1.3.2 Calculation of ACF and PACF
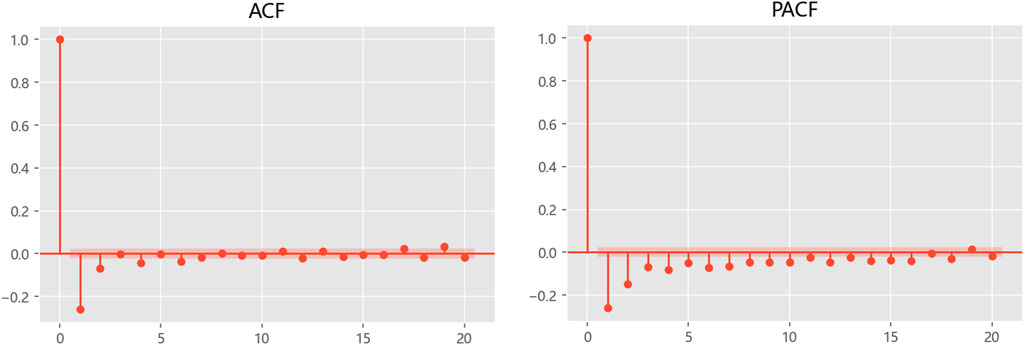
the function is evaluated by taking the following two main indicators: i) autocorrelation function ACF. ii) Partial autocorrelation function PACF. The two data sets are not adjacent to each other, i.e., the relationship obtained between x(t) and x (t-k) is not a pure correlation, and x(t) will also be affected by the intermediate k-1 values, which will produce some bias, which requires the PACF partial correlation function to correct for the correlation between the two and strictly control the correlation between the two variables.
The calculation and visual analysis of the indicators is carried out below. Plotting with the plot_acf and plot_pacf functions indicates the order of the data and the change in autocorrelation to determine the values of q and p. The determination of q and p is primarily based on how many orders in the respective plots are truncated after the tail. The truncated tails indicate that the points fall within the confidence interval, which is the shaded area in Figure 4.
3.1.3.3 Parameters calculation
From the above analysis, d, q and p were calculated to obtain the ARIMA model. The model parameters are then estimated, and the residuals and white noise are tested, so that the model was built.
3.2 LSTM models
LSTM networks are an improved variant of Recurrent Neural Networks (RNN), retaining the ability of RNN networks to efficiently process time-loaded data and effectively solve the problems of gradient disappearance and gradient explosion. LSTM has the ability of processing no-linear data, and can calculate the dependence between individual observations in a time series.
3.2.1 RNN
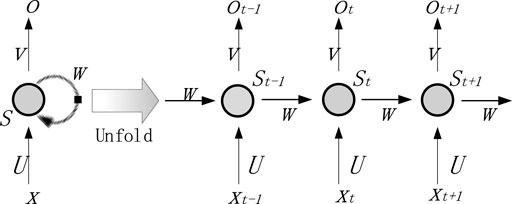
Recurrent Neural Network (RNN) is a class of recursive neural network that takes sequence data as input, recursion in the direction of sequence evolution and all nodes (recurrent units) are connected in a chain, as shown in Figure 5. The RNN network structure has a hidden layer “recursion” function, which allows the nodes in the hidden layer to be interconnected, thus providing the network with memory capabilities.
The connection structure of RNN is shown in Fig. The hidden state st and the model output ot on the moment t are calculated as follows:
where: xt denotes the input at moment t;
When the input sequence is too long, the later features cannot obtain the earlier features, leading to the Long Term Dependency problem. As the number of gradients increases, the gradient disappearance problem will occur. The problem of gradient disappearance is that the weights w are hardly updated, so it is difficult to find a suitable weight w, to map the relationship between the input and output values.
3.2.2 LSTM
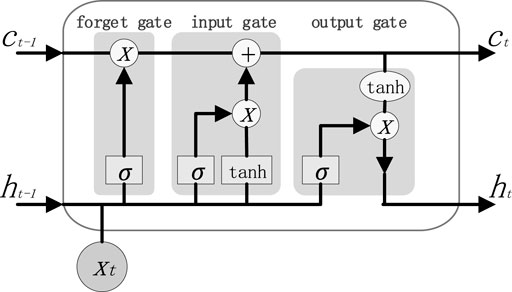
LSTM is a derivative algorithm of RNN, which can obtain better analysis in longer sequences. The most important improvement to the LSTM is the inclusion of cell states, i.e., the inclusion of the LSTM CELL, which passes the hidden and cell states of the previous moment to the next moment through input gates, output gates and forgetting gates.
LSTM controls the discard or addition of information through a “gate” structure that allows selective passage of information, thus achieving forgetting or remembering. A single LSTM unit has three gates, namely, forget gate, input gate and output gate. The cell structure is shown in Figure 6.
The role of the forgetting gate is to forget the scaling of the information at the previous moment ct-1, which is one of the key factors for the network to have the memory function. Eq. 7 is the formula of the forgetting gate.
The input gate combines the output information of the previous moment with the input information of the current moment to update the cell state. Eq. 8 is the input gate and Eq. 9 is the current learned state. Combining the forgetting gate and the input gate, the cell state at the current moment is the sum of the decay of ct-1 and
The output gate calculates the output of the current moment based on the current latest state ct, the previous moment cell output ht-1, and the current moment input xt. The final output value of the LSTM model is jointly determined by the output gate and the current moment cell state. Eq. 11 is the output gate, and Eq. 12 is the final output value of the model. Wo and bo are the weight and bias parameters of the output gate, respectively.
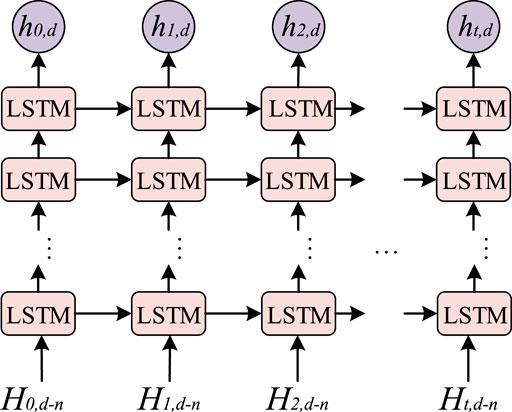
In this paper, LSTM predicts the steam consumption based on the data of previous n days. The structure of the LSTM network model is shown in Figure 7.
At time t, the input to the LSTM prediction model is the historically predicted steam consumption. where the input is the historical steam consumption at time t, which can be expressed as Input = {Ht,d-n }, and the model output at time t can be expressed as Output = ht,d.
3.3 Experimental comparison
3.3.1 Predicted steam consumption per minute
The dataset was selected as steam consumption per minute from January 2 to 9 January 2021, and the first 70% was used as the training set, the second 20% as the test set, and the last 10% as the validation set.
In this paper, the feature variable is steam consumption, so the number of neuron nodes is set to 1. The number of hidden layers N is adjusted according to the experimental method, and in this paper, single-layer, two-layer and three-layer LSTM neural networks are built, and the optimal number of layers 3 that makes the best experimental results is selected. The number of neurons in the hidden layer was set to 32 by comparing the results for different values. The number of neurons in the output layer is determined by the target variable and is set to 1.
After training, the number of single training samples batch_size was set to 16; the time step time step was 10; the number of iterations epochs was 140; the dropout to prevent overfitting was 0.2; the loss function was the mean square error; the learning rate was 0.0001; the activation function was the relu function; and the Adam optimizer was set.
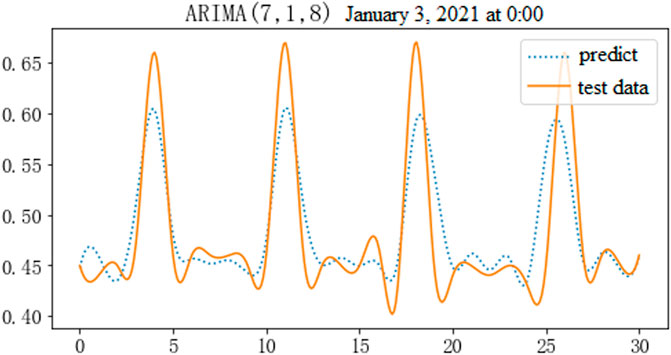
The trained model was used to predict future steam consumption. The predicted values obtained based on ARIMA are shown in Figure 8. It can be seen that the predicted trend is relatively smooth, with steam consumption at around 0.65 tons per minute, and future trends can be predicted better.
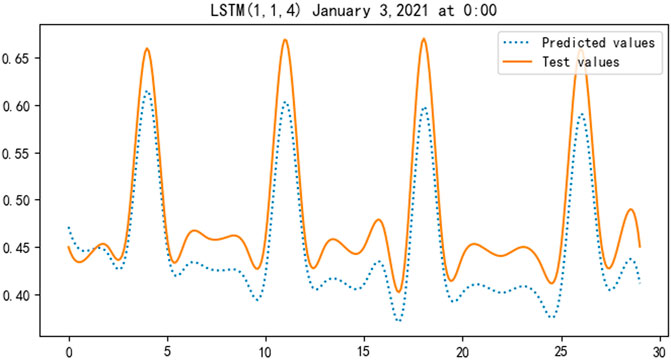
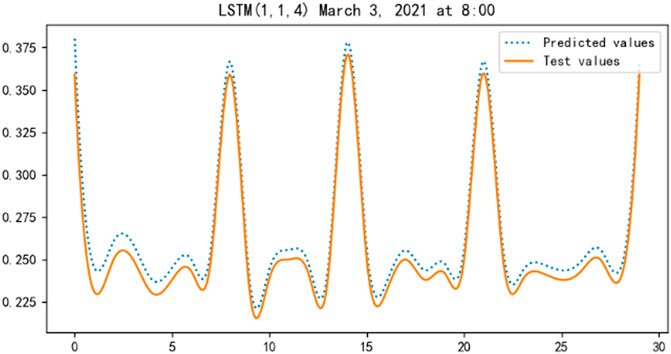
The prediction results based on LSTM are shown in Figures 9, 10, 11, from which it can be seen that the predicted values of the LSTM model are very close to the measured values and the fit is good.
A comparison of the evaluation indicators of the models is shown in Table 1.
From the table, it can be seen that the coefficients of determination for the models are:
3.3.2 Hourly steam consumption forecast
Steam usage from January to September 2021 was used as the training data. The dataset was downsampled at an hourly sampling frequency, with a total of 6546 rows and 2 columns. 6546 rows refer to 6546 h, and the first column in 1 column is the average steam usage at the current time point, and the second column is the actual hourly average steam consumption data at the next time point, which is used as the label set in this experiment. In this experiment, the data set is used as the training data set according to the first 6378 h of data and the last 168 h of the last 7 days as the test data set. x_train is the feature data of the first 6378 rows of the feature set, and y_train is the data of the first 6378 rows of the label set. x_test is the feature data of the last 168 rows of the feature set, and y_test is the data of the last 168 rows of the label set. Test is the sample data collected for the last 168 rows of the label set.
After experiments, the specific parameters are set as follows: DropOut is 20%, i.e., 20% of the network nodes are randomly dropped, the learning rate is set to 0.005, the model selects “Adam” optimizer to process the learning rate, and “Mean_squared_error” is selected as the loss function. error” as the loss function. According to the experimental effect, the training batch is set to 16 and the number of iterations is set to 100.
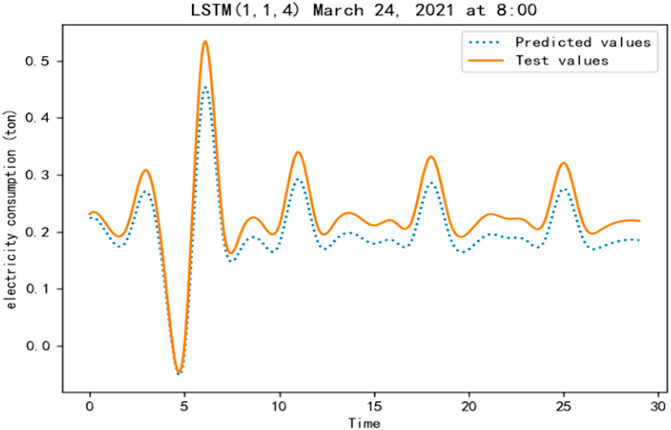
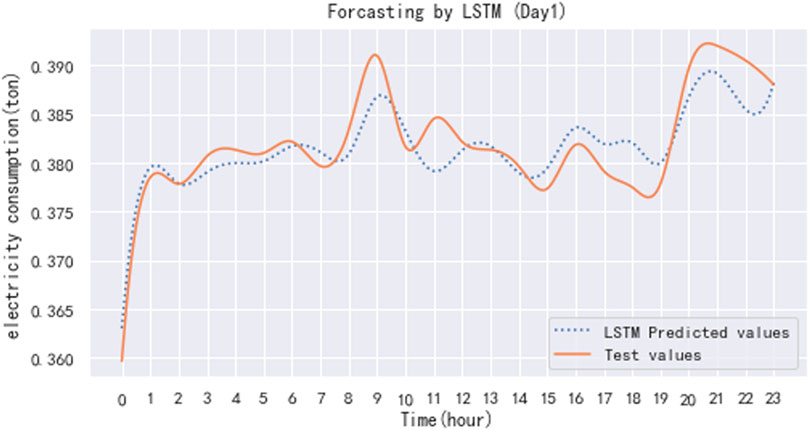
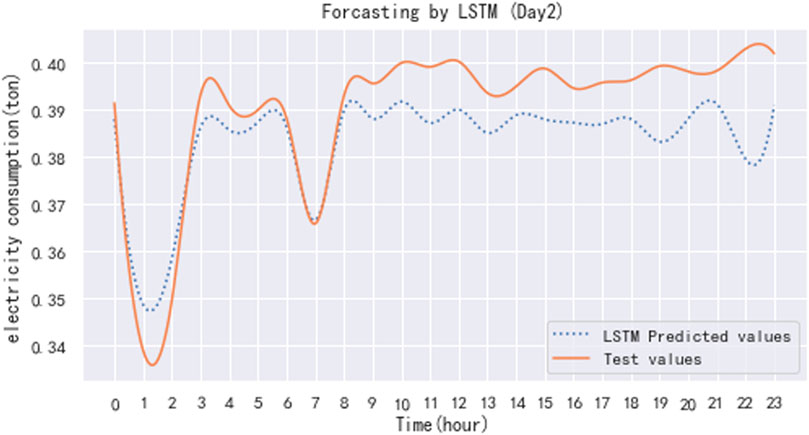
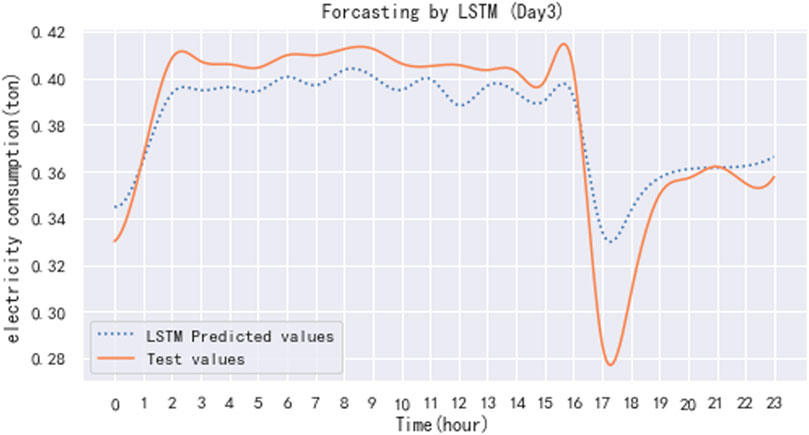
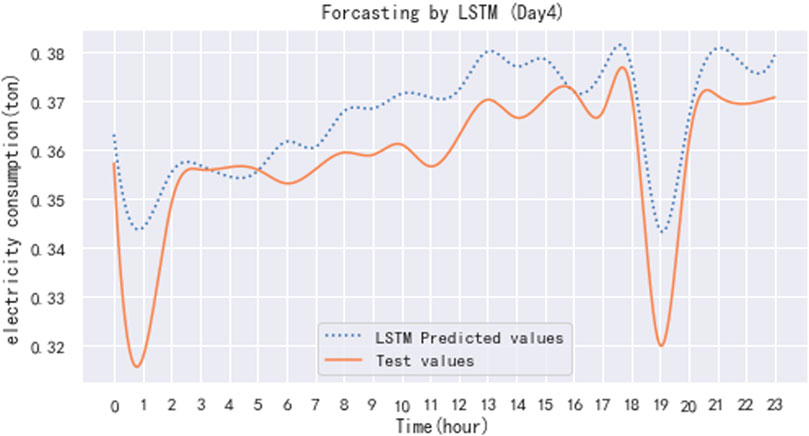
The trained model is used to predict the hourly steam usage for a particular day in the following period. The test values were selected from the hourly steam usage data for September 23-26 September 2021. The predicted results are shown in Figures 12, 13, 14, 15.
As seen from the result, the trend of the predicted value is consistent with the measured value. It further proves that LSTM can better predict the trend of data changes for longer time periods.
Experiments have shown that ARIMA tends to predict more accurate results for data with a clear trend in the series, while LSTM tends to do better on unstable time series with more stationary components. LSTM shows better performance in predicting unstable time series.
4 Summary
Cogeneration plants provide a centralized heat supply method that improves energy efficiency and reduces carbon emissions. In order to provide companies with accurate heat demand to guide production, accurate analysis and forecasting are required. Due to the strong internal correlation, long lag time and non-linear characteristics of heat load, it is difficult for traditional forecasting methods to capture the trend of data changes. Therefore, this paper takes the industrial steam consumption of a paper manufacturer as an example to study the characteristics of heat load consumption and explore a suitable heat load prediction model. The steam consumption prediction models are established based on ARIMA model and LSTM neural network, respectively.
The prediction was performed in minutes and hours, respectively. The results show that ARIMA tends to predict more accurate results on the data when there is a clear trend in the series, while LSTM tends to do better on unstable time series with more stationary components. Its prediction means has a significant improvement compared with traditional machine learning methods, and with the increase of data volume, the method shows its good robustness and the timeliness and accuracy of prediction results. The LSTM neural network has a greater advantage in this steam consumption load prediction, and can meet the needs of heat load prediction. Thus, it can achieve energy saving and emission reduction, improve efficiency and improve the service quality of heat supply.
In this paper, only steam consumption data has been selected as features. Future research could improve the selection of features, take into account factors such as flow rate, pressure and temperature, explore the influence of environmental factors on steam consumption, select a more comprehensive set of influencing factors, and improve the deep learning algorithm, thus improving the accuracy of steam consumption prediction.
Data availability statement
The data analyzed in this study is subject to the following licenses/restrictions: The data set involves details of industrial production and is not convenient for public disclosure. Other researchers can contact me by email if necessary. Requests to access these datasets should be directed to MzcwNDlAcXpjLmVkdS5jbg==.
Author contributions
Conceptualization, MY; methodology, MY; software, KF; validation, XX and KF; formal analysis, XX; investigation, XX; resources, HC; data curation, HC; writing—original draft preparation, ZZ; writing—review and editing, ZX; visualization, ZX; supervision, KF; project administration, KF; funding acquisition, MY. All authors listed have made a substantial, direct, and intellectual contribution to the work and approved it for publication.
Funding
This research was funded by Zhejiang Provincial Natural Science Foundation of China under grant number LGF20F030003. The Quzhou City Science and Technology Project under grant no. 2022K162. The Zhejiang Provincial Market Supervision Administration Scientific Research Plan Project under grant no. 20200130.
Conflict of interest
The authors declare that the research was conducted in the absence of any commercial or financial relationships that could be construed as a potential conflict of interest.
Publisher’s note
All claims expressed in this article are solely those of the authors and do not necessarily represent those of their affiliated organizations, or those of the publisher, the editors and the reviewers. Any product that may be evaluated in this article, or claim that may be made by its manufacturer, is not guaranteed or endorsed by the publisher.
References
Al-Shammari, E. T., Keivani, A., Shamshirband, S., Mostafaeipour, A., Yee, L., Petković, D., et al. (2016). Prediction of heat load in district heating systems by Support Vector Machine with Firefly searching algorithm. Energy 95, 266–273. doi:10.1016/j.energy.2015.11.079
Beyca, O. F., Ervural, B. C., Tatoglu, E., Ozuyar, P. G., and Zaim, S. (2019). Using machine learning tools for forecasting natural gas consumption in the province of Istanbul. Energy Econ. 80, 937–949. doi:10.1016/j.eneco.2019.03.006
Chen, D., Chen, B., and Li, T. (1991). “An expert system for short-term load forecasting,” in 1991 International Conference on Advances in Power System Control, Operation and Management, APSCOM-91, Hong Kong, November 5-8, 1991 (IET), 330–334.
Dong, S., Wang, H., and Li, J. (2015). Short-term forecasting of highway capacity through wavelet transform and dynamic neural time series: A stochastic analysis (No. 15-5048), TRB 94th annual meeting compendium of papers, Washington, DC. http://trid.org/view/1339004
Du, D., Chen, R., Li, X., Wu, L., Zhou, P., and Fei, M. (2019). Malicious data deception attacks against power systems: A new case and its detection method. Trans. Inst. Meas. Control 41 (6), 1590–1599. doi:10.1177/0142331217740622
Duan, Y., Chen, N., Bashir, A. K., Alshehri, M. D., Liu, L., Zhang, P., et al. (2022). A web knowledge-driven multimodal retrieval method in computational social systems: Unsupervised and robust graph convolutional hashing. IEEE Trans. Comput. Soc. Syst., 1–11. doi:10.1109/tcss.2022.3216621
Ervural, B. C., Beyca, O. F., and Zaim, S. (2016). Model estimation of ARMA using genetic algorithms: A case study of forecasting natural gas consumption. Procedia-Social Behav. Sci. 235, 537–545. doi:10.1016/j.sbspro.2016.11.066
Fang, K., Wang, T., Yuan, X., Miao, C., Pan, Y., and Li, J. (2022). Detection of weak electromagnetic interference attacks based on fingerprint in IIoT systems. Future Gener. Comput. Syst. 126, 295–304. doi:10.1016/j.future.2021.08.020
Geysen, D., De Somer, O., Johansson, C., Brage, J., and Vanhoudt, D. (2018). Operational thermal load forecasting in district heating networks using machine learning and expert advice. Energy Build. 162, 144–153. doi:10.1016/j.enbuild.2017.12.042
Greff, K., Srivastava, R. K., Koutník, J., Steunebrink, B. R., and Schmidhuber, J. (2016). Lstm: A search space odyssey. IEEE Trans. neural Netw. Learn. Syst. 28 (10), 2222–2232. doi:10.1109/tnnls.2016.2582924
He, X., Wang, J., Liu, J., Ding, W., Han, Z., Wang, B., et al. (2021). DNS rebinding threat modeling and security analysis for local area network of maritime transportation systems. IEEE Trans. Intelligent Transp. Syst., 1–13. doi:10.1109/tits.2021.3135197
Hochreiter, S., and Schmidhuber, J. (1997). Long short-term memory. Neural Comput. 9 (8), 1735–1780. doi:10.1162/neco.1997.9.8.1735
Jović, S. (2021). Adaptive neuro-fuzzy prediction of flow pattern and gas hold-up in bubble column reactors. Eng. Comput. 37, 1723–1734. doi:10.1007/s00366-019-00905-y
Kumbinarasaiah, S., Raghunatha, K. R., and Preetham, M. P. (2023). Applications of Bernoulli wavelet collocation method in the analysis of Jeffery–Hamel flow and heat transfer in Eyring–Powell fluid. J. Therm. Analysis Calorim. 148 (3), 1173–1189. doi:10.1007/s10973-022-11706-9
Kuzishchin, V. F., and Ismatkhodzhaev, S. K. (2020). All-mode automatic temperature control system for superheated industrial steam boiler during buffer consumption of gaseous production waste. J. Phys. Conf. Ser. 1683 (4), 042023. doi:10.1088/1742-6596/1683/4/042023
Längkvist, M., Karlsson, L., and Loutfi, A. (2014). A review of unsupervised feature learning and deep learning for time-series modeling. Pattern Recognit. Lett. 42, 11–24. doi:10.1016/j.patrec.2014.01.008
Li, Q., Zhao, Y., and Yu, F. (2020). A novel multichannel long short-term memory method with time series for soil temperature modeling. IEEE Access 8, 182026–182043. doi:10.1109/access.2020.3028995
Liu, W., Zhou, W., Yang, L., Lü, X., and Liu, G. (2020). Investigation on the performance evaluation of gas-fired combi-boilers with factor analysis and cluster analysis. SN Appl. Sci. 2, 1132–1210. doi:10.1007/s42452-020-2931-9
Mao, K., Xu, J., Jin, R., Wang, Y., and Fang, K. (2021). A fast calibration algorithm for Non-Dispersive Infrared single channel carbon dioxide sensor based on deep learning. Comput. Commun. 179, 175–182. doi:10.1016/j.comcom.2021.08.003
Muzaffar, S., and Afshari, A. (2019). Short-term load forecasts using LSTM networks. Energy Procedia 158, 2922–2927. doi:10.1016/j.egypro.2019.01.952
Pang, C., Zhang, B., and Yu, J. (2021). Short-term power load forecasting based on LSTM recurrent neural network. Power Eng. Technol. 40, 175–180. doi:10.12158/j.2096-3203.2021.01.025
Potočnik, P., Soldo, B., Šimunović, G., Šarić, T., Jeromen, A., and Govekar, E. (2014). Comparison of static and adaptive models for short-term residential natural gas forecasting in Croatia. Appl. energy 129, 94–103. doi:10.1016/j.apenergy.2014.04.102
Qing, Q. D., Chen, H. M., and Xiang, L. L. (2013). Holidays short term load forecasting using fuzzy linear regression method. Power Demand Side Manag.
Razzak, I., Zafar, K., Imran, M., and Xu, G. (2020). Randomized nonlinear one-class support vector machines with bounded loss function to detect of outliers for large scale IoT data. Future Gener. Comput. Syst. 112, 715–723. doi:10.1016/j.future.2020.05.045
Shen, Z., Ding, F., Yao, Y., Bhardwaj, A., Guo, Z., and Yu, K. (2022). A privacy-preserving social computing framework for health management using federated learning. IEEE Trans. Comput. Soc. Syst., 1–13. doi:10.1109/tcss.2022.3222682
Wang, B., Zhang, L., Ma, H., Wang, H., and Wan, S. (2019). Parallel LSTM-based regional integrated energy system multienergy source-load information interactive energy prediction. Complexity 2019, 1–13. doi:10.1155/2019/7414318
Wang, Q., Li, S., and Li, R. (2018). Forecasting energy demand in China and India: Using single-linear, hybrid-linear, and non-linear time series forecast techniques. Energy 161, 821–831. doi:10.1016/j.energy.2018.07.168
Wang, Q., and Song, X. (2019). Forecasting China's oil consumption: A comparison of novel nonlinear-dynamic grey model (gm), linear gm, nonlinear gm and metabolism gm. Energy 183 (15), 160–171. doi:10.1016/j.energy.2019.06.139
Wang, T., Fang, K., Wei, W., Tian, J., Pan, Y., and Li, J. (2022). Microcontroller unit chip temperature fingerprint informed machine learning for IIoT intrusion detection. IEEE Trans. Industrial Inf. 19 (2), 2219–2227. doi:10.1109/tii.2022.3195287
Wang, T., Li, J., Wei, W., Wang, W., and Fang, K. (2022). Deep-learning-based weak electromagnetic intrusion detection method for zero touch networks on industrial IoT. IEEE Netw. 36 (6), 236–242. doi:10.1109/mnet.001.2100754
Wang, W., Kumar, N., Chen, J., Gong, Z., Kong, X., Wei, W., et al. (2020). Realizing the potential of the internet of things for smart tourism with 5G and AI. IEEE Netw. 34 (6), 295–301. doi:10.1109/mnet.011.2000250
Yang, S. D., Ali, Z. A., Kwon, H., and Wong, B. M. (2022). Predicting complex erosion profiles in steam distribution headers with convolutional and recurrent neural networks. Industrial Eng. Chem. Res. 61 (24), 8520–8529. doi:10.1021/acs.iecr.1c04712
Yu, F., and Xu, X. (2014). A short-term load forecasting model of natural gas based on optimized genetic algorithm and improved BP neural network. Appl. Energy 134, 102–113. doi:10.1016/j.apenergy.2014.07.104
Keywords: industrial steam consumption, Centralized heating, heat load prediction, sensing data, LSTM
Citation: Yang M, Xu X, Cheng H, Zhan Z, Xu Z, Tong L, Fang K and Ahmed AM (2023) Industrial steam consumption analysis and prediction based on multi-source sensing data for sustainable energy development. Front. Environ. Sci. 11:1187201. doi: 10.3389/fenvs.2023.1187201
Received: 21 March 2023; Accepted: 09 May 2023;
Published: 02 June 2023.
Edited by:
Bryan M. Wong, University of California, Riverside, United StatesReviewed by:
Zulfikhar Ali, University of California, Riverside, United StatesQiang Wang, China University of Petroleum, Huadong, China
Copyright © 2023 Yang, Xu, Cheng, Zhan, Xu, Tong, Fang and Ahmed. This is an open-access article distributed under the terms of the Creative Commons Attribution License (CC BY). The use, distribution or reproduction in other forums is permitted, provided the original author(s) and the copyright owner(s) are credited and that the original publication in this journal is cited, in accordance with accepted academic practice. No use, distribution or reproduction is permitted which does not comply with these terms.
*Correspondence: Mingxia Yang, MzcwNDlAcXpjLmVkdS5jbg==; Xiaojie Xu, Y3NjY3B2QDE2My5jb20=
 Mingxia Yang
 Xiaojie Xu2*
 Ahmedin M. Ahmed
