 Marielle Hollstein1
 Mattheau Comerford
 Scott P. Egan
 Lauren B. Stadler
- 1Department of Civil and Environmental Engineering, Rice University, Houston, TX, United States
- 2Department of BioSciences, Rice University, Houston, TX, United States
- 3Dow Chemical Company, Freeport, TX, United States
Constructed Wetlands (CWs) are a cost-effective, versatile and sustainable choice for wastewater treatment. In these environments, microbial communities play a significant role in pollutant removal. However, little is known about how microbial communities in full-scale CWs contribute to maintaining water quality or how their dynamics change in response to pulse disturbances such as fire or freezes. Furthermore, few studies have examined the relationship between CW microbial community structure and performance in full-scale industrial operations. We characterized the water-column and leaf-litter layer microbial communities in a 110-acre free water surface CW that provides tertiary wastewater treatment to a plastics manufacturing plant. The CW’s sampling campaign was conducted over a 12-month period that included Winter Storm Uri, a 100-year freeze event. Analysis of 16S rRNA gene amplicon sequences revealed that the bacterial communities experienced a temporal shift. There was also a shift in microbial community structure between the influent and the first segment of the CW. However, no differences in microbial community structure were observed in the second segment of the CW. There was a negative association between microbial community diversity and chlorophyll a, as well as microbial community diversity and total suspended solids (TSS); demonstrating an increase in microbial biodiversity as water quality improved throughout the CW. Six months after the freeze, CW performance in terms of removal of water quality constituents began to return to former removal trends. Yet, there was still a significant difference in microbial community structure within the CW relative to the previous year. This suggests CW functional resilience despite a shift in microbial community structure in the wetland.
1 Introduction
Constructed wetlands (CWs) are a cost-effective, versatile, and sustainable alternative to conventional activated sludge wastewater treatment (Vymazal, 2011). CWs are implemented as secondary and tertiary treatment for industrial and municipal wastewaters, as a technology for nutrient removal (Dimuro et al., 2014; Wu et al., 2015; West et al., 2017; Zhu et al., 2021). CWs also provide habitats for native and endangered species and are shown to boost the region’s microbial diversity, an ecological characteristic linked to water quality (Knight et al., 1997; Cardinale., 2011; Hsu et al., 2011). Moreover, microbial communities are vital for CW performance, as they drive nutrient cycling within the system (Stottmeister et al., 2003; Rajan et al., 2018; Ping et al., 2019; Shirdashtzadeh et al., 2022). CW microbial communities contribute to the reduction of organic pollutants, as well as the removal of inorganic substances such as heavy metals, pesticides, and pharmaceuticals (Lv et al., 2017; Yan et al., 2018; Guo et al., 2020; Wang et al., 2022). Another important function of free water surface CWs and their microbial communities is to prevent eutrophication and mitigate algal blooms by regulating nutrient concentrations (Vymazal., 2007; Dunne et al., 2012; West et al., 2017; Xia et al., 2020). Previous studies have also assessed how CWs can control phytoplankton accumulation and limit unwanted cyanobacterial species (Zhong et al., 2011). Researchers have been able to correlate microbial community structure with treatment efficiency of eutrophic water in many mesocosm-scale CW studies, demonstrating how microbial activity plays a key role in enhancing overall water quality in these CW systems (Liu et al., 2016; Xu et al., 2018). Yet, few studies have been conducted on microbial community dynamics in full-scale CWs, especially in relation to eutrophication mitigation (Vymazal et al., 2021).
This study focuses on a 110-acre free water surface CW that provides tertiary wastewater treatment for a plastics manufacturing plant, located near Seadrift, Texas, along the Gulf coast. Upstream of the CW, the wastewater is conveyed through two facultative holding ponds before entering the wetland (Dimuro et al., 2014). Due to the long retention time in these holding ponds, algae and other phytoplankton proliferate. Before the CW was built, the total suspended solids (TSS) concentration in the effluent exceeded the EPA’s 40 mg/L TSS limit (Epa, 1997). The phytoplankton blooms also influenced the carbon dioxide concentration in the water, which caused the pH to fluctuate based on the phytoplankton’s diurnal cycle. The wastewater then required chemical treatment to neutralize the pH before discharge. After construction of the CW, chemical treatment for TSS removal and pH neutralization were no longer necessary. In a life cycle assessment study comparing this free water surface CW to a more traditional sequencing batch reactor for tertiary wastewater treatment, the CW had significant cost, energy, and material savings relative to the conventional alternative. The net percent value saving was estimated to be $282 million over the wetland’s life span (Dimuro et al., 2014).
The CW has been successfully treating the plastics manufacturing plant’s wastewater for 26 years, despite several notable storm events and other pulse disturbances. During August 2017, Hurricane Harvey inundated the surrounding area, leaving large amounts of plant debris behind. In March 2018 operators conducted a prescribed burn on the two eastern cells of the CW to remove this debris (Figure 1. The controlled burn targeted portions of Cell 3 and Cell 4 where the plant debris left over from Hurricane Harvey was most dense. After the burn, there were areas in the centers of Cell 3 and Cell 4 that remained unburned. The CW operators noted that phragmites grew back in areas previously dominated by cattail plants prior to the burn. The impact of prescribed burns on the performance and microbial communities in constructed wetlands treating industrial wastewater has never been assessed. In addition to the fire, in February 2021 the freeze caused by Winter Storm Uri was yet another unprecedented pulse disturbance in this CW’s history. Beginning on the evening of 14th February 2021, the winter storm brought temperatures in Seadrift, TX to below freezing (<32°F) for a period of over 48 h, which caused a massive plant die-off throughout the wetland and, for several months afterwards, plant detritus traveled through the CW. A freeze’s influence on the microbial community structure within a subtropical CW of this scale has previously never been studied. Consequently, this CW is a good model to assess biological diversity and microbial community dynamics for similar tertiary wastewater treatment systems utilized for large industrial applications.
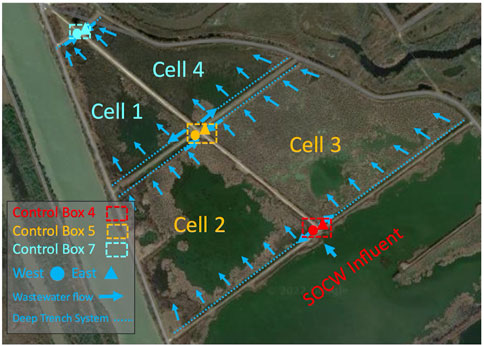
FIGURE 1. Layout of the CW (Cell 2, Cell 3, Cell 1, Cell 4), where Cell 2 and Cell 3 represent the first segment of the CW and Cell 1 and Cell 4 represent the second segment of the CW. Control Box 4 distributes water to Cell 2 and Cell 3. Water from Cell 2 and Cell 3 is conveyed to Control Box 5. Water from Cell 1 and Cell 4 is conveyed to Control Box 7.
There is limited knowledge of how pulse disturbances impact CW microbial community structure and alter the performance of full-scale CWs. Many CWs are designed to mitigate phytoplankton bloom conditions generated by preceding facultative holding ponds. Yet, there is little research on how these pulse disturbances affect downstream eutrophication potential or the organisms that balance ecosystem functioning to reduce blooms. Moreover, climate change has enhanced the severity of storms and variability of weather patterns. Scientists are attempting to discern whether the pulse events brought on by these storms have long-term effects on CW microbial communities (Jacquet and Altermatt, 2020). Studies indicate that severe storm disturbances can impact short-term plant and microbial biogeochemical cycling within estuarine, wetland, and other aquatic environments (Huang et al., 2021). More specifically, the Winter Storm Uri freeze’s impact on the CW’s pollutant removal trends and microbial community structure also presents an opportunity to assess how full-scale CW performance correlates to full-scale CW microbial community shifts.
In this study we performed a year-long characterization of the microbial communities across a full-scale, 110-acre CW. This was achieved by sampling the water-column and leaf-litter layer from six locations in the CW system between 25th August 2020–3rd August 2021 and using 16S rRNA gene sequencing to characterize the microbial communities. The objectives of this study were to 1) assess the relationship between the performance of the CW and its microbial communities, both over time and space; and 2) evaluate the impact of the controlled burn and the freeze on performance and the microbial communities in the CW. We hypothesized that 1) we would observe both spatial and temporal shifts in the microbial community across the CW; 2) shifts in the microbial community would be associated with changes in water quality parameters (suspended solids, pH, chemical oxygen demand (COD), NH4-N, chlorophyll a); and we could identify taxonomic groups strongly associated with changes in water quality parameters, and thus CW performance; 3) the controlled burn and the Winter Storm Uri freeze impacted the CW’s microbial community structure, also influencing performance.
2 Materials and methods
2.1 Site location and sampling procedure
The CW in this study is located directly southwest of a plastics manufacturing plant in Seadrift, Texas. The CW closely resembles the plant composition and structure of many other free water surface CWs and natural wetlands found in subtropical climates. This CW consists of emergent macrophytes, such as cattails, bullrushes, and phragmites planted in a shallow basin with a water depth ranging from 1 to 5 ft. The site’s average daily flow was approximately 5.8 MGD. The average HRT for the entire CW was approximately 7–9 days. As shown in Figure 1., effluent wastewater from a facultative holding pond is conveyed to Control Box 4 where it is then distributed to Cell 2 and Cell 3 from Control Box 4 West and Control Box 4 East outlet pipes. Cell 2 and 3 make up the first segment of the CW. Afterwards, the wastewater is combined in Control Box 5 and is distributed to Cell 1 and 4 through Control Box 5 West and Control Box 5 East outlet pipes. Cell 1 and 4 make up the second segment of the CW. Wastewater from Cell 1 and 4 is consolidated again in Control Box 7, the end point of the CW. Samples were collected near the outlet pipes directly east and west of Control Box 4 and near the inlet pipes directly east and west of Control Box 5 and 7. Samples for Control Box 4 East and Control Box 4 West were combined since they represent an average of the CW’s influent. Samples taken represent a total of 5 locations throughout the CW; the influent, as well of the ends of Cell 2, Cell 3, Cell 1, and Cell 4 (Figure 1). This was done to assess beginning, middle, and end points of the entire CW, while also isolating unburned and burned wetland cells (Cells 3 and 4 were burned, Cells 1 and 2 were not burned).
Eight rounds of water-column grab samples were taken from 25th August 2020 to 3rd August 2021 (Supplementary Table S1). The winter storm freeze event occurred in the middle of the sampling campaign; taking place 6 months after the initial sampling period and 6 months before the final sampling period. Plant operators collected water samples with a sampler swivel dipper near the inlet and outlet pipes of the wetland’s control structures; rinsing the sampler swivel dipper at least three times between sampling locations with wetland water. Sample aliquots for chlorophyll a determination were stored in 500 mL opaque amber HDPE bottles. Sample aliquots for DNA extraction as well as TSS, volatile suspended solids (VSS), COD and NH4 determination were stored in clear 250 mL and 500 mL HDPE bottles. To study the microbial communities found in the wetland’s leaf-litter layer, passive samplers were created by inserting approximately 4–6 oz of Encompass All 5 mm granular activated carbon (ASIN: B01BX95VZU) in CNZ universal media fine mesh aquarium bags (ASIN: B015S1WW9). Seven rounds of passive samplers were deployed on the leaf litter layer near water sampling locations and retrieved multiple weeks afterwards (Supplementary Table S2). All samples were immediately stored in separate Ziplock bags and placed on ice after collection. Passive samplers were created by filling fine-mesh aquarium filter bags with granular activated carbon. Passive samplers were retrieved, stored in Whirl-Pak bags, and placed on ice. All samples were shipped within 24 h on ice via FedEx overnight to Rice University for further processing and analysis.
2.2 Water chemistry and environmental parameter measurements
Water, temperature, and pH were measured onsite by CW operators. TSS and VSS were measured following Standard Method 2,540 and NH4-N was measured using Standard Method 4,500 (APHA, 2017). COD was measured using low-range CHEMetrics COD vial kits with a potassium hydrogen phthalate blank standard curve (CHEMetrics, US). All water samples designated for chlorophyll a extraction were filtered and processed in low-light conditions. 150 mL of water from the CW water-column was filtered through 0.45-micron filters and stored at −20°C until chlorophyll a extraction. Chlorophyll a samples were extracted and measured spectrophotometrically following EPA method 446.0.
2.3 DNA extraction and 16S rDNA gene sequencing
For each water-column sample, 50 mL was filtered through a 0.22-micron filter and filters were stored at −80°C until DNA extraction. DNA was extracted from 40 water-column samples (Supplementary Table S1). Biomass was scraped from passive samplers and decanted from passive sampler collection Whirl-Pak bags into 15 mL centrifuge tubes. Solids were spun down, collected in 0.25–0.50-g pellets and stored in a −80°C freezer until extraction. Three passive samplers were lost after deployment for unknown reasons, likely due to local wildlife. DNA was extracted from a total of 32 leaf-litter samples (Supplementary Table S2). The 25th August 2020 water samples’ genomic DNA was extracted using the FastDNA SPIN Kit for Soil (MP Biomedicals, France), following the manufacturer’s protocol. To increase through-put all other water-column and passive sampler biofilm samples’ genomic DNA was extracted using Promega’s Maxwell® RSC PureFood GMO and Authentication Kit (Promega Corporation, US). Concentrations of DNA were measured using a DNA HS Assay kit on a Qubit fluorometer (Thermo Fisher Scientific, US). To pass quality assurance (QA), sample DNA extracts must have contained 30 ng of DNA template. The 20th October 2020 leaf-litter biofilm sample extract from Cell 4 did not pass QA. DNA extracts from the 71 samples were shipped to BGI genomics for PCR amplification and sequencing. Technicians at BGI genomics amplified the V4 hypervariable region of the bacterial 16S rRNA gene using F515 (5′- GTGCCAGCMGCCGCGGTAA-3′) and R806 (5′- GGACTACHVGGGTWTCTAAT-3′) primers (BGI genomics, China). PCR products were purified by Agencourt AMPure XP beads and the purified PCR products were dissolved in an elution buffer (BGI genomics, China). After library QA, qualified libraries underwent paired-end sequencing on the HiSeq 2,500 platform.
2.4 Sequencing analysis
Microbial communities were analyzed using the Schloss lab MiSeq standard operating procedure using Mothur v.1.43.0 (Kozich et al., 2013). Sequences were clustered into operational taxonomic units (OTUs) with a 97% sequence similarity threshold. The consensus taxonomy was then determined for each OTU, where reference sequences were obtained from a Mothur-formatted version of the ribosomal database project (RDP) training set (v. 9) (Kozich et al., 2013). All sample groups were subsampled to the smallest sample size for downstream alpha and beta-diversity analysis. Rarefaction curves were generated to visually assess the number of OTUs identified per sample as a function of sequencing depth (Figure 2C). Relative abundances were determined for the top seven dominant phyla from the taxonomy summary files generated in Mothur. Species richness (Chao1) indices and species evenness (Shannon) indices were calculated using Mothur for an alpha-diversity analysis. For beta-diversity, a non-metric multidimensional scaling (NMDS) paired with an analysis of molecular variance (AMOVA) test was used to determine significant differences in sample bacterial community structure through separate CW sampling locations and sampling periods. The sequence distance matrices generated were visualized using the NMDS plots (Figure 4). Samples were grouped by location (i.e., Influent, Cell 2, Cell 3, Cell 1, Cell 4) to determine spatial changes and by sampling time period to determine temporal changes. Design files were also created to group samples by sample type, sampling location, and sampling time period for AMOVA. The AMOVA results for different sampling periods was determined with and without influent samples included in the analysis to determine if influent community structure impacted differences observed between samples grouped by different sampling rounds. Correlation coefficients for each OTU were calculated in Mothur using the corr. axis command and were used to identify individual OTUs associated with shifts in microbial community structure (Supplementary Table S15) (Kozich et al., 2013). These correlation coefficients were overlaid onto the original sample NMDS plot as an ordination biplot to visualize associations between specific OTUs and the axes (Figure 7B). Code for these analyses performed using Mothur is shown in the SI (App. B). Sequence reads for all samples have been submitted to the National Center for Biotechnical Information (NCBI) database (BioProjectID: PRJNA948846).
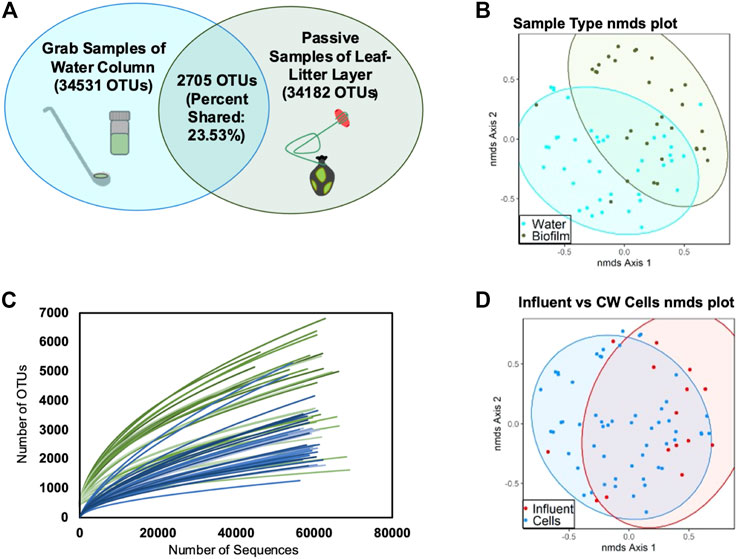
FIGURE 2. Observed OTUs clustered at 97% sequence similarity. (A) Venn diagrams of distinct and shared species in water-column and leaf-litter layer biofilm samples; (B) NMDS analysis plot of all samples grouped by water-column versus leaf-litter layer sample type (AMOVA, p < 0.001); (C) rarefaction curves of water-column (blue) and leaf-litter layer (green) samples; and (D) NMDS analysis plot of all samples grouped by influent versus the rest wetland cells (AMOVA, p = 0.009).
2.5 Data analysis
Percent removal for each environmental parameter during the first segment of the CW was calculated by subtracting averaged first segment concentrations from averaged influent concentrations. Averaged second segment concentrations were subtracted from averaged first segment concentrations to determine percent removal in the second segment of the CW. T-tests were used to determine significant differences in environmental parameter reduction rates between the first half versus the second half of the CW, as well as any significant differences between parallel CW cells (Cell 1 versus Cell 4 and Cell 2 versus Cell 3).
A Spearman correlation analysis was performed using the “Hmisc” package in R to determine the degree of correlation between the relative abundance of the seven most dominant phyla and measured environmental parameters (TSS, VSS, COD, NH4-N, Chlorophyll a, pH, and Temp) within samples. A heatmap was generated in R to illustrate the correlation matrix among the different environmental parameters. Spearman correlation coefficients were also determined to assess the relationship between environmental parameters and the relative abundance of dominant phyla (Supplementary Figures S2, S3).
3 Results and Discussion
3.1 CW wastewater treatment performance
Removal rates throughout the CW were largely dependent on influent concentrations of TSS, VSS, COD, and chlorophyll a, which fluctuated over time (Supplementary Figure S1). Supplementary Tables S3, S4 show lower removal rates typically corresponded to influent concentrations that were already within or near EPA standards (EPA, 2022). The CW had the greatest removal efficiencies on days that corresponded with some of the greatest pollutant concentrations in the influent. Studies have shown that removal efficiencies usually decrease if influent environmental parameter concentrations are especially low (Kadlec et al., 1995; Rousseau et al., 2004). This study’s CW had the lowest removal efficiencies in the first half of the 12th March 2021 sampling period. During this sampling period plant detritus associated with the freeze was navigating through the CW. The additional organic material elevated TSS, VSS, COD, chlorophyll a, NH4-N, and pH levels at the mid- and end-points of the CW. Average water quality measurements for all sampling periods are presented in Supplementary Table S3. Percent reductions of environmental parameters throughout the CW are presented in Supplementary Table S4.
NH4-N levels increased from the influent to Cells 1 and 4 of the CW during most of the sampling occasions. This is not unexpected because NH4-N concentrations were relatively low within the influent (<1 mg/L) for all but one sampling round. The natural decay of plant biomass and other organic matter in this study’s CW may have been responsible for the slight uptick in NH4-N levels in the middle and end sampling points (Yamanaka, 1995). A strong negative correlation was evident between temperature and NH4-N (ρ = −0.7109), confirming that nitrification rates were sensitive to temperature, and increased as temperature increased. We observed that effluent NH4-N concentration tripled during the sampling period following the Winter Storm Uri freeze.
Cell 2 achieved significantly greater changes towards pH neutrality relative to Cell 3 (p = 0.043). These differences in pH reduction may be the result of suspected short-circuiting due to Cell 3’s denser plant coverage in some regions. For all other water chemistry parameters, parallel wetland cells (Cell 2 vs. Cell 3 and Cell 1 vs. Cell 4) showed no significant differences in percent removal (AMOVA, p
3.2 CW microbial community structure
A total of 5,185,553 reads were initially generated for all samples after sequencing. A total of 4,177,818 sequences were analyzed after filtering the data and removing undesired reads, resulting in 55,625 OTUs (App. B). 553 of the OTUs were classified as archaea and the other 55,072 were classified as bacteria. The sample with the smallest number of sequences contained 41,960 reads; therefore, all other samples were subsampled to this size for alpha and beta diversity analyses.
The CW’s leaf-litter layer microbial communities were found to be distinct from the water-column communities (p < 0.001) (Figures 2A, B). Furthermore, the leaf-litter layer contained, on average, more diverse microbial communities than the water-column (Supplementary Tables S4, S5). Leaf-litter layer Shannon’s diversity has previously been shown to increase in wetlands with more planted regions (Li et al., 2021). The plant matter and root exudates found within this sediment interface zone of this CW may have introduced greater substrate complexity relative to the water-column, thereby contributing to more diverse microbial communities (Rafieenia et al., 2022). Moreover, the CW’s leaf-litter layer microbial communities had fewer significant structural shifts over different sampling periods relative to the water-column communities (AMOVA, p < 0.05) (Supplementary Tables S8, S9). Previous studies have established that substrate variability can drive microbial community shifts in other CWs (Feng et al., 2021; Wang et al., 2022). Thus, substantial differences in the CW’s substrate composition may account for greater litter layer community stability. Microbial community succession occurs more slowly in the leaf-litter layer region relative to the water-column and leaf litter layer microbial communities are less influenced by the CW’s hydrology because the microbial communities in the leaf litter layer have less immediate exposure to the changing wastewater substrate as compared to the microbial communities that already exist in the wastewater. The leaf litter microbial communities are also influenced by factors that do not change as much over the CW’s weeklong HRT, such as plant root exudate exposure (Rafieenia et al., 2022). This is consistent with our finding that this study’s CW’s leaf-litter layer microbial communities were more stable than water-column communities with respect to time.
The phyla compositions found throughout the CW water-column were similar to other previous studies of microbial communities in eutrophic water bodies and free water surface CWs that treat wastewater containing high nutrient concentrations. Figure 3 shows the relative abundances of dominant phyla throughout the CW for each sampling period within A) the water-column and B) the leaf-litter layer biofilm. The most dominant phyla in the CW water-column and the leaf-litter layer include Proteobacteria, Bacteroidetes, Cyanobacteria, Verrucomicrobia, Firmicutes, Chloroflexi, and Actinobacteria. Other researchers have observed that the dominance of specific cyanobacteria genera influenced phyla-level bacterial compositions in a eutrophic reservoir (Guedes et al., 2018). Furthermore, the CW’s influent cyanobacterial bloom intensity and the dominant cyanobacteria genera may be linked to the rest of CWs taxonomic composition.
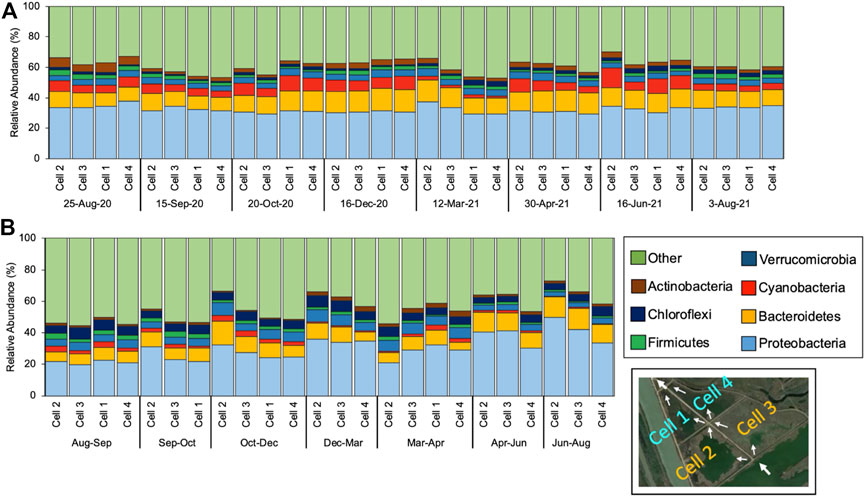
FIGURE 3. Relative abundance (%) of the phylum-level taxonomic diversity for 7 most dominant phyla of different samples collected from the ends of the CW’s Cell 2, Cell 3, Cell 1 and Cell 4 through (A) grab samples of the water column and (B) passive sampler biofilms.
3.3 Microbial community analysis reveals a temporal microbial community shift, rather than a spatial shift throughout the second segment of the CW
The microbial communities in the CW’s water-column experienced a significant temporal shift throughout almost all sampling periods (AMOVA, p < 0.05) (Figures 4A, C; Supplementary Tables S8, S9). The 25th August 2020 and 15th September 2020 sampling periods were the only times when no significant microbial community differences were observed. Notably, these dates also corresponded to when we changed DNA extraction kit methods, indicating that extraction kit choice likely did not drive any significant changes in microbial community structure. The time between the 25th August 2020 and 15th September 2020 sampling periods may have also been too brief for a significant structural shift to occur. Lin et al. (2012) asserts that microbial community shifts can be reasonably attributed to environmental changes that occur over a period of months rather than days. Seasonal changes in water temperature may drive the temporal microbial community shift in the CW. Several studies have also observed that seasonally-dependent factors, such as substrate and nutrient availability, also influence other CW microbial community structure (Vymazal, 2007; Koranda et al., 2013; Xu et al., 2021).
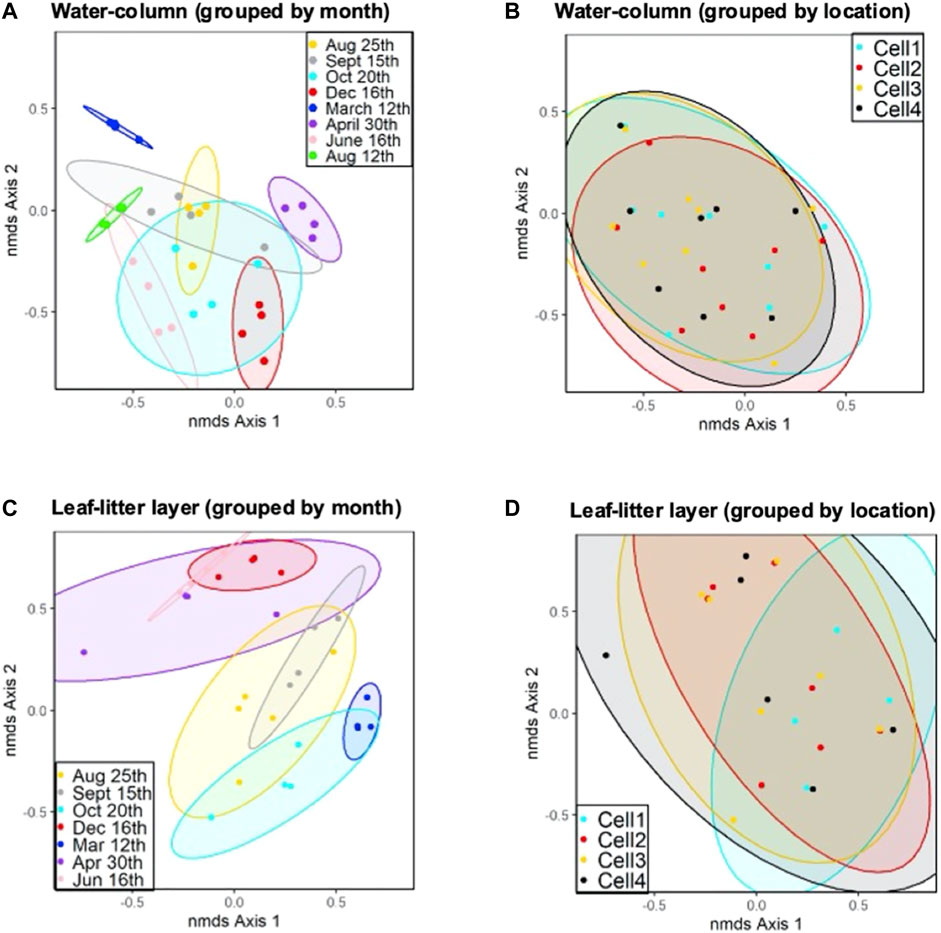
FIGURE 4. NMDS analysis plot with 90% confidence ellipses of (A) water-column samples for CW cells grouped by sampling period; (B) all water-column samples for CW cells grouped by sampling location; (C) NMDS analysis plot with 90% confidence ellipses of leaf-litter layer samples for CW cells grouped by sampling period; and (D) leaf-litter samples for CW cells grouped by sampling location.
No spatial distinctions in microbial community structure were observed in the second segment of the CW for both the water-column and leaf-litter layer within the same sampling periods (AMOVA p > 0.05) (Figures 4B, D). The absence of spatial changes in the second segment of the CW indicates that the microbial communities in this environment are more sensitive to temporal and seasonal changes than spatial factors. The shift in microbial community structure within the first segment may also result from substrate changes in the wastewater from the secondary and tertiary holding ponds. Moreover, no significant differences were detected in microbial communities when comparing community structure in unburned and burned cells (Cell 2 vs. Cell 3 and Cell 1 vs. Cell 4) (AMOVA p > 0.05). This indicates that the prescribed burn had no long-term impact on the microbial communities in Cells 3 and 4.
The influent wastewater’s substrate composition may affect eutrophication potential throughout the CW, imposing temporal changes on the CW’s microbial community structure. This is because eutrophication is heavily impacted by seasonal parameters (e.g., temperature and precipitation) and often results in extensive, seasonal microbial community shifts (Tromas et al., 2017; Zhao et al., 2017; Xu et al., 2021). Similar to this research, another study centered on the microbial communities in a eutrophic bay receiving industrial wastewater has shown spatial shifts in microbial communities to be minor in comparison to temporal shifts (Zhang et al., 2016). Microbial community shifts in this study’s CW may be connected to the wetland’s phytoplankton bloom intensity from season to season. Substrate composition may alter the preceding facultative holding ponds’ eutrophication potential, as pollutant concentrations are shown to fluctuate in this environment during different times. Seasonal weather patterns can then influence the severity of the ensuing phytoplankton blooms, shaping microbial community structure in the CW.
3.4 Microbial community diversity correlates to water quality and phytoplankton bloom conditions within the CW
Microbial community structure in the influent was also shown to be significantly distinct compared to the microbial community structure in the rest of the wetland’s cells (AMOVA p > 0.05) (Figure 2D). Microbial community richness and diversity increased between the influent and the effluent of Cells 2 and 3 as measured water quality parameter concentrations declined (Supplementary Tables S6, S7). Many of these parameters, such as TSS, VSS, COD and pH, are also associated with phytoplankton bloom conditions. Previous research has linked other CWs’ performance to microbial community structure and diversity. In one study, the greatest wetland TN and TOC removal efficiencies were achieved when CW’s bacterial richness and diversity were also at their greatest levels (Zhu et al., 2021). Researchers found a correlation between Shannon’s diversity index and BOD5, NH4-N, and NO3-N in a CW built to treat eutrophic lake water; asserting that these diversity indices can be utilized as bioindicators for pollutant removal rates in this environment (Zhang et al., 2015). While the shift in this study’s CW microbial community structure occurs in the first segment of the CW for all sampling periods, the period of time with the greatest microbial diversity occurred during the 12th March 2021 and 30th April 2021 sampling periods in Cell 1 and 4, the second segment of the CW (Figures 5 A, B). During these time periods overall CW operations heavily relied on the performance of Cell 1 and Cell 4 since removal of water quality constituents primarily occurred in these cells.
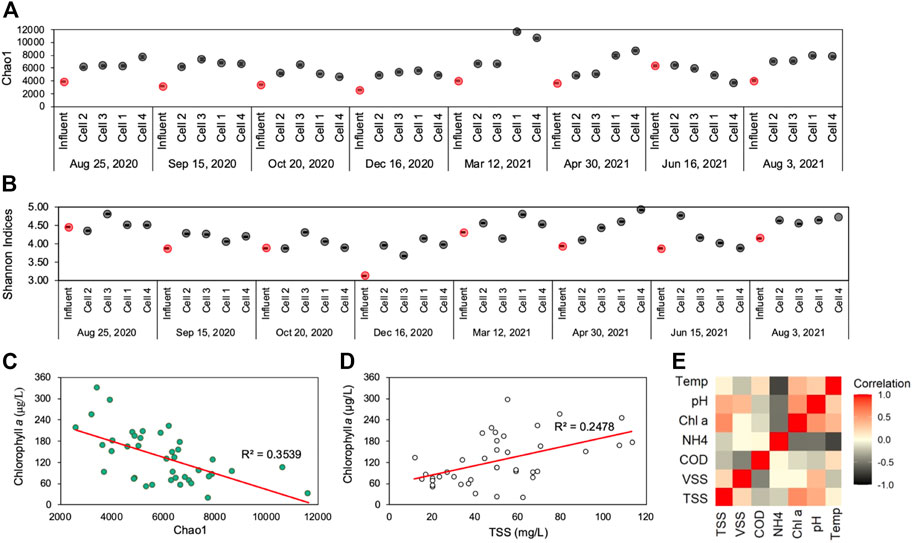
FIGURE 5. (A) Chao1 and (B) Shannon diversity indices of water-column samples in every location throughout the CW during each sampling round—with red points demonstrating influent sample diversity indices; (C) Chlorophyll a concentration versus Chao1 indices with trendline and coefficient of determination; (D) Chlorophyll a concentration versus TSS concentration with trendline and coefficient of determination (E) Spearman correlation analysis heatmap of environmental parameters (TSS, VSS, COD, NH4-N, Chlorophyll a, pH, and temperature) within the CW cells (left), demonstrating a positive correlation between chlorophyll @ and TSS (p = 0.526) within CW cells.
Chlorophyll a, a proxy measurement for viable phytoplankton biomass (LaBaugh et al., 1995), was negatively correlated with Chao1 and Shannon indices, which suggests that microbial diversity was diminished in regions of the CW where phytoplankton bloom conditions prevailed. Throughout the CW, parameters that were linked to elevated bloom conditions, pH and temperature, were also positively associated with chlorophyll a (Figures 5C–E, Spearman ρ ≥ 0.362). Moreover, chlorophyll a concentrations were correlated to TSS concentrations (Spearman, ρ = 0.575) in the CW. This confirms that TSS, the primary environmental parameter the CW is designed to remove, largely takes the form of phytoplankton biomass. The CW thus effectively mitigated the phytoplankton blooms generated in the preceding facultative holding ponds. In other studies, alpha diversity was also shown to decrease in environments experiencing seasonal phytoplankton blooms (Angeler et al., 2013; Su et al., 2017). When phytoplankton bloom conditions in the water-column declined near the second segment of the CW, microbial diversity increased and overall water quality improved.
More specifically, the cyanobacterial population within the phytoplankton bloom may have influenced the abundance of other CW bacteria and may have affected other water quality metrics. Cyanobacterial abundance also served as an indicator of elevated nutrient concentrations in the holding ponds and the CW. As primary producers, cyanobacteria are dependent on sources of nitrogen and phosphorus. Cyanobacterial growth demonstrates the environment’s eutrophication potential (Paerl et al., 2016). The rise in cyanobacterial relative abundance during the December sampling period corresponded to greater than average NH4-N concentrations at all CW sampling locations. Nevertheless, the high relative abundance of cyanobacteria in the CW may, then, affect overall microbial diversity. Numerous studies have shown cyanobacterial bloom occurrences are correlated with sharp changes in diversity indices, such as Shannon’s (Tromas et al., 2017; Yang et al., 2021; Zhu et al., 2021). In this study’s CW, Microcystis, one of the more dominant cyanobacteria genera, peaked during the sampling period with the lowest recorded Shannon and Chao1 indices ( Figures 5A, B, Figure 7A). Other researchers have also found that Microcystis blooms correspond to lower diversity and evenness indices in bacterial populations throughout seasonal algal blooms (Su et al., 2017).
3.5 The Winter Storm Uri freeze altered pollutant removal patterns and microbial community structure throughout the CW cells
The CW was functionally resilient, despite the Winter Storm Uri freeze’s prolonged impact on microbial community dynamics. Pollutant removal trends were restored approximately 6 months after the freeze event. Winter Storm Uri brought on temporary changes in pollutant removal between the first and second segment of the CW (Figure 6). Significantly greater pollutant removal percentages were reported during the second segment of the CW for VSS (p = 0.007) and COD (p = 0.047) when assessing removal rates from sampling periods that occurred after the freeze (12 March 2021–3 August 2021). During this time, plant debris contributed to the water-column’s organic matter content within the first segment of the CW. The freeze may have altered pH neutralization trends within the first and second segment of the CW. Many irregularities in water quality parameter reduction trends were also recorded during the 12th March 2021 sampling date, the time period closest to the freeze. When the 12th March 2021 sampling date was excluded from the analysis, there were significantly greater pH trends towards neutrality in the first half of the CW (p = 0.037). During the March 12th sampling period NH4-N levels sharply increased from 0.757 to 3.1412 mg/L throughout the CW (Figure 5). Likewise, all water quality parameters had greater reduction percentages in the second segment of the CW. During the March 12th and 30th April 2021 sampling periods, it was evident that the freeze took a toll on the CW’s performance throughout the first segment of the wetland. VSS, COD, NH4-N, and chlorophyll a concentration increased between the first segment of the CW, rather than decreasing between the first segment of the CW as they had in the previous four sampling periods.
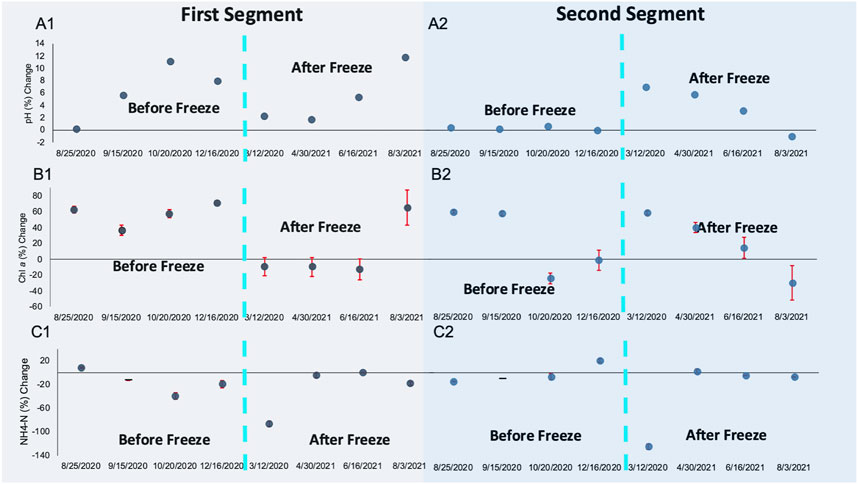
FIGURE 6. (A) Percent change towards pH neutrality; (B) percent change in Chlorophyll a concentration; and (C) percent change in NH4-N concentration for (A1-C1) the first segment of the CW and for (A2-C2) the second segment of the CW; dashed blue lines demarcate sampling periods before (left) and after (right) the Winter Storm Uri Freeze.
The freeze shifted the CW’s microbial communities, but changes in environmental parameters begin to return to their original patterns throughout the two CW segments; demonstrating the CW’s ecological resilience after a pulse disturbance. The microbial communities in the water-column and leaf-litter layer biofilm samples collected closest to the freeze, 12th March 2021 were distinct from samples collected from other time periods (AMOVA p < 0.05) (Supplementary Table S10). Figure 7 also reveals that in the time period following the Winter Storm Uri freeze, the shift in microbial communities was driven by the decline of dominant cyanobacteria genera, Microcystis, Synechococcus and Prochlorococcus (Figure 7). Most notably, these genera are observed to drastically decrease in relative abundance in all CW water-column samples during the 12th March 2021 sampling period. However, Synechococcus and Prochlorococcus relative abundance is shown to recover during the following 30th April 2021 sampling period, but fluctuated in subsequent sampling periods.
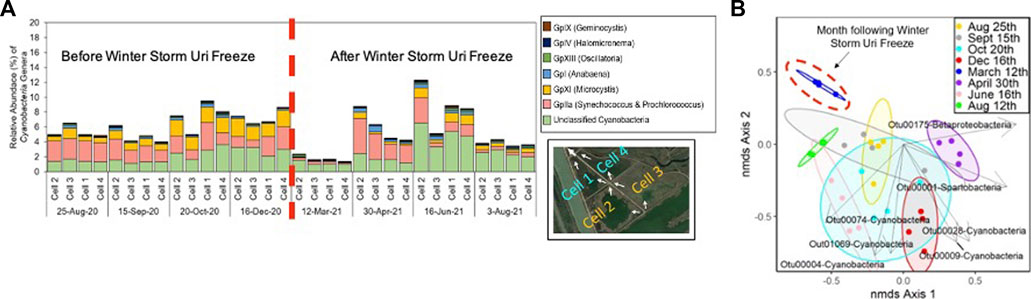
FIGURE 7. (A) Relative abundance of cyanobacteria genera with dashed red line demarcating before (left) and after (right) the Winter Storm Uri Freeze; (B) NMDS plot overlayed with ordination biplot showing genera of the OTU’s significantly associated with driving the shift in the CW’s microbial community composition; OTU00028 & OTU00175: Gplla (Synechococcus and Prochlorococcus), OTU01069: GpXI (Microcystis), OTU00074: GpXIll (Oscillatoria), and other unclassified Cyanobacteria, Spartobacteria, and Betaproteobacteria genera).
Microbial community contributions to constructed wetland performance are poorly understood, particularly in response to pulse disturbances from extreme weather events that are expected to increase in intensity and frequency with climate change (Allison and Martiny, 2008; Ma et al., 2018; McDowell et al., 2018). This study’s CW microbial communities may have been both directly and indirectly affected by the freeze. After a pulse event like a freeze, wetland ecology is impacted at multiple taxonomic scales, compounding the initial disturbance’s impact on the microbial communities (Ross et al., 2009; Means et al., 2016). Various cyanobacteria genera, such as Synechococcus, were observed to rapidly die at temperatures below 15°C (Abeliovich and Shilo, 1972). Excess nutrients released from freeze-induced plant death may also spur future algal and cyanobacterial blooms (Paerl, 2016). Within this study’s CW, this could potentially explain the sharp decline in the relative abundance of cyanobacteria during the 12th March 2021 sampling period, followed by a steady recovery thereafter. Ultimately, the CW microbial communities’ dynamics after the freeze demonstrated the system’s resilience in response to major pulse disturbance.
4 Conclusion
A 16S rRNA gene analysis on the microbial communities in this study’s CW revealed a temporal shift in community structure. This indicated that the CW’s microbial communities may have been affected by substrate composition and seasonal changes. We did not observe any long-term impact on the CW’s water-column or leaf-litter layer microbial communities from the historical controlled burn. As the CW removes TSS, the wetland’s microbial diversity increases, indicating that healthy ecosystem functioning is tied to improved water quality. The freeze brought on by Winter Storm Uri was considered an unprecedented pulse disturbance during the 26-years the CW has been in operation. The freeze created a massive plant die off, raising the VSS, NH4-N, COD, and pH levels within the first segment of the CW for several months after the event. Analyzing water quality parameters and microbial communities before and after the event also revealed that the CW experienced an overall shift in microbial community structure. While environmental pollutant reduction trends recovered to their previous rates approximately 6 months after the freeze, microbial community structure remained altered. This supports the conclusion that the CW is capable of supporting functionally redundant communities in the context of tertiary wastewater treatment. The shift in pollutant removal trends after the freeze confirmed that the CW was able to rebound after a pulse disturbance.
Data availability statement
The data presented in the study are deposited in the National Center for Biotechnology (NCBI) Sequence Read Archive (SRA), accession number: PRJNA948846.
Author contributions
MH: investigation, methodology, formal analysis, writing—original draft. MC: investigation MA: investigation, resources, writing—review and editing MU: investigation, resources SE: conceptualization, methodology, writing—review and editing, resources, supervision LS: conceptualization, methodology, resources, supervision, writing—review and editing.
Funding
This project was supported by funding from Dow Chemical Company in conjunction with Jacobs Engineering (Grant no. 148005148).
Acknowledgments
We would like to thank Charles Toburen, Gary Jones, Robert Christianson, Scott Cesarz, Gretchen Foust, and Jim Bays from Jacobs Engineering for helping organize the CW sampling campaign. We greatly appreciate the help provided by Gary Curry, Jeff Evans, Robert Dechert, David Haeber, Purvi Patel, Jamie Moreno, Jim Strunk, and Ivan Jimenez in collecting and shipping water samples from the CW. We would also like to thank Rice undergraduate student Junha Li for helping process samples.
Conflict of interest
MU and MA were employed by Dow Chemical Company.
The remaining authors declare that the research was conducted in the absence of any commercial or financial relationships that could be construed as a potential conflict of interest.
Publisher’s note
All claims expressed in this article are solely those of the authors and do not necessarily represent those of their affiliated organizations, or those of the publisher, the editors and the reviewers. Any product that may be evaluated in this article, or claim that may be made by its manufacturer, is not guaranteed or endorsed by the publisher.
Supplementary material
The Supplementary Material for this article can be found online at: https://www.frontiersin.org/articles/10.3389/fenvs.2023.1187143/full#supplementary-material
References
Abeliovich, A., and Shilo, M. (1972). Photooxidative death in blue-green algae. J. Bacteriol. 111 (3), 682–689. doi:10.1128/jb.111.3.682-689.1972
Allison, Steven D., and Martiny, Jennifer B. (2008). Resistance, resilience, and redundancy in microbial communities. Proc. Natl. Acad. Sci. 105 (1), 11512–11519. doi:10.1073/pnas.0801925105
Angeler, David G., and Johnson, Richard K. (2013). Algal invasions, blooms and biodiversity in lakes: Accounting for habitat-specific responses. Harmful Algae 23, 60–69. doi:10.1016/j.hal.2013.01.001
Apha, (2017). Standard methods for the examination of water and wastewater. Washington, DC, USA: American Public Health Association APHA, 1–1504.
Cardinale, B. J. (2011). Biodiversity improves water quality through niche partitioning. Nature 472 (7341), 86–89. doi:10.1038/nature09904
DiMuro, Johnathan L., Guertin, F. M., Helling, R. K., Perkins, J. L., and Romer, S. (2014). A financial and environmental analysis of constructed wetlands for industrial wastewater treatment. J. Industrial Ecol. 18 (5), 631–640. doi:10.1111/jiec.12129
Dunne, Ed J., Coveney, M. F., Marzolf, E. R., Hoge, V. R., Conrow, R., Naleway, R., et al. (2012). Efficacy of a large-scale constructed wetland to remove phosphorus and suspended solids from lake apopka, Florida. Ecol. Eng. 42, 90–100. doi:10.1016/j.ecoleng.2012.01.019
Epa, (2022). Organic chemicals, plastics and synthetic fibers effluent guidelines. https://www.epa.gov/eg/organic-chemicals-plastics-and-synthetic-fibers-effluent-guidelines.[Online]. Available
Epa (1997). NPDES permit writer’s manual. “Technology-Based effluent limitations”. https://www.epa.gov/.
Feng, L., He, S., Wei, L., Zhang, J., and Wu, H. (2021). Impacts of aeration and biochar on physiological characteristics of plants and microbial communities and metabolites in constructed wetland microcosms for treating swine wastewater. Environ. Res. 200, 111415. doi:10.1016/j.envres.2021.111415
Guedes, Iame A., Rachid, C. T. C. C., Rangel, L. M., Silva, L. H. S., Bisch, P. M., Azevedo, S. M. F. O., et al. (2018). Close link between harmful cyanobacterial dominance and associated bacterioplankton in a tropical eutrophic reservoir. Front. Microbiol. 9, 424. doi:10.3389/fmicb.2018.00424
Guo, X., Zhong, H., Li, P., and Zhang, C. (2020). Microbial communities responded to tetracyclines and Cu(ii) in constructed wetlands microcosms with Myriophyllum aquaticum. Ecotoxicol. Environ. Saf. 205, 111362. doi:10.1016/j.ecoenv.2020.111362
Hsu, Chorng-Bin, Hsieh, H. L., Yang, L., Wu, S. H., Chang, J. S., Hsiao, S. C., et al. (2011). Biodiversity of constructed wetlands for wastewater treatment. Ecol. Eng. 37 (10), 1533–1545. doi:10.1016/j.ecoleng.2011.06.002
Huang, S., Sherman, A., Chen, C., and Jaffé, P. R. (2021). Tropical cyclone effects on water and sediment chemistry and the microbial community in estuarine ecosystems. Environ. Pollut. 286, 117228. doi:10.1016/j.envpol.2021.117228
Jacquet, Claire, and Altermatt, Florian (2020). The ghost of disturbance past: Long-term effects of pulse disturbances on community biomass and composition. Proc. R. Soc. B Biol. Sci. 287 (1930), 20200678. doi:10.1098/rspb.2020.0678
Kadlec, R. (1995). Overview: Surface flow constructed wetlands. Water Sci. Technol. 32 (3), 1–12. doi:10.1016/0273-1223(95)00599-4
Knight, Robert L. (1997). Wildlife habitat and public use benefits of treatment wetlands. Water Sci. Technol. 35 (5), 35–43. doi:10.2166/wst.1997.0159
Koranda, M., Kaiser, C., Fuchslueger, L., Kitzler, B., Sessitsch, A., Zechmeister-Boltenstern, S., et al. (2013). Seasonal variation in functional properties of microbial communities in beech forest Soil. Soil Biol. Biochem. 60, 95–104. doi:10.1016/j.soilbio.2013.01.025
Kozich, J. J., Westcott, S. L., Baxter, N. T., Highlander, S. K., and Schloss, P. D. (2013). Development of a dual-index sequencing strategy and curation pipeline for analyzing amplicon sequence data on the MiSeq Illumina sequencing platform. Appl. Environ. Microbiol. 79 (17), 5112–5120. doi:10.1128/AEM.01043-13
LaBaugh, James W. (1995). Relation of algal biovolume to chlorophyll a in selected lakes and wetlands in the north-central United States. Can. J. Fish. Aquatic Sci. 52 (2), 416–424. doi:10.1139/f95-043
Li, J., Chen, Q., Li, Q., Zhao, C., and Feng, Y. (2021). Influence of plants and environmental variables on the diversity of Soil microbial communities in the yellow river delta wetland, China. Chemosphere 274 (2021), 129967. doi:10.1016/j.chemosphere.2021.129967
Lin, X., McKinley, J., Resch, C. T., Kaluzny, R., Lauber, C. L., Fredrickson, J., et al. (2012). Spatial and temporal dynamics of the microbial community in the hanford unconfined aquifer. ISME J. 6 (9), 1665–1676. doi:10.1038/ismej.2012.26
Liu, Jia, Yi, N. K., Wang, S., Lu, L. J., and Huang, X. F. (2016). Impact of plant species on spatial distribution of metabolic potential and functional diversity of microbial communities in a constructed wetland treating aquaculture wastewater. Ecol. Eng. 94, 564–573. doi:10.1016/j.ecoleng.2016.06.106
Lv, T., Zhang, Y., Carvalho, P. N., Zhang, L., Button, M., Arias, C. A., et al. (2017). Microbial community metabolic function in constructed wetland mesocosms treating the pesticides imazalil and tebuconazole. Ecol. Eng. 98, 378–387. doi:10.1016/j.ecoleng.2016.07.004
Ma, X., Song, X., Li, X., Fu, S., Li, M., and Liu, Y. (2018). Characterization of microbial communities in pilot-scale constructed wetlands with salicornia for treatment of marine aquaculture effluents. Archaea 2018, 1–12. doi:10.1155/2018/7819840
McDowell, Nate G., Michaletz, S. T., Bennett, K. E., Solander, K. C., Xu, C., Maxwell, R. M., et al. (2018). Predicting chronic climate-driven disturbances and their mitigation. Trends Ecol. Evol. 33 (1), 15–27. doi:10.1016/j.tree.2017.10.002
Means, Mary M., Ahn, C., and Noe, G. B. (2017). Planting richness affects the recovery of vegetation and Soil processes in constructed wetlands following disturbance. Sci. Total Environ. 579, 1366–1378. doi:10.1016/j.scitotenv.2016.11.134
Paerl, Hans W., Gardner, W. S., Havens, K. E., Joyner, A. R., McCarthy, M. J., Newell, S. E., et al. (2016). Mitigating cyanobacterial harmful algal blooms in aquatic ecosystems impacted by climate change and anthropogenic nutrients. Harmful Algae 54, 213–222. doi:10.1016/j.hal.2015.09.009
Ping, Y., Pan, X., Li, W., Wang, J., and Cui, L. (2019). The Soil bacterial and fungal diversity were determined by the stoichiometric ratios of litter inputs: Evidence from a constructed wetland. Sci. Rep. 9 (1), 13813. doi:10.1038/s41598-019-50161-9
Rafieenia, R., Atkinson, E., and Ledesma-Amaro, R. (2022). Division of labor for substrate utilization in natural and synthetic microbial communities. Curr. Opin. Biotechnol. 75 (2022), 102706. doi:10.1016/j.copbio.2022.102706
Rajan, Rajitha J., Sudarsan, J. S., and Nithiyanantham, S. (2018). Microbial population dynamics in constructed wetlands: Review of recent advancements for wastewater treatment. Environ. Eng. Res. 24 (2), 181–190. doi:10.4491/eer.2018.127
Ross, M. S., Ford, R. G., Zhang, K., and Morkill, A. (2009). Disturbance and the rising tide: The challenge of biodiversity management on low-island ecosystems. Front. Ecol. Environ. 7 (9), 471–478. doi:10.1890/070221
Rousseau, L., Diederik, P., and Pauw, N. D. (2004). Constructed wetlands in flanders: A performance analysis. Ecol. Eng. 23 (3), 151–163. doi:10.1016/j.ecoleng.2004.08.001
Shirdashtzadeh, Maryam, Chua, L. H. C., and Brau, L. (2022). Microbial communities and nitrogen transformation in constructed wetlands treating stormwater runoff. Front. Water 3, 751830. doi:10.3389/frwa.2021.751830
Stottmeister, U., Wießner, A., Kuschk, P., Kappelmeyer, U., Kästner, M., Bederski, O., et al. (2003). Effects of plants and microorganisms in constructed wetlands for wastewater treatment. Biotechnol. Adv. 22 (1-2), 93–117. doi:10.1016/j.biotechadv.2003.08.010
Su, Xiaomei, Steinman, A. D., Tang, X., Xue, Q., Zhao, Y., and Xie, L. (2017). Response of bacterial communities to cyanobacterial harmful algal blooms in lake taihu, China. Harmful Algae 68, 168–177. doi:10.1016/j.hal.2017.08.007
Tromas, N., Fortin, N., Bedrani, L., Terrat, Y., Cardoso, P., Bird, D., et al. (2017). Characterising and predicting cyanobacterial blooms in an 8-year amplicon sequencing time course. ISME J. 11 (8), 1746–1763. doi:10.1038/ismej.2017.58
Vymazal, J., Zhao, Y., and Mander, Ü. (2021). Recent research challenges in constructed wetlands for wastewater treatment: A review. Ecol. Eng. 169, 106318. doi:10.1016/j.ecoleng.2021.106318
Vymazal, Jan. (2011). Constructed wetlands for wastewater treatment: Five decades of experience. Environ. Sci. Technol. 45 (1), 61–69. https://pubs.acs.org/doi/10.1021/es101403q.
Vymazal, Jan. (2007). Removal of nutrients in various types of constructed wetlands. Sci. Total Environ. 380 (1-3), 48–65. doi:10.1016/j.scitotenv.2006.09.014
Wang, S., Jiang, J., Zhao, Q., and Wang, K. (2022). Effects of substrate type on variation of sludge organic compounds, bioelectric production and microbial community structure in bioelectrochemically-assisted sludge treatment wetland. J. Environ. Manag. 307 (2022), 114548. doi:10.1016/j.jenvman.2022.114548
West, M., Fenner, N., Gough, R., and Freeman, C. (2017). Evaluation of algal bloom mitigation and nutrient removal in floating constructed wetlands with different macrophyte species. Ecol. Eng. 108, 581–588. doi:10.1016/j.ecoleng.2017.07.033
Wu, H., Zhang, J., Ngo, H. H., Guo, W., Hu, Z., Liang, S., et al. (2015). A review on the sustainability of constructed wetlands for wastewater treatment: Design and operation. Bioresour. Technol. 175, 594–601. doi:10.1016/j.biortech.2014.10.068
Xia, Y., Zhang, M., Tsang, D. C. W., Geng, N., Lu, D., Zhu, L., et al. (2020). Recent advances in control technologies for non-point source pollution with nitrogen and phosphorous from agricultural runoff: Current practices and future prospects. Appl. Biol. Chem. 63 (1), 8. doi:10.1186/s13765-020-0493-6
Xu, C.-Y., Du, C., Jian, J. S., Hou, L., Wang, Z. K., Wang, Q., et al. (2021a). The interplay of labile organic carbon, enzyme activities and microbial communities of two forest soils across seasons. Sci. Rep. 11 (1), 5002. doi:10.1038/s41598-021-84217-6
Xu, K., Zou, X., Xue, Y., Qu, Y., and Li, Y. (2021). The impact of seasonal variations about temperature and photoperiod on the treatment of municipal wastewater by algae-bacteria system in lab-scale. Algal Res. 54, 102175. doi:10.1016/j.algal.2020.102175
Xu, Xing-Jian, Lai, G. L., Chi, C. Q., Zhao, J. Y., Yan, Y. C., Nie, Y., et al. (2018). Purification of eutrophic water containing chlorpyrifos by aquatic plants and its effects on planktonic bacteria. Chemosphere 193, 178–188. doi:10.1016/j.chemosphere.2017.10.171
Yamanaka, T. (1995). Changes in organic matter composition of forest Soil treated with a large amount of urea to promote ammonia fungi and the abilities of these fungi to decompose organic matter. Mycoscience 36 (1), 17–23. doi:10.1007/bf02268568
Yan, Q., Xu, Y., Yu, Y., Zhu, Z. W., and Feng, G. (2018). Effects of pharmaceuticals on microbial communities and activity of Soil enzymes in mesocosm-scale constructed wetlands. Chemosphere 212, 245–253. doi:10.1016/j.chemosphere.2018.08.059
Yang, Y., Chen, J., Chen, X., Jiang, Q., Liu, Y., and Xie, S. (2021). Cyanobacterial bloom induces structural and functional succession of microbial communities in eutrophic lake sediments. Environ. Pollut. 284, 117157. doi:10.1016/j.envpol.2021.117157
Zhang, Y., Chen, L., Sun, R., Dai, T., Tian, J., Zheng, W., et al. (2016). Temporal and spatial changes of microbial community in an industrial effluent receiving area in hangzhou bay. J. Environ. Sci. 44, 57–68. doi:10.1016/j.jes.2015.11.023
Zhang, Yang, Carvalho, P. N., Lv, T., Arias, C., Brix, H., and Chen, Z. (2015). Microbial density and diversity in constructed wetland systems and the relation to pollutant removal efficiency. Water Sci. Technol. 73 (3), 679–686. doi:10.2166/wst.2015.542
Zhao, D., Cao, X., Huang, R., Zeng, J., and Wu, Q. L. (2017). Variation of bacterial communities in water and sediments during the decomposition of Microcystis biomass. PLOS ONE 12 (4), e0176397. doi:10.1371/journal.pone.0176397
Zhong, F., Gao, Y., Yu, T., Zhang, Y., Xu, D., Xiao, E., et al. (2011). The management of undesirable cyanobacteria blooms in channel catfish ponds using a constructed wetland: Contribution to the control of off-flavor occurrences. Water Res. 45 (19), 6479–6488. doi:10.1016/j.watres.2011.09.044
Zhu, C., Zhang, J., Wang, X., Yang, Y., Chen, N., Lu, Z., et al. (2021a). Responses of cyanobacterial aggregate microbial communities to algal blooms. Water Res. 196, 117014. doi:10.1016/j.watres.2021.117014
Keywords: constructed wetlands, microbial community, 16S rRNA gene analysis, pulse disturbance, industrial wastewater
Citation: Hollstein M, Comerford M, Uhl M, Abel M, Egan SP and Stadler LB (2023) Impact of a natural disturbance on the performance and microbial communities in a full-scale constructed wetland for industrial wastewater treatment. Front. Environ. Sci. 11:1187143. doi: 10.3389/fenvs.2023.1187143
Received: 15 March 2023; Accepted: 21 April 2023;
Published: 10 May 2023.
Edited by:
Shihai Deng, Xi’an Jiaotong University, ChinaReviewed by:
Fei Xu, Shandong Normal University, ChinaLeilei Bai, Nanjing Institute of Geography and Limnology (CAS), China
Copyright © 2023 Hollstein, Comerford, Uhl, Abel, Egan and Stadler. This is an open-access article distributed under the terms of the Creative Commons Attribution License (CC BY). The use, distribution or reproduction in other forums is permitted, provided the original author(s) and the copyright owner(s) are credited and that the original publication in this journal is cited, in accordance with accepted academic practice. No use, distribution or reproduction is permitted which does not comply with these terms.
*Correspondence: Lauren B. Stadler, bGF1cmVuLnN0YWRsZXJAcmljZS5lZHU=