 Jie Zhang
 Jiade Yuan1,2*
95% of researchers rate our articles as excellent or good
Learn more about the work of our research integrity team to safeguard the quality of each article we publish.
Find out more
ORIGINAL RESEARCH article
Front. Environ. Sci. , 26 May 2023
Sec. Environmental Economics and Management
Volume 11 - 2023 | https://doi.org/10.3389/fenvs.2023.1174875
This article is part of the Research Topic Advances in Co-benefits of Climate Change Mitigation View all 12 articles
The coordination relationship between urban resilience and high-quality development is of paramount importance for improving disaster-alleviated resilient governance and sustainable development in response to the globalized crisis. However, few studies have investigated the coupling between urban resilience and high-quality development. Therefore, based on the analysis of the coupling and coordination mechanism between urban resilience and high-quality development, this paper innovatively calculates the indicators of urban resilience and high-quality development of 41 cities in the Yangtze River Delta Area (YRDA) from 2005 to 2020. Moreover, we explore the spatiotemporal patterns, evolution characteristics of the coupling coordination degree (CCD) between urban resilience and high-quality development using the entropy method, coupling coordination model, kernel density estimation curve, and further analyze the influence factors with the spatial econometric models. The results revealed that urban resilience maintained a steady growth, while high-quality development displayed a trend of an initial increase and a subsequent decline. The coupling coordination degree continued to rise and the regional difference decreased conspicuously, manifesting a robust developing trend. From the perspective of spatial patterns, the coupling coordination degree, which was characterized by “being high in the east and low in the west, tended to be balanced in the north and south and was prominent in the middle of the distribution.” Furthermore, economic strength, industrial structure, transportation facilities, and government intervention exerted a dominant influence on the development of coupling coordination degree, resulting in the spatial spillover effects as well. This study can reveal the interactive relationship between urban resilience and high-quality development can as well as help Yangtze River Delta Area provide a benchmark for promoting economic and social development while focusing on prevention and control of risk.
The city, as is known to all, is not only a reflection of the progress of mankind civilization, but also significantly symbolizes the mankind existence. People reside in cities for an improved living standard, and they inhabit cities for refined life conditions. In other words, people build cities with a view to accomplishing the ideal of a better place to live in. China’s urbanization, which is notable for a remarkable spurt of the economic growth and the urban population growth, has been accelerated tremendously since the Opening-up Policy carried out in 1978 (Fan et al., 2019). The recent years, however, witnesses that the deplorable consequences caused by the frenzied urbanization expansion has gradually mushroomed. The problems triggered by urbanization, such as overloading infrastructure (Fritz and Vollmer, 2006), severe energy waste (Li et al., 2023; Wang et al., 2023), water pollution (Zhang et al., 2021), greenhouse gas emission (Sun et al., 2023), soil contamination (Cui et al., 2022), and decline of public space (Dong et al., 2022), all of which have become increasingly prominent, results in frequently-occurring natural calamities and catastrophes oriented by mankind, both of which severely affect the personal safety and the quality of urban residents’ living standards. According to relevant statistics, China is one of the countries which are the most severely-stricken by disasters (Liu et al., 2021). Over 112 million people in China were influenced tremendously by natural disasters and public safety emergencies, with 12,071.6 thousand hectares of crops being harshly affected and a devastating economic loss of 238.65 billion RMB last year (Xinhua News, 2023). “Being enormously vulnerable” has become a prominent problem which is not only against China’s urban development, but also impedes the progress of the livelihood of urban residents. It is in this context that the Chinese government, for the first time at the Fifth Plenary Session of the 19th Central Committee, incorporates a systemic approach and the integration of development and safety into the national vital guiding principles which can be a guiding beacon for the national economic and social development during the stint of the 14th Five-Year Plan, evincing the relationship between the urban economic fantastic spurt and safety in the new era. Urban resilience and high-quality development, both of which are the paramount indicators for evaluating the urban safety governance capabilities and the comprehensive development levels, can provide effective support of decision-making information for the unceasing upgrading of urban residents’ quality of life. It is, therefore, exceedingly urgent to develop the methods of keeping speedy growth both sustainably and accessibly, which could maintain the exuberant vitality, strength and glamour of the city through the coordinated development between urban resilience and high-quality development.
The term “resilience” was initially applied to the study of ecosystems by Holling (1973), who is renowned for putting forward the theory of “hierarchical structure and adaptive cycle” has further enriched the implication of sustainable development. Resilience theory is gradually being applied to the urban studies as the research proceeds. The original conception of urban resilience (Godschalk, 2003; Campanella, 2006), promotion pathway (Desouza and Flanery, 2013) and practical significance (Bahadur and Thornton, 2015) have been under discussion by a multitude of prestigious scholars. By combining and coordinating countless viewpoints, Meerow et al. (2016) originally put forward a revised concept, namely, urban resilience which is widely acclaimed, the concept being defined that “Urban resilience refers to the ability of an urban system, and that all its constituent socio-ecological and socio-technical networks across the temporal and spatial scales, and that it maintains or rapidly returns to the desired functions in the face of a tremendous disturbance so as to adapt to the remarkable changes and to quickly transform the systems which confine the current or future adaptive capacity.” This definition renders us aware of the fact that urban resilience, which is dynamic and is filled with vitality and tension, is deeply embedded in humanistic care. It coincides with fundamental humanistic values and dynamic balancing of the spatio-temporal diversity pursued by high-quality development. The high-quality development proposed by the 19th National Congress of the Communist Party of China is a subject both ground-breaking and controversial, which gets many aspects involved, such as economic health, efficient and intensive resource utilization, and optimization of the environmental space. The theory emphasizes that people’s sensation of gaining, satisfaction, and mirth can be enhanced with the rational allocation of the social wealth, via capturing the correlation between the supply and demand and via ameliorating the habitable environment (Wang and Feng, 2020; Gao, 2021). It accomplishes a shift from a focus on form to substance, liberating itself from blind trust and dogmatic dependence on irrational urbanization-orientation. More importantly, it is based on a self-conscious awareness of the contradiction of urban development, constantly adjusting the pace of urban development and constantly shaping the dynamic equilibrium. There is no doubt that this idea of dynamic properties of the systems is also indispensable for the construction of resilient cities. All in all, as an important proposition for promoting sustainable development and enhancing urban livability, urban resilience and high-quality development in the future will be the mainstream direction of urban planning.
Recent years witnesses that innumerable scholars have adopted numerous methods such as composite index method (Xun and Yuan, 2020; Jiang et al., 2021; Du et al., 2022; Li and Wang, 2023), gray correlation analysis (Yang et al., 2021) and fuzzy comprehensive evaluation (Sun et al., 2020) to assess the level of urban resilience and high-quality development, based on all of which, the measured levels are used as the target variables, and the panel regression models are constructed to analyse the strength of the influence of various factors upon them. These methods, which objectively broaden the multidimensional perspective of high-quality development and urban resilience analysis, cannot provide an accurate reflection of the interplay between the two systems. Indeed, urban resilience and high-quality development, being two similar but discrepant systems on the whole, not only have static similarities, but also have dynamic interactions. From a local perspective, the harmony and coherence between the various subsystems and elements within both systems is conducive to the quantitative and spatial optimization of urban resource allocation among diverse functions, thereby effectively addressing the diverse developing needs of urban subjects. Consequently, in the context of a comparatively slower domestic urbanization and the gradual emergence of hazardous disasters, examining the interplay between urban resilience and high-quality development can better assist us in accomplishing the goal of a more mirthful and a more harmonious life while stably striving for progress. Moreover, for the sake of China’s large territory and imbalanced regional development (Zhang et al., 2022), there will also be some regional characteristics in the interaction between two systems. Thus, there is a need to compare the coupling and the coordination characteristics of regional urban resilience and high-quality development from the multiple spatial and temporal scales. We choose YRDA as a case. On the one hand, the YRDA contributes almost one-quarter of China’s total economic output with less than 4% of the country’s land area, which is highly representative of the high-quality development process in China. On the other hand, as an area with the highest land-use intensity and the highest average rate of urbanization in China, the YRDA has made great sacrifices for China’s development. It has become a high risk area for natural disasters in China and has been listed as the key object for public safety management as well as the prevention and control of ecological risks by the Chinese government. All in all, evaluating the overall synergistic effect between urban resilience and high-quality development in the YRDA and clarifying the driving factors which exert tremendous influence upon their coordinated development are urgent issues to be addressed now.
The rest of this paper is organized as follows, in the second section of which, the mechanism analysis, research methods and data sources are introduced and a comprehensive evaluation index system based on the connotation of urban resilience and high-quality development is constructed, and in the third section of which, we give a brief description of the empirical results, and in the fourth section of which, we discuss the empirical results in the context of the new era, finally summarizes the chief conclusions and discloses the demerits of the research.
Urban resilience and high-quality development are closely coupled and interactively coordinated (Figure 1). Here is the specific analysis:
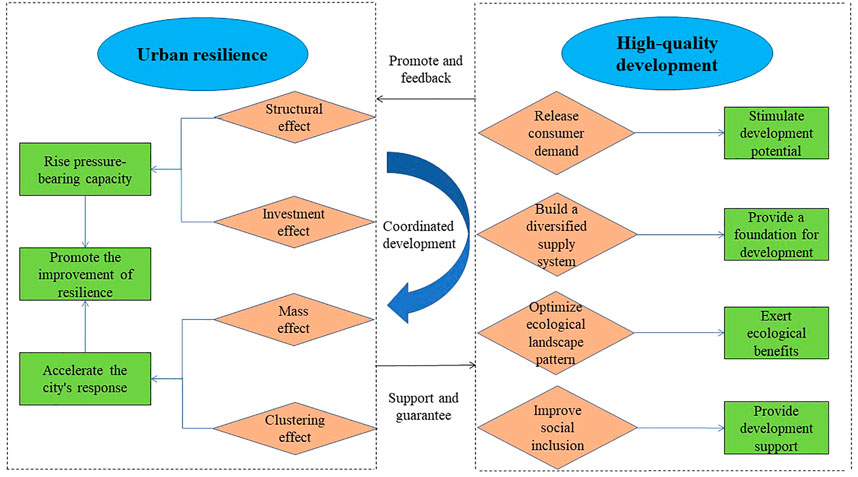
FIGURE 1. Mechanism analysis diagram.
Urban resilience, on the one hand, spans a number of dimensions horizontally, which include economic empowerment, social development, ecological governance, and infrastructure integration, and on the other hand, urban resilience vertically becomes the major axis linking regional integration and urban agglomeration development (Shamsuddin, 2020). It is an important guaranteeing factor for promoting high-quality development. First and foremost, improving economic resilience motivates high-quality development from the demand and supply levels. On the demand side, given that the macro economy is risky and uncertain (Wen et al., 2022), it is likely to increase the consumption concerns of the public. The improvement of economic resilience will help to eliminate the concerns of urban dwellers who dare to consume, and to further release consumers’ demand to stimulate the high-quality development potential. When it comes to the aspect of supply, economic resilience advocates establishing a diversified supply chain to deal with the risks and capricious uncertainties of the economic development process, in the view of which, expanding the construction of a modern industrial system with the coordinated development of realistic economy, technological innovation, modern finance, and human resources can provide a solid foundation for high-quality development. Secondly, ecological resilience ensures the species diversity in the ecosystem and urban green space ratio by optimizing city’s ecological landscape configuration, strengthens the self-purifying capacity of urban ecological environment, and then exerts ecological benefits in consolidating the green foundation for high-quality development. Finally, the increase in the level of social and engineering resilience is often accompanied by an increase in the level of the inclusion of transport, healthcare and communications. It facilitates the renewal and iteration of engineering and urban management systems, which in turn enhances the management of urban material stocks and enhances social welfare, so as to provide strong external support for the high-quality development.
High-quality development can enhance the city’s overall capacity for fine-grained governance and create a more resilient and secure city. On the one hand, in order to bring off the goal of high-quality development, the government will set as the first priority meeting the relevant needs of industries with high productivity, low pollution, low energy consumption, and innovative industries, which constantly eliminates the backward industries with low unit output efficiency, so as to make room for the development of advantageous projects and high-quality enterprises. In the view of the condition above, the investment by high-quality firms and the upgrading of industrial structures will actively promote the improvement of infrastructure and increase public service supply, thus improving the city’s pressure-bearing capacity and effectively promoting the improvement of resilience. On the other hand, under the requirement of high-quality development, the local governments will allocate more output revenue to the R&D and to the promotion of livelihood projects such as healthcare, social security and risk management, and guide the entire society to concentrate on good urban governance and planning through mass effect. Meanwhile, implementing policies such as “Low-carbon City Pilot,” “Smart City Pilot” and “Innovation City Pilot,” require strengthening the building of innovative talent and high-tech research (Gao and Yuan, 2022), which further promotes the concentration of talents and advanced technology, and ultimately accelerates the city’s response to the crisis along with generating a positive feedback on the construction of urban resilience.
The YRDA, which is nested in the alluvial plain in the lower reaches of the Yangtze River basin and borders upon the Yellow Sea and the East Sea with numerous ports, is a major intersection of the Belt and the Road Initiative as well as the Yangtze River Economic Belt. According to the “Outline of the Yangtze River Delta Regional Integrated Development Plan” officially issued by the State Council in December 2019, its scope was defined as the entire region of Jiangsu, Zhejiang, Anhui, and Shanghai (Figure 2), and it was clearly pointed out as a model area for high-quality development in China. Natural disasters such as inexpressibly devastating floods and formidably surging storms, however, frequently harasses the YRDA because of the influence of the natural geographic conditions and the properties of the underlying surfaces. Human activities and changes in land utilization will also further increase the risk of potential urban hazarous danger in the area, and therefore, it will be a remarkably significant strategic task for the YRDA to place the building of urban resilience on the agenda as an important part of new urban construction and the key urban regeneration project in order to strengthen the coordination of security and development, so that we can finally accomplish high-quality development from diverse perspectives, including natural environment, population society, and economic policy, etc.
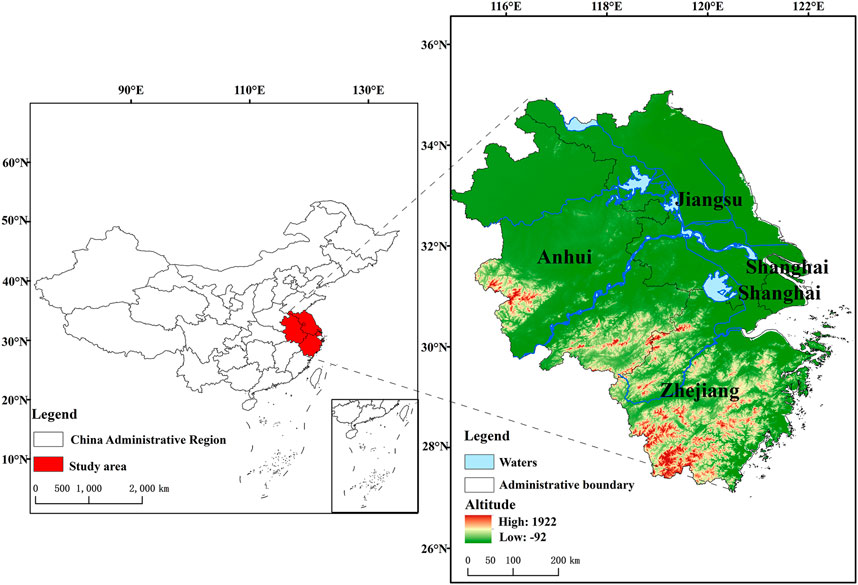
FIGURE 2. The study area.
The relevant data, which were derived from the China Statistical Yearbook, the China Urban Statistical Yearbook, the provincial and municipal statistical yearbooks and their statistical bulletins, were adopted to estimate the composite value of urban resilience and high-quality development in the YRDA in the stint of 2005–2020, with the basis of the updated, continuous, reliable and accessible nature of the data.
With a view to making the data comparable, this study adopted the extreme value method of standardizing each index, so that the value for each indicator is in the range from 0 to 1, based on which, the entropy value method was used to compute the weight of urban resilience and high-quality development indicators, so as to make one strife reasonable and scientific in the weighting results (Li et al., 2022). The formulae are as follows:
Standardization of positive indicators:
Standardization of negative indicators:
where
Calculation of the ratio:
Calculation of the entropy:
Calculation of the redundancy of the entropy value of each index:
Calculation of the weight:
Calculation of the comprehensive score:
The coupling coordination model can not only be wielded to display the coherence of coordinated evolution between urban resilience and high-quality development, but also can reflect the overall efficiency and synergism of the interactive development of both systems. Correspondingly, this study built a model of coupling coordination to evaluate the relative level of development of the two systems and their coordination status. The equations are as follows (Yang et al., 2020):
where
In order to visually describe the coupling coordination between the two systems, the CCD was divided into the following grades according to the research results of Liu et al. (2018) (Table 1).
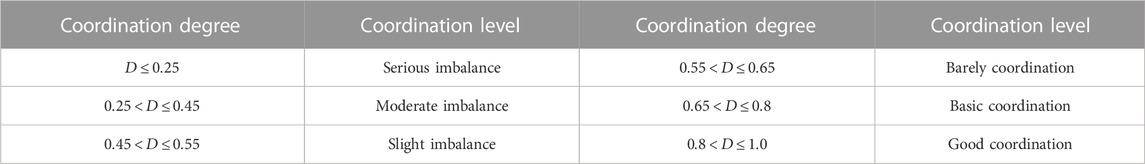
TABLE 1. Classification standard of the CCD.
The non-parametric kernel density estimation is a method adopted to estimate probability density functions with continuous density curves in order to depict the distributional pattern of random variables, resulting in an improved continuity of the estimation results compared to histograms. Therefore, we adopted the kernel density estimation curve to display the distribution structure, locating and extending the CCD between urban resilience and high-quality development, so as to reveal its temporal evolution features. The formula is as follows (Deng et al., 2022):
in which
The purpose of this study is to use the trend surface method to analyze the overall diverging trends in CCD between urban resilience and high-quality development in the YRDA, which can map a mathematical surface across spatial data to illustrate spatial trends and patterns in the distribution of observed geographic factor values over a wide spatial range (Wang and Zuo, 2015). Suppose that
where
The spatial autocorrelation effect refers to the mutual influence of variables from different cities (Ren et al., 2023). This study used
where
The spatially dependent and heterogeneous characteristics of CCD can be further identified by
where
Some of the cities in the YRDA, which boast resources and conditions of development which are quite similar to one another, tend to form “Convergence club” as a result. Moreover, affected by the shared culture of the area, the development patterns and pathways of adjacent areas have something in common, namely, policy-borrowing occuring from time to time. The co-evolution of urban resilience and high-quality development is thus likely to have spatial correlations, and on the basis of which, this paper considered the use of SDM incorporating spatial effects to relate geographical location to statistical parameters, in order to more efficiently estimate the spatial effects of each region on the surrounding areas, and simultaneously, this makes the estimation result more similar to the true situation (Baltagi and Li, 2006). The formula is as follows:
where
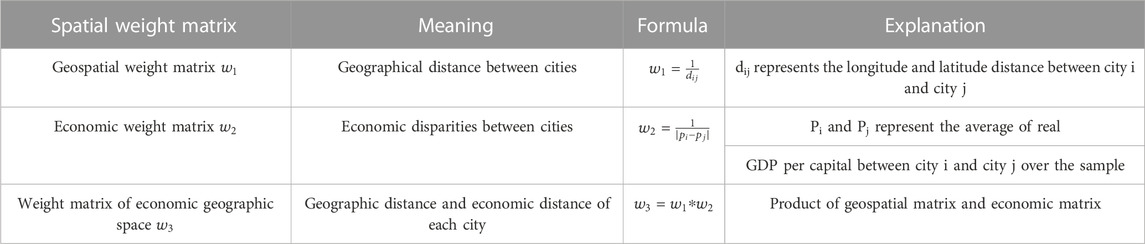
TABLE 2. Weight matrix description.
Urban resilience and high-quality development are multi-faceted, and therefore a single indicator cannot elaborately describe the relevant features of urban systems. A comprehensive assessment index system can reflect multidimensional features of them, making measurement outcomes more scientific. This paper thus constructed a comprehensive assessment index system from multiple levels to evaluate the level of resilience and high-quality development of the urban system.
The index system is based on the existing research findings and is built from four dimensions, namely, the dimensions of being economic, social, ecological, and engineering of urban resilience (Chen et al., 2021; Shi et al., 2021). Firstly, economic resilience refers primarily to the stability, adjustment, and recovery capacity of the regional economic system following external shocks (Martin and Sunley, 2015), which can be reflected from the economic strength, economic diversity, and investment intensity, namely, the three aspects of the respective indicators. Secondly, social resilience is the ability to rely on the power of the social structure to accomplish the effective integration of diverse resources in the society when it encounters destructive shocks, so as to re-establish a balanced state (Reuter and Spielhofer, 2017). It can be generally expressed in terms of three indicators: adaptability of the population, residents’ income and social security. Thirdly, ecological resilience manifests itself primarily in the fact that urban ecosystems can still maintain their primary functions in the face of environmental pressures such as human activities and industrial pollution emission (Chen et al., 2020). They are an indispensable and remarkably important component of the urban system, which can be reflected in the pressure of the ecological environment, ecological environment service capacity and restoration capacity. Finally, engineering resilience is an important criterion by which we can judge whether the construction of urban infrastructure can effectively withstand various sudden risks and abrupt crises (Ranasinghe et al., 2020). The degree of perfection in the construction of transportation and communications can reflect the city’s emergency coverage and external assistance capabilities in the crisis situations, both of which are important parameters of the resilience of engineers. At the same time, coupled with the frequent occurrence of flooding in the YRDA (Sun et al., 2020), we added indicators of urban drainage projects into the assessment system.
The assessment of a city’s level of high-quality development should not be assessed solely in terms of GDP growth rates. High-quality development is, in effect, a development that resolves the major contradictions in the current society and meets people’s pursuit of quality. It takes innovation as its primary driving force, being environmentally-friendly as a universal form, sharing as a fundamental goal, and focuses on the development of opening up and intercommunication as well as social harmony (Liu et al., 2020). Therefore, this paper combined the connotation of high-quality development and referred to relevant literature (Sun et al., 2022) to construct a high-quality development evaluation index system from the five dimensions of “innovation driven—coordinated progress—environmentally-friendly development—opening up—sharing harmony,” which is a complete reflection of the people’s high quality needs for economic and social development.
Innovation driven refers to improving the output rate of production factors through technological change, relying on the creation of knowledge and scientific research and development to promote overall effectiveness, which is a vital driving force and engine for accomplishing high-quality development. Among the indicators selected, the sharing of science and technology expenditure in local fiscal expenditure is an important indicator for measuring innovation investment. The higher the proportion is, the greater the depth of local government’s emphasis on innovation is and the greater the support is. By wielding a proportion of invention patents granted to the number of patent grants as a proxy for measuring regional innovation output, the overall development of regional innovation can be revealed. A key link in bringing science and technology together with economics is the transformation of scientific and technological achievements, which is typically characterized by the total industrial output value above scale in GDP.
Regional co-ordination is conducive to the narrowing of the policy unit, which thereby promotes the integration of science and technology with economic and social reforms and enhances policy relevance along with laying a solid foundation for high-quality development (Li and Yi, 2020). Coordinated progress, which involves the coordination between man and land, the supply and demand, as well as the gap between the rich and the poor, is an important reflection of the multidimensional and ordered development. Depending on the indicators chosen, per capital revenues may reflect government’s regulation of the gap between rich and poor to some degree. The rate of urbanization can better reflect the coordinated development of population and building land, which is computed by the ratio of the permanent population to the total population. Streamlining the structure of consumption can fully boost the vitality of urban domestic demand, which is an important symbol of the coordination of supply and demand, characterized by the proportion of total retail sales of social consumer goods in GDP.
The environmentally-friendly development is an important precondition for high-quality development. Any development must comply with the law of nature, which is an integral premise, particularly by tracking ecological thresholds or ecological boundaries that objectively exists in nature (Martin et al., 2016). Since reducing pollution emission is one of the requirements for environmentally-friendly development, the choice of amount of the gas, SO2 which is produced per unit of GDP, is regarded as an indicator for assessing the low-carbon cycle, and can reflect the environmental cost derived from local development. The electricity consumption per unit of GDP, which reflects the efficiency of resource utilization and the high consumption together with the product inefficiency of production, is an integral indicator for guiding the creation of a resource-conserving society. Moreover, in the practice of adhering to and refining the ecologically-civilized system, the capacity of ecological and environmental governance, which is expressed through the general industrial solid waste comprehensive utilization rate, needs to be continually improved.
The opening-up policy, a core national policy which China clings to in the phase of high-quality development, can contribute to the in-depth integration of national and global development. Among all the selected parameters, the ratio of tourism foreign exchange income to GDP, which reflects the extent of competitiveness of international trade in tourism service, can serve as an indispensable indicator of the degree of opening up to the outside world. The extent of foreign investment dependence reflects the degree of involvement in international trade and its impact on the regional economic growth, whereas the realistic amount of foreign investment per capital reflects the attractiveness of foreign regional capital.
High-quality development aims to elevate the level of social wellbeing, so as to entitle people to share the fruits of development and to improve their living standard. Consequently, we select the parameters from the perspective of three aspects, namely, fluctuation in employment, public transportation, and cultural sharing for evaluating the smooth effect of shared harmony. Table 3 displays all metrics and their measuring standards.
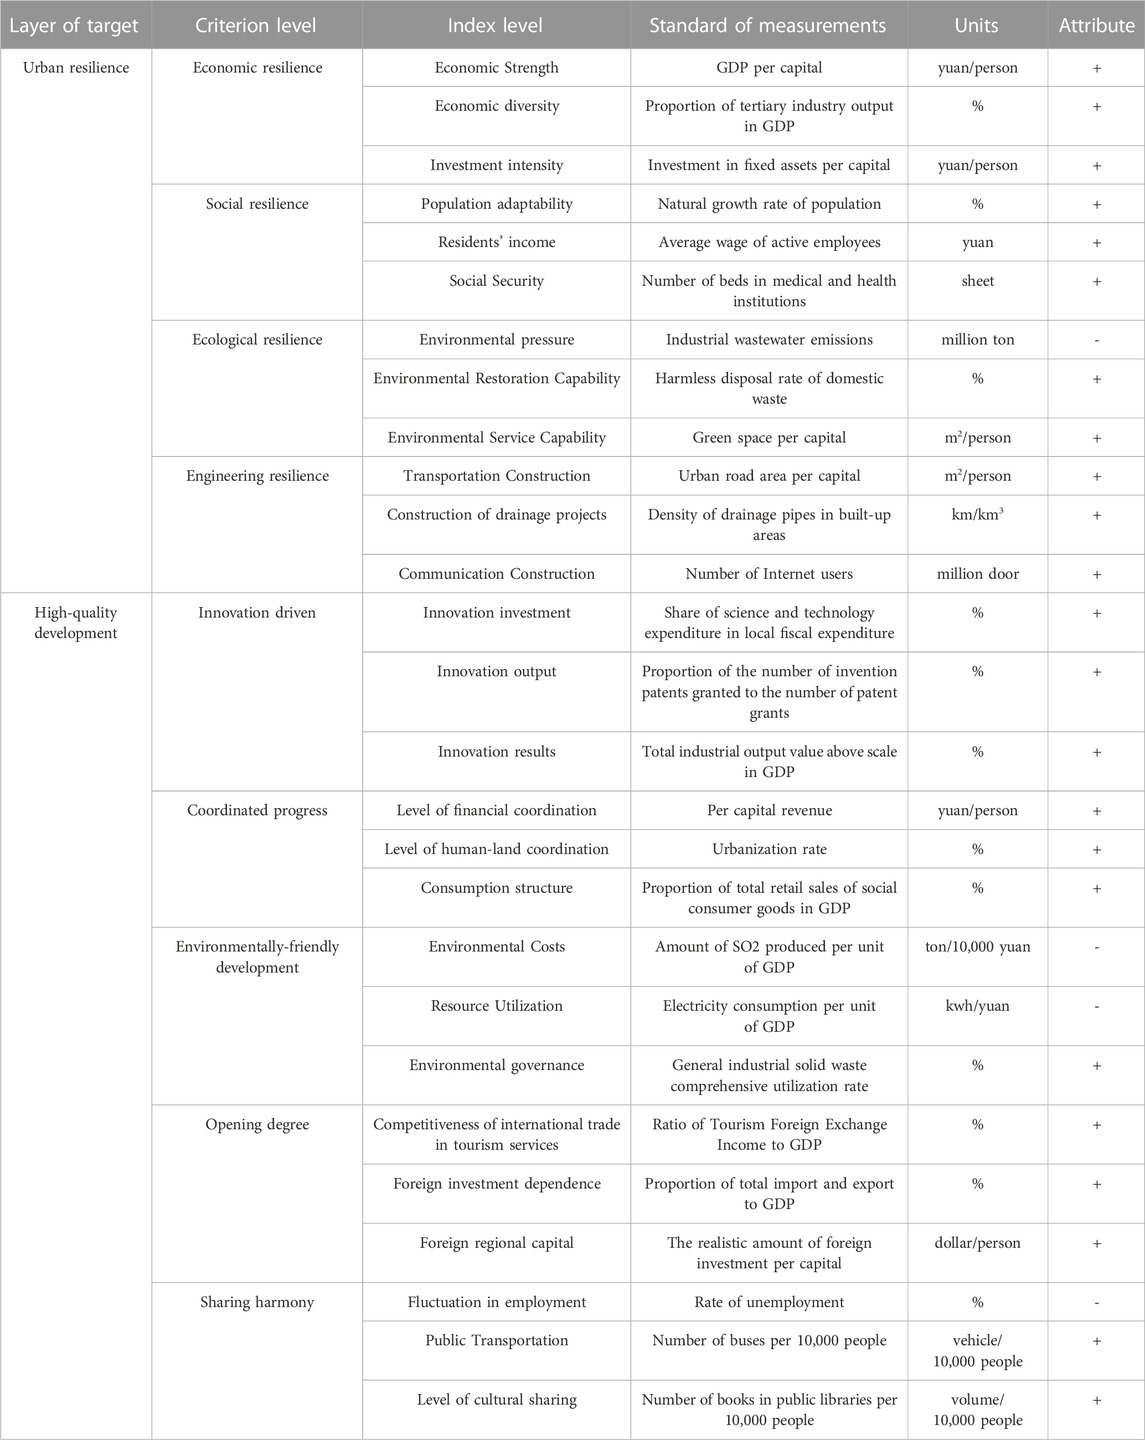
TABLE 3. Evaluation index system of urban resilience and high-quality development.
Based on the evaluation index system, the comprehensive values of urban resilience and high-quality development during the stint of 2005–2020 are calculated by the entropy method (Table 4). At the same time, the mean values of urban resilience and high-quality development during the stint of 2005–2020 are also divided into low, middle and high levels by adopting the natural break point method in Arcgis to explore their spatial pattern of distribution, which is manifested in Figure 3.
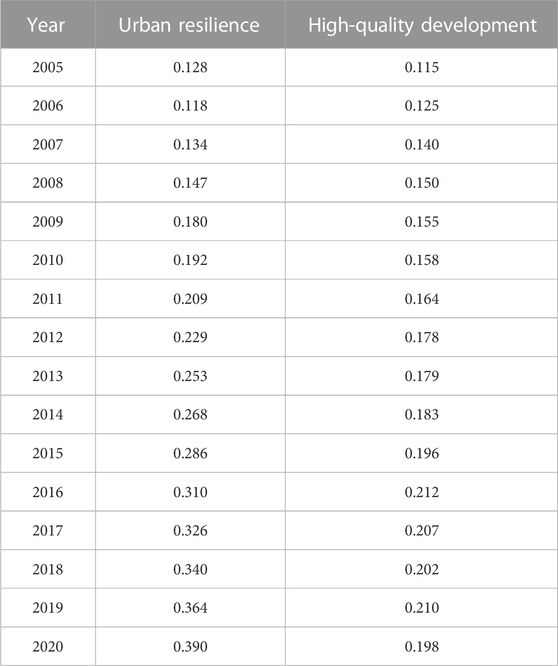
TABLE 4. Comprehensive values of urban resilience and high-quality development.
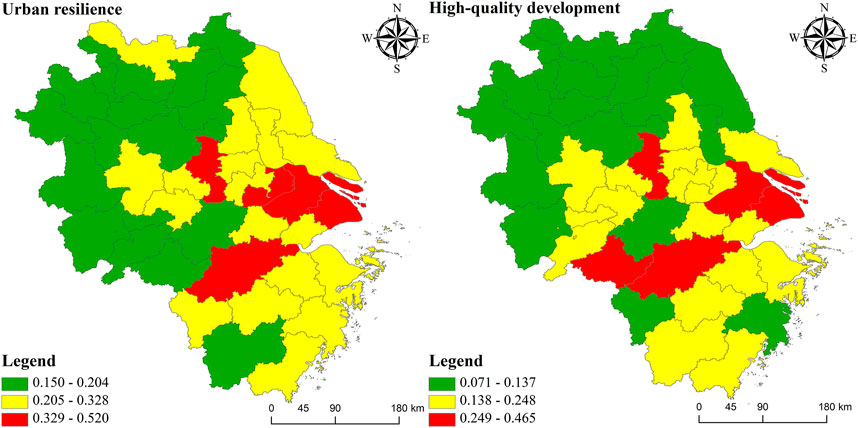
FIGURE 3. Spatial distribution of urban resilience and high-quality development.
As is disclosed in Table 4, the composite resilience value of the YDAR increased over the studied period from the nadir of 0.128 in 2005 to the acme of 0.390 in 2020, which displayed a comparatively good pattern of development. In combination with Figure 3, there are five cities with a high degree of resilience in the YRDA, namely, Shanghai, Suzhou, Nanjing, Wuxi, and Hangzhou, with the mean values being 0.520, 0.413, 0.360, 0.383, and 0.377, respectively. On the contrary, cities with a low resilience level mainly display a continuous development trend in the west of the YRDA, such as Bozhou, Fuyang, Anqing, and Chizhou, all of which are nested in Anhui Province. Furthermore, the YRDA has the largest number of medium-level cities, which account for nearly 50% of the entire number and are mainly nested in the central region as well as the eastern coastal region, namely, the province of Jiangsu and Zhejiang. In a brief, the level of resilience of the cities in the YRDA exhibits a spatial pattern of “being highest in the east, comparatively lower in the middle, and the lowest in the west.”
The stint of 2005–2020 witnessed that the level of high-quality development in the YRDA presented a changing characteristics of a reversely-written “U” type, and in other words, it continued to rise from 0.115 to 0.212 during the period of 2005–2016, reaching its summit. After 2017, it displayed a rebound trend, slowly falling back to 0.198, which is mainly attributed to the fact that the intensification and the escalation of the Sino-US trade contradiction in August 2017 has exerted an enormous impact on the development of international trade and technological innovation between the two countries. In addition, the dissemination of the COVID-19 epidemic in 2020 has also inhibited the process of high-quality development.
As is conspicuously debunked in Figure 3, there are exceedingly significant regional differences in the level of high-quality development in the YRDA, which gradually form the spatial features of “being high in the south, and low in the north, with being prominent in the middle of the range.” Specifically speaking, the high-level cities are primarily the provincial capitals and their surrounding cities, three cases of which are Shanghai, Nanjing, and Hangzhou. The elaborate analysis above indicates that the provincial capitals with their prominently advantageous positions as the corresponding centers which are paramount politically, economically, culturally, scientifically, and educationally, can provide an inexpressible impetus for high-quality development and are capable of, to some degree, propelling the development of surrounding cities. The medium-level cities are mainly located in the southern and central parts of the YRDA, and are clustered around the high-level metropolises, displaying a clear proximity. By contrast, the northern region has a conspicuous gap with the southern and central regions in terms of resource abundance, locating conditions and national policy support, resulting in the fact that the high-quality development level of the northern region will be comparatively low and the low-level cities mostly gathered here.
Figure 4 vividly expatiates the characteristics of the temporal dynamic evolution of the CCD between urban resilience and high-quality development in the YRDA. It can be conspicuously disclosed that the kernel density function of the CCD is a single-peak distribution shape and the height of the peak decreases significantly in the time periods excluding the stint of 2010–2015 during which there is a slight increase. Furthermore, the stint of 2005–2020 witnesses that the centre of gravity of the core density curve continues to shift to the right, and the right tail is larger than the left tail, which displays a tendency to become longer and thicker year by year, which reflects that the CCD between urban resilience and high-quality development in the YRDA has a single polarization phenomenon, with the CCD exhibiting an overall rising evolution feature and a gradually-balanced trend.
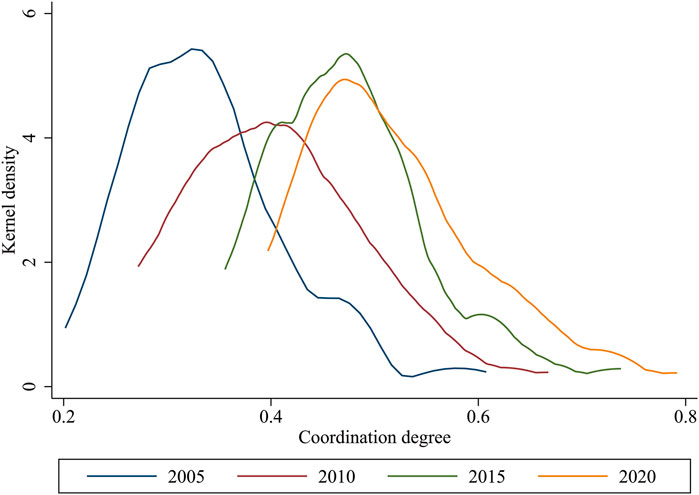
FIGURE 4. Kernel density curve of CCD.
The spatial distribution map of the CCD between urban resilience and high-quality development, which is based on the relevant data pertaining to four stints, is drawn with adopting the Arcgis.
Figure 5 vividly illustrates that the CCD between urban resilience and high-quality development in 41 cities nested in the YRDA is on the rise. Coordination types are mostly moderate imbalanc, slight imbalanc and barely coordination, whereas a good coordination does not appear. Specifically speaking, the year of 2005 witnesses that there were mainly numerous moderately-imbalanced cities and a scattered distribution of seriously-imbalanced and slightly-imbalanced cities, with the exception that exclusively one city, Shanghai, was barely coordinated. By 2010, cities with serious imbalance perished, and the proportion of cities with a slight imbalance increased to 22%, with the development of clusters in the central-eastern part of the YRDA and the emergence of basic coordination city. In 2015, the number of moderately-imbalanced cities continued to decline to exclusively 18, while the number of the slightly-imbalanced cities spurt to 17, both of whose numbers gradually converge with an increase in the number of basic coordination cities. The year of 2020 was regaled with the phenomenon that there was an obvious increase in the number of slightly-imbalanced cities, which covered most of the eastern and southern parts of the YRDA, whereas the range of moderately-imbalanced cities regressed to the northwestern part of the YRDA. In addition, the number of the barely-coordinated and basically-coordinated cities also continued to grow, forming a “Z"-shaped pattern from Hefei to Zhoushan. Among these cities, Shanghai, Nanjing, Suzhou, and Hangzhou had the highest degree of coupling coordination. All in all, the low-level coordinated cities are predominantly distributed in the northwest, while the high-level coordinated cities are prominently concentrated on the central part of the YRDA.
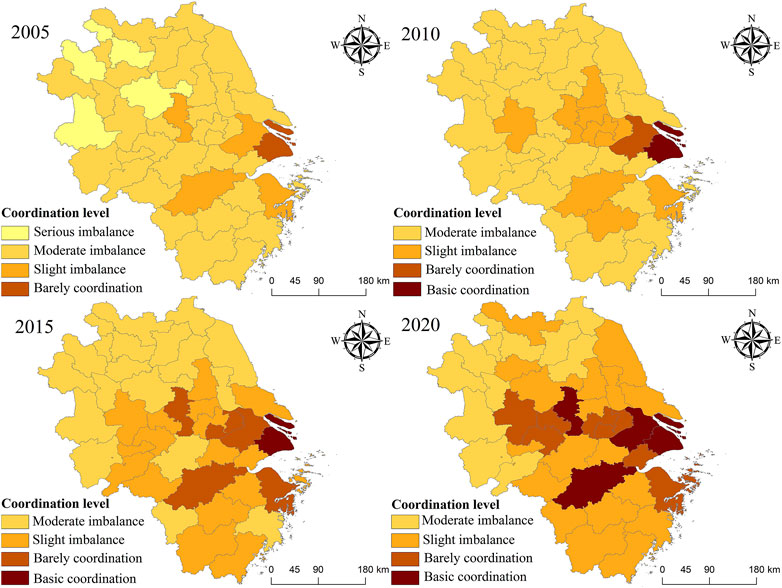
FIGURE 5. Spatial distribution of CCD between urban and high-quality development.
The trend surface analysis is adopted to further verify the spatial distribution pattern and changing trend of the CCD. As is symbolically illustrated in Figure 6, the trend lines in the east-west direction of the YRDA are entirely diagonal during the studied period, which indicates that the CCD between urban resilience and high-quality development has been divergent both historically and spatially in the YRDA, with “being high to the east and low to the west.” Moreover, in the north-to-south direction, the 2020 trend surface, in comparison with that of 2005, becomes steeper, and the spatial trend between the central and southern areas, which is close to a straight line, continues to sink with the passing of time as the overall trend gradually changes from an “L” to an inverted “U” shape. This means that with the fantastic spurt of economic development of the central areas, the discrepancies between the north and the south are narrowing, and in general, the CCD is evolving from “being high in the centre and south, but steeply plummeting in the north” to “being balanced in the north and south, but being prominent in the centre.”
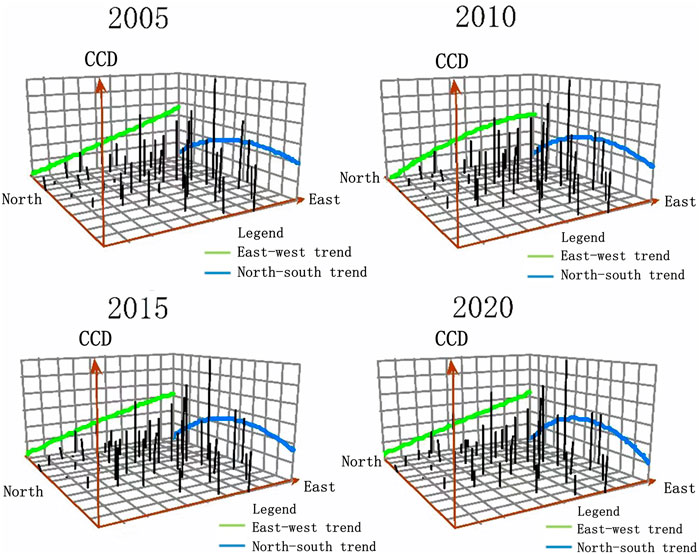
FIGURE 6. The variation trend of CCD.
In order to explore the characteristics of spatial correlation of the CCD between urban resilience and high-quality development in the YRDA, the global Moran’s I of the CCD among municipal units in the YRDA is calculated with adopting the Stata software (Table 5). Moran’s I of the CCD in the YRDA from 2005 to 2019 is invariably greater than zero, and both the p-value and the Z-value pass the test for significance. In summary, the results display that there is a significant positive spatial correlation among the municipal units of the YRDA.
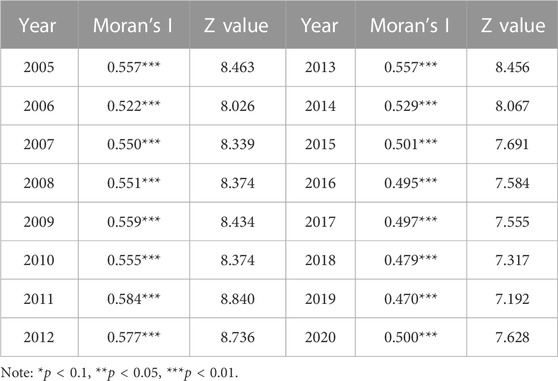
TABLE 5. The global Moran’s I of CCD in the YRDA from 2005 to 2020.
The global Moran’s I has verified the enhancement of the spatial distribution agglomeration of the CCD in the YRDA. Then, the local auto-correlation model is introduced again for testing, and the Moran scattered plots of 2005, 2010, 2015 and 2020 respectively are drawn to reflect the spatial correlation between a certain area and its surrounding areas. It can be conspicuously revealed from Figure 7 that most of the observation in all the 4 years fall within the first and the third quadrants, indicating that the spatial distribution of the CCD between urban resilience and high-quality development in the YRDA displays a positive correlation between the high values and between the low values. In a brief, the local spatial auto-correlation is mainly manifested in H-H and L-L regions, and spatial homogeneity is more prominent than heterogeneity.
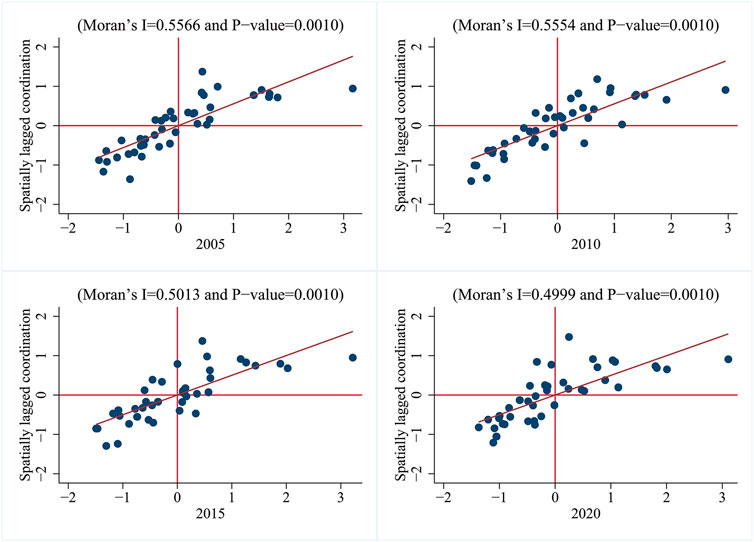
FIGURE 7. Moran Scattered plot of CCD between urban resilience and high-quality development in YRDA in 2005, 2010, 2015, and 2020 respectively.
The results of the analysis above render us aware of the fact that the CCD between urban resilience and high-quality development in the YRDA is, to some degree, spatially correlated with each other. Thus, spatial factors must be taken into account when the impact of various factors upon it is under consideration. With the basis of previous studies (Martin and Sunley, 2015; Shi et al., 2021; Ma et al., 2022), we combine the spatial econometric model to analyse the driving factors exerting an influence on the CCD between urban resilience and high-quality development in the YRDA from the diverse perspectives of regional economic strength, industrial structure, transportation facilities, environment regulation, government intervention, science and technology, the factors relevant to labour force, and people’s living standards. The relevant variables were selected as below: GDP per capital (X1) represents the regional economic strength; industrial structure is expressed in terms of the proportion of the value added by secondary and tertiary industries relative to GDP (X2); the size of the cargo volume (X3) reflects the perfection of the transportation facilities; replacing the environment regulation by the proportion of “environmental protection” words in the regional annual government work report (X4); the ratio of the local budget expenditure to GDP (X5) represents the strength of government intervention; the chosen proportion of expenditure in science and technology in fiscal spending (X6) represents the level of science and technology development; the sum of employment in the secondary and tertiary industries (X7) is the labour factor; urban per capital income (X8), expenditure (X9) and Engels Coefficient (X10) are adopted to reflect people’s living standards.
To prevent pseudo-regression from taking place, this paper refers to the study of Miao et al. (2022) and tests for multicollinearity by variance inflation factors (VIFs), and the results show that the VIFs are below 10. There is no serious multicollinearity problem in the regression. Furthermore, the stationarity test is performed for all variables, of which X9 and X10 fail the ADF test and are therefore eliminated. To simultaneously remove the influence of heteroskedasticity, we also take the logarithm of all variables.
We carry out the test ideas of Yang and Liu (2022) to identify the spatial econometric model. Firstly, the statistical values of LM and Robust LM are adopted to determine whether the spatial error model (SEM) or the spatial lag model (SLM) is wielded depends on whether they are significant or not. From the test results of Table 6, the statistics of LM-spatial lag, LM-spatial error, Robust LM-spatial error and Robust LM-spatial lag all pass the significance level test of at least 5%, manifesting that the model of the influence of each factor on the CCD is both in the form of spatial error and spatial lag. Secondly, we further test whether the SDM can be degraded into SEM or SLM, and the statistics of Wald-spatial lag, Wald-spatial error, LR-spatial lag, and LR-spatial error all pass the significance level of 0.01, which rejects the original hypothesis that the SDM cannot be degraded to a spatially measured model in its simplified form, with SDM being the most suitable model. Thirdly, the Hausman test is again adopted to determine whether fixed effects or random effects are chosen. The test result displays that the Hausman index is 41.60, which passes the 0.01 level of significance test, manifesting that the selection of fixed effects is more appropriate. Finally, the SDM fixed effects come in different forms, such as time fixed effects, spatial fixed effects, and dual space-time fixed effects. The LR test results for the joint significance of time and spatial fixed effects indicate that the dual space-time fixed effects are better than any others, for which, the dual space-time fixed effects SDM is selected to evaluate the impact of each factor on the CCD between urban resilience and high-quality development.
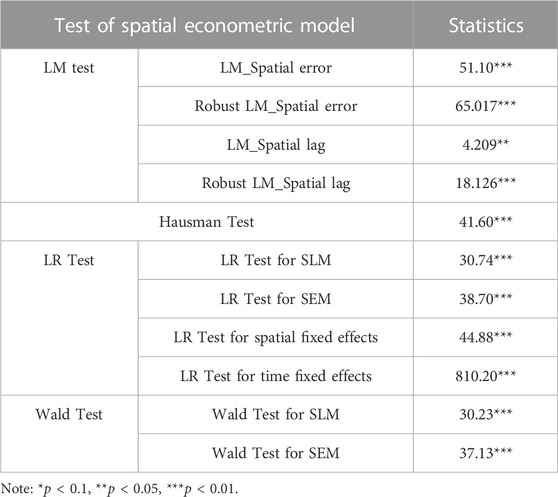
TABLE 6. Spatial econometric model test results.
Table 7 provides the SDM estimation results. The regression coefficients of economic strength (X1) and industrial structure (X2) are significantly positive, but their spatial lag coefficients are not significant, indicating that both of these factors can effectively synergize the resilience and high-quality development in this area, but have a poor radioactive effect on the neighboring cities. The regression coefficient and lagged coefficient of transportation facilities (X3) are both significantly positive, displaying that the transportation accessibility not only has a significant positive impact on the synergistic evolution of urban resilience and high-quality development, but also has a rippling effect on the development of adjacent municipalities and neighboring area. Meanwhile, neither the regression coefficient for environmental regulation (X4) nor the lagged coefficient is significant, which implies that the impact of environment regulation upon urban resilience and high-quality development is not large in the current period and that its effect can be achieved only after a lag of one or more years. For government intervention (X5) and science and technology (X6), the regression coefficients are significantly positive in magnitude, and the cross-lagged coefficients are significantly negative, suggesting that both of these factors have a role in promoting urban resilience and high-quality development but have a strong competitive relationship with neighboring municipalities. For the labor factor (X7), the regression coefficient is significantly negative, indicating that excessive population densities places pressure on the city development and increases resource consumption, which is not conducive to the continued promotion of urban resilience and high-quality development. The coefficient on people’s living standard (X8) is significantly negative, displaying that increasing this factor will, to some degree, inhibit the synergy of urban resilience and high-quality development in the surrounding regions.
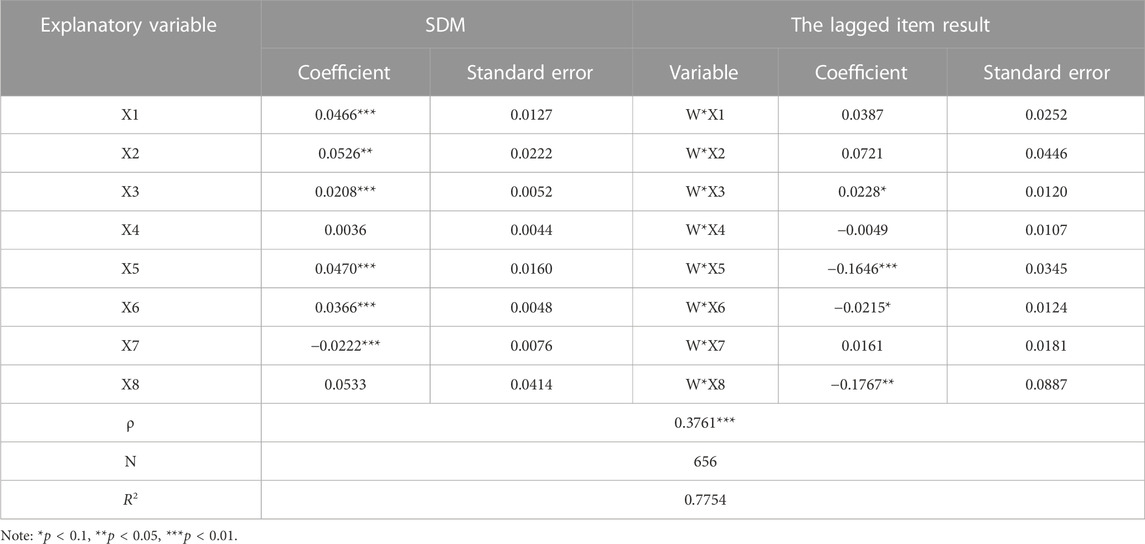
TABLE 7. The regression results of spatial durbin model.
In this paper, the robustness test is carried out with replacing the distance attenuation space matrix used by Zhou and Tang (2022). The results are displayed in Table 8. After the influence of economic distance upon the model is excluded, it can be vividly disclosed that the spatial lag coefficient of economic strength (X1) changes from being positive to negative, and that the estimation results of other variables have not changed fundamentally, so that it can be concluded that the estimation results of this paper are reliable.
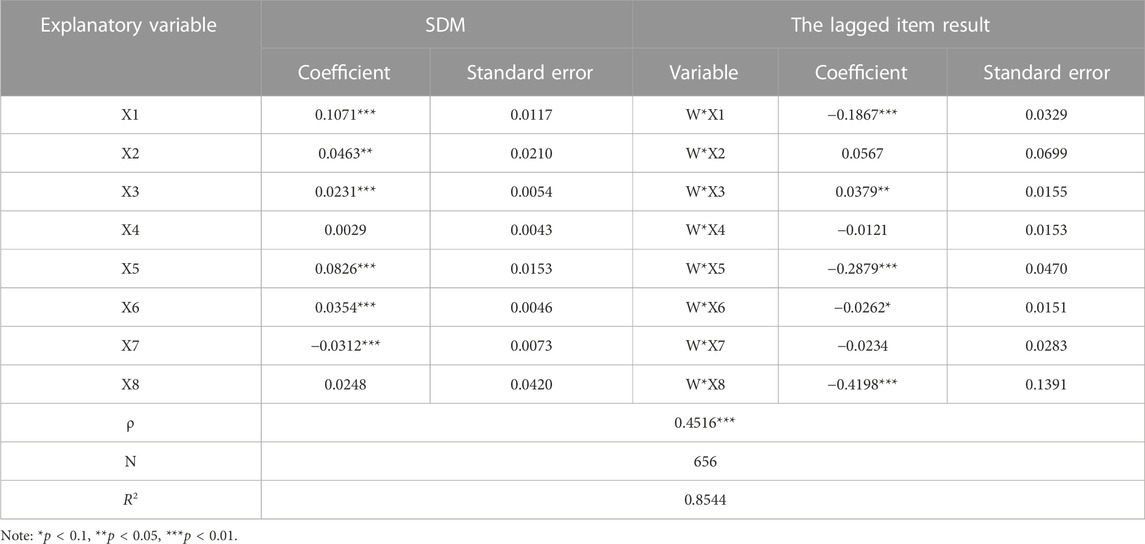
TABLE 8. The regression results of the robustness test.
Last century has witnessed a remarkable process of global urbanization, with multitudinous cities throughout the globe accomplishing the great feat of moving from nothing to a tiny village or town to a major metropolis (Mcneill and Engelke, 2016). It is worth noting, however, that the inexpressibly rapid growth of urbanization has also triggered a range of disasters and public crises, causing unpredictable damage to people of all countries (Moore et al., 2003). At this critical moment, the Chinese government has proposed accelerating the construction of an urban spatial planning system with resilience as the core, and has proposed high-quality development being an element, in order to work towards a better and more prosperous world as is described by the United Nations in the 2030 Agenda for Sustainable Development. So, what can we learn from this research?
There is a close relationship between the size of a city and the functions it undertakes, and the functions undertaken by diverse classes of cities within the urban system vary as well (Clark, 1945). As the mega-cities in the YRDA, Shanghai, Nanjing and Hangzhou are all the core and major areas of high-quality development, as well as the sensitive and severely affected areas where innumerable risks and countless crises are concentrated, and therefore, these metropolises, which are in a unique position to propel the synergistic evolution of urban resilience and high-quality development, assume especially duty-bound functions which cannot be assumed by other cities. This view is also supported by our study, as the results of the spatio-temporal pattern analysis in Part 3 of this paper vividly display that Shanghai, Nanjing and Hangzhou are not only the regions with high levels of urban resilience and high-quality development, but also the first-tier cities to achieve basic coordination between the two systems. In this case, they form the three major growth poles in the spatial distribution of the YRDA, radiating and propelling the synergistic development of the surrounding cities.
Under the strategic deployment of efficient prevention and control of risks as well as the economic and social development, both of which are regarded as a paramount node hub for collaboratively promoting urban resilience and high-quality development, the mega-cities in the YRDA have the potential to cement the modernization of urban service management capabilities, the modernization of urban co-construction and co-governance capabilities, and the modernization of urban risk prevention and control capabilities. Thus, there is an urgent need to scientifically or rationally plan and promote the construction of metropolitan areas, by the close inter-personal and economic ties between cities and in keeping with the trend of industrial upgrading and spatial development. On the one hand, we can take Shanghai, Nanjing and Hangzhou as the axis, through the establishment of a robust coordination mechanism for the metropolitan area, accelerate the outward extension of infrastructure, the mutual flow of factor resources, the dispersal of functional industries from the local to the outside, and the coverage of public services to the periphery, better promote the all-round development of the surrounding cities, so as to gradually narrow the discrepancies in the development between cities varying from being large, medium and small, and to promote regional coordination. On the other hand, in response to a multitude of emergent conditions, mega-cities should actively call for governments at all levels within the metropolitan area to form a unified caliber and a prescriptive system for the prevention, reporting and management of public crises, and implement a standardized, effective and timely information notifying system. Based on this very solid foundation, temporary emergency headquarters in the metropolitan area will be established to actively coordinate the advantageous resources of the cities, in order to effectively organize pre-crisis prevention, exercises and reserves, joint defense in the crisis, and post-crisis reconstruction and recovery.
As far as we know, a series of similar guiding rules were introduced in the “Nanjing Metropolitan Area Development Plan”, which was fully disseminated to the entire society in 2021. For example, it actively guides the transfer of Nanjing’s higher education and healthcare resources to other cities within the metropolitan area in an appropriate and orderly manner, explores the establishment of a tax-sharing mechanism for the metropolitan area, and collaborates to create a unified standard for supervision and management, all of which are planning rules that, to some extent, support the feasibility of the policy proposals presented in this paper. While the plan covers the period extending to 2025, with a long-term outlook extending to 2035, which is also a reflection of the applicability of our policy recommendations in the future.
Since the inception of the 21st century, the Chinese government has actively explored the path of a transformation from administrative functions to service functions (Zhang and Lv, 2021). The service-oriented government is dedicated to establishing a relatively comprehensive public service system, with increased public funding in education, culture, health, ecological environment, infrastructure, and social security as well as investment derived from other aspects, aiming to promote the equalization of basic public services (Xia et al., 2019). The over-two-decade stint of time witnesses that with a view to building a service-oriented government, China has achieved splendid accomplishments such as a comprehensively free and compulsory education, a basic medical security system covering over 90% of residents inhabiting both the urban and the rural area, and a complete victory in the fight against poverty.
These achievements have laid a solid foundation for the synergistic promotion of urban resilience and high-quality development. Our study also displays that the governmental factors such as the perfection of the transportation facilities, the ratio of the local budget expenditure to GDP and the proportion of spending on science and technology in fiscal spending, play a significant role in contributing to the improvement of the CCD between urban resilience and high-quality development. This also reflects, to a certain extent, the vital importance of building a service-oriented government. As a result, the government should adhere to the goal of promoting sustainable development of the region with high-level government services, and abide by the principle of giving full play to its positive spatial spillover effect of “harmonizing with neighbors”. Through comprehensive investigation and careful planning, the factor resources of all kinds are reasonably and appropriately allocated throughout the economic, social, ecological, and engineering development process, so that the coordinated coupling of urban resilience and high-quality development can be maximized and that the transition from basic coordination to good coordination can be realized.
The introduction of the conception of “high-quality development” has gradually transformed China’s urban development from a wildly disorientated expansion in the past to a new phase of all-encompassing revitalization, and the criteria for evaluating urban development in the community also changed simultaneously (Falco, 2015). The city, regarded as an organic life form, has not been able to evaluate its level of development simply from the alteration in mechanical data. Gradually, the quality of people’s lives and the degree of social equity are emerging as new criteria to measure urban development and social construction (Yang and Fu, 2019). The synergy between urban resilience and high-quality development should therefore be based on a humanist tone, which is adopted to pursue the ultimate goal of profound social ‘equality’ and common prosperity for all people. So, are policies and practices which promote urban resilience and high-quality development fully equitable and inclusive in reality ? In our perspective, the answer is ‘never’. Considering the current situation, the local governments, in the process of promoting urban resilience and high-quality development, often assist highly-educated, capable and high-income people in obtaining urban identity-certifying registry, which is well called Hu Kou in the Chinese language, through diversified talent-enrolling policies. In contrast, migrant workers, who are deplorably educated, less thoroughly skilled and financially challenged, are more eager to work in the cities and but their identity-certifying registry is in rural areas (Wang et al., 2023). For this group of people, receiving equitable distribution of benefits and effective assistance derived from the government policy is often a challenge, which in turn confines the further development of the city and the urban habitat enhancement to some degree. It may also be a paramount factor in the inability of labor factors and in people’s living standards in the YRDA which play a facilitating role in the synergistic evolution of urban resilience and high-quality development. Furthermore, China’s control over the identity-certifying registry which is equivalent to Hu Kou in Chinese, and the manner in which the benefits it carries are distributed also renders it easier for residents with local urban identity-certifying registry to receive the corresponding rights and benefits well compared to both rural and foreign population (Pi and Zhang, 2016). This is especially evident in major cities like Shanghai and Nanjing. A growing number of youth are choosing to move from rural areas to urban areas in pursuit of a life of a higher quality, rendering a series of social problems, such as tiny empty villages which only senile citizens inhabit and young people leave for cities, left-behind children and talent shortage in rural areas, all of which are increasingly prominent. This leads us to making another hypothesis: improving urban resilience and high quality development in a region (country) will sacrifice the interests of some rural areas. This claim needs to be verified in future research.
In the new era of building resilient cities and promoting high-quality development in China, strengthening the theoretical perceiving and empirical research on the synergistic evolution of urban resilience and high-quality development is not only the central task and inevitable trend of future urban planning and governance, but also an active exploration of a new model of human social development in the post-epidemic era, in the view of which, we have constructed an evaluation index system for urban resilience and high-quality development, and then measured the coupled and coordinated development of them, adopting kernel density curves and spatial statistical analysis to vividly reveal their spatio-temporal evolution characteristics, and analysed their influencing factors with the help of SDM. The findings of the research are that: 1) The stint of 2005–2020 witnessed that urban resilience maintained a steady growth, while high-quality development displayed a trend of an initial increase and a subsequent decline. In terms of spatial pattern, the former reveals a structural feature of “being highest in the east, comparatively lower in the central part and the lowest in the west,” while the latter displays a pattern of “being high in the south, low in the north, and prominent in the middle.” 2) The CCD between urban resilience and high-quality development continued to rise throughout the stint of 2005–2020, while the regional difference decreased conspicuously, manifesting a good developing trend. Overall, the spatial pattern was characterized by “being high in the east and low in the west, tending to be balanced in the north and south, and being prominent in the middle of the distribution.” 3) In the YRDA, there is a significant positive spatial correlation in the CCD, which tends to exhibit the conspicuous clustering features and is more spatially homogeneous compared to being heterogeneous. 4) Driving factors that have a remarkably significant effect on ameliorating the CCD in the YRDA include the economic strength, the industrial structure, the transportation facilities, the science and technology, and the government intervention, although the labor factor plays an inhibiting role in improving the CCD in the region. The improvement of transportation facilities is the factor that promotes the improvement of the coupling coordination level of adjacent cities, while the government intervention, the science and technology and people’s living standards are the factors that hinder the improvement of the coupling coordination level of adjacent cities.
Although this paper discusses the theoretical mechanism, spatio-temporal evolution and driving forces for the CCD between urban resilience and high-quality development in the YRDA from the perspective of being regionally systematical and comprehensive, there is still a large scope for improvement. The qualitative data provided by the field surveys and in-depth interviews can further support and enrich our research, as well as providing us with more profound insights and inspiration. Unfortunately, because of the long acquisition cycle of such data and the difficulty of retrieval, the research sample conducted by us has not contained it. As the technical equipment continues to be ceaselessly updated and as the research materials continue to be unceasingly enriched, further simulation and prediction of the developing trend of urban resilience and high-quality development can be made on the basis of combining qualitative and quantitative data to enrich relevant research findings.
The original contributions presented in the study are included in the article/Supplementary Materials, further inquiries can be directed to the corresponding authors.
JZ: conceptualization, methodology, software, formal analysis, writing (original draft), and writing (review and editing). JY: writing (review and editing), supervision, visualization, and funding acquisition. YW: writing (review and editing), funding acquisition, and software. All authors contributed to the article and approved the submitted version.
This study was supported by the Anhui Jianzhu University Introduces Talents (Doctoral) for Scientific Research Initiation Project Approval (Grant No.2019QDR13); Humanities and Social Sciences Key Projects of Universities of Anhui Province (Grant No. SK 2021A0355); National Social Science Foundation Project of China (Grant No. 22CRK008).
The authors declare that the research was conducted in the absence of any commercial or financial relationships that could be construed as a potential conflict of interest.
All claims expressed in this article are solely those of the authors and do not necessarily represent those of their affiliated organizations, or those of the publisher, the editors and the reviewers. Any product that may be evaluated in this article, or claim that may be made by its manufacturer, is not guaranteed or endorsed by the publisher.
The Supplementary Material for this article can be found online at: https://www.frontiersin.org/articles/10.3389/fenvs.2023.1174875/full#supplementary-material
Bahadur, A. V., and Thornton, H. (2015). Analysing urban resilience: A reality check for a fledgling canon. Int. J. Urban. Sustain. 7 (2), 196–212. doi:10.1080/19463138.2015.1060595
Baltagi, B. H., and Li, D. (2006). Prediction in the panel data model with spatial correlation: The case of liquor. Spat. Econ. Anal. 1, 175–185. doi:10.1080/17421770601009817
Campanella, T. J. (2006). Urban resilience and the recovery of new orleans. J. Am. Plann. Assoc. 72 (2), 141–146. doi:10.1080/01944360608976734
Chen, Y., Su, X., and Zhou, Q. (2021). Study on the spatiotemporal evolution and influencing factors of urban resilience in the Yellow River basin. Environ. Sci. Pollut. Res. Int. 18, 10231. doi:10.3390/ijerph181910231
Chen, Y., Zhu, M., Lu, J., Zhou, Q., and Ma, W. (2020). Evaluation of ecological city and analysis of obstacle factors under the background of high-quality development: Taking cities in the Yellow River Basin as examples. Ecol. Indic. 118, 106771. doi:10.1016/j.ecolind.2020.106771
Clark, C. (1945). The economic functions of a city in relation to its size. J. Econ. Soc. 13, 97–113. doi:10.2307/1907009
Cui, Y., Khan, S. U., Deng, Y., and Zhao, M. (2022). Spatiotemporal heterogeneity, convergence and its impact factors: Perspective of carbon emission intensity and carbon emission per capita considering carbon sink effect. Environ. Impact. Asses. 92, 106699. doi:10.1016/j.eiar.2021.106699
Deng, Y., Cui, Y., Khan, S. U., Zhao, M., and Lu, Q. (2022). The spatiotemporal dynamic and spatial spillover effect of agricultural green technological progress in China. Environ. Sci. Pollut. Res. 29, 27909–27923. doi:10.1007/s11356-021-18424-z
Desouza, K. C., and Flanery, T. H. (2013). Designing, planning, and managing resilient cities: A conceptual framework. Cities 35, 89–99. doi:10.1016/j.cities.2013.06.003
Dong, Y., Ren, Z., Fu, Y., Hu, N., Guo, Y., Jia, G., et al. (2022). Decrease in the residents’ accessibility of summer cooling services due to green space loss in Chinese cities. Environ. Int. 158, 107002. doi:10.1016/j.envint.2021.107002
Du, Y., Chen, X., Liu, Y., Wang, Y., Zhu, X., and Liu, S. (2022). Dynamic evolution and driving force of high-quality development in Harbin-Changchun urban agglomeration at the country level. Econ. Geogr. 42, 62–71. doi:10.15957/j.cnki.jjdl.2022.08.007
Falco, G. J. (2015). City resilience through data analytics: A human-centric approach. Pro. Eng. 118, 1008–1014. doi:10.1016/j.proeng.2015.08.542
Fan, Y., Fang, C., and Zhang, Q. (2019). Coupling coordinated development between social economy and ecological environment in Chinese provincial capital cities-assessment and policy implications. J. Clean. Prod. 229, 289–298. doi:10.1016/j.jclepro.2019.05.027
Fritz, J. J., and Vollmer, D. (2006). To what extent can technology compensate for institutional failure in an urban environmental management setting: The case of China. Technol. Soc. 28 (1-2), 95–104. doi:10.1016/j.techsoc.2005.10.006
Gao, F. (2021). A deeper understanding of the connotation of China's high-quality development based on the transformation of the principal contradiction facing Chinese society. Shanghai. J. Econ. 12, 14–21. doi:10.19626/j.cnki.cn31-1163/f.2021.12.002
Gao, K., and Yuan, Y. (2022). Is the sky of smart city bluer? Evidence from satellite monitoring data. J. Environ. Manage. 317, 115483. doi:10.1016/j.jenvman.2022.115483
Godschalk, D. R. (2003). Urban hazard mitigation: Creating resilient cities. Nat. Hazards. Rev. 4 (3), 136–143. doi:10.1061/(ASCE)1527-6988(2003)4:3(136)
Holling, C. S. (1973). Resilience and stability of ecological systems. Annu. Rev. Ecol. S. 4 (1), 1–23. doi:10.1146/annurev.es.04.110173.000245
Huo, K., Ruan, Y., Fan, H., and Guo, C. (2022). Spatial-temporal characteristics of cultivated land change and controlling factors in the Yangtze River Delta region of China. Front. Environ. Sci. 2140. doi:10.3389/fenvs.2022.871482
Jiang, L., Zuo, Q., Ma, J., and Zhang, Z. (2021). Evaluation and prediction of the level of high-quality development: A case study of the Yellow River basin, China. Ecol. Indic. 129, 107994. doi:10.1016/j.ecolind.2021.107994
Li, B., and Wang, H. (2023). Comprehensive evaluation of urban high-quality development: A case study of liaoning province. Environ. Dev. Sustain. 25 (2), 1809–1831. doi:10.1007/s10668-022-02129-5
Li, W., and Yi, P. (2020). Assessment of city sustainability—coupling coordinated development among economy, society and environment. J. Clean. Pro. 256, 120453. doi:10.1016/j.jclepro.2020.120453
Li, X., Lu, Y., Rafique, M. Z., and Asl, M. G. (2022). The effect of fiscal decentralization, environmental regulation, and economic development on haze pollution: Empirical evidence for 270 Chinese cities during 2007–2016. Environ. Sci. Pollut. Res. Int. 29, 20318. doi:10.1007/s11356-021-17175-1
Li, Y., Yan, C., and Ren, X. (2023). Do uncertainties affect clean energy markets? Comparisons from a multi-frequency and multi-quantile framework. Energy Econ. 121, 106679. doi:10.1016/j.eneco.2023.106679
Li, Z., Luo, Z., Wang, Y., Fan, G., and Zhang, J. (2022). Suitability evaluation system for the shallow geothermal energy implementation in region by Entropy Weight Method and TOPSIS method. Renew. Energy 184, 564–576. doi:10.1016/j.renene.2021.11.112
Liu, J., Zhang, L., and Zhang, N. (2022). Analyzing the south-north gap in the high-quality development of China’s urbanization. Sustainability 14, 2178. doi:10.3390/su14042178
Liu, W., Jiao, F., Ren, L., Xu, X., Wang, J., and Wang, X. (2018). Coupling coordination relationship between urbanization and atmospheric environment security in Jinan City. J. Clean. Pro. 204, 1–11. doi:10.1016/j.jclepro.2018.08.244
Liu, X., Li, S., Xu, X., and Luo, J. (2021). Integrated natural disasters urban resilience evaluation: The case of China. Nat. Hazards. 107, 2105–2122. doi:10.1007/s11069-020-04478-8
Ma, D., Zhang, J., Wang, Z., and Sun, D. (2022). Spatio-temporal evolution and influencing factors of open economy development in the Yangtze River Delta area. Land 11, 1813. doi:10.3390/land11101813
Martin, J. L., Maris, V., and Simberloff, D. S. (2016). The need to respect nature and its limits challenges society and conservation science. Proc. Nati. Acad. Sci. 113, 6105–6112. doi:10.1073/pnas.1525003113
Martin, R., and Sunley, P. (2015). On the notion of regional economic resilience: Conceptualization and explanation. J. Econ. Geogr. 15, 1–42. doi:10.1093/jeg/lbu015
Mcneill, J. R., and Engelke, P. (2016). The great acceleration: An environmental history of the Anthropocene since 1945. Cambridge, USA: Harvard University Press.
Meerow, S., Newell, J. P., and Stults, M. (2016). Defining urban resilience: A review. Landsc. Urban. Plan. 147, 38–49. doi:10.1016/j.landurbplan.2015.11.011
Miao, S., Wen, F., and Zhang, Y. (2022). Industry tournament incentives and the speed of leverage adjustments: Evidence from China. Int. Rev. Financ. Anal. 83, 102332. doi:10.1016/j.irfa.2022.102332
Moore, M., Gould, P., and Keary, B. S. (2003). Global urbanization and impact on health. Int. J. Hyg. Environ. Health. 206, 269–278. doi:10.1078/1438-4639-00223
Pi, J., and Zhang, P. (2016). Hukou system reforms and skilled-unskilled wage inequality in China. China. Econ. Rev. 41, 90–103. doi:10.1016/j.chieco.2016.08.009
Ranasinghe, U., Jefferies, M., Davis, P., and Pillay, M. (2020). Resilience engineering indicators and safety management: A systematic review. Saf. Health. Work. 11, 127–135. doi:10.1016/j.shaw.2020.03.009
Ren, X., Zeng, G., and Gozgor, G. (2023). How does digital finance affect industrial structure upgrading? Evidence from Chinese prefecture-level cities. J. Environ. Manage. 330, 117125. doi:10.1016/j.jenvman.2022.117125
Reuter, C., and Spielhofer, T. (2017). Towards social resilience: A quantitative and qualitative survey on citizens' perception of social media in emergencies in europe. Technol. Forecast. Soc. Change. 121, 168–180. doi:10.1016/j.techfore.2016.07.038
Shamsuddin, S. (2020). Resilience resistance: The challenges and implications of urban resilience implementation. Cities 103, 102763. doi:10.1016/j.cities.2020.102763
Shi, T., Qian, Y., and Zhou, Q. (2021). Spatiotemporal evolution and spatial relevance of urban resilience: Evidence from cities of China. Growth. Change. 52, 2364–2390. doi:10.1111/grow.12554
Sun, J., Jiang, Z., and Hu, J. (2022). Spatio-temporal evolution pattern and driving factors of high-quality development of Chinese cities in the new era. Geogr. Res. 41, 1864–1882. doi:10.11821/dlyj020210719
Sun, J., Liu, S., Wang, L., and He, Z. (2020). Safety resilience evaluation of urban public bus based on comprehensive weighting method and fuzzy comprehensive evaluation method. Icuems 370–379. doi:10.1109/ICUEMS50872.2020.00086
Sun, R., Gong, Z., Gao, G., and Shah, A. A. (2020). Comparative analysis of multi-criteria decision-making methods for flood disaster risk in the Yangtze River Delta. Int. J. Disast. Risk. Re. 51, 101768. doi:10.1016/j.ijdrr.2020.101768
Sun, X., Xiao, S., Ren, X., and Xu, B. (2023). Time-varying impact of information and communication technology on carbon emissions. Energy Econ. 118, 106492. doi:10.1016/j.eneco.2022.106492
Wang, H., and Zuo, R. (2015). A comparative study of trend surface analysis and spectrum–area multifractal model to identify geochemical anomalies. J. Geochem. Explor. 155, 84–90. doi:10.1016/j.gexplo.2015.04.013
Wang, R., and Feng, Y. (2020). Research on China's ecological welfare performance evaluation and improvement path from the perspective of high-quality development. Math. Probl. Eng. 2020, 1–14. doi:10.1155/2020/5476089
Wang, Z., Fu, H., and Ren, X. (2023). Political connections and corporate carbon emission: New evidence from Chinese industrial firms. Technol. Forecast. Soc. 188, 122326. doi:10.1016/j.irfa.2021.101999
Wang, Z., Ma, D., Zhang, J., Wang, Y., and Sun, D. (2023). Does urbanization have spatial spillover effect on poverty reduction: Empirical evidence from rural China. Econ. Res-Ekon. Istraz. 36 (1), 2167730. doi:10.1080/1331677X.2023.2167730
Wen, F., Zhao, H., Zhao, L., and Yin, H. (2022). What drive carbon price dynamics in China? Int. Rev. Financ. Anal. 79, 101999. doi:10.1016/j.irfa.2021.101999
Xia, Z., Tian, S., and Yan, X. (2019). Mapping the knowledge domain: Research on service-oriented government in China. J. Chin. Polit. Sci. 24, 341–360. doi:10.1007/s11366-019-09604-3
Xinhua News. (2023). The Ministry of Emergency Management has released basic information on natural disasters in China in 2022. Available at: http://www.gov.cn/xinwen/2023-01/13/content_5736666.htm
Xun, X., and Yuan, Y. (2020). Research on the urban resilience evaluation with hybrid multiple attribute TOPSIS method: An example in China. Nat. Hazards. 103 (1), 557–577. doi:10.1007/s11069-020-04000-0
Yang, C., Zeng, W., and Yang, X. (2020). Coupling coordination evaluation and sustainable development pattern of geo-ecological environment and urbanization in Chongqing municipality, China. Sustain. Cities. Soc. 61, 102271. doi:10.1016/j.scs.2020.102271
Yang, F., and Liu, G. (2022). Research on spillover effect of urbanization on rural land transfer based on the SDM model of intelligent computing. Mob. Inf. Syst. 2022, 1–10. doi:10.1155/2022/9921309
Yang, J., and Fu, X. (2019). The centre of city: Wind environment and spatial morphology. Berlin: Berlin Book Springer.
Yang, Y., Fang, Y. P., Xu, Y., and Zhang, Y. (2021). Assessment of urban resilience based on the transformation of resource-based cities: A case study of panzhihua, China. Ecol. Soc. 26 (2), 20. doi:10.5751/ES-12280-260220
Zhang, A., and Lv, N. (2021). Research on the impact of big data capabilities on government’s smart service performance: Empirical evidence from China. Ieee. Access 9, 50523–50537. doi:10.1109/ACCESS.2021.3056486
Zhang, Y., Khan, S. U., Swallow, B., Liu, W., and Zhao, M. (2022). Coupling coordination analysis of China's water resources utilization efficiency and economic development level. J. Clean. Prod. 373, 133874. doi:10.1016/j.jclepro.2022.133874
Zhang, Y., Liu, W., Cai, Y., Khan, S. U., and Zhao, M. (2021). Decoupling analysis of water use and economic development in arid region of China–based on quantity and quality of water use. Sci. Total. Environ. 761, 143275. doi:10.1016/j.scitotenv.2020.143275
Keywords: urban resilience, high-quality development, coupling coordination, spatio-temporal evolution, Yangtze River Delta Area
Citation: Zhang J, Yuan J and Wang Y (2023) Spatio-temporal evolution and influencing factors of coupling coordination between urban resilience and high-quality development in Yangtze River Delta Area, China. Front. Environ. Sci. 11:1174875. doi: 10.3389/fenvs.2023.1174875
Received: 28 March 2023; Accepted: 17 May 2023;
Published: 26 May 2023.
Edited by:
Xiaohang Ren, Central South University, ChinaReviewed by:
Yan Zheng, Central South University, ChinaCopyright © 2023 Zhang, Yuan and Wang. This is an open-access article distributed under the terms of the Creative Commons Attribution License (CC BY). The use, distribution or reproduction in other forums is permitted, provided the original author(s) and the copyright owner(s) are credited and that the original publication in this journal is cited, in accordance with accepted academic practice. No use, distribution or reproduction is permitted which does not comply with these terms.
*Correspondence: Jiade Yuan, eWpkQGFoanp1LmVkdS5jbg==; Yuchun Wang, d3ljMDEwMUBhaGp6dS5lZHUuY24=
Disclaimer: All claims expressed in this article are solely those of the authors and do not necessarily represent those of their affiliated organizations, or those of the publisher, the editors and the reviewers. Any product that may be evaluated in this article or claim that may be made by its manufacturer is not guaranteed or endorsed by the publisher.
Research integrity at Frontiers
Learn more about the work of our research integrity team to safeguard the quality of each article we publish.