 Tariq A. Deen
 M. Altaf Arain
 Olivier Champagne
 Patricia Chow-Fraser
 Dawn Martin-Hill
94% of researchers rate our articles as excellent or good
Learn more about the work of our research integrity team to safeguard the quality of each article we publish.
Find out more
ORIGINAL RESEARCH article
Front. Environ. Sci., 30 May 2023
Sec. Water and Wastewater Management
Volume 11 - 2023 | https://doi.org/10.3389/fenvs.2023.1171210
Introduction: This study explored streamflow dynamics of the McKenzie Creek watershed in Southern Ontario, Canada under a changing climate. The Creek is located in the southern portion of the Grand River watershed in the Great Lakes region and is an important water and ecosystem service provider for the Six Nations of the Grand River reserve, the largest (by population) Indigenous community in Canada and the fourth largest in North America.
Methods: The Coupled Groundwater and Surface-Water Flow Model (GSFLOW) was used to simulate streamflow from 1951 to 2020 using observed gridded meteorological data from Natural Resources Canada (NRCANmet) and in situ data from Environment and Climate Change Canada (ECCC). Downscaled data from the Coupled Model Intercomparison Project Phase 5 (CMIP5) for two Intergovernmental Panel on Climate Change (IPCC) Representative Concentration Pathways (RCP) climate warming scenarios, RCP 4.5 and RCP 8.5 were used to run GSFLOW for the historic (1951–2020) and projected (2021–2099) period.
Results: Results suggested that streamflow in the McKenzie Creek will be significantly impacted by climate change in winter months when streamflow is projected to increase due to higher temperatures causing early melting of snowpack and increasing winter precipitation. Consequently, spring streamflow is expected to decrease and little or no change in streamflow in the summer and autumn. These changes in streamflow dynamics may lead to more flooding incidents in the winter, while at the same time, the region may face reduced water availability or dry conditions in late spring and summer due to warm temperatures.
Discussion: This study provides important information about streamflow and hydrologic dynamics of this watershed that will help managers and planners to better manage water resources and be prepared to deal with climate change and its impacts on water availability and security not only for the Six Nations area but also for Southern Ontario which houses one-third of Canada’s population.
Climate change projections for the eastern Great Lakes region in North America indicate that annual average temperature will increase between 2.3°C and 7.9°C and total precipitation will increase by 72–123 mm by the end of the 21st century (IPCC, 2013; McDermid et al., 2015a; Bush and Lemmen, 2019). Consequently, the frequency and duration of extreme warm temperatures and the frequency and intensity of extreme precipitation events are expected to increase (d’Orgeville et al., 2014; Deng et al., 2016; Razavi et al., 2016; Wazneh et al., 2017; Zhang et al., 2020; Deen et al., 2021). These changes in temperature and precipitation dynamics have the potential for impacting environmental, ecological, and hydrological dynamics in the region, especially streamflow (Dudley et al., 2017; Wuebbles et al., 2019; Douville et al., 2021; Wang et al., 2021). For communities located near rivers and streams, especially rural and Indigenous communities, these changes in streamflow may entail serious consequences, such as flooding, summer water stress, lower ecosystem productivity and other infrastructure, social, and economic impacts. Given the continued rise in atmospheric greenhouse gasses (GHGs), it is very important to access the potential impacts of future climate change on streamflow and watersheds in the Great Lakes region, which houses more than 30% and roughly 10% of the populations of Canada and the United States, respectively (Gulev et al., 2021; EPA, 2023). Such studies and analyses are essential for developing strategies for climate change adaptation, disaster risk reduction, and water resource planning ranging from the community to watershed to regional scale and decision-support frameworks (Morand et al., 2015; IPCC, 2022).
In the literature many hydrologic studies have been published exploring climate change impacts on watershed hydrology and streamflow in the Great Lakes region (Cherkauer and Sinha, 2010; Crossman et al., 2013; McDermid et al., 2015b; Erler et al., 2019; Costa et al., 2021; Mai et al., 2022). However, recent streamflow studies have been conducted in medium to large size watersheds, such as the Thames and Grand River watersheds which are among the largest watersheds in Southern Ontario, Canada (Champagne et al., 2019; Champagne et al., 2020a; Champagne et al., 2020b; Hanief and Laursen, 2017; Kaur et al., 2019; Li et al., 2016; Liu et al., 2016; Philip et al., 2022; Rahman et al., 2012; Zhang et al., 2018) and Western New York watersheds in the United States (Soonthornrangsan and Lowry, 2021). In the literature, with some exceptions (e.g., Grillakis et al., 2011; Ahmet and Tsanis, 2016; Buttle, 2018; Larocque et al., 2019; Persaud et al., 2020), there is a lack of studies focusing on streamflow of smaller streams or tributaries in this region and exploring how the streamflow of smaller streams or tributaries may be impacted by climate change and extreme weather events. Streamflow of these smaller streams or tributaries is much more vulnerable to climate change and extreme weather impacts due to the smaller size of their catchments and command areas and challenges due to the timing of future water availability in relation to higher demand in the growing season (Larocque et al., 2019). Often entire communities depend on these smaller streams or tributaries for their water and ecosystem services. These communities will be much more vulnerable to future water stress or flooding events. One such example is the Six Nations of Grand River reserve (Six Nations), which is the largest Indigenous community in Canada with approximately 13,000 people living in the reserve (GWF, 2022). It is also the fourth largest reserve in North America (Norris et al., 2012). This Indigenous community relies heavily on the McKenzie Creek, which is a small tributary of the Grand River for its water and ecosystem services (MacVeigh et al., 2016). This reliance has increased the vulnerability of the community to climatic stresses and undermines the security of future water resources. Although a number of water related issues have been highlighted for the Six Nations community including, but not limited to water quality (Makhdom, 2021), access to water (Chattopadhyay, 2018), water governance (Martin-Hill et al., 2022) and community health (Duignan et al., 2020; Duignan et al., 2022; Sultana et al., 2022), no comprehensive study has been conducted exploring the impacts of future climate change and extreme events on streamflow and water balance of the McKenzie Creek. Such studies and analyses for different future climate change scenarios are critical for developing water related planning and decision-support frameworks for the community.
As a part of the Global Water Futures Program’s (GWF) Co-Creation of Indigenous Water Quality Tools (Co-Creation) initiative, which strives to better understand water related issues within the Six Nations of the Grand River, this study was conducted to determine the impacts of climate change on the McKenzie Creek watershed. The specific objectives of our study are to i) analyze the past trends and conduct future simulations of streamflow of the McKenzie Creek of the Grand River in Southern Ontario, Canada under two IPCC climate warming scenarios, Representative Concentration Pathways (RCP) 4.5 and 8.5 and ii) determine how climate change may impact the dynamics of streamflow in the McKenzie Creek. Indigenous groups are recognized to face exacerbated levels of vulnerability to climate change (IPCC, 2022), and within Canada, Indigenous focused data and information is “woefully insufficient” (Indigenous Services Canada, 2022). This study will help to provide valuable information required to ensure the security of water resources for Six Nations of Grand River and prepare the community and others in Southern Ontario and the eastern Great Lakes region to deal with climate change impacts.
The McKenzie Creek watershed is a tributary of the southern portion of the Grand River watershed, which is the largest watershed in Southern Ontario (Figure 1). The watershed covers an area of 194 km2 and borders Brant County, Six Nations of the Grand River reserve, and Haldimand County. It provides these communities with water and other ecosystem services for activities such as dewatering (45%), agriculture (30%), industry (21%), and commerce (4%) (Wong, 2011). The Creek has a mean annual flow of 1.9 m3 s−1 or 350 mm year−1 and joins with the Boston Creek before discharging into the Grand River near the York flow station of the Grand River Conservation Authority (MacVeigh et al., 2016).
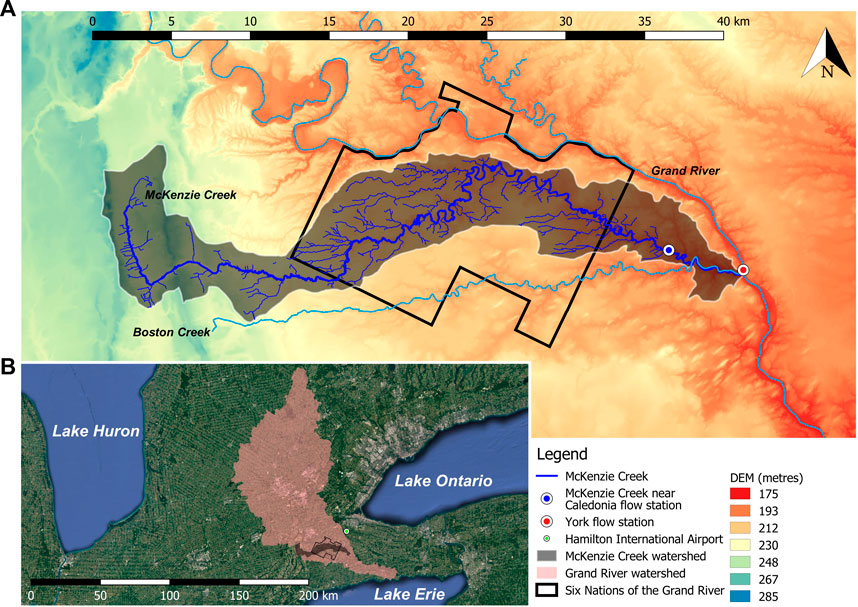
FIGURE 1. Map of the study area. (A) Digital Elevation Model (DEM) of the McKenzie Creek watershed (shaded black) area. McKenzie Creek waterbody is in bolded blue, Boston Creek and the Grand River in light blue, McKenzie Creek flow station is represented by the blue dot and the York flow station by the red dot, and Six Nations of the Grand River boundary is outlined in black. (B) Map of Grand River watershed (shaded pink) with the McKenzie Creek watershed in shaded black, and Six Nations of the Grand River boundary outlined in black. Hamilton Airport is represented by the green dot.
The climate of the region is humid continental (Dfa/Dfb) with cold winters and hot/warm summers (Beck et al., 2018). Temperature conditions are somewhat milder due to its proximity to Lake Erie which has the warmest summer water among all Great Lakes (EPA, 2016). Land cover in the watershed consists of rural and agriculture (70%), forest (24%) wetland (<1%), and urban (<5%). The watershed contains Canada’s largest block of Carolinian forest, primarily deciduous broad-leaf trees, which is located in the Six Nations area (MacVeigh et al., 2016). With respect to soil characteristics, the watershed is divided into Haldimand clay in the eastern part, Norfolk sand in the central and western part, and pockets of Wentworth till, and contains areas of gravel and exposed bedrock throughout. The coarser sand plains in the west of the watershed allow for greater infiltration of precipitation and groundwater recharge. Conversely, the clay plains in the central and eastern parts of the watershed (the majority of which is located in the Six Nations area) result in lower groundwater recharge rates and greater surface runoff, Overall, the hydrology of the watershed is strongly influenced by precipitation patterns (MacVeigh et al., 2016).
Simulations of hydrological processes and streamflow in the McKenzie Creek were performed using the Coupled Groundwater and Surface-Water Flow Model (GSFLOW) from 1951 to 2099. GSFLOW integrates two U.S. Geological Survey (USGS) models, the Precipitation-Runoff Modeling System (PRMS) and the Modular Groundwater Flow Model MODFLOW) to simulate surface and groundwater flow (Markstrom et al., 2008). The GSFLOW model has been previously used to simulate hydrological processes within the Grand River watershed (Earthfx, 2018) and has been used for climate change impact assessment for watersheds in the Great Lakes basin and other watersheds (Hunt et al., 2013; Feng et al., 2018; Soonthornrangsan and Lowry, 2021). A stand-alone PRMS has also been previously used to simulate hydrological processes within the Grand River and surrounding watersheds (Champagne et al., 2019; Champagne, 2020a; Champagne, 2020b). The GSFLOW model was chosen because it integrates surface processes computed by PRMS and groundwater simulations through MODFLOW, providing the Six Nations community with a holistic understanding of how climate change will affect the McKenzie Creek.
PRMS is a deterministic hydrological model used to simulate the response of precipitation, temperature and land use on a watershed. Streamflow is generated using hydrological components that are represented by algorithms based on a physical law or an empirical relation; the subsurface in PRMS is represented by the soil-zone and subsurface reservoirs (Markstrom et al., 2008). MODFLOW-2005 (also referred to as MODFLOW) is a finite-difference groundwater flow model, it simulates both steady state (i.e., constant flow velocity) and transient flow (i.e., altering flow velocity) water through porous Earth. Water entering and leaving the modelled saturated zone can be controlled through a number of processes including areal recharge, leakage to aquifers from streams and lakes, subsurface inflows, discharge by evapotranspiration from phreatophytes (i.e., plants with roots that reach the water table), discharge from pumping wells, and discharge to streams and lakes (Markstrom et al., 2008). Like all hydrological model GSFLOW has limitation and assumptions associated with it, for a detailed overview refer to Markstrom et al. (2008). Some of these limitations and assumptions include: 1-day timesteps and averaging of outputted flow thereby ignoring sub-daily extreme values, capillary reservoir being represented by a constant value of root depth for each HRU, and limited ability to simulate frozen ground conditions (Markstrom et al., 2008; Hunt et al., 2016).
In PRMS, the hydrological processes are computed for each HRU that has a surface grid cell size of 200 m × 200 m. PRMS allows for choice between different modules that were previously described in Champagne et al. (2019). The parameter values used by PRMS were spatialized to each HRU using Arcpy-GSFLOW under ArcGIS (Gardner et al., 2018), similar to what was previously done in several watersheds in the region by Champagne et al. (2019). MODFLOW has never been set up in this watershed before. For the MODFLOW, the horizontal grids were the same as the one used in PRMS (200 m × 200 m). In MODFLOW the vertical grids were discretized in 2 layers. The top layer represented the overburdened materials with a depth obtained by the Ontario Geological Survey (Gao et al., 2006). The deepest layer represented the bedrock with the surface corresponding to the bottom of the overburdened materials and the bottom fixed at 60 m. For each layer, the parameters needed in MODFLOW were estimated using the water wells data which provide the type of materials in the subsurface (for example, gravel, sand, silt, clay, etc.) (Ontario, 2021). The main subsurface material was coded from 1 to 4 from the largest grain (i.e., gravel) to the finest grind (i.e., clay). When several wells were present in a grid, the average soil characteristics for the code was calculated. If no well was present in the grid, the code was determined by interpolation of the surrounding averaged material codes. From these material codes, the spatial variability of hydraulic conductivity, specific yield and specific humidity were estimated per grid using literature values for each type of material (for example, gravel, sand, silt, clay, etc.) (Duffield, 2019).
Because agriculture is an important land use in the watershed, the well package (WEL) from MODFLOW was incorporated into GSFLOW’s simulations to account for groundwater well extraction. The WEL package assigned a pumping rate to specific cells and pumping rates can be positive (injection) or negative (extraction). Based on McKenzie Creek data from Wong (2011) pumping rates of 9,298 ft3 day−1 (263 m3 day−1) and −4,649 ft3 day−1 (131 m3 day−1; for mixed surface/groundwater wells) were used in our study. The stress period was defined from June 1st to September 20th to align with observed agricultural pumping records (Wong, 2011). It should be noted that water usage records in Wong (2011) for McKenzie Creek does not take into account water extraction within the Six Nations reserve, because such information was not available. As a result, the water extraction value used during the calibration, validation, and later simulations of the model are likely an underestimation of the true amount of well water being extracted within the watershed. This creates a level of uncertainty within the model that cannot be accounted for without a detailed survey of well water extraction within the Six Nations reserve which is not within the scope of this study. Similar comments regarding incomplete pumping records have been made by Tian et al. (2015).
Daily total precipitation (Ptot) and daily maximum and minimum temperatures (Tmax, Tmin) were used as input data for model simulations. Control period (1951–2020) simulations were forced with observed gridded meteorological data (NRCANmet, 1951–2013) from Natural Resources Canada (NRCAN) and Environment and Climate Change Canada (ECCC) meteorological data (2014–2020) retrieved from Hamilton International Airport (Meteorological Service of Canada, Weather Station ID: 6153193) (Hopkinson et al., 2011; McKenney et al., 2011). Hamilton International Airport is approximately 40 km northeast from the source of the McKenzie Creek.
Simulated historical (1951–2020) and future (2021–2099) climate data were downscaled precipitation and temperature values from eleven global climate models (GCM) of the Coupled Model Intercomparison Project Phase 5 (CMIP5) (Brekke et al., 2013) (Table 1). CMIP5 data before 2006 used observed GHG data, and CMIP5 data from 2006 onwards used projected GHG under RCP 4.5 and 8.5 scenarios. RCP 4.5 is an intermediate climate change pathway in which carbon dioxide (CO2) emissions will continue to increase until the mid-21st century after which emissions begin to level out, while RCP 8.5 represents a high climate change pathway in which CO2 emissions will continue to increase throughout the 21st century (Van Vuuren et al., 2011). Recent climate warming trends have been following the trajectory of RCP 8.5 (Schwalm et al., 2020). Downscaling of the CMIP5 GCMs was performed as outlined by Brekke et al. (2013) using the Bias Corrected Spatial Disaggregation (BCSD) method, which is a combination of 1) a bias correction technique using the quantile maps and 2) a spatial disaggregation of temperature and precipitation from the GCM grid resolution to 1/8° grid resolution (Brekke et al., 2013). Downscaled, bias-corrected GCM data have been previously used for climate change impacts studies as well as for watershed level studies (Navarro-Racines et al., 2020; Livingston et al., 2021). Despite this there are limitations in using GCM data to project future streamflow. Sources of uncertainty in CMIP5 data include natural internal climate variability, model uncertainty, and emissions scenario uncertainty (Barrow and Sauchyn, 2019).
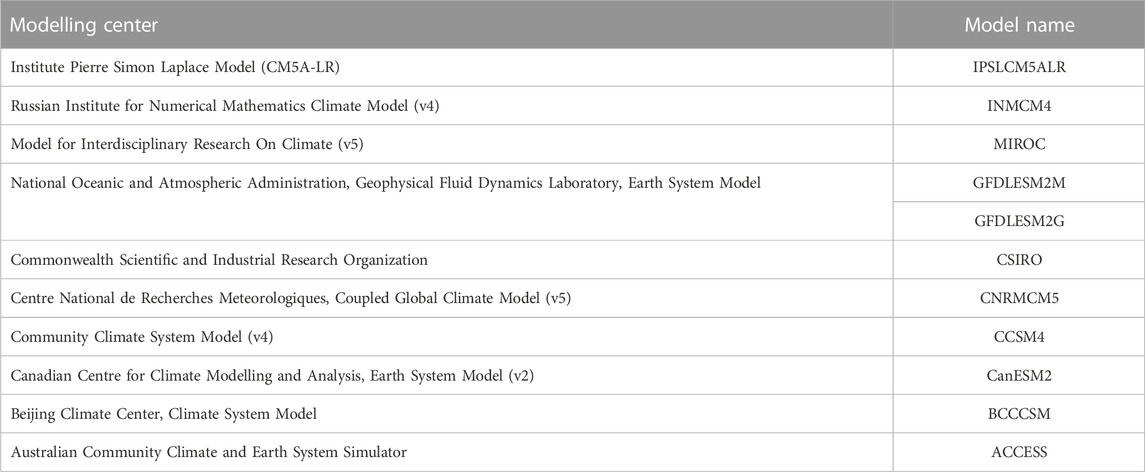
TABLE 1. Climate model data used in the study.
Calibration of GSFLOW was conducted from October 1998 to September 2003 and validated from October 2003 to September 2008 using Water Survey of Canada (WSC) observed streamflow from the McKenzie Creek near Caledonia (station number 02GB010). Approximately 25% of the observed streamflow data is classified as either a partial observation (i.e., calculation for daily data was made with an incomplete daily record), ice observation (i.e., ice cover was observed at the time of measurement), or estimated (i.e., observation is only an estimate). Consequently, uncertainties are introduced into the calibration of the model. Calibration and validation simulations were performed on the Shared Hierarchical Academic Research Computing Network (SHARCNET) a shared supercomputer system among some Canadian universities. Due to time limitations on the network, 5-year calibration and validation periods were used to ensure that a sufficient number of model runs could be performed. The range of parameters for initialization and the optimal values obtained are shown in Supplementary Table S1. Optimal values were achieved using the Optimization Software Toolkit for Research Involving Computational Heuristics (OSTRICH) optimization algorithm, OSTRICH has previously been used to calibrate GSFLOW in other Canadian watersheds (Matott, 2017; Kompanizare et al., 2018).
Because this study focuses on long-term changes in McKenzie Creek, therefore, several commonly used goodness-of-fit statistical tests were performed on daily and monthly time scales to access model performance such as Nash-Sutcliffe efficiency (NSE), Root Mean Square Error (RMSE), Percentage Bias (PBIAS), Kling-Gupta efficiency (KGE), and coefficient of determination (R2) (Moriasi et al., 2007; Moriasi et al., 2015). Daily and monthly calibration and validation results are shown in Figure 2 and summarized in Table 2. The goodness-of-fit statistical results are 0.78 (NSE), 0.94 (RMSE), 8.5 (PBIAS), 0.85 (KGE), and 0.79 (R2) for monthly validation averages. Figure 2 shows that the model does well in simulating peak and low streamflow. The dip in late 2007 observed streamflow is due to extreme drought as reported by the Canadian Drought Monitor. Based on the goodness-of-fit statistics it can be inferred that the model’s performance is satisfactory at monthly timesteps.
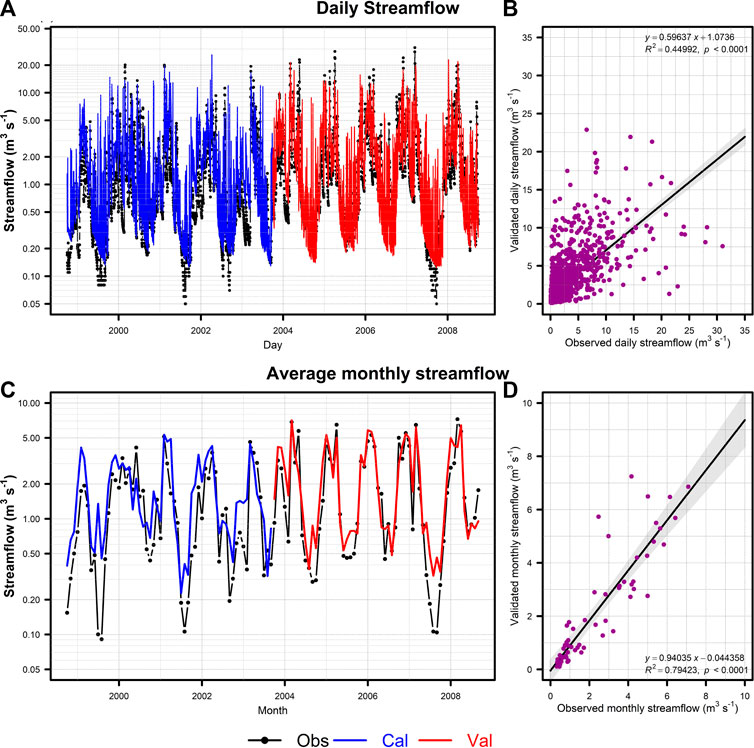
FIGURE 2. Calibration (October 1998–September 2003) and validation (October 2003–September 2008) results of GSFLOW streamflow simulations. (A) Daily observed and simulated streamflow, and (B) scatter plot of daily validation data against observed data during the validation period. (C) Monthly average of daily observed and simulated streamflow, and (D) scatter plot of monthly validation data against observed data during the validation period. Observed (Obs) streamflow is represented by the dashed-dotted black line, calibrated (Cal) streamflow is represented by the solid blue line, and validated (Val) streamflow is represented by the solid red line.
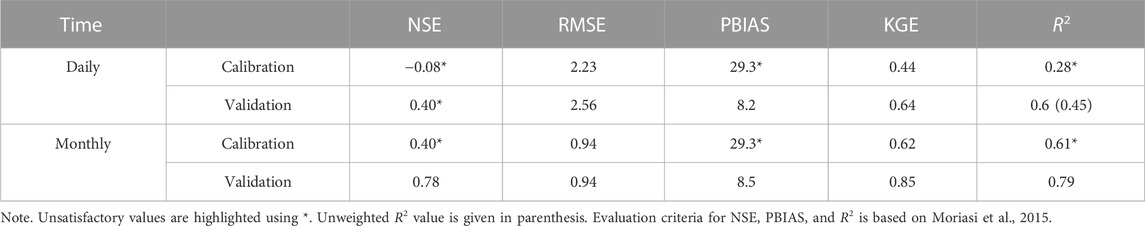
TABLE 2. Goodness-of-fit of calibration (October 1998–September 2003) and validation (October 2003–September 2008) period for results at a daily and monthly timesteps.
Canadian Drought Monitoring Services data indicates that between 2002 and 2022 there were 152 months defined as abnormally dry (event occurring once every 3–5 years), 77 moderate drought months (events occurring every 5–10 years), 33 severe drought months (events occurring every 10–20 years), and 8 extreme drought months (events occurring every 20–25 years) in Southern Ontario (Agriculture and Agri-Food Canada, 2022). Data also shows that the number of months with drought conditions has increased each year since 2002. A global assessment of compound drought-heatwave events (CDHW) found that under high emissions scenario CDHW will increase ten-fold, and regional results indicate that both the frequency and severity of CDHW will increase in the South Ontario region (Yin et al., 2023). Droughts have a significant impact on watersheds and the communities that rely on them for ecosystem services like agricultural irrigation. Water availability (W) was used to understand precipitated water that is not removed through evapotranspiration. This is water that can be stored as soil moisture, in underground aquifers, or runoff into streams or other water bodies; low water availability suggests the potential for dry or drought periods. Water availability was calculated using the water balance Eq. 1.
Where, Ptot is daily total precipitation (mm) and ET is daily total evapotranspiration (mm) simulated using GSFLOW.
Time series of annual values of observed and projected Ptot, Tmax and Tmin, are shown in Figure 3. From 1961 to 2020 mean observed Ptot was 886 mm year−1 and had a positive Sen’s slope of 1.9 mm year−1. During the same period projected mean Ptot for RCP 4.5 (RCP 8.5) warming scenario was 904 (906) mm year−1 and had a positive Sen’s slope of 0.9 (0.9) mm year−1. Future projections were divided into long-term averages; 2021–2039 (2020s), 2040–2069 (2050s), and 2070–2099 (2090s). Ptot is projected to increase from 947 (953) mm year−1 over the 2020s to 968 (980) mm year−1 over the 2050s, and 975 (1,008) mm year−1 over the 2090s period for RCP 4.5 (RCP 8.5). The rate of change in Ptot during those same periods is suggested to be 0.3 (0.5) mm year−1, 0.6 (0.6) mm year−1, 0.7 (3.1) mm year−1 under RCP 4.5 (RCP 8.5). Temperature has also increased throughout the 20th century. Mean Tmax will increase from 14.6°C (17.7°C) during 2020s to 15.5°C (16.3°C) during 2050s, and 16.1°C (18.5°C) during 2090s for RCP 4.5 (RCP 8.5) scenario. Similarly, mean Tmin will increase from 4.8°C (4.9°C) during 2020s to 5.7°C (6.5°C) during 2050s, and 6.2°C (8.4°C) during 2090s for RCP 4.5 (RCP 8.5).
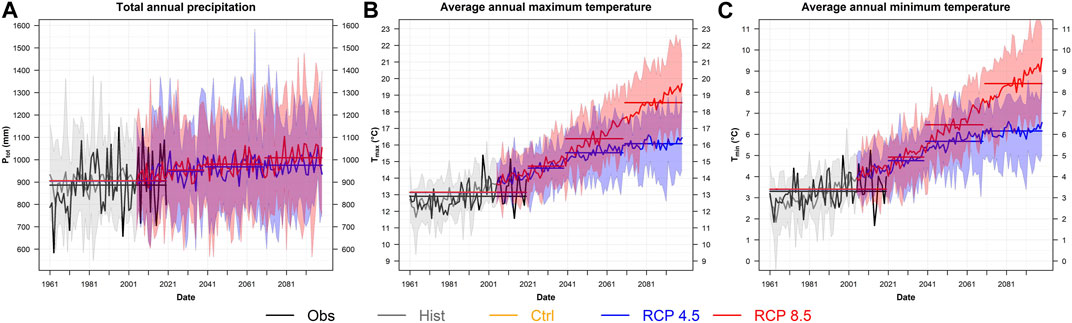
FIGURE 3. Annual average of daily McKenzie Creek watershed for (A) total annual precipitation (Ptot), (B) average annual maximum temperature (Tmax), (C) average annual minimum temperature (Tmin). Solid black lines are observed data, solid grey lines are historical data, the solid blue lines are averaged RCP 4.5 data, and solid red lines are averaged RCP 8.5 data. Multi-model range is represented by the shaded area, and horizontal lines are averages from 1961–2020 for observed, historical (1961–2005 historical + 2006–2020 RCP simulations), and control streamflow, and 2020s (2021–2039), 2050s (2040–2069), and 2090s (2079–2099) for RCP 4.5 and 8.5.
Seasonal climatic changes in the watershed were also assessed using monthly Ptot, Tmax and Tmin anomalies (relative to 1961–1990 average) (Figure 4). Between 1961 and 2020 climate was characterized by low observed Ptot in January, February, and March compared to the other months (Figure 4A). With respect to future Ptot, simulations indicate that winter and spring Ptot will increase throughout the 21st century while summer and fall Ptot will remain unchanged or decrease under RCP 4.5 warming scenario (Figure 4C). Similar trends were also projected under RCP 8.5 warming scenario, however with relatively higher Ptot values (Figure 4D). Tmax and Tmin are projected to increase under both RCP 4.5 and RCP 8.5, with late spring and summer months seeing the greatest increase in Tmax and winter months seeing the greatest increase in Tmin (Figures 4E-F and H-I).
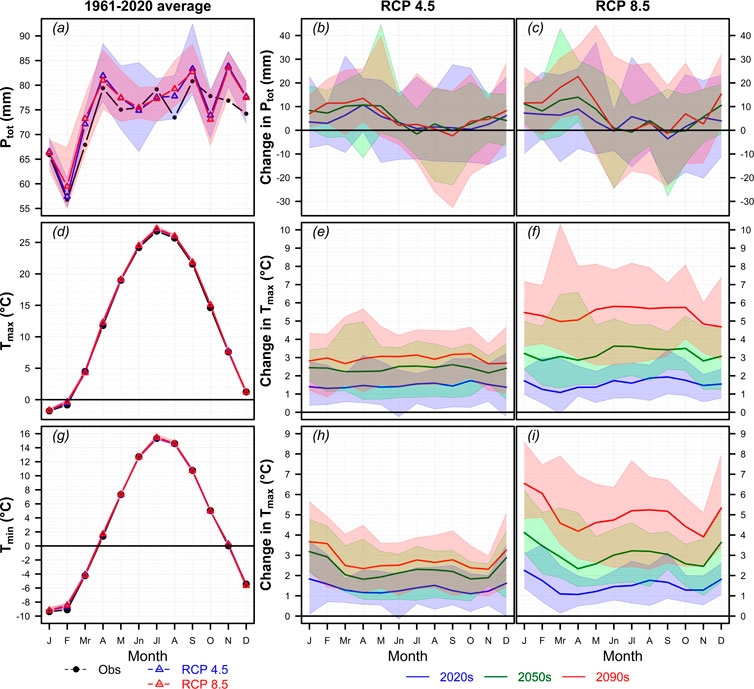
FIGURE 4. Changes in McKenzie Creek watershed’s climate; anomalies were calculated relative to a 1961–2020 average. (A) Total precipitation (Ptot) baseline average, (B, C) Ptot anomaly, (D) maximum temperature (Tmax) baseline average, (E, F) Tmax anomaly, (G) minimum temperature (Tmin) baseline average, and (H–I) Tmin anomaly. Dashed solid-dotted black lines are observed (Obs) values, and historical (Hist) values are dashed open-triangle blue (RCP 4.5) and red (RCP 8.5) lines between 1961–2020. Solid blue lines are future values for the 2020s (2021–2039), solid green lines are future values for the 2050s (2040–2069) and solid red lines are future values for the 2090s (2070–2099). Multi-model range is represented by the shaded area.
Study results showed that mean annual streamflow in the McKenzie Creek has increased over time (Figure 5). From 1961 to 2020, observed streamflow increased from 0.95 to 1.64 m3 s−1 (167.9–291.9 mm year−1) indicating a rate of increase of 0.01 m3 s−1 (2.1 mm year−1). Mean streamflow over this period was 1.82 m3 s−1 (323.6 mm year−1). Over the same period, simulated past streamflow (control run) increased from 1.5 to 2.5 m3 s−1 (259.4–436.2 mm year−1) indicating a rate of increase of 0.005 m3 s−1 (0.85 mm year−1). Mean control streamflow during this period was 2.2 m3 s−1 (390.2 mm year−1). Based on Mann-Kendall (MK) tests, all observed, control and historic streamflow values showed an upward trend between 1961 and 2020. Although these upward streamflow trends are not statistically significant at the annual timescale, they were statistically significant at daily timescales. This increasing trend in streamflow is projected to continue until the end of the 21st century for both RCP 4.5 and RCP 8.5 scenarios. However, this future projected increase will be steady over time with a Sen’s slope of 0.00083 m3 s−1 (0.14 mm year−1) for RCP 4.5 and 0.00072 m3 s−1 (0.13 mm year−1) for RCP 8.5. Study results further indicated that the rate of increase in mean annual streamflow will remain steady at 2.4 m3 s−1 during the 2020s, 2050s, and 2090s for both RCP 4.5 and 8.5, with exception of RCP 8.5 streamflow during 2050s which will be slightly higher than RCP 4.5 streamflow.
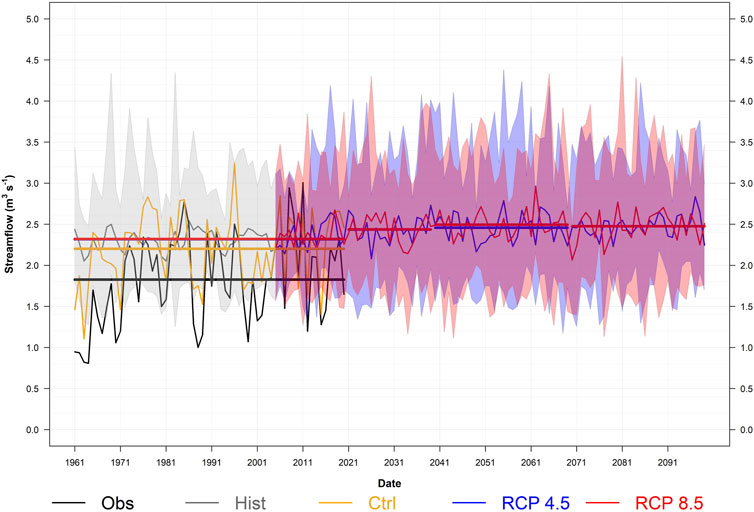
FIGURE 5. Annual average of McKenzie Creek streamflow. Solid black lines are observed data, solid grey lines are historical data, the solid yellow line is controlled data, solid blue lines are averaged RCP 4.5 data, and solid red lines are averaged RCP 8.5 data. Multi-model range is represented by the shaded area, and horizontal lines are averages from 1961–2020 for observed, historical (1961–2005 historical + 2006–2020 RCP simulations), and control streamflow, and 2020s (2021–2039), 2050s (2040–2069), and 2090s (2079–2099) for RCP 4.5 and 8.5.
Time series of mean monthly values of observed and control streamflow from 1961 to 2020 are shown in Figures 6A–E. Seasonal observed streamflow within the watershed is characterized by peaks in March with a slight decline in April, and low flows in June through September. Relative to the 1960s, observed decadal mean streamflow in all seasons experienced an increase. Mean peak flow in 1960s was 3.4 m3 s−1, which increased to 6.6 m3 s−1 in the 1970s and remain steady between 3.8 and 4.8 m3 s−1 in the following decades. In control runs, GSFLOW model was able to reproduce the overall seasonal dynamics of observed streamflow, but with some overestimation. Control streamflow was best reproduced during the 1970s, 1980s, and 2010s when compared to observed values.
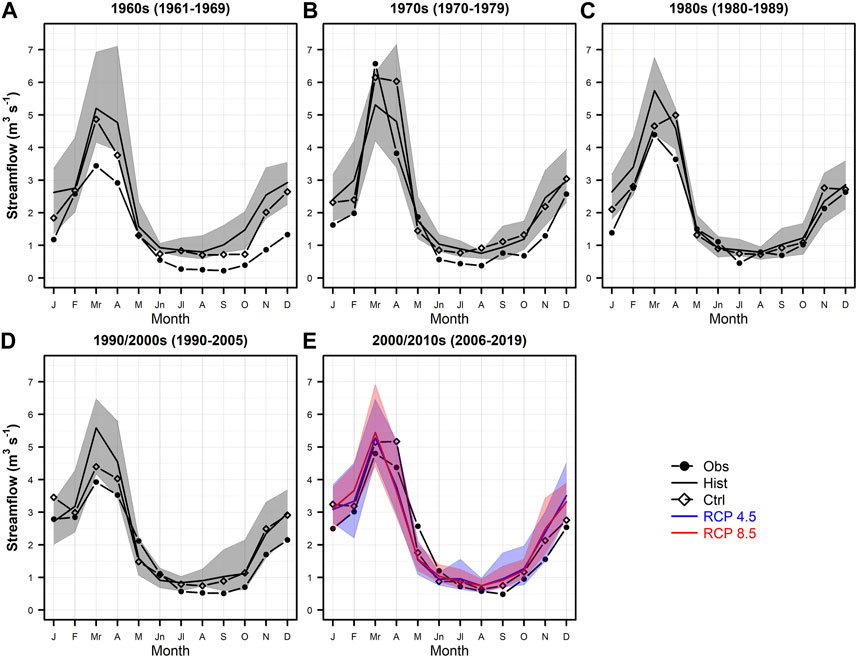
FIGURE 6. Monthly average of daily McKenzie Creek streamflow by decade for (A) 1960s (1961–1969), (B) 1970s (1970–1979), (C) 1980s (1980–1989), (D) 1990/2000s (1990–2005), and (E) 2000/2010s (2006–2019). Dashed solid-dotted black lines are observed (Obs) values, dashed open-dotted black lines are controlled (Ctrl) values, solid black lines are historical (Hist) values, and solid blue (RCP 4.5) and solid red (RCP 8.5) lines for simulated values. Multi-model range is represented by the shaded area.
Simulated monthly streamflow values for the future until the end of the 21st century are shown in Figure 7. Future streamflow simulations under both RCP 4.5 and RCP 8.5 scenarios suggest an increase in winter (December, January, February) streamflow as compared to historical streamflow from 1961–2020 (Figure 7A). However, while winter streamflow will continue to increase throughout the 21st century, its rate of increase will decline over time with the largest increase occurring between 2020s and 2050s. With respect to spring months, future mean streamflow will decrease by 8.7% (RCP 4.5) and 13.0% (RCP 8.5) by the end of the century (Table 3) as compared to observed/historical mean streamflow. April will experience the largest decrease with −13.3% (RCP 4.5) to −18.2% (RCP 8.5) decline. Furthermore, mean summer and autumn streamflow is projected to experience no change relative to the historical seasonal values. However, summer streamflow will increase over the three future time periods (i.e., 2020s, 2050s, and 2090s).
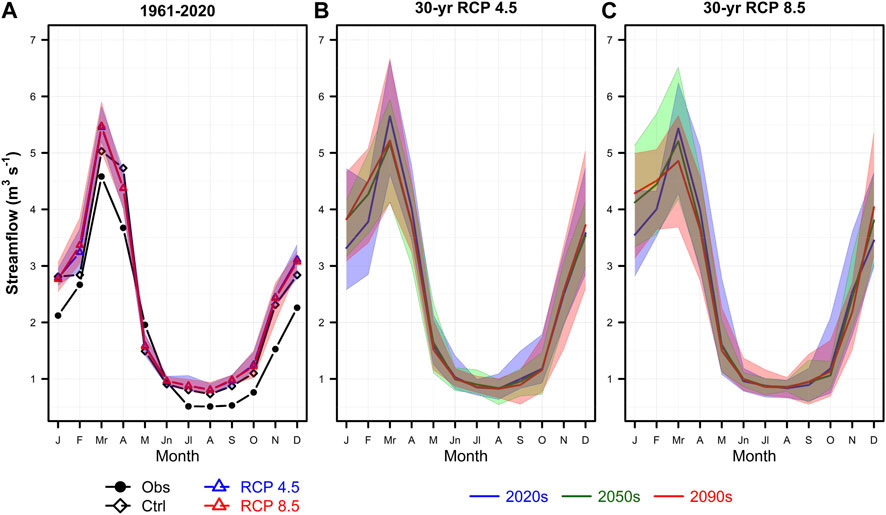
FIGURE 7. Long-term monthly average of daily streamflow. (A) Streamflow from 1961–2020, where dashed-dotted black lines are observed (Obs) values, dashed open-dotted black lines are control (Ctrl), and historical (Hist) values are dashed open-triangle blue (RCP 4.5) and red (RCP 8.5) lines between 1961–2020. And (B) RCP 4.5 and (C) 8.5 where solid blue lines are future values for the 2020s (2021–2039), solid green lines are future values for the 2050s (2049–2069) and solid red lines are future values for the 2090s (2070–2099). Multi-model range is represented by the shaded area.
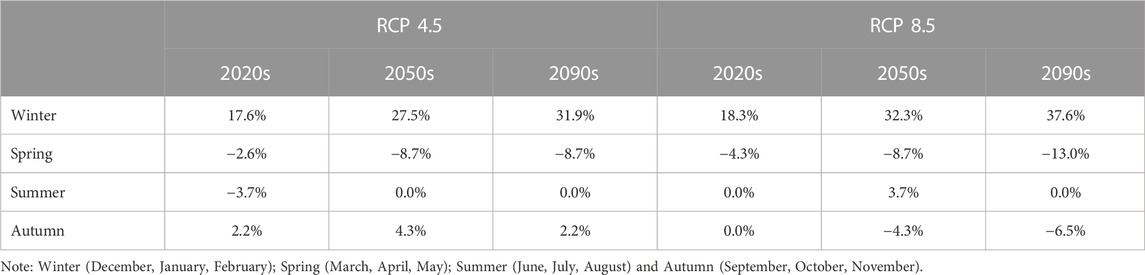
TABLE 3. Simulated average seasonal streamflow values for 2020s (2005–2039), 2050s (2040–2069), and 2090s (2070–2099) shown as percentage change relative to 1961–2020 baseline period for two greenhouse gas emission scenarios, IPCC RCP 4.5 and RCP 8.5.
In addition to streamflow, the model also simulated other hydrological processes such as evapotranspiration (ET) (Figures 8A–C) and the volume of water in the snowpack (Figures 8D–F). ET between 1961 and 2020 is characterized by high ET values from late spring to the end of summer, with peak ET values in May. Both RCP 4.5 and 8.5 showed an increase in mean ET in all seasons (except summer of 2090s under RCP 8.5) relative to mean ET values in 1961–2020. This increase is projected to be highest in the winter and smallest in the summer. For example, peak ET in May is projected to increase by 7.3% (4.6%), 10.8% (10%), and 10.7% (13.2%) during the 2020s, 2050s, and 2090s for RCP 4.5 (RCP 8.5) scenario.

FIGURE 8. (Top row) Monthly average of daily volumetric flow rate of evapotranspiration from pervious areas (ET) within the McKenzie Creek watershed. (A) Average historical ET, and future average ET under (B) RCP 4.5 and (C) 8.5. (Bottom row) Monthly average of daily volume of water in snowpack storage within the McKenzie Creek watershed. (D) Average historical snowpack volume, and future average snowpack volume under (E) RCP 4.5 and (F) 8.5. Dashed open-dotted black lines are controlled (Ctrl) values, and historical values are dashed open-triangle blue (RCP 4.5) and red (RCP 8.5) lines between 1961–2020. Solid blue lines are future values for the 2020s (2006–2039), solid green lines are future values for the 2050s (2049–2069) and solid red lines are future values for the 2090s (2070–2099). Multi-model range is represented by the shaded area.
Within the McKenzie Creek watershed snowpack accumulation has historically occurred between late October and early May with January, February, and March having the largest amount of snowpack (Figures 8D–F). During the 21st century the volume of water present in McKenzie Creek watershed as snowpack will decrease. Under RCP 4.5 scenario average winter snowpack will decrease by 28.8% (2020s), 50.6% (2050s), and 54.3% (2090s), relative to 1961–2020 winter averages, while March snowpack volume will decrease by 46%, 69.7%, and 73.8%. Under RCP 8.5 average winter snowpack volume will decrease by 39.3%, 61.8%, and 81.9%, relative to historical winter average, and March snowpack volume will decrease by 49.1%, 78.8%, and 92.9%.
Within the McKenzie Creek watershed the availability of water (Ptot—ET) is positive throughout the year, except for May when monthly ET is greater than monthly Ptot, resulting in a negative water balance (Figure 9). Future projections suggest that seasonal water availability will increase under both RCP 4.5 and RCP 8.5 scenarios except during fall, as well as spring 2090s under RCP 8.5. By the end of the century (2090s) mean winter water availability is projected to increase by 10.9% (RCP 4.5) and 7.7% (RCP 8.5), relative to 1961–2020 period. Average spring water availability will not change under RCP 4.5 but decrease by 18.7% under RCP 8.5, while initially increasing in 2020s and 2050s. Mean fall water availability will decrease consecutively by 2.4% (2.4%), 2.4% (2.4%), and 4.1% (9.5%) during the three future periods under RCP 4.5 (RCP 8.5). Summer water available will remain low throughout the 21st century with very little change projected. Comparison between the three future time periods suggests that summer water availability will not change under RCP 4.5 and only by 0.2–0.3 mm under RCP 8.5.
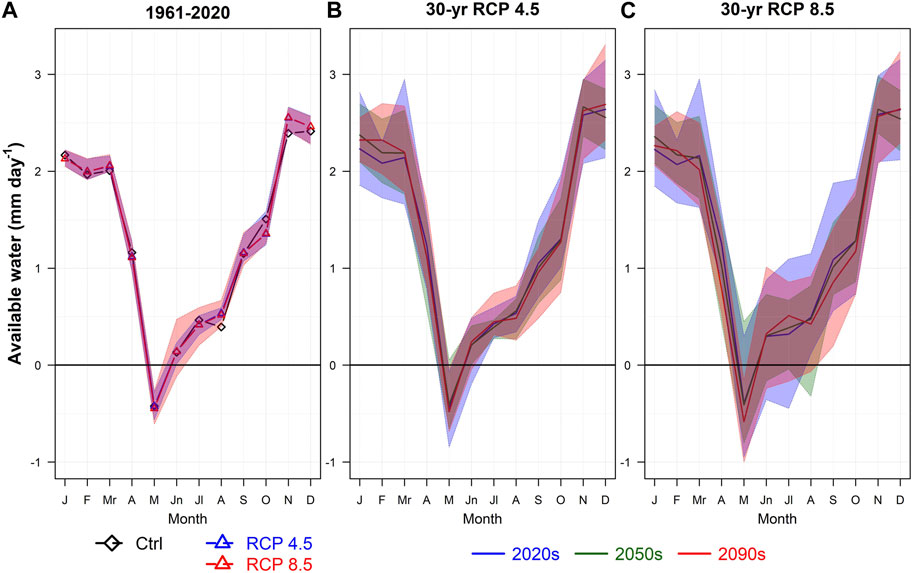
FIGURE 9. Monthly average of daily available water within McKenzie Creek watershed. (A) Average controlled and historical monthly average of available water, and future monthly average of available water under (B) RCP 4.5 and (C) 8.5. Dashed open-dotted black lines are controlled values, and historical values are dashed open-triangle blue (RCP 4.5) and red (RCP 8.5) lines between 1961–2020. Solid blue lines are future values for the 2020s (2006–2039), solid green lines are future values for the 2050s (2049–2069) and solid red lines are future values for the 2090s (2070–2099). Multi-model range is represented by the shaded area.
Our study results showed that the increase in observed mean annual streamflow in the McKenzie Creek is in line with other streamflow observations made in the region. A trend analysis of streamflow within the Great Lakes basin found that 71 U.S. Geological Survey (USGS) and 22 Environment and Climate Change Canada (ECCC) flow stations experienced an upward trend between 1960–2015 (Norton et al., 2019). Changes in observed seasonal patterns of Ptot (predominantly winter increase) are the likely cause of increasing winter streamflow within the McKenzie Creek (Figures 7A–C). These are consistent with reported long-term impacts of climate change on streams within the Grand River watershed. Such as Azarkhish et al. (2021) who found that the Nith River, another sub-watershed in the southern portion of the Grand River, experienced a significant increase in January streamflow and a significant decrease in March streamflow between 1973 and 2017. These changes in seasonal streamflow are likely associated with the warming of the atmosphere, causing earlier snowmelt and higher winter precipitation. However, large-scale climate variabilities modes, such as El Niño–Southern Oscillation (ENSO) and North Atlantic Oscillation (NAO), have also been found to influence streamflow in Canada (Fu et al., 2012; Nalley et al., 2019), and may be linked to inter-decadal changes in streamflow and precipitation in the region. For example, Shabbar et al. (1997) found that the first winter following El Nino event resulted in negative precipitation anomalies in the Great Lakes region. Also, Champagne et al. (2019) studied the effect of changes in atmospheric circulation on four watersheds in Southern Ontario and found that an increase in the frequency of high pressure systems in eastern North-America accounted for 40% of the increase in winter streamflow. The remaining change was likely associated to atmospheric warming. Other anthropogenic factors may have also influenced changes in streamflow in McKenzie Creek such as land cover change (Buttle, 2011), and water use and management practices throughout the 20th century.
With respect to future projections, both RCP 4.5 and RCP 8.5 scenarios suggest that streamflow will increase in winter, decrease in spring, and experience little to no change in summer and autumn. Projected seasonal precipitation will follow similar trends. Increase in winter streamflow will likely be due to the increase in winter precipitation, and warmer winter temperatures causing a decrease in water storage in snowpack in the watershed. Decreased water storage in snowpack storage is also likely the cause of projected peak streamflow decreases in March because of less winter-spring snowmelt. Future streamflow patterns in the McKenzie Creek are similar to other hydrological modelling studies in other watersheds in the region. For example, Li et al. (2016) found that the Grand River streamflow will likely increase during winter months and decrease in the summer under SRES A2 (high level warming scenario) and B2 (mid-level warming scenario). Under RCP 4.5 and RCP 8.5 scenarios Zhang et al. (2018) found that future streamflow in the Grand and Thames rivers will increase in winter and decrease in spring. Similarly, Champagne et al. (2020a) found that winter (January-February) streamflow in the Grand River will increase by about 30% between 2026 and 2050 under RCP 8.5.
Flooding has historically been the most common type of hydrometeorological hazard to occur in Canada, (Public Safety Canada, 2022), and has resulted in billions of dollars in damages and hundreds of deaths (Buttle et al., 2016). In the Great Lakes region, including Southern Ontario, flooding has been dominated predominantly by snowmelt, rain-on-snow followed by ice-jams, heavy spring rainfall and summer storms (Buttle et al., 2016). Burn and Whitfield (2016) found that between 1961 and 2010 the frequency and duration of flood events in Southwestern Ontario not only increased in frequency but also occurred earlier in the year. Cunderlik and Ouarda (2009) reported similar findings for snowmelt induced flooding events which occurred earlier in the region. Additionally, Rokaya et al. (2018) found that between 1903 and 2015 there was an earlier occurrence of ice-jams but an overall decrease in streamflow in the region. They also found that small unregulated basins were more sensitive to climate change, within the context of the timing of ice-jams.
Our study results provide vital information about the potential changes in future flooding events within the McKenzie Creek watershed. An earlier study of extreme climate events within the McKenzie Creek watershed projected that the annual frequency and intensity of extreme precipitation events will increase within the region (Deen et al., 2021). This, in combination with increased winter precipitation within the watershed, may cause earlier winter flooding in the McKenzie Creek. Due to the meandering nature of the McKenzie Creek as it passes through the eastern portion of the watershed, earlier winter flooding may increase the vulnerability of the Six Nations community. While flooding may occur earlier within the McKenzie Creek watershed, the intensity of March flooding will likely not increase as the volumetric water content of winter snowpack will decrease throughout the 21st century resulting in lower overall winter-spring snowmelt. This change is in line with similar findings, across Canada the timing of seasonal peak flow has changed with spring peak flow occurring earlier as a result of earlier snowmelt. Bonsal et al. (2019) suggest that these changes may result in earlier and more intense flooding events. Within Ontario it is projected that climate change will increase the frequency of flooding events, with historical 100-year events occurring more frequently (Gaur et al., 2018).
Our modelling study also provides insight into the occurrence of future dry conditions or droughts in the McKenzie Creek watershed. Drought conditions during the 20th century in Southern Ontario have been characterized by above normal annual temperatures and below normal precipitation (Klaassen, 2002). Within the McKenzie Creek watershed climate projections indicate that annual temperature will increase above annual normal levels, and seasonal precipitation will be below previous normal conditions (Figures 3B-C and 4B-C).
Given that our projections indicate low spring and summer streamflow along with increases in temperature, decrease in precipitation, and less soil moisture recharge from snowmelt, drought or water stress may become more prevalent during late spring and summer months in the watershed. Specifically, our water availability estimates show that late spring and summer experiences low water availability and May experiences negative water availability. Future increases in ET and seasonal temperature suggests greater evaporative water loss and potentially more water stress within the watershed. Similar trends have been projected for the wider Grand River watershed by Li et al. (2016). This may affect agricultural and ecosystem productivity of the McKenzie Creek watershed. However, drought or water stress impacts may be alleviated by an increase in groundwater recharge due to higher infiltration in winter months because of warmer temperatures and less freezing of soil as suggested by Jyrkama and Sykes (2007). This aspect should be the subject of future water security studies in a changing climate.
In this study the Coupled Groundwater and Surface-Water Flow Model (GSFLOW), an integrated surface runoff and groundwater hydrological model, was used to simulate historical (1951–2020) and future (2021–2100) streamflow under IPCC RCP4.5 and RCP 8.5 warming scenarios for the McKenzie Creek. The McKenzie Creek is a tributary of the Grand River watershed which provides water resources for the Six Nations of the Grand River reserve—the largest Indigenous community in Canada and the fourth largest in North America by population. Study results show that annual average observed, control (i.e., GSFLOW simulations using observed data), and historical (GSFLOW simulations using GCM downscaled data over the past observation period) streamflow have experienced an upward trend between 1961 and 2020. Similar increasing trends in future streamflow have also been simulated by the model under both RCP 4.5 and RCP 8.5 warming scenarios. With respect to changes in seasonal dynamics of streamflow, we found that in the future monthly streamflow will increase the most during winter months (January, February, and December) with a 31.9% (RCP 4.5) and 37.6% (RCP 8.5) change by 2090s. These seasonal changes are due to increasing winter temperatures and precipitation in the Great Lakes region. Average spring streamflow will decrease by 8.7% (RCP 4.5) and 13.0% (RCP 8.5) by 2090s. Summer and autumn streamflow will experience little change during the 21st century.
Our study results suggest the following impacts of climate change on the McKenzie Creek watershed as well as the communities living in this area of the Great Lakes due to climate change: 1) There will be potentially earlier winter flooding events in future due to increasing winter temperature and precipitation, 2) the intensity of flooding during peak streamflow in March will be less likely due to smaller winter snowpack, and 3) there will be a potential increase in summer dry periods or drought events due to increasing summer temperatures causing higher evaporative water loss and a decreasing trend in precipitation and streamflow. Overall, water availability in the watershed will continue to remain low in spring and summer periods causing water stress for the communities relying on this watershed. This would be despite the fact that overall, on an annual basis the watershed is expected to experience higher precipitation and higher annual streamflow in the future. The finding of this study can be used by Six Nation’s environmental planners, and the community to better prepare for future impacts of climate change. Water resources managers should consider the effects of winter or early spring flooding and summer droughts on the water quantity and quality for the community. Apart from Six Nations, these finds would also be useful and guide other water resources managers, planners and communities in the Southern Ontario and eastern Great Lakes region and explore ways to adapt to water stress and water insecurity as climate change continues to intensify.
The raw data supporting the conclusion of this article will be made available by the authors, without undue reservation.
TD wrote the original draft, and performed formal analysis and visualization of the data. The study design and methodology was developed by TD, OC, and MA. All authors including PC-F and DM-H provided insight and comments. MA, PC-F, and DM-H provided funding. All authors contributed to the article and approved the submitted version.
Funding for this study was provided by the Global Water Futures (GWF) Program under “Co-Creation of Indigenous Water Quality Tools” and “Southern Forests Water Futures” project and Natural Sciences and Engineering Research Council of Canada. In kind support from FloodNet, Natural Resources Canada, and Ontario Ministry of the Environment, Conservation and Parks and United Nations University (UNU)—Institute for Water Environment and Health (Nidhi Nagabhatla, now at UNU-CRIS) is also acknowledged. Data sources used in this study are also acknowledged.
We are grateful for the support and encouragement by the leadership and community members of the Six Nations of Grand River for this study.
The authors declare that the research was conducted in the absence of any commercial or financial relationships that could be construed as a potential conflict of interest.
All claims expressed in this article are solely those of the authors and do not necessarily represent those of their affiliated organizations, or those of the publisher, the editors and the reviewers. Any product that may be evaluated in this article, or claim that may be made by its manufacturer, is not guaranteed or endorsed by the publisher.
The Supplementary Material for this article can be found online at: https://www.frontiersin.org/articles/10.3389/fenvs.2023.1171210/full#supplementary-material
Agriculture and Agri-Food Canada, (2021). Canadian drought monitor. https://open.canada.ca/data/en/dataset/292646cd-619f-4200-afb1-8b2c52f984a2.
Ahmed, S., Tsanis, I., and Abo Elamaim, A. A. (2016). Forensic analysis of suicidal ideation among medical students of Egypt: A crosssectional study. Water Resour. 4, 1–4. doi:10.1016/j.jflm.2016.08.009
Azarkhish, A., Rudra, R., Daggupati, P., Dhiman, J., Dickinson, T., and Goel, P. (2021). Investigation of long-term climate and streamflow patterns in Ontario. Am. J. Clim. Change 10 (4), 467–489. doi:10.4236/ajcc.2021.104024
Barrow, E. M., and Sauchyn, D. J. (2019). Uncertainty in climate projections and time of emergence of climate signals in the Western Canadian Prairies. Int. J. Climatol. 39 (11), 4358–4371. doi:10.1002/joc.6079
Beck, H. E., Zimmermann, N. E., McVicar, T. R., Vergopolan, N., Berg, A., and Wood, E. F. (2018). Present and future Köppen-Geiger climate classification maps at 1-km resolution. Sci. data 5 (1), 180214. doi:10.1038/sdata.2018.214
Bonsal, B. R., Peters, D. L., Seglenieks, F., Rivera, A., and Berg, A. (2019). “Changes in freshwater availability across Canada; Chapter 6,” in C.’s. Changing Climate Report. Editors E. Bush, and D. S. Lemmen (Ottawa, Ontario: Government of Canada), 261–342.
Brekke, L., Thrasher, L. B., Maurer, E. P., and Pruitt, T. (2013). Downscaled CMIP3 and CMIP5 climate projections: Release of downscaled CMIP5 climate projections, comparison with preceding information, and summary of user needs. Washington, DC, USA: United States Bureau of Reclamation.
Burn, D. H., and Whitfield, P. H. (2016). Changes in floods and flood regimes in Canada. Can. Water Resour. Journal/Revue Can. Des. ressources hydriques 41 (1-2), 139–150. doi:10.1080/07011784.2015.1026844
E. Bush, and D. S. Lemmen (Editors) (2019). Canada’s changing climate report (Canada: Government of Canada).
Buttle, J. M. (2018). Mediating stream baseflow response to climate change: The role of basin storage. Hydrol. Process. 32 (3), 363–378. doi:10.1002/hyp.11418
Buttle, J. M. (2011). Streamflow response to headwater reforestation in the Ganaraska River basin, southern Ontario, Canada. Hydrol. Process. 25 (19), 3030–3041. doi:10.1002/hyp.8061
Buttle, J. M., Allen, D. M., Caissie, D., Davison, B., Hayashi, M., and Peters, D. L. (2016). Flood processes in Canada: Regional and special aspects. Can. Water Resour. Journal/Revue Can. Des. ressources hydriques 41 (1-2), 7–30. doi:10.1080/07011784.2015.1131629
Champagne, O., Arain, M. A., and Coulibaly, P. (2019). Atmospheric circulation amplifies shift of winter streamflow in Southern Ontario. J. Hydrology 578, 124051. doi:10.1016/j.jhydrol.2019.124051
Champagne, O., Arain, M. A., Leduc, M., Coulibaly, P., and McKenzie, S. (2020a). Future shift in winter streamflow modulated by the internal variability of climate in southern Ontario. Hydrology Earth Syst. Sci. 24 (6), 3077–3096. doi:10.5194/hess-24-3077-2020
Champagne, O., Leduc, M., Coulibaly, P., and Arain, M. A. (2020b). Winter hydrometeorological extreme events modulated by large-scale atmospheric circulation in southern Ontario. Earth Syst. Dyn. 11 (1), 301–318. doi:10.5194/esd-11-301-2020
Chattopadhyay, P. (2018). Why so few people on Six Nations reserve have clean running water, unlike their neighbours. Available at: https://www.cbc.ca/radio/outintheopen/neighbours-1.4618733/why-so-few-people-on-six-nations-reserve-have-clean-running-water-unlike-their-neighbours-1.4618968.
Cherkauer, K. A., and Sinha, T. (2010). Hydrologic impacts of projected future climate change in the Lake Michigan region. J. Gt. Lakes. Res. 36, 33–50. doi:10.1016/j.jglr.2009.11.012
Costa, D., Zhang, H., and Levison, J. (2021). Impacts of climate change on groundwater in the great Lakes basin: A review. J. Gt. Lakes. Res. 47 (6), 1613–1625. doi:10.1016/j.jglr.2021.10.011
Crossman, J., Futter, M. N., Oni, S. K., Whitehead, P. G., Jin, L., and Butterfield, D. (2013). Impacts of climate change on hydrology and water quality: Future proofing management strategies in the Lake Simcoe watershed, Canada. J. Gt. Lakes. Res. 39 (1), 19–32. doi:10.1016/j.jglr.2012.11.003
Cunderlik, J. M., and Ouarda, T. B. (2009). Trends in the timing and magnitude of floods in Canada. J. hydrology 375 (3-4), 471–480. doi:10.1016/j.jhydrol.2009.06.050
Deen, T. A., Arain, M. A., Champagne, O., Chow-Fraser, P., Nagabhatla, N., and Martin-Hill, D. (2021). Evaluation of observed and projected extreme climate trends for decision making in Six Nations of the Grand River, Canada. Clim. Serv. 24, 100263. doi:10.1016/j.cliser.2021.100263
Deng, Z., Qiu, X., Liu, J., Madras, N., Wang, X., and Zhu, H. (2016). Trend in frequency of extreme precipitation events over Ontario from ensembles of multiple GCMs. Clim. Dyn. 46 (9-10), 2909–2921. doi:10.1007/s00382-015-2740-9
d'Orgeville, M., Peltier, W. R., Erler, A. R., and Gula, J. (2014). Climate change impacts on Great Lakes Basin precipitation extremes. Journal of Geophysical Research. Atmospheres 119 (18), 10–799. doi:10.1002/2014JD021855
Douville, H., Raghavan, K., Renwick, J., Allan, R. P., Arias, P. A., Barlow, R., et al. (2021). “Water cycle changes. In climate change 2021: The physical science basis,” in . Contribution of working group I to the sixth assessment report of the intergovernmental Panel on climate change. Editors V. Masson-Delmotte, P. Zhai, A. Pirani, S. L. Connors, C. Péan, and S. Berger (Cambridge, UK: Cambridge University Press).
Dudley, R. W., Hodgkins, G. A., McHale, M. R., Kolian, M. J., and Renard, B. (2017). Trends in snowmelt-related streamflow timing in the conterminous United States. J. Hydrology 547, 208–221. doi:10.1016/j.jhydrol.2017.01.051
Duffield, G. M. (2019). Representative values of hydraulic properties. HydroSOLVE, inc. Available at: http://www.aqtesolv.com/aquifer-tests/aquifer_properties.htm.
Duignan, S., Moffat, T., and Martin-Hill, D. (2022). Be like the running water: Assessing gendered and age-based water insecurity experiences with Six Nations First Nation. Soc. Sci. Med. 298, 114864. doi:10.1016/j.socscimed.2022.114864
Duignan, S., Moffat, T., and Martin-Hill, D. (2020). Using boundary objects to Co-create community health and water knowledge with community-based medical anthropology and indigenous knowledge. Engaged scholar journal: Community-engaged research. Teach. Learn. 6 (1), 49–76. doi:10.15402/esj.v6i1.68178
Earthfx (2018). Whitemans Creek tier three local area water budget and risk assessment. Available at: https://www.sourcewater.ca/en/source-protection-areas/resources/Documents/Grand/Whitemans-Tier-3–-Final-Risk-Assessment-Report–-Final-low-res.pdf.
EPA [Environmental Protection Agency] (2023). Facts and figures about the great lakes. Available at: https://www.epa.gov/greatlakes/facts-and-figures-about-great-lakes.
EPA [Environmental Protection Agency] (2016). Great lakes water levels and temperatures. Available at: https://www.epa.gov/sites/default/files/2016-08/documents/print_great-lakes-2016.pdf.
Erler, A. R., Frey, S. K., Khader, O., d'Orgeville, M., Park, Y., Hwang, H., et al. (2019). Simulating climate change impacts on surface water resources within a lake-affected region using regional climate projections. Water Resour. Res. 55 (1), 130–155. doi:10.1029/2018wr024381
Feng, D., Zheng, Y., Mao, Y., Zhang, A., Wu, B., Li, J., et al. (2018). An integrated hydrological modeling approach for detection and attribution of climatic and human impacts on coastal water resources. J. Hydrology 557, 305–320. doi:10.1016/j.jhydrol.2017.12.041
Fu, C., James, A. L., and Wachowiak, M. P. (2012). Analyzing the combined influence of solar activity and El Niño on streamflow across southern Canada. Water Resources Research 48 (5). doi:10.1029/2011WR011507
Gao, C., Shirota, J., Kelly, R. I., Brunton, F. R., and Van Haaften, S. (2006). Bedrock topography and overburden thickness mapping southern Ontario. Available at: http://www.geologyontario.mndm.gov.on.ca/mndmaccess/mndm_dir.asp?type=pub&id=MRD207.
Gardner, M. A., Morton, C. G., Huntington, J. L., Niswonger, R. G., and Henson, W. R. (2018). Input data processing tools for the integrated hydrologic model GSFLOW. Environ. Model. Softw. 109, 41–53. doi:10.1016/j.envsoft.2018.07.020
Gaur, A., Gaur, A., and Simonovic, S. P. (2018). Future changes in flood hazards across Canada under a changing climate. Water 10 (10), 1441. doi:10.3390/w10101441
Grillakis, M. G., Koutroulis, A. G., and Tsanis, I. K. (2011). Climate change impact on the hydrology of spencer Creek watershed in southern Ontario, Canada. J. Hydrology 409 (1-2), 1–19. doi:10.1016/j.jhydrol.2011.06.018
Gulev, S. K., Thorne, P. W., Ahn, J., Dentener, F. J., Domingues, C. M., Gerland, S., et al. (2021). “Changing state of the climate system. In climate change 2021: The physical science basis.”in Contribution of working group I to the sixth assessment report of the intergovernmental Panel on climate change P. Zhai, A. Pirani, S. L. Connors, C. Péan, and S. Berger (Cambridge, UK: Cambridge University Press).
GWF [Global Water Future] (2022). Co-creation of indigenous water quality tools. Available at: https://gwf.usask.ca/projects-facilities/all-projects/p3-co-create-indg.php.
Hanief, A., and Laursen, A. E. (2017). SWAT modeling of hydrology, sediment and nutrients from the Grand River, Ontario. Water Qual. Res. J. 52 (4), 243–257. doi:10.2166/wqrj.2017.014
Hopkinson, R. F., McKenney, D. W., Milewska, E. J., Hutchinson, M. F., Papadopol, P., and Vincent, L. A. (2011). Impact of aligning climatological day on gridding daily maximum–minimum temperature and precipitation over Canada. J. Appl. Meteorology Climatol. 50 (8), 1654–1665. doi:10.1175/2011jamc2684.1
Hunt, R. J., Walker, J. F., Selbig, W. R., Westenbroek, S. M., and Regan, R. S. (2013). Simulation of climate-change effects on streamflow, lake water budgets, and stream temperature using GSFLOW and SNTEMP, Trout Lake Watershed, Wisconsin.
Hunt, R. J., Westenbroek, S. M., Walker, J. F., Selbig, W. R., Regan, R. S., Leaf, A. T., et al. (2016). Simulation of climate change effects on streamflow, groundwater, and stream temperature using GSFLOW and SNTEMP in the black earth Creek watershed, Wisconsin: U.S. Geological survey scientific investigations report. Available at: https://pubs.usgs.gov/sir/2016/5091/sir20165091.pdf.
Indigenous Services Canada (2020). Annual report to parliament. Available at: https://www.sac-isc.gc.ca/eng/1602010609492/1602010631711#chp1.
IPCC [Intergovernmental Panel on Climate Change]. (2013). Annex I: Atlas of global and regional climate projections, M. Collins, J. H. Christensen, J. Marotzke, S. B. Poweret al. (eds.) In: Climate Change 2013: The Physical Science Basis. Contribution of working group I to the fifth assessment report of the intergovernmental Panel on climate change [stocker (Cambridge, UK: Cambridge University Press).
IPCC [Intergovernmental Panel on Climate Change] (2022). Summary for policymakers. In: Climate change 2022: Impacts, Adaptation, and Vulnerability. Contribution of Working Group II to the Sixth Assessment Report the Intergovernmental Panel on Climate Change. [Pörtner H.-O., D.C. Roberts, M. Tignor, E.S. Poloczanska, K. Mintenbeck, A. Alegríaet al. (eds.)]. Cambridge: University Press.
Jyrkama, M. I., and Sykes, J. F. (2007). The impact of climate change on spatially varying groundwater recharge in the grand river watershed (Ontario). J. Hydrology 338 (3-4), 237–250. doi:10.1016/j.jhydrol.2007.02.036
Kaur, B., Shrestha, N. K., Daggupati, P., Rudra, R. P., Goel, P. K., Shukla, R., et al. (2019). Water security assessment of the grand river watershed in Southwestern Ontario, Canada. Sustainability 11 (7), 1883. doi:10.3390/su11071883
Klaassen, J. (2000). “A climatological assessment of major 20th century drought in southern Ontario, Canada,” in Proceedings of the 13th conference on applied climatology and the 10th conference on aviation, range, and aerospace meteorology, Portland, OR, USA, September 2000.
Kompanizare, M., Petrone, R. M., Shafii, M., Robinson, D. T., and Rooney, R. C. (2018). Effect of climate change and mining on hydrological connectivity of surficial layers in the Athabasca Oil Sands Region. Hydrol. Process. 32 (25), 3698–3716. doi:10.1002/hyp.13292
Larocque, M., Levison, J., Martin, A., and Chaumont, D. (2019). A review of simulated climate change impacts on groundwater resources in Eastern Canada. Can. Water Resour. Journal/Revue Can. Des. ressources hydriques 44 (1), 22–41. doi:10.1080/07011784.2018.1503066
Li, Z., Huang, G., Wang, X., Han, J., and Fan, Y. (2016). Impacts of future climate change on river discharge based on hydrological inference: A case study of the Grand River watershed in Ontario, Canada. Sci. Total Environ. 548, 198–210. doi:10.1016/j.scitotenv.2016.01.002
Liu, Y., Yang, W., Leon, L., Wong, I., McCrimmon, C., Dove, A., et al. (2016). Hydrologic modeling and evaluation of best management practice scenarios for the Grand River watershed in southern Ontario. J. Gt. Lakes. Res. 42 (6), 1289–1301. doi:10.1016/j.jglr.2016.02.008
Livingston, T., McBean, E., Marchildon, M., and Gharabaghi, B. (2021). Hydrologic impacts of climate change in relation to Ontario’s source water protection planning program. Can. J. Civ. Eng. 48 (8), 1037–1045. doi:10.1139/cjce-2019-0649
MacVeigh, B., Zammit, T., and Ivey, J. (2016). McKenzie Creek subwatershed characterization study. Cambridge, UK: Grand River Conservation Authority.
Mai, J., Craig, J. R., Tolson, B. A., and Arsenault, R. (2022). The sensitivity of simulated streamflow to individual hydrologic processes across North America. Nat. Commun. 13 (1), 455. doi:10.1038/s41467-022-28010-7
Makhdom, S. (2021). “Assessing potability of drinking-water sources and quality of surface water on the reserve of the Six Nations of the Grand River, Ontario (Canada),” (Hamilton, ON, Canada: MacSphere: McMaster University] McMaster University Libraries Institutional Repository). Master’s thesis.
Markstrom, S. L., Niswonger, R. G., Regan, R. S., Prudic, D. E., and Barlow, P. M. (2008). GSFLOW—Coupled ground-water and surface-water flow model based on the integration of the precipitation-runoff modeling system (PRMS) and the modular ground-water flow model (MODFLOW-2005). U.S. Geological Survey Techniques and Methods 240, 6–11. doi:10.3133/tm6D1
Martin-Hill, D., Gibson, C. M., de Lannoy, C. F., Gendron, D., Chen, K., McQueen, D., et al. (2022). “Striving toward reconciliation through the co-creation of water research,” in Current directions in water scarcity research. Editor M. Sioui (Amsterdam, Netherlands: Elsevier), 4, 13–40.
Matott, L. S. (2017). OSTRICH: An optimization software tool, documentation and user's guide. Buffalo, NY, USA: University at Buffalo Center for Computational Research.
McDermid, J., Fera, S., and Hogg, A. (2015a). Climate change projections for Ontario: An updated synthesis for policymakers and planners. Ontario Ministry of natural resources and forestry. Peterborough, Ontario: Science and research branch.
McDermid, J. L., Dickin, S. K., Winsborough, C. L., Switzman, H., Barr, S., Gleeson, J. A., et al. (2015b). “State of climate change science in the great Lakes basin: A focus on climatological, hydrological and ecological effects,” in Prep. jointly by Ont. Clim. Consortium Ont. Ministry Nat. Resour. For. advise Annex (Vaughan, Canada: Toronto and Region Conservation Authority).
McKenney, D. W., Hutchinson, M. F., Papadopol, P., Lawrence, K., Pedlar, J., Campbell, K., et al. (2011). Customized spatial climate models for North America. Bull. Am. Meteorological Soc. 92 (12), 1611–1622. doi:10.1175/2011bams3132.1
Public Safety Canada, (2016). Canadian Disaster Database. Available at: https://cdd.publicsafety.gc.ca/.
Morand, A., Douglas, A., and Richard, J. (2015). A survey of climate information needs among users in Ontario, Canada. Prepared by the Ontario centre for climate impacts and adaptation resources (OCCIAR) for environment Canada, 36pp. Available at: https://climateontario.ca/doc/Survey/ClimateInformationNeedsSurveyResults-OCCIAR.pdf.
Moriasi, D. N., Arnold, J. G., Van Liew, M. W., Bingner, R. L., Harmel, R. D., and Veith, T. L. (2007). Model evaluation guidelines for systematic quantification of accuracy in watershed simulations. Trans. ASABE 50 (3), 885–900. doi:10.13031/2013.23153
Moriasi, D. N., Gitau, M. W., Pai, N., and Daggupati, P. (2015). Hydrologic and water quality models: Performance measures and evaluation criteria. Trans. ASABE 58 (6), 1763–1785. doi:10.13031/trans.58.10715
Nalley, D., Adamowski, J., Biswas, A., Gharabaghi, B., and Hu, W. (2019). A multiscale and multivariate analysis of precipitation and streamflow variability in relation to ENSO, NAO and PDO. J. Hydrology 574, 288–307. doi:10.1016/j.jhydrol.2019.04.024
Navarro-Racines, C., Tarapues, J., Thornton, P., Jarvis, A., and Ramirez-Villegas, J. (2020). High-resolution and bias-corrected CMIP5 projections for climate change impact assessments. Sci. data 7 (1), 7–14. doi:10.1038/s41597-019-0343-8
Norris, T., Vines, P. L., and Hoeffel, E. M. (2012). The American Indian and Alaska native population: 2010. U.S. Census bureau. Available at: https://www.census.gov/library/publications/20.
Norton, P. A., Driscoll, D. G., and Carter, J. M. (2019). Climate, Streamflow, and Lake-Level Trends in the Great Lakes Basin of the United States and Canada, Water Years 1960–201. Sci. Investigations Rep. 5003, 47. doi:10.3133/sir20195003
Ontario [Government of Ontario] (2021). Map: Well records. Available at: https://www.ontario.ca/page/map-well-records.
Persaud, E., Levison, J., MacRitchie, S., Berg, S. J., Erler, A. R., Parker, B., et al. (2020). Integrated modelling to assess climate change impacts on groundwater and surface water in the Great Lakes Basin using diverse climate forcing. J. Hydrology 584, 124682. doi:10.1016/j.jhydrol.2020.124682
Philip, E., Rudra, R. P., Goel, P. K., and Ahmed, S. I. (2022). Investigation of the long-term trends in the streamflow due to climate change and urbanization for a Great Lakes watershed. Atmosphere 13 (2), 225. doi:10.3390/atmos13020225
Public Safety Canada, (2022). The Canadian disaster database. Available at: https://www.publicsafety.gc.ca/cnt/rsrcs/cndn-dsstr-dtbs/index-en.aspx.
Rahman, M., Bolisetti, T., and Balachandar, R. (2012). Hydrologic modelling to assess the climate change impacts in a Southern Ontario watershed. Can. J. Civ. Eng. 39 (1), 91–103. doi:10.1139/l11-112
Razavi, T., Switzman, H., Arain, A., and Coulibaly, P. (2016). Regional climate change trends and uncertainty analysis using extreme indices: A case study of Hamilton, Canada. Clim. Risk Manag. 13, 43–63. doi:10.1016/j.crm.2016.06.002
Rokaya, P., Budhathoki, S., and Lindenschmidt, K. E. (2018). Trends in the timing and magnitude of ice-jam floods in Canada. Sci. Rep. 8 (1), 5834–5839. doi:10.1038/s41598-018-24057-z
Schwalm, C. R., Glendon, S., and Duffy, P. B. (2020). RCP8. 5 tracks cumulative CO2 emissions. Proc. Natl. Acad. Sci. 117 (33), 19656–19657. doi:10.1073/pnas.2007117117
Shabbar, A., Bonsal, B., and Khandekar, M. (1997). Canadian precipitation patterns associated with the Southern Oscillation. J. Clim. 10 (12), 3016–3027. doi:10.1175/1520-0442(1997)010<3016:cppawt>2.0.co.2
Soonthornrangsan, J. T., and Lowry, C. S. (2021). Vulnerability of water resources under a changing climate and human activity in the lower Great Lakes region. Hydrol. Process. 35 (12), e14440. doi:10.1002/hyp.14440
Sultana, A., Wilson, J., Martin-Hill, D., Davis-Hill, L., and Homer, J. (2022). Assessing the impact of water insecurity on maternal mental health at Six Nations of the Grand River. Frontiers in water, 33.U.S. Census bureau. (2012). The American Indian and Alaska native population: 2010. Available at: https://www.census.gov/library/publications/20.
Tian, Y., Zheng, Y., Wu, B., Wu, X., Liu, J., and Zheng, C. (2015). Modeling surface water-groundwater interaction in arid and semi-arid regions with intensive agriculture. Environ. Model. Softw. 63, 170–184. doi:10.1016/j.envsoft.2014.10.011
Van Vuuren, D. P., Edmonds, J., Kainuma, M., Riahi, K., Thomson, A., Hibbard, K., et al. (2011). The representative concentration pathways: An overview. Clim. change 109, 5–31. doi:10.1007/s10584-011-0148-z
Wang, F., Huang, G. H., Cheng, G. H., and Li, Y. P. (2021). Impacts of climate variations on non-stationarity of streamflow over Canada. Environ. Res. 197, 111118. doi:10.1016/j.envres.2021.111118
Wazneh, H., Arain, M. A., and Coulibaly, P. (2017). Historical spatial and temporal climate trends in southern Ontario, Canada. J. Appl. Meteorology Climatol. 56 (10), 2767–2787. doi:10.1175/jamc-d-16-0290.1
Wong, A. (2011). Water use inventory report for the Grand River watershed. Cambridge, ON, Canada: Grand River Conservation authority.
Wuebbles, D., Cardinale, B., Cherkauer, K., Davidson-Arnott, R., Hellmann, J., Infante, D., et al. (2019). An assessment of the impacts of climate change on the great lakes. Environmental law & policy center, 760. Available at: https://elpc.org/wp-content/uploads/20.
Yin, J., Gentine, P., Slater, L., Gu, L., Pokhrel, Y., Hanasaki, N., et al. (2023). Future socio-ecosystem productivity threatened by compound drought–heatwave events. Nat. Sustain. 6, 259–272. doi:10.1038/s41893-022-01024-1
Zhang, B., Shrestha, N. K., Daggupati, P., Rudra, R., Shukla, R., Kaur, B., et al. (2018). Quantifying the impacts of climate change on streamflow dynamics of two major rivers of the Northern Lake Erie Basin in Canada. Sustainability 10 (8), 2897. doi:10.3390/su10082897
Keywords: climate change, climate change impacts, hydrology, streamflow, GSFLOW integrated hydrologic model, Six Nations of the Grand River, Indigenous
Citation: Deen TA, Arain MA, Champagne O, Chow-Fraser P and Martin-Hill D (2023) Impacts of climate change on streamflow in the McKenzie Creek watershed in the Great Lakes region. Front. Environ. Sci. 11:1171210. doi: 10.3389/fenvs.2023.1171210
Received: 21 February 2023; Accepted: 15 May 2023;
Published: 30 May 2023.
Edited by:
Buddhi Wijesiri, Queensland University of Technology, AustraliaReviewed by:
Hongxing Zheng, Commonwealth Scientific and Industrial Research Organisation (CSIRO), AustraliaCopyright © 2023 Deen, Arain, Champagne, Chow-Fraser and Martin-Hill. This is an open-access article distributed under the terms of the Creative Commons Attribution License (CC BY). The use, distribution or reproduction in other forums is permitted, provided the original author(s) and the copyright owner(s) are credited and that the original publication in this journal is cited, in accordance with accepted academic practice. No use, distribution or reproduction is permitted which does not comply with these terms.
*Correspondence: M. Altaf Arain, YXJhaW5tQG1jbWFzdGVyLmNh
Disclaimer: All claims expressed in this article are solely those of the authors and do not necessarily represent those of their affiliated organizations, or those of the publisher, the editors and the reviewers. Any product that may be evaluated in this article or claim that may be made by its manufacturer is not guaranteed or endorsed by the publisher.
Research integrity at Frontiers
Learn more about the work of our research integrity team to safeguard the quality of each article we publish.