 Shucheng Liu1*
 Peijin Wu2
- 1School of Statistics and Mathematics, Zhejiang Gongshang University, Hangzhou, China
- 2School of Geographic Sciences, East China Normal University, Shanghai, China
Eco-efficiency is an important factor in assessing the quality of development, and high-tech industries are crucial for countries to forge green innovation paths. However, few studies have examined whether and how high-tech industrial agglomeration affects green innovation efficiency. To fill this gap, we measure the degree of high-tech industrial agglomeration and the level of specialized and diversified agglomeration using the location entropy index and agglomeration factor, and calculate green innovation efficiency using the super-SBM model with undesirable outputs. Based on Chinese provincial panel data from 2006 to 2020, a dynamic spatial Durbin model was constructed to explore the impact of high-tech industrial agglomeration and different agglomeration patterns on green innovation efficiency. Our study found that high-tech industrial agglomeration is a significant contributor to green innovation efficiency. There is an inverted U-shaped relationship between specialized agglomeration and green innovation efficiency, and diversified agglomeration contributes to green innovation efficiency. Given the regionally uneven nature of China’s economic development, there is some variation in the impact effects within different economic regions. We demonstrated the leading role of scientific high-tech industrial agglomeration patterns and appropriate levels of agglomeration in green innovation, providing theoretical guidance for the formulation of China’s high-quality development policies.
1 Introduction
After more than 40 years of rapid development, China’s economic progress has generated a series of environmental problems along with considerable achievements. As China’s economy shifts from high growth to a new stage of high-quality development, resource shortages, environmental constraints, and economic downturns are becoming increasingly prominent (Wu et al., 2020; Liu and Zhang, 2021). The Global Status Report on Energy and CO2 shows that China’s greenhouse gas emissions have continued to rise over the last 3 years and the country remains the world’s largest emitter of greenhouse gases. In the context of China’s new development path, eco-efficiency is an important factor of consideration in evaluating the quality of development (Campos et al., 2021; Qiu and Li, 2021; Wu et al., 2022). The 14th Five-Year Plan emphasizes the implementation of sustainable development strategies and promotes the comprehensive green transformation of economic and social development (Chen and Huo, 2022; Chen and Wang, 2022; Ren and Wu, 2022). Rationalizing the relationship between economic and social development and the ecological environment and striving for stronger environmental leadership in the international stage is essential for achieving China’s high-quality sustainable economic development.
As a new form of innovation that can drive rapid economic growth while avoiding negative externalities to the ecological environment, green innovation is becoming a common innovation path followed by countries around the world in the pursuit of sustainable development (Boons and Ludeke-Freund, 2013; Chen et al., 2017; Semenenko et al., 2022). Green innovation efficiency is a key indicator for measuring green innovation capabilities that not only evaluates factor utilization in the innovation process based on the traditional innovation efficiency perspective, but also introduces an undesirable output dimension, considering science and technology innovation, resource conservation, and environmental protection in an integrated manner, and presents a refinement of traditional measures of innovation efficiency (Liang et al., 2018; Luo and Zhang, 2021).
High-tech industries are knowledge- and technology-intensive, resource-saving, and environment-friendly green industries, and are an important support for countries’ forging green innovation paths (Gu et al., 2020; Zhu and Li, 2021). Based on resource sharing and knowledge spillover effects, high-tech industries tend to cluster spatially, forming high-tech development zones (Wang et al., 2021; Xu D. et al., 2022). Theoretically, moderate agglomeration of high-tech industries can produce scale, knowledge spillover, and innovation interaction effects, with an impact on green innovation efficiency (Liu et al., 2022a; Wang et al., 2022). Does China’s high-tech industrial agglomeration have an impact on green innovation efficiency? Does this effect show heterogeneity depending on the mode of agglomeration? These are urgent issues to be addressed in the context of high-quality development.
Based on the traditional concept of innovation, scholars have incorporated ecological elements such as resources and environmental pollution into the innovation system, introducing the concepts of green innovation, eco-innovation, environmental innovation, and sustainable innovation (Rennings, 2000; Dyck and Silvestre, 2018; Li et al., 2022), consistently emphasizing the need for innovative activities to advance sustainable development. Research on green innovation efficiency has focused on two main areas. The first is the evaluation of green innovation efficiency and analysis of its spatial and temporal evolution. Data envelopment analysis is widely used because it does not require assumptions about the relationships between variables and has obvious advantages in measuring the efficiency of decision units with multiple inputs and outputs (Chen et al., 2013; Wang et al., 2017; Garau, 2022). Evolutionary studies based on the time dimension generally have suggested that China’s regional green innovation efficiency demonstrates a fluctuating upward trend (He et al., 2021; Zhang M. F. et al., 2022). From a spatial perspective, spatial differences in green innovation efficiency have been found in China, using a stepwise distribution among eastern, central, and western regions (Du et al., 2019; Shen et al., 2022). Secondly, the factors influencing green innovation efficiency were explored. Scholars have focused on the impact of environmental regulation, industrial structure, market pull, education investment, technology transfer, and foreign direct investment on green innovation efficiency (Li et al., 2018; Zeng J. Y. et al., 2021; Dong et al., 2022). Previous studies have confirmed that industrial agglomerations have innovation spillover effects (Li X. et al., 2021). Depending on the type of industry, industrial agglomerations are differentiated into specialized and diversified agglomerations, and their impact on innovation and the environment varies according to the structure of the agglomeration (Ding et al., 2022; Xu Y. et al., 2022). Industrial agglomeration patterns can only exert greater agglomeration effects and positive spatial spillovers if they are adapted to urban development conditions (Chen et al., 2008).
Academics have conducted fruitful research on green innovation efficiency, which provides a better theoretical basis and methodological insights for this paper. China’s economy is at a critical stage of transition from high-rate growth to high-quality development, and high-tech industries are advancing by leaps and bounds. Unfortunately, the literature that qualitatively studies the mechanism of the role of high-tech industrial agglomeration on green innovation efficiency and empirically tests its impact effect is relatively rare, and the depth of research needs to be expanded. Scholars have mainly focused on the impact of economic phenomena generated by industrial agglomeration on green innovation, and few studies have explored the relationship between industrial agglomeration and green innovation efficiency based on the perspective of agglomeration pattern and agglomeration intensity.
In view of this, the main contribution of this paper is to integrate high-tech industrial agglomeration and green innovation efficiency into the same analytical framework. Based on the analysis of the mechanism of high-tech industrial agglomeration on green innovation efficiency, the impact paths of specialized agglomeration and diversified agglomeration on green innovation efficiency are explored. In addition, based on Chinese provincial panel data from 2006 to 2020, we construct a dynamic spatial Durbin model (SDM) to investigate the effects of high-tech industrial agglomeration and different agglomeration patterns on green innovation efficiency and regional differentiation characteristics. Our study aims to provide a scientific basis for promoting the clustering of high-tech industries in accordance with local conditions, giving full play to the clustering effect to enhance green innovation efficiency and promote high-quality regional economic development.
The rest of this article is structured as follows. The theoretical underpinnings and study hypotheses are presented in Section 2. The data and techniques are described in Section 3. The empirical findings are described and discussed in Section 4. Conclusion and policy implications are presented in Section 5.
2 Theoretical foundation and hypotheses
2.1 The effect of high-tech industrial agglomeration on green innovation efficiency
Under the premise of certain factor inputs, green innovation efficiency involves two basic elements, including the desirable output efficiency of resource inputs and the undesirable output reduction efficiency (Song and Zhang, 2020). The scale and technology effects of high-tech industrial agglomeration are the primary factors affecting these two aspects of efficiency (Fallah et al., 2014). Desirable and undesirable outputs often arise simultaneously and together determine the efficiency of green innovation. The relationship between desirable and undesirable output is assumed to be y = f(x), where y is the desirable output and x is the undesirable output. Figure 1 presents a mechanism map of the impact of high-tech industrial agglomeration on green innovation efficiency. In Figure 1, O0 denotes the origin of desirable and undesirable output, and O1 denotes the impact of high-tech industrial agglomeration, which can be divided into scale and technology effects. Arrows pointing to the corresponding variables increase and decrease the effects. Y0 = f0(x), y1 = f1(x), and y2 = f2(x) correspond to low, medium, and high levels of green innovation efficiency, respectively. According to the law of diminishing marginal output and sustainable development theory, desirable output rises along with undesirable output, but the growth trend slows down (Lee and Johnson, 2014). The rationale for this is that a production approach that increases desirable output by expanding undesirable output is unsustainable and inevitably leads to diminishing desirable output.
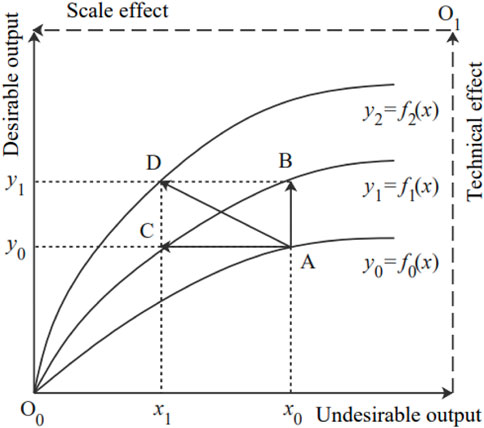
FIGURE 1. Mechanism of high-tech industry agglomeration on green innovation efficiency.
In the early stages of high-tech industrial agglomeration, agglomeration is at a low level of green innovation efficiency, corresponding to the curve represented by y0 = f0(x) in Figure 1, with a point A(x0, y0) on the curve. With the clustering of high-tech enterprises in a region, technology and scale effects are generated. The technology effect is a manifestation of the competitive and cooperative relationships between enterprises, wherein enterprises continuously conduct innovation activities to improve market competitiveness and internal technology levels, while leveraging knowledge spillover to achieve mutual learning and common progress, which elevates the agglomeration’s overall technology level. As a result, under a certain undesirable output, the desirable output is increased (i.e., from point A to point B), and green innovation efficiency is raised from a low to a medium level. The scale effect is primarily related to enterprises’ common access to public social resources in the agglomeration area, which improves efficiency in the use of public resources per unit of desirable output and reduces undesirable output, thus improving green innovation efficiency (i.e., moving from point A to point C to the left). Under combined technology and scale effects, based on the principle of vector addition, point A will move to point D [i.e., jump from curve y0 = f0(x) to curve y2 = f2(x)], achieving green innovation efficiency.
Notably, some scholars have argued that as agglomeration grows in size, congestion effects will arise within agglomerations (Liu C. Y. et al., 2020; Zandiatashbar and Hamidi, 2021). However, we assert that high-tech industries react differently. High-tech industries are typically knowledge-intensive and technological innovation is their main feature. The rapid renewal of high-tech products constantly generates new demand, weakening the limitations of market capacity (Zuo et al., 2019). In addition, as local governments attach considerable importance to the development of high-tech industries, social resources are in sufficient supply, effectively reducing the potential congestion effect (Ostergaard and Park, 2015). Based on the theoretical analysis, we propose the first hypothesis.
Hypothesis 1:. High-tech industrial agglomeration has a catalytic effect on green innovation efficiency.
2.2 The impact of different industrial agglomeration modes on green innovation efficiency
Specialized agglomeration in high-tech industries leverages the high degree of technological similarity among firms in an industry and the ease of improving the efficiency of matching firms with research and development (R&D) personnel to establish a shared market for factors, reduce the cost of learning, exchange green technology and innovation knowledge among firms, and promote green technology innovation (Mendonca, 2009). Clusters form a complete industrial chain through specialized division of labour, providing enterprises with abundant green innovation resources, which is conducive to optimizing the allocation of green innovation resources, reducing R&D and transaction costs of green innovation, and increasing economies of scale (Shuen et al., 2014). However, as the degree of specialization increases, its contribution to green innovation efficiency gradually decreases, and excessive specialization may even inhibit the improvement of green innovation efficiency. Specialized clusters can lead to increased competition among firms, and firms in a cluster tend to form a single structural pool of knowledge and labour (Li X. H. et al., 2021). This limits the innovation spillover from the agglomeration to the exchange of information and technology within the industry, which could form a closed system with industry spatial boundaries, leading to path dependence and technology locking in the industrial structure within the agglomeration, which is not conducive to R&D and innovation activities (Zhang W. X. et al., 2022). Too much specialization can lead to traffic congestion, resource shortages, and higher production costs, inhibiting green innovation efficiency. It is possible that different degrees of specialization may have different effects on green innovation efficiency. In this regard, we propose a second hypothesis.
Hypothesis 2:. There is a non-linear relationship between the specialized agglomeration of high-tech industries and green innovation efficiency.Diversified agglomeration is an organizational model based on spatial clustering of firms with different product orientations. Unlike specialized agglomeration, the agglomeration of high-tech firms across industries makes labour market externalities more significant (Zhang et al., 2021). The clustering of workers with different professional skills in a region can create a diverse labour pool (Ozcan and Islam, 2014), and the clustering of different types of high-tech enterprises in the same area can facilitate inter-industry knowledge exchange and complementarity, and generate new knowledge, establishing a diverse knowledge pool (Pei et al., 2021). Diversified labour and knowledge pools not only avoid the homogeneity of green innovation technologies and management systems and increase firms’ differentiation and innovation of green products, but also help to stimulate firms’ green technological innovation (Lechner and Leyronas, 2012; Simonen et al., 2015), increasing green innovation efficiency. In addition, diversified agglomeration facilitates convenient provision of intermediate goods between firms, satisfies firms’ diversified demand for inputs, and reduces transport and transaction costs, establishing the conditions for resource conservation and lower undesirable output. This leads us to our third hypothesis.
Hypothesis 3:. Diversified agglomeration of high-tech industries has a catalytic effect on green innovation efficiency.
3 Model construction and variable description
3.1 Model construction
Based on theoretical analysis, we explore the impact of high-tech industrial agglomeration and different spatial agglomeration patterns on green innovation efficiency. We introduce spatial interactions into the panel regression model, combining a spatial lag model with a spatial error model to form a more general SDM (Zhao et al., 2020). Since green innovation efficiency incorporates undesirable outputs reflecting environmental pollution, which are characterized by wide reach and mobility, a one-period lag in green innovation efficiency is included in the model to reduce potential systemic bias. The SDM is constructed as follows:
where subscripts i and t denote province and year, respectively. W is the spatial weight matrix, GIEit denotes green innovation efficiency, GIEi,t−1 is the time lag term, and WGIEit is the spatial lag term. HIAit denotes high-tech industrial agglomeration, SAit denotes specialized agglomeration, and DAit denotes diversified agglomeration. Xit denotes control variables. μi, ξt, and εit are spatial fixed effects, time fixed effects, and random error terms, respectively.
Spatial weight matrices that reflect the way in which geographic elements influence one another are critical to spatial measurement models (Liu and Liu, 2019). To fully consider the reality of geographic attributes, an inverse geographic distance matrix is constructed to reflect geospatial relationships between provinces. Interprovince distance data is measured using ArcGIS software’s distance function, and vector-based map data is obtained from the standard map of the Ministry of Natural Resources of China (GS(2019)1719). The weight matrix uses the following formula:
where dij denotes the distance between province i and province j. To retain the main features of the spatial weight matrix as much as possible and avoid the loss of economic interpretation of the weight matrix due to distance decay, the maximum characteristic roots of the matrix are used for normalization.
Before estimating the spatial econometric model, it is necessary to determine whether the variables are spatially dependent. We use Moran’s Index (Moran’s I) to perform a spatial autocorrelation test to analyze the distribution characteristics of the variables in geographic space. The formula is calculated as follows:
where
3.2 Variable description and data source
3.2.1 Explained variable
We measure green innovation efficiency using a super-slacks-based measure model that includes undesirable outputs. The model expressions are as follows:
where
Based on the comprehensive consideration of the existing measurement indicators, data availability, and the connotation of green innovation (Li Z. et al., 2021; Zeng W. P. et al., 2021; Zhao et al., 2021), R&D personnel input, R&D capital input, and energy input are selected as input factors, the number of green patent applications and new product sales revenue are desirable outputs, and the environmental pollution index represents undesirable outputs (Table 1). Particularly, R&D capital investment is evaluated using the perpetual inventory approach and monitored using R&D capital stock. Internal expenditure on R&D capital is chosen as the initial indicator for estimation, and deflations are corrected using the R&D price index (0.45 fixed asset investment price index plus 0.55 industrial producer ex-factory price index), with 2006 as the base period (Lv et al., 2021). Energy inputs are measured using total energy consumption converted to standard coal. Green patents are based on the IPC Green List published by the World Intellectual Property Organization, and seven green technology areas are selected to reflect green innovation, including alternative energy, transportation, energy efficiency and emissions reduction, waste treatment, agroforestry, administrative regulation and design, and nuclear power generation. The environmental pollution index is obtained using the entropy method to measure industrial wastewater, industrial waste gas, and industrial solid waste emissions.
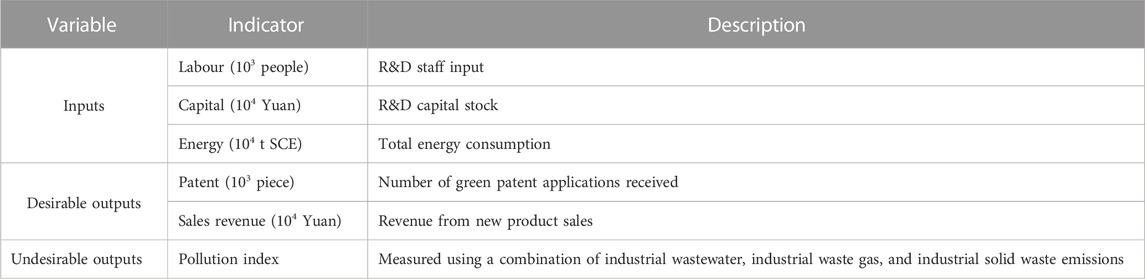
TABLE 1. Input–output indicator system of energy eco-efficiency.
3.2.2 Explanatory variable
According to the classification criteria of the China High Technology Statistical Yearbook (2021), the high-tech industry includes six manufacturing industries, including information chemicals, medical equipment and instrumentation, pharmaceutical, electronics and communications equipment, computer and office equipment, and aerospace equipment and machinery. The degree of industrial agglomeration is measured using location entropy, Herfindahl–Hirschman, and, EG indices and other methods. In comparison, location entropy can eliminate the scale differences between regions and truly reflect industries’ spatial distribution (Dong et al., 2020). We use the location entropy index to measure the level of high-tech industrial agglomeration, which is calculated using the following formula:
where eir denotes the number of people employed in province i’s industry r.
High-tech industrial agglomeration primarily impacts green innovation efficiency through technology externalities. The main debate regarding technology externalities is whether specialized or diversified agglomeration is more conducive to knowledge and technology spillovers. Referencing Duranton and Puga (2001), the agglomeration factor is used to measure the level of specialized agglomeration (SA) and diversified agglomeration (DA) in high-tech industries. The equations are as follows:
where Cij,t denotes the ratio of the number of employees in industry j in the high-tech industry in province i to the number of employees in the high-tech industry in that province in period t. Ci,t denotes the ratio of the number of employees in the high-tech industry in province i to the number of employees in the high-tech industry nationwide in period t. Cj,t denotes the ratio of the number of employees in industry j in the high-tech industry to the number of employees in the high-tech industry nationwide in period t.
3.2.3 Control variables
Environmental regulation has positive compensating and negative offsetting effects on green innovation (Zhang et al., 2020). Environmental regulation intensity (ER) is measured by the amount of investment in industrial pollution control as a proportion of total industrial output. Policy support can compensate for some high R&D expenditure and risks associated with green innovation activities for firms; however, government funding may also have a crowding-out effect on firms (Liu et al., 2022b; Li et al., 2023). Government support (GS) is measured using the proportion of fiscal science and technology expenditure in fiscal expenditure (Liu Y. et al., 2020). The level of economic development (ED) provides the material basis for scientific research, technological innovation, and environmental governance and is reflected in the logarithm of the regional real GDP per capita for the base period 2006. Technology markets are where knowledge products are traded and are key to realizing the value of technological innovation (Kaartemo and Nystrom, 2021), and the logarithm of technology market turnover is used to reflect technology market maturity (MM). Foreign direct investment (FDI) is an important channel for capturing technology spillovers and the entry point for the pollution sanctuary hypothesis (Luo et al., 2021). The ratio of actual FDI to regional GDP is used to measure the level of foreign investment (FI).
3.2.4 Data source
Given the availability of data, we select 30 provinces in China (excluding Tibet, Hong Kong, Macao, and Taiwan) from 2006 to 2020 as the study sample. Based on each provincial administrative region’s distribution of natural resources and economic and social development, China is divided into eastern, central, and western economic regions. The distribution map of China’s provinces is presented in Figure 2. Indicators that construct explained variables were obtained from the EPS data platform, China Energy Statistics Yearbook and China Environment Statistics Yearbook; indicators that construct explanatory variables were obtained from the China Science and Technology Statistical Yearbook and the China High-tech Statistical Yearbook; and the control variables were obtained from the EPS data platform and the China Urban Statistical Yearbook. Descriptive statistics for the variables are shown in Table 2.
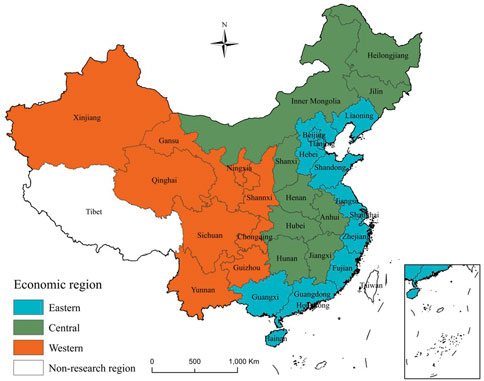
FIGURE 2. Distribution map of provinces in China.
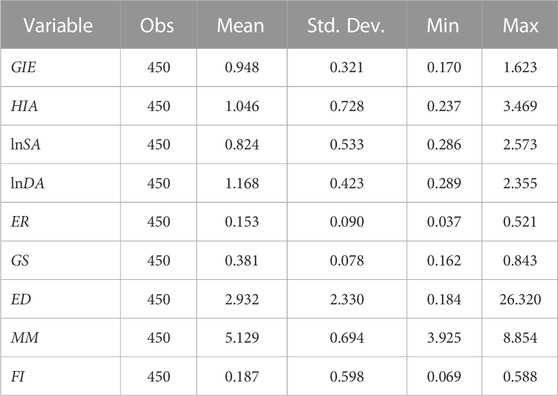
TABLE 2. Variable descriptive statistics.
4 Results and analysis
4.1 Evaluation of green innovation efficiency and high-tech industrial agglomeration
4.1.1 Green innovation efficiency in China
The MaxDEA 7 Ultra software is used to measure the green innovation efficiency of 30 Chinese provinces from 2006 to 2020. The results of the average green innovation efficiency based on the three major economic regions of China are presented in Figure 3.
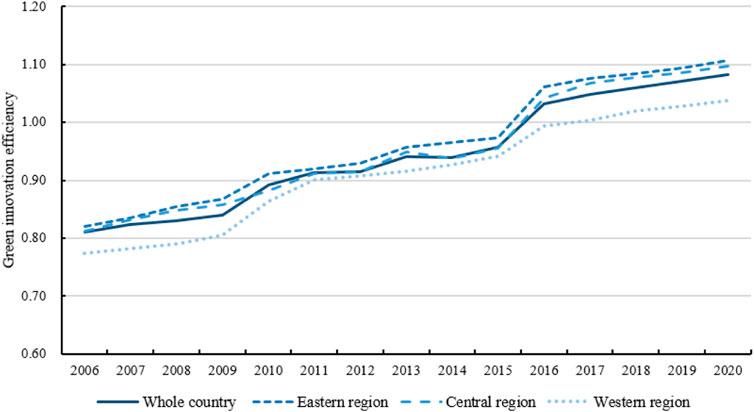
FIGURE 3. The development of green innovation efficiency.
Overall, the green innovation efficiency of the country showed a steady growth trend during the study period, and the green innovation efficiency of the economic regions had about the same growth trend as the country. In terms of different regions, due to its geographical location and first-mover advantage in economic development, the eastern region was significantly more efficient in green innovation than the central and western regions. In recent years, high-end manufacturing industries have shifted to the center, and the central economic zone has gradually become rich in human resources. With the knowledge spillover and technology diffusion effects of green innovation, the growth rate of green innovation efficiency in the central region has accelerated. The western economic region is vast and rich in mineral resources, and the efficiency of green innovation has improved under China’s Western Development strategy, but a large gap with the eastern and central regions remains. In the future, improvement in the human environment and infrastructure for green development in the west is essential, actively introducing talent, technology, and capital to facilitate the region’s capability to absorb and transform the green innovation spillover from eastern and central China.
4.1.2 High-tech industrial agglomeration in China
The uneven character of China’s economic development determines the regional unevenness of industrial agglomeration. Table 3 presents the level of development of high-tech industrial agglomeration and different agglomeration patterns in China. In terms of the level of development of high-tech industrial agglomeration, the degree of high-tech industrial agglomeration has increased significantly, both nationally and in the three economic regions. Industrial concentration is highest in the east, and there is a decreasing gradient distribution from the east to the centre and west. The reason is that the eastern economic region has a unique geographical location and economic policy advantages that are conducive to the rapid agglomeration and development of high-tech enterprises.

TABLE 3. The development of high-tech industrial, specialized, and diversified agglomerations.
The analysis of the changes in the development of specialized agglomeration in Table 3 shows that the degree of specialized agglomeration in the national high-tech industry is steadily rising. The central economic region initially developed more slowly, but since 2010, its specialized agglomeration has been ahead of the country, even outpacing the development of the east. As the economic development of the western region has lagged behind other regions, its degree of specialized agglomeration has also lagged relatively behind. The eastern economic region is relatively developed and initially relied on policy and location advantages to absorb technology spillovers from overseas markets and promote the specialized agglomeration of high-tech industries. With the expansion of China’s opening to the outside world, some high-tech enterprises have begun moving to the central and western regions of the country, leading to an increase in specialized concentration. Due to its geographical advantages and good industrial base, the specialization of high-tech industries in central China has developed rapidly.
The level of diversified agglomerations in Table 3 shows a decreasing trend from east to centre and west. As an important base for China’s innovative industries, the eastern economic region is rich in talent and capital, and has a high degree of diversification in high-tech industries. On the basis of the original industries, the central region has taken over some of the high-tech enterprises transferred from the east, and the degree of diversification has increased. Overall, the degree of diversified agglomeration of China’s high-tech industries shows a slow downward trend, with an evident lack of momentum in diversification.
4.2 Spatial autocorrelation test
Based on the standardized inverse geographical distance weight matrix, Moran’s I is used to test the spatial autocorrelation of green innovation efficiency and high-tech industrial agglomeration (Table 4). The test results show that the variables all have significant spatial autocorrelation. The Moran’s I for green innovation efficiency ranged from 0.1 to 0.3, the Moran’s I for high-tech industrial agglomeration ranged from 0.2 to 0.3, and Moran’s I for specialized and diversified agglomeration ranged from 0.1 to 0.2, all significant at the 5% level. This shows a significant positive spatial correlation and agglomeration characteristics between green innovation efficiency and high-tech industrial agglomeration. The reason is that agglomeration can generate intermediate product sharing, labour matching and learning effects, which facilitate enterprises to improve labour productivity and thus contribute to industrial agglomeration (Bao et al., 2023). The increase in green innovation efficiency contributes to sustainable economic development and an improved innovation environment, creating an interregional virtuous circle. Therefore, it is crucial to use spatial econometric models when analyzing the impact of high-tech industrial agglomeration on green innovation efficiency.
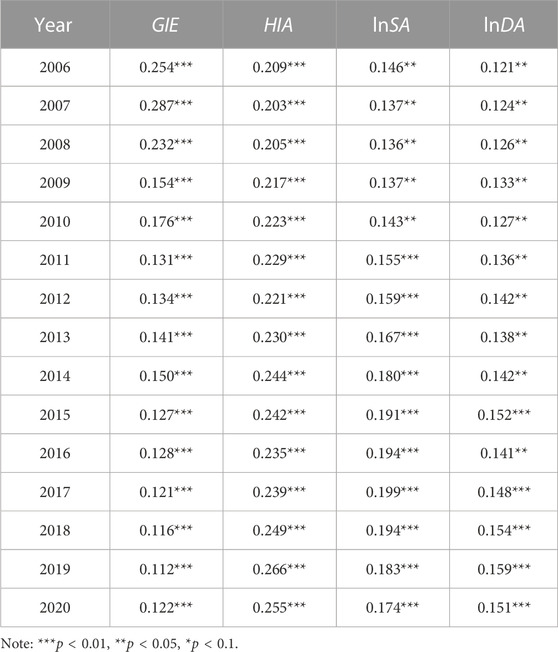
TABLE 4. Spatial autocorrelation test for variables.
4.3 Dynamic spatial Durbin model regression results
We establish the model as a two-way stationary dynamic SDM because of the potential for bias in the estimates due to provincial differences and inter-period factors. The Hausman test indicated that the fixed effects model was significantly better than the random effects model. LR likelihood ratio and Wald tests rejected the original hypothesis that the SDM could be reduced to a spatial lag or spatial error model at the 1% significance level. Therefore, it is reasonable to choose a dynamic SDM with two-way fixed effects. The model estimation results are presented in Table 5.
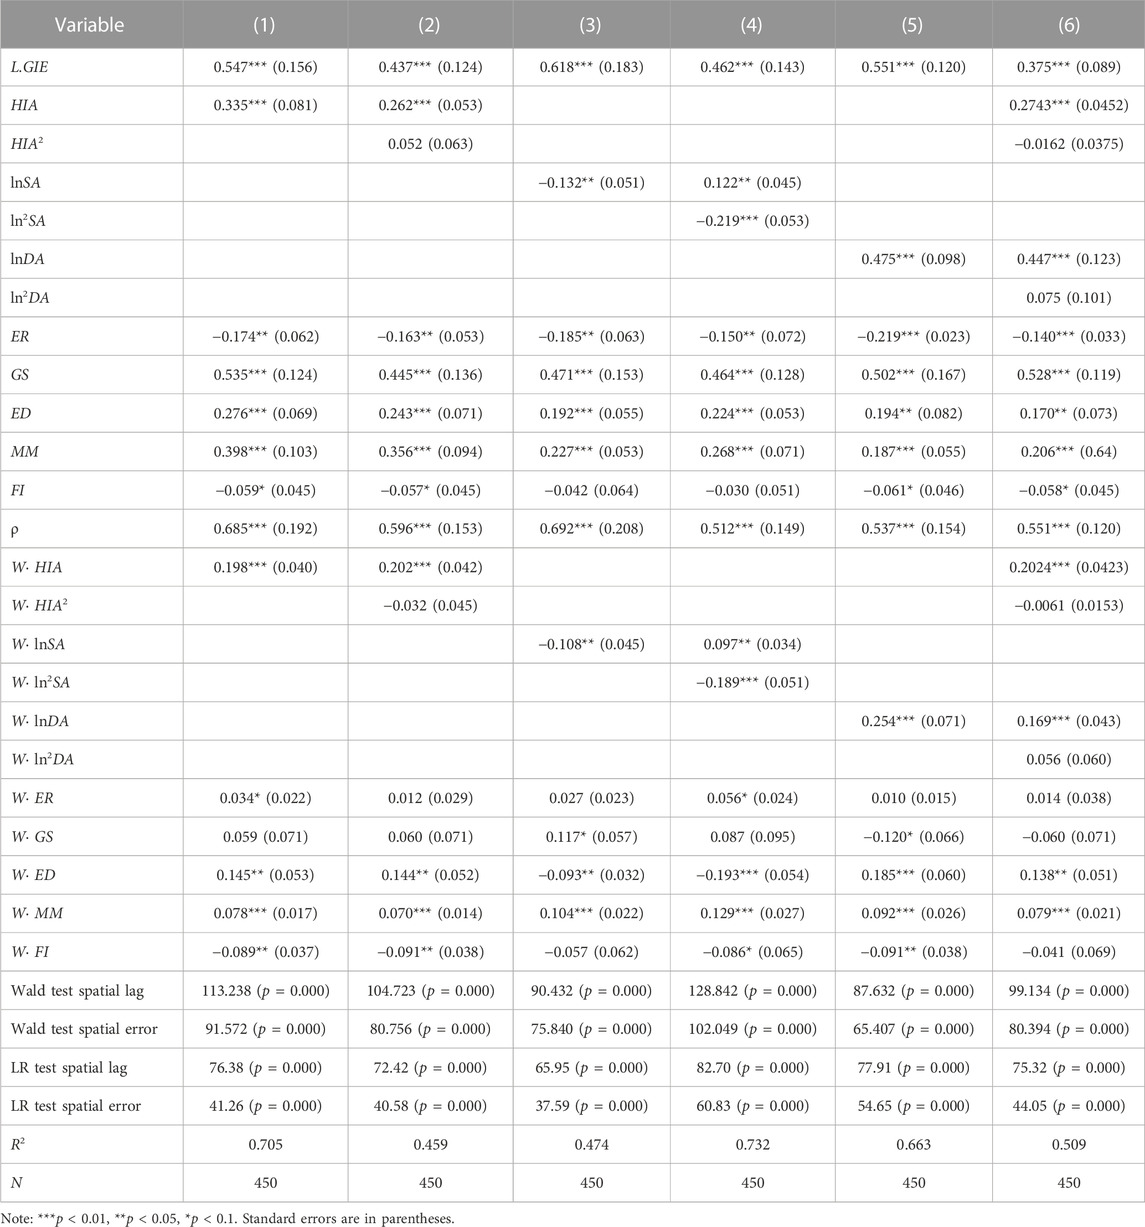
TABLE 5. Dynamic spatial Durbin model estimation results.
The time lag term for green innovation efficiency is significantly positive at the 1% level, indicating that green innovation efficiency has a significant time lag effect, and that accumulation of green technology and knowledge at the early stage will have a positive impact on green innovation at the later stage, indicating path dependence. The spatial lag coefficient of green innovation efficiency (ρ) is positive, passing the significance test of 1%, indicating that there is significant interregional interaction in green innovation efficiency, and the improvement of green innovation efficiency in a region will have a positive impact on green innovation efficiency in neighboring regions. This is largely due to the knowledge spillover effects of interregional cooperation and exchange.
The agglomeration of high-tech industries is conducive to green innovation efficiency. Models (1) and (2) examine the impact of high-tech industrial agglomeration on green innovation efficiency. The coefficients of the high-tech industrial agglomeration and its spatial lag term in model (1) are significantly positive at the level of 1%, indicating that an increase in the degree of high-tech industrial agglomeration positively contributes to the green innovation efficiency of a region and surrounding areas. Industrial agglomeration can reduce the transportation and learning costs of enterprises within a cluster, improve the utilization of public resources, accelerate the exchange and dissemination of green innovation knowledge and technology, and generate knowledge and technology spillover effects, thus promoting the efficiency of green innovation. At the same time, knowledge and technology spillovers from industrial agglomeration can also contribute to green innovation in neighboring regions due to the close economic and trade ties that exist between them. Model (2) introduces a quadratic term for high-tech industrial agglomeration, but it is insignificant, indicating that there is no non-linear interaction relationship. The above results confirm Hypothesis 1.
Heterogeneity exists in the impact of different industrial agglomeration patterns on green innovation efficiency. Models (3) and (4) examine the impact of specialized agglomeration on green innovation efficiency. The coefficients of the specialized agglomeration and its spatially lagged term in the model (3) are significantly negative at the 5% level. In model (4), the introduction of the quadratic term of specialized agglomeration reveals that the coefficients of the primary term of specialized agglomeration and its spatial lag term are positive and the coefficients of the quadratic term are negative, both of which are significant at the 5% level. This indicates that there is a non-linear relationship between specialized agglomeration of high-tech industries and green innovation efficiency. As the degree of specialized agglomeration increases, the efficiency of green innovation shows an inverted U-shaped curve that rises first and then falls. The reason is that while specialized agglomeration promotes green innovation efficiency through intra-industry division of labour and knowledge spillover, it tends to form a structurally homogeneous reservoir of knowledge and technology-based talent, which is not conducive to the diffusion of diversified information and technology, thus weakening the incentive for green innovation. The crowding effect of specialized agglomeration creates a scarcity of resources that can lead to unhealthy competition among firms, which inhibits the enhancement of green innovation efficiency. In addition, the region’s structurally homogeneous “knowledge pool” and “labour pool,” as well as the problem of resource scarcity, will inevitably continue to absorb resources and labour from neighboring regions, hindering the diversification of talent and technological innovation in the neighborhood. The above results support Hypothesis 2.
Models (5) and (6) examine the impact of diversified agglomeration on green innovation efficiency. The coefficient of the diversified agglomeration and its spatial lag term in model (5) is significantly positive at the 1% level, indicating that the diversified agglomeration of high-tech industries is conducive to enhancing the green innovation efficiency in a region and its surrounding areas. In the spatial industrial structure of diversified agglomeration of high-tech industries, differentiated enterprises among industries can generate complementary knowledge and technology spillovers, establishing a driving force for technological innovation and promoting green innovation efficiency. In addition, a diversified pool of labour and knowledge is conducive to promoting the exchange of information and rational allocation of resources between industries, providing a good demonstration and driving force for neighboring regions, which in turn stimulates green technology innovation. Model (6) introduces a quadratic term for diversified agglomeration but is insignificant, indicating that there is no non-linear interaction relationship. Hypothesis 3 is confirmed.
4.4 Endogeneity and robustness tests
We use a dynamic SDM with two-way fixed effects to mitigate the endogeneity problem that may be caused by omitted variables. Given that both high-tech industrial agglomeration and green innovation efficiency are outcome variables, there is inevitably an inverse causal relationship between the two and endogeneity issues arise. Industrial agglomeration has inertial development characteristics and may have lagged effects (Schiff, 2015); therefore, the level of industrial agglomeration with a one-period lag is selected as an instrumental variable. In addition, topographic relaxation, as a naturally occurring and objective exogenous variable, will have an impact on transport and infrastructure development, and has a significant correlation with industrial agglomeration (Mori and Smith, 2015), making it an appropriate instrumental variable. We use the system-wide instantaneous method for estimation tests. The LM and Hansen J test results justify instrumental variables by passing unidentifiable and overidentifiable tests, respectively. The estimation results are presented in models (1)–(3) in Table 6.
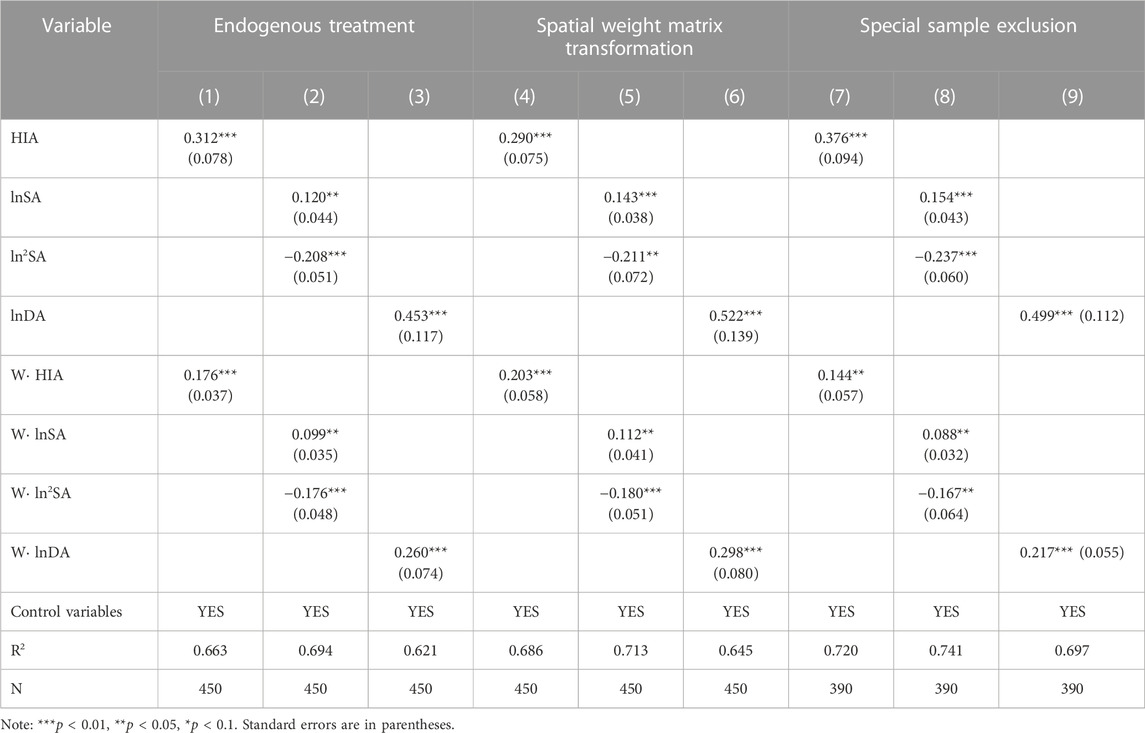
TABLE 6. Results of endogeneity and robustness tests.
We take two approaches to robustness testing. The first is transforming the spatial weight matrix, which is constructed using (0, 1) neighborhoods instead of inverse geographical distances, and the estimation results are presented in models (4)–(6). Second, municipalities directly under the central government are excluded. Since municipalities are directly administered by the central government, their development plans may differ from those of prefecture-level cities (Lin and Zhu, 2021); thus, central government administered municipalities are excluded to avoid policy bias and the estimation results are presented in models (7)–(9).
Table 6 reveals that the endogeneity treatment and robustness tests validate the credibility of the study’s findings. Estimated coefficients of core explanatory variables did not change significantly with the introduction of instrumental variables, and the direction of influence and significance levels remained unchanged. The robustness test results show that the transformation of the spatial weight matrix and the exclusion of municipalities did not affect the relationship between the core explanatory variables and green innovation efficiency. This indicates that the model estimation results are robust and the study findings are credible.
4.5 Heterogeneity analysis
The above empirical studies mainly examine the impact of high-tech industrial agglomeration on green innovation efficiency at the national level. Due to the diversity of geographical location conditions and resource endowments in different regions of China, spatial differences are expected in both green innovation efficiency and the degree of high-tech industrial agglomeration. Therefore, we carry out grouped regressions for the eastern, central and western regions, to examine the impact of high-tech industrial agglomeration and different agglomeration patterns on green innovation efficiency from the perspective of regional heterogeneity. The estimation results of the dynamic SDM are shown in Table 7.
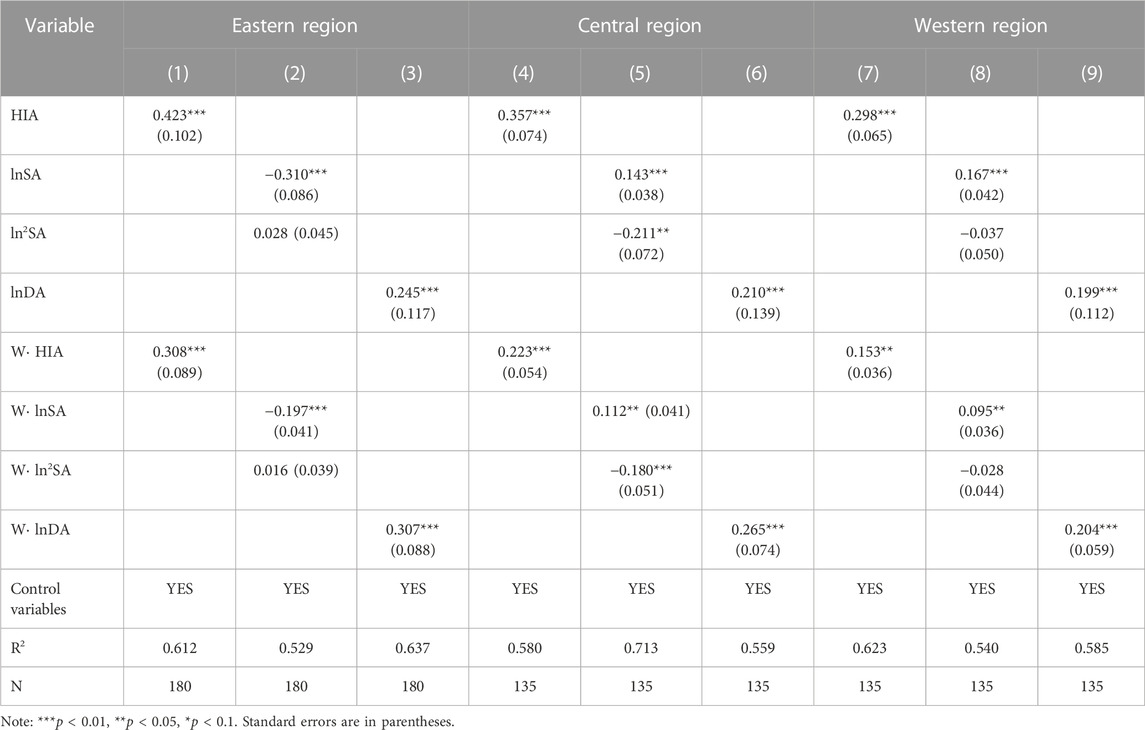
TABLE 7. Results of regional heterogeneity analysis.
In terms of high-tech industrial agglomeration, the eastern, central and western economic regions contribute positively to green innovation efficiency through industrial agglomeration. The impact is stronger in the eastern region than in the central and western regions due to the relatively superior infrastructure and public services, which are conducive to the knowledge and technology spillover dividends that the high-tech industrial agglomeration can bring to green development. At the same time, the relatively developed economic and social environment of the eastern region also has a clear advantage in attracting highly skilled personnel and capital. This highlights the importance of developing policy guidelines to rationally promote the clustering and coordinated development of high-tech enterprises in each region.
Regarding specialized agglomeration, the eastern region’s specialized agglomeration has a negative impact on green innovation efficiency, the specialized agglomeration in the central economic region has an inverted U-shaped relationship with green innovation efficiency, and the specialized agglomeration in the western economic region is conducive to improving green innovation efficiency. The reason may be that the eastern region has a developed economy and a high concentration of high-tech enterprises. Specialized agglomeration can cause problems such as traffic congestion, resource shortages, and rising production costs, which inhibit green innovation efficiency. During the study period, specialized agglomeration in the central region developed rapidly, and under the combined effect of positive and negative externalities generated by specialized agglomeration, green innovation efficiency showed an upward and then downward trend. In the western region, the degree of high-tech industrial agglomeration is low, and the crowding effect generated by specialized agglomeration is insignificant, indicating a positive agglomeration effect on green innovation efficiency.
The diversified agglomeration of high-tech industries in the eastern, central and western economic regions indicates a significant contribution to green innovation efficiency. This is consistent with the test results of national data. Diversified agglomeration forms a diverse pool of labour and knowledge, which is conducive to stimulating the technological innovation of enterprises and promoting green technological innovation. In addition, diversified agglomeration facilitates the easy provision of intermediate products between firms and reduce transport and transaction costs, thus creating conditions for saving resources and reducing undesirable output, and thus enhancing the green innovation efficiency. In the future, a balanced spatial distribution of high-tech enterprises, the coordinated development of industries across regions, and the level of diversified agglomeration in each province should be promoted.
5 Conclusion and discussion
5.1 Conclusions
Green development is a critical component of China’s new era of high-quality economic development, and improving the efficiency of green innovation is essential for achieving green development. As a strategic industry for economic development, the high-tech industry has considerable advantages in reducing energy use, improving efficiency, and promoting economic structural transformation, and is an important driving force for achieving green innovation. We reveal the mechanism of the effect of high-tech industrial agglomeration on green innovation efficiency through theoretical analysis. Using a sample of 30 Chinese provinces from 2006 to 2020, we establish a dynamic SDM to empirically test the effect of high-tech industrial agglomeration on green innovation efficiency, conducting a comprehensive analysis of the impact of different agglomeration patterns.
The relevant findings are threefold. 1) China’s green innovation efficiency and high-tech industrial agglomeration level exhibit a stable growth trend, and spatial distribution is roughly characterized by a gradual decrease from east to west. Specialized agglomeration is rapidly developing, while diversified agglomeration is relatively underdeveloped. 2) At the national level, high-tech industrial agglomeration has a significant effect on green innovation efficiency, and different agglomeration patterns have heterogeneous effects. There is an inverted U-shaped relationship between specialized agglomeration and green innovation efficiency, while diversified agglomeration is conducive to promoting green innovation efficiency. 3) Regional heterogeneity in the impact of high-tech industrial agglomeration and different agglomeration patterns on green innovation efficiency is evident. The promotional effect of high-tech industrial agglomeration on green innovation efficiency is significant in all three economic regions, and the intensity of this effect is decreasing. Specialized agglomeration in the eastern economic region has a significant negative impact on green innovation efficiency, while the central economic region shows an inverted U-shaped relationship, while specialized agglomeration in the western economic region is conducive to promoting green innovation efficiency. Welcoming the results of the national test, the diversified agglomeration within the three economic regions makes an important contribution to green innovation efficiency.
5.2 Policy implications
The findings of our study provide policymakers with three practical implications for improving green innovation. First, the development of high-tech industrial agglomeration should be accelerated. In terms of macro policy formulation, emphasis should be placed on coordinated national planning, deepening structural reform on the supply side, actively nurturing and introducing high-tech enterprises, strengthening the spatial clustering of high-tech industries, and effectively releasing the potential of high-tech development regions to enhance green innovation efficiency. The government should seize the opportunities presented by the paradigm shift of the digital economy and promote digitization, intelligence and greening in high-tech industries, prioritize strategic emerging industries and green industry clusters, accelerate the upgrading and transformation of obsolete production capacity, and promote the integration of high-end and green industries (Prah, 2022).
Second, diversified agglomeration of high-tech industries should be promoted to achieve diversified development of high-tech enterprises. A large number of science and technology elements and innovation resources are gathered in high-tech industrial clusters, which should be leveraged to promote the transfer and production of green innovation knowledge and technology among enterprises by building diversified application scenarios to continuously stimulate the generation of new products, technologies and business models. The government should actively guide the regulation of competition and cooperation among high-tech enterprises to avoid large-scale homogenous clustering and the resulting crowding effects (Tsuji, 2022).
Third, policy guidelines should be developed to promote the development of high-tech industrial agglomeration in accordance with local conditions (Atta-Mensah, 2021). In view of the development status of China’s three major economic zones, when guiding high-tech industrial agglomeration, industrial support policies and key development areas should be identified in relation to the specific stage they are in to effectively leverage the positive externalities of industrial agglomeration and generate the synergistic enhancement of the regional economy, innovation capacity, and ecological environment. The eastern economic region has the advantage of high-tech concentration and the development of intensive industries. The region should actively implement industrial transfer policies to transfer over-specialized labour-intensive industries to the central and western regions, promote industrial structure upgrading, and increase the level of diversified agglomeration. The central economic region should build on the sound development of existing industries and transfer into a number of coordinated and relevant industries to effectively absorb the spillover effects of knowledge and technology. Considering factors such as economic development, industrial base, and human resources, it is appropriate for the western economic region to prioritize the development of industries with regional characteristics and policy-oriented industries and actively receive a continuous inflow of capital, talent, and other resources that can be transformed into green innovation outputs.
5.3 Limitations and future directions
Although detailed theoretical analysis and empirical testing are carried out, there are still areas worth further expansion in future research. First, we recognize that the provincial panel data used have sampling limitations because they ignore regional and international variations. In emerging economies, where various resource endowments and cultural values may have an impact on the linkages between variables, high-tech industrial agglomeration is a complex issue. As data availability and statistics improve, future research should test these results at the level of other emerging countries and cities. Second, our measurement of high-tech industrial agglomeration is only considered by industry as a whole, and further research on the agglomeration effect of sub-sectors is encouraged. Finally, given the complex impact of high-tech industrial agglomeration and different agglomeration patterns on green innovation efficiency, a non-parametric spatial model could be applied in the future to analyze the non-linear interaction between them.
Data availability statement
Publicly available datasets were analyzed in this study. This data can be found here: https://www.epsnet.com.cn/index.html#/Index.
Author contributions
SL: writing-original draft preparation, methodology, conceptualization. PW: writing—reviewing and editing, validation, supervision. All authors have read and agreed to the published version of the manuscript.
Funding
This work was supported by the Major Program of National Fund of Philosophy and Social Science of China (20&ZD133).
Conflict of interest
The authors declare that the research was conducted in the absence of any commercial or financial relationships that could be construed as a potential conflict of interest.
Publisher’s note
All claims expressed in this article are solely those of the authors and do not necessarily represent those of their affiliated organizations, or those of the publisher, the editors and the reviewers. Any product that may be evaluated in this article, or claim that may be made by its manufacturer, is not guaranteed or endorsed by the publisher.
References
Atta-Mensah, J. (2021). Commodity-linked bonds as an innovative financing instrument for African countries to build back better. Quantitative Finance Econ. 5 (3), 516–541. doi:10.3934/QFE.2021023
Bao, X. H., Gao, L., Jin, Y., and Sun, J. (2023). Industrial agglomeration and firm exports: Micro-evidence based on input-output linkages. Econ. Model. 119, 106123. doi:10.1016/j.econmod.2022.106123
Boons, F., and Ludeke-Freund, F. (2013). Business models for sustainable innovation: State-of-the-art and steps towards a research agenda. J. Clean. Prod. 45, 9–19. doi:10.1016/j.jclepro.2012.07.007
Campos, F. S., David, J., Lourenço-de-Moraes, R., Rodrigues, P., Silva, B., Vieira da Silva, C., et al. (2021). The economic and ecological benefits of saving ecosystems to protect services. J. Clean. Prod. 311 (15), 127551. doi:10.1016/j.jclepro.2021.127551
Chen, C. P., Ding, Y. J., and Liu, S. Y. (2008). City economical function and industrial development: Case study along the railway line in north Xinjiang in China. J. Urban Plan. Dev. 134 (4), 153–158. doi:10.1061/(asce)0733-9488(2008)134:4(153)
Chen, J., Cheng, J. H., and Dai, S. (2017). Regional eco-innovation in China: An analysis of eco-innovation levels and influencing factors. J. Clean. Prod. 153 (1), 1–14. doi:10.1016/j.jclepro.2017.03.141
Chen, L. M., and Huo, C. J. (2022). The measurement and influencing factors of high-quality economic development in China. Sustainability 14 (15), 9293. doi:10.3390/su14159293
Chen, M., and Wang, H. B. (2022). Import technology sophistication and high-quality economic development: Evidence from city-level data of China. Econ. Research-Ekonomska Istraživanja 35 (1), 1106–1141. doi:10.1080/1331677x.2021.1956362
Chen, Y., Cook, W. D., Kao, C., and Zhu, J. (2013). Network DEA pitfalls: Divisional efficiency and frontier projection under general network structures. Eur. J. Operational Res. 226 (3), 507–515. doi:10.1016/j.ejor.2012.11.021
Ding, J., Liu, B. L., and Shao, X. F. (2022). Spatial effects of industrial synergistic agglomeration and regional green development efficiency: Evidence from China. Energy Econ. 112, 106156. doi:10.1016/j.eneco.2022.106156
Dong, F., Wang, Y., Zheng, L., Li, J. Y., and Xie, S. X. (2020). Can industrial agglomeration promote pollution agglomeration? Evidence from China. J. Clean. Prod. 246, 118960. doi:10.1016/j.jclepro.2019.118960
Dong, X., Fu, W. S., Yang, Y. L., Liu, C. U., and Xue, G. Z. (2022). Study on the evaluation of green technology innovation efficiency and its influencing factors in the central plains city cluster of China. Sustainability 14 (17), 11012. doi:10.3390/su141711012
Du, J. L., Liu, Y., and Diao, W. X. (2019). Assessing regional differences in green innovation efficiency of industrial enterprises in China. Int. J. Environ. Res. Public Health 16 (6), 940. doi:10.3390/ijerph16060940
Duranton, G., and Puga, D. (2001). Nursery cities: Urban diversity, process innovation, and the life cycle of products. Am. Econ. Rev. 91 (5), 1454–1477. doi:10.1257/aer.91.5.1454
Dyck, B., and Silvestre, B. S. (2018). Enhancing socio-ecological value creation through sustainable innovation 2.0: Moving away from maximizing financial value capture. J. Clean. Prod. 171, 1593–1604. doi:10.1016/j.jclepro.2017.09.209
Fallah, B., Partridge, M. D., and Rickman, D. S. (2014). Geography and high-tech employment growth in US counties. J. Econ. Geogr. 14 (4), 683–720. doi:10.1093/jeg/lbt030
Garau, G. (2022). Total factor productivity and relative prices: The case of Italy. Natl. Account. Rev. 4 (1), 16–37. doi:10.3934/NAR.2022002
Gu, W., Liu, D., Wang, C., Dai, S. F., and Zhang, D. H. (2020). Direct and indirect impacts of high-tech industry development on CO2 emissions: Empirical evidence from China. Environ. Sci. Pollut. Res. 27 (21), 27093–27110. doi:10.1007/s11356-020-09071-x
He, W. C., Li, E. L., and Cui, Z. Z. (2021). Evaluation and influence factor of green efficiency of China’s agricultural innovation from the perspective of technical transformation. Chin. Geogr. Sci. 31 (2), 313–328. doi:10.1007/s11769-021-1192-x
Kaartemo, V., and Nystrom, A. G. (2021). Emerging technology as a platform for market shaping and innovation. J. Bus. Res. 124, 458–468. doi:10.1016/j.jbusres.2020.10.062
Lechner, C., and Leyronas, C. (2012). The competitive advantage of cluster firms: The priority of regional network position over extra-regional networks - a study of a French high-tech cluster. Entrepreneursh. Regional Dev. 24 (5-6), 457–473. doi:10.1080/08985626.2011.617785
Lee, C. Y., and Johnson, A. L. (2014). Proactive data envelopment analysis: Effective production and capacity expansion in stochastic environments. Eur. J. Operational Res. 232 (3), 537–548. doi:10.1016/j.ejor.2013.07.043
Li, T. C., Liang, L., and Han, D. R. (2018). Research on the efficiency of green technology innovation in China’s provincial high-end manufacturing industry based on the Raga-PP-SFA model. Math. Problems Eng. 1, 1–13. doi:10.1155/2018/9463707
Li, X. H., Zhu, X. G., Li, J. S., and Gu, C. (2021). Influence of different industrial agglomeration modes on eco-efficiency in China. Int. J. Environ. Res. Public Health 18 (24), 13139. doi:10.3390/ijerph182413139
Li, X., Lai, X. D., and Zhang, F. C. (2021). Research on green innovation effect of industrial agglomeration from perspective of environmental regulation: Evidence in China. J. Clean. Prod. 288, 125583. doi:10.1016/j.jclepro.2020.125583
Li, Z., Huang, Z., and Su, Y. (2023). New media environment, environmental regulation and corporate green technology innovation: Evidence from China. Energy Econ. 119, 106545. doi:10.1016/j.eneco.2023.106545
Li, Z. H., Zhu, J. H., and He, J. J. (2022). The effects of digital financial inclusion on innovation and entrepreneurship: A network perspective. Electron. Res. Archive 30 (12), 4697–4715. doi:10.3934/era.2022238
Li, Z., Zou, F., and Mo, B. (2021). Does mandatory CSR disclosure affect enterprise total factor productivity? Econ. Research-Ekonomska Istraživanja 35 (1), 4902–4921. doi:10.1080/1331677X.2021.2019596
Liang, X. D., Si, D. Y., Zhang, X. L., Ren, T., Du, X., Chen, Q., et al. (2018). An empirical study on green innovation efficiency in the green institutional environment. Sustainability 10 (3), 724. doi:10.3390/su10030724
Lin, B., and Zhu, J. (2021). Impact of China’s new-type urbanization on energy intensity: A city-level analysis. Energy Econ. 99, 105292. doi:10.1016/j.eneco.2021.105292
Liu, C. Y., Gao, X. Y., Ma, W. L., and Chen, X. T. (2020). Research on regional differences and influencing factors of green technology innovation efficiency of China’s high-tech industry. J. Comput. Appl. Math. 369, 112597. doi:10.1016/j.cam.2019.112597
Liu, F. Y., and Liu, C. Z. (2019). Regional disparity, spatial spillover effects of urbanisation and carbon emissions in China. J. Clean. Prod. 241, 118226. doi:10.1016/j.jclepro.2019.118226
Liu, X. P., and Zhang, X. L. (2021). Industrial agglomeration, technological innovation and carbon productivity: Evidence from China. Resour. Conservation Recycl. 166, 105330. doi:10.1016/j.resconrec.2020.105330
Liu, Y., Failler, P., and Ding, Y. (2022a). Enterprise financialization and technological innovation: Mechanism and heterogeneity. PLoS ONE 17 (12), e0275461. doi:10.1371/journal.pone.0275461
Liu, Y., Failler, P., and Liu, Z. (2022b). Impact of environmental regulations on energy efficiency: A case study of China’s air pollution prevention and control action plan. Sustainability 14 (6), 3168. doi:10.3390/su14063168
Liu, Y., Li, Z., and Xu, M. (2020). The influential factors of financial cycle spillover: Evidence from China. Emerg. Mark. Finance Trade 56 (6), 1336–1350. doi:10.1080/1540496x.2019.1658076
Luo, X., and Zhang, W. Y. (2021). Green innovation efficiency: A threshold effect of research and development. Clean Technol. Environ. Policy 23, 285–298. doi:10.1007/s10098-020-01977-x
Luo, Y. S., Salman, M., and Lu, Z. N. (2021). Heterogeneous impacts of environmental regulations and foreign direct investment on green innovation across different regions in China. Sci. Total Environ. 759, 143744. doi:10.1016/j.scitotenv.2020.143744
Lv, C. C., Shao, C. H., and Lee, C. C. (2021). Green technology innovation and financial development: Do environmental regulation and innovation output matter? Energy Econ. 98, 105237. doi:10.1016/j.eneco.2021.105237
Mendonca, S. (2009). Brave old world: Accounting for 'high-tech' knowledge in 'low-tech' industries. Res. Policy 38 (3), 470–482. doi:10.1016/j.respol.2008.10.018
Mori, T., and Smith, T. E. (2015). On the spatial scale of industrial agglomerations. J. Urban Econ. 89, 1–20. doi:10.1016/j.jue.2015.01.006
Ostergaard, C. R., and Park, E. (2015). What makes clusters decline? A study on disruption and evolution of a high-tech cluster in Denmark. Reg. Stud. 49 (5), 834–849. doi:10.1080/00343404.2015.1015975
Ozcan, S., and Islam, N. (2014). Collaborative networks and technology clusters - the case of nanowire. Technol. Forecast. Soc. Change 82, 115–131. doi:10.1016/j.techfore.2013.08.008
Pei, Y., Zhu, Y. M., Liu, S. X., and Xie, M. L. (2021). Industrial agglomeration and environmental pollution: Based on the specialized and diversified agglomeration in the Yangtze River Delta. Environ. Dev. Sustain. 23 (3), 4061–4085. doi:10.1007/s10668-020-00756-4
Prah, G. J. (2022). Innovation and economic performance: The role of financial development. Quantitative Finance Econ. 6 (4), 696–721. doi:10.3934/QFE.2022031
Qiu, D., and Li, D. J. (2021). Comments on the "SSF Report" from the perspective of economic statistics. Green Finance 3 (4), 403–463. doi:10.3934/GF.2021020
Ren, S. Y., and Wu, H. T. (2022). Path to green development: The role environmental regulation and labor skill premium on green total factor energy efficiency. Green Finance 4 (4), 387–410. doi:10.3934/GF.2022019
Rennings, K. (2000). Redefining innovation — Eco-innovation research and the contribution from ecological economics. Ecol. Econ. 32 (2), 319–332. doi:10.1016/s0921-8009(99)00112-3
Schiff, N. (2015). Cities and product variety: Evidence from restaurants. J. Econ. Geogr. 15, 1085–1123. doi:10.1093/jeg/lbu040
Semenenko, I., Bilous, Y., and Halhash, R. (2022). The compliance of the regional development strategies and funding with the sustainable development concept: The case of Ukraine. Green Finance 4 (2), 159–178. doi:10.3934/GF.2022008
Shen, T. T., Li, D. J., Jin, Y. Y., and Li, J. (2022). Impact of environmental regulation on efficiency of green innovation in China. Atmosphere 13 (5), 767. doi:10.3390/atmos13050767
Shuen, A., Feiler, P. F., and Teece, D. J. (2014). Dynamic capabilities in the upstream oil and gas sector: Managing next generation competition. Energy Strategy Rev. 3, 5–13. doi:10.1016/j.esr.2014.05.002
Simonen, J., Svento, R., and Juutinen, A. (2015). Specialization and diversity as drivers of economic growth: Evidence from High-Tech industries. Pap. Regional Sci. 94 (2), 229–247. doi:10.1111/pirs.12062
Song, Z. M., and Zhang, N. (2020). Research on green innovation efficiency of ListedChinese energy companies based on triple bottom line. Complexity 2020, 3450471. doi:10.1155/2020/3450471
Tsuji, C. (2022). The meaning of structural breaks for risk management: New evidence, mechanisms, and innovative views for the post-COVID-19 era. Quantitative Finance Econ. 6 (2), 270–302. doi:10.3934/QFE.2022012
Wang, M. X., Li, L., and Lan, H. Y. (2021). The measurement and analysis of technological innovation diffusion in China's manufacturing industry. Natl. Account. Rev. 3 (4), 452–471. doi:10.3934/NAR.2021024
Wang, M. X., Li, Y. L., and Liao, G. K. (2022). Spatial spillover and interaction between high-tech industrial agglomeration and urban ecological efficiency. Front. Environ. Sci. 10, 829851. doi:10.3389/fenvs.2022.829851
Wang, W. X., Yu, B., Yan, X., Yao, X. L., and Liu, Y. (2017). Estimation of innovation’s green performance: A range-adjusted measure approach to assess the unified efficiency of China’s manufacturing industry. J. Clean. Prod. 149, 919–924. doi:10.1016/j.jclepro.2017.02.174
Wu, J. Z., Ge, Z. M., Han, S. Q., Xing, L. W., Zhu, M. S., Zhang, J., et al. (2020). Impacts of agricultural industrial agglomeration on China’s agricultural energy efficiency: A spatial econometrics analysis. J. Clean. Prod. 260, 121011. doi:10.1016/j.jclepro.2020.121011
Wu, K., You, K. R., Ren, H., and Gan, L. (2022). The impact of industrial agglomeration on ecological efficiency: An empirical analysis based on 244 Chinese cities. Environ. Impact Assess. Rev. 96, 106841. doi:10.1016/j.eiar.2022.106841
Xu, D., Yu, B., and Liang, L. N. (2022). High-tech industrial agglomeration and urban innovation in China’s Yangtze River Delta Urban Agglomeration: From the perspective of industrial structure optimization and industrial attributes. Complexity 2022, 1–14. doi:10.1155/2022/2555182
Xu, Y., Li, X. Y., Tao, C. Q., and Zhou, X. (2022). Connected knowledge spillovers, technological cluster innovation and efficient industrial structure. J. Innovation Knowl. 7 (3), 100195. doi:10.1016/j.jik.2022.100195
Zandiatashbar, A., and Hamidi, S. (2021). Transportation amenities and high-tech firm location: An empirical study of high-tech clusters. Transp. Res. Rec. 2675 (12), 820–831. doi:10.1177/03611981211031219
Zeng, J. Y., Skare, M., and Lafont, J. (2021). The co-integration identification of green innovation efficiency in Yangtze River Delta region. J. Bus. Res. 134, 252–262. doi:10.1016/j.jbusres.2021.04.023
Zeng, W. P., Li, L., and Huang, Y. (2021). Industrial collaborative agglomeration, marketization, and green innovation: Evidence from China’s provincial panel data. J. Clean. Prod. 279, 123598. doi:10.1016/j.jclepro.2020.123598
Zhang, J. X., Kang, L., Li, H., Ballesteros-Perez, P., Skitmore, M., and Zuo, J. (2020). The impact of environmental regulations on urban Green innovation efficiency: The case of Xi’an. Sustain. Cities Soc. 57, 102123. doi:10.1016/j.scs.2020.102123
Zhang, M. D., Wu, Q. B., Li, W. L., Sun, D. Q., and Huang, F. (2021). Intensifier of urban economic resilience: Specialized or diversified agglomeration? PLoS ONE 16 (11), e0260214. doi:10.1371/journal.pone.0260214
Zhang, M. F., Hong, Y. X., Wang, P., and Zhu, B. Z. (2022). Impacts of environmental constraint target on green innovation efficiency: Evidence from China. Sustain. Cities Soc. 83, 103973. doi:10.1016/j.scs.2022.103973
Zhang, W. X., Wang, B., Wang, J., Wu, Q., and Wei, Y. D. (2022). How does industrial agglomeration affect urban land use efficiency? A spatial analysis of Chinese cities. Land Use Policy 119, 106178. doi:10.1016/j.landusepol.2022.106178
Zhao, N., Liu, X. J., Pan, C. F., and Wang, C. Y. (2021). The performance of green innovation: From an efficiency perspective. Socio-Economic Plan. Sci. 78, 101062. doi:10.1016/j.seps.2021.101062
Zhao, P. J., Zeng, L. E., Lu, H. Y., Zhou, Y., Hu, H. Y., and Wei, X. Y. (2020). Green economic efficiency and its influencing factors in China from 2008 to 2017: Based on the super-SBM model with undesirable outputs and spatial Dubin model. Sci. Total Environ. 741, 140026. doi:10.1016/j.scitotenv.2020.140026
Zhu, J. H., and Li, Z. H. (2021). Can digital financial inclusion effectively stimulate technological innovation of agricultural enterprises?—a case study on China. Natl. Account. Rev. 3 (4), 398–421. doi:10.3934/NAR.2021021
Keywords: green innovation efficiency, high-tech industrial agglomeration, specialized agglomeration, diversified agglomeration, spatial econometrics
Citation: Liu S and Wu P (2023) The impact of high-tech industrial agglomeration on China’s green innovation efficiency: A spatial econometric analysis. Front. Environ. Sci. 11:1167918. doi: 10.3389/fenvs.2023.1167918
Received: 17 February 2023; Accepted: 20 March 2023;
Published: 29 March 2023.
Edited by:
Yuantao Xie, University of International Business and Economics, ChinaReviewed by:
Zhenghui Li, Guangzhou University, ChinaAnlu Zhang, Huazhong Agricultural University, China
Copyright © 2023 Liu and Wu. This is an open-access article distributed under the terms of the Creative Commons Attribution License (CC BY). The use, distribution or reproduction in other forums is permitted, provided the original author(s) and the copyright owner(s) are credited and that the original publication in this journal is cited, in accordance with accepted academic practice. No use, distribution or reproduction is permitted which does not comply with these terms.
*Correspondence: Shucheng Liu, MTg2NjgwNjE4NTFAMTYzLmNvbQ==