 Jing Li
 Shu-Hua Chen
- Department of Land, Air, and Water Resources, University of California, Davis, CA, United States
The Gobi Desert in East Asia experiences dust outbreaks during the spring, which are often caused by high winds associated with Mongolian cyclones. The radiative forcing that arises from dust aerosols could affect the intensity and movement of Mongolian cyclones and cold fronts. A case study on a Mongolian cyclone that occurred during 18–22 March 2010 in East Asia examines these factors using an atmosphere-dust coupled model. Our numerical results show that dust’s impact on the intensity of the cyclone and its cold front varies between day and night and depends on the relative position of the weather systems of interest to the dust plume, i.e., the edge or the main dust plume region. When the dust plume approaches the cold front, most of the dust is trapped behind the cold front at low levels, but a small amount of dust extends to the middle levels, thereby reaching the warm side of the middle-level front. As a result, dust weakens the intensity of the low-level front and intensifies the middle-level front during the daytime, modifying the cold front oppositely at night. On the other hand, dust influences the cyclone in two phases. During the first phase, the dust plume edge arrives at the center of the cyclone in the daytime and warms the region, slightly intensifying the cyclone. During the second phase, the major dust plume feeds into the cyclone center in the early morning. The net dust effect is negative, which cools the cyclone center and decreases or stops the intensification. Subsequently, the cyclone is taken over by a nearby cyclonic circulation downstream. The dust plume approaches the new cyclone center, which repeats a similar pattern of intensity change: intensifying and then leveling off. Our results show that dust has no apparent influence on the movement of the cyclone and its cold front for this case study.
1 Introduction
Mineral dust is a key component of the Earth system, influencing the energy budget, ecological environments, as well as the health of human beings. Dust can cause severe air pollution and increase the rate of respiratory mortality (Mallone et al., 2011). Significant dust events also have a substantial economic impact, since dust-induced low visibility can affect air traffic, road transportation, and military operations (Knippertz and Stuut, 2014).
In addition to environmental and health issues, dust impacts weather and climate through different dynamical and thermodynamic processes. Once the dust is emitted into the atmosphere, it scatters and absorbs the solar and terrestrial radiation, and additionally, it re-emits outgoing terrestrial radiation, both together directly modifying the energy budget of the atmosphere and the surface (Heinold et al., 2008; Cherian et al., 2010; Han et al., 2013; Chen et al., 2015; Grogan et al., 2016; Bercos-Hickey et al., 2017; Grogan et al., 2017; Nathan et al., 2017; Chen et al., 2021). Moreover, dust particles can act as cloud condensation nuclei (CCN) and ice nuclei (IN) and thus change cloud properties, such as cloud particle effective radius, hydrometeors, coverage, thickness, lifecycle, etc., indirectly modifying the energy budget (Alizadeh Choobari et al., 2014; Li et al., 2017; Shi and Liu, 2019; Zhao et al., 2022). In consequence, dust changes the atmospheric heating rates and the hydrological cycle (Miller et al., 2004). Dust radiative forcing reduces surface wind speeds and atmospheric dust load, corresponding to a decreased surface dust flux (Perlwitz et al., 2001; Chen et al., 2021). The reduction of surface wind speed is attributed to the dust-induced stabilization of the planetary boundary layer (PBL), leading to a reduction of vertical turbulent mixing of momentum within the PBL (Miller et al., 2004; Perez et al., 2006; Chen et al., 2021). Studies have shown that the stabilization of the PBL and the reduction of the vertical mixing by dust has led to intensified Low-Level Jets (LLJs) in the Bodélé area in North Africa (Heinold et al., 2008) and low-level barrier jet over the Hexi Corridor in Central China (Chen et al., 2021). Remy et al. (2014) reported on a mechanism that the dust radiative forcing could increase the atmospheric dust load by modifying the boundary-layer stability over the Sahara and the eastern Mediterranean area in spring. This is due to a lower magnitude contribution by the shortwave radiation at daytime than by the longwave radiation at nighttime. The larger down-welling longwave flux at night causes a warmer surface temperature, which in turn results in a less stable thermal stratification, and eventually increases the surface wind speed and dust load.
Dust storms often pass into the vicinity of weather systems during their lifetimes. Thus, the direct and indirect radiative effects of dust are connected to a variety of weather phenomena over different regions of the world. In North Africa, studies have shown that Saharan dust can influence weather systems over North Africa and the Atlantic Ocean, such as changing the movement of Hurricane Helene (Chen et al., 2015), affecting African easterly jet (AEJ) intensity (Chen et al., 2010) and African easterly waves (AEW) growth (Grogan et al., 2016; Grogan et al., 2017; Nathan et al., 2017), decreasing the West African monsoon rainfall (Zhao et al., 2011), strengthening the tropical rain belt over the Middle East and North Africa, and shifting the rain bands northward (Bangalath and Stenchikov, 2015; Bercos-Hickey et al., 2017). In addition, Saharan dust can be transported a long distance, reaching the Pacific Ocean, and potentially modify mixed-phase cloud processes, which can alter the development of winter storms and influence the precipitation amount and distribution in the western United States (Creamean et al., 2013). Near North Africa, an intensive dust storm in the Arabian Peninsula was identified to be related to the cyclogenesis over the Empty Quarter Desert (Francis et al., 2021), and the interplay between the cyclone and the dust helps the development of convective clouds.
In East Asia, the major dust resources are the Gobi Desert in Mongolia and Northern China and the Taklimakan Desert in Western China (Sun et al., 2001). Studies have shown that Asian dust outbreaks are often connected to Mongolian cyclones during spring (Sun et al., 2001; Liu et al., 2004; Zhao and Zhao, 2006; Lee et al., 2012; Cuesta et al., 2015; Gui et al., 2022). Mongolian Cyclones are mid-latitude cyclones that are usually initiated near the Gobi Desert. A large amount of dust can be lifted up by strong surface winds associated with Mongolian cyclones and transported downstream by prevailing winds and cyclones. In addition, the progression of the dust plumes across East Asia is closely related to the advance of the cold fronts associated with these cyclones.
While many studies have focused on the dust activity in East Asia (Liu et al., 2004; Ahn et al., 2007; Wang et al., 2010; Lee et al., 2012; Cuesta et al., 2015; Chen et al., 2021) only a small number of studies have specifically examined the effects of dust on weather systems (Wang et al., 2010; Chen et al., 2021). Wang et al. (2010) developed a dust radiative parameterization scheme to study the dust direct radiative effect on the energy budget for a typical dust storm that occurred on 16–18 April 2006 in East Asia. Their study shows that at daytime the dust radiative effect decreased the temperature in the lower dust layers, but increased the temperature in the upper dust layers. In consequence, the surface pressure rose and the low-level wind weakened. Eventually, the Mongolian cyclone weakened. However, Wang et al. (2010) did not consider the dust impact on the cyclone at night or its impact on the cold front, as dust often resides behind the cold front. Cuesta et al. (2015) showed that during the eastward transport of a dust plume, dust could be lifted near the core of the cyclone and extended down to the surface, but they only focused on the dust distribution rather than the impact of dust on the cyclone and cold front activities. The impact of the dust radiative effect on Mongolian cyclone development has not received enough attention and it requires more investigation.
The central objective of this study is to use an atmosphere-dust coupled model (Chen et al., 2010, 2015) to investigate the impact of dust spatial distribution and the dust radiative effect on the development of a Mongolian cyclone and its cold front activities at both day and night. The paper is organized as follows: in Section 2, satellite observations and reanalysis data are used to depict this dust event. A brief introduction of the dust model, that is, used for numerical experiments is also provided in Section 2. In Section 3, we present the analysis of how the mineral dust radiative effect influences the energy budget, boundary layer characteristics, wind speed, and the feedback to the dust emission, as well as the impact on the development of cyclone and its cold front. In Section 4, a brief summary is given.
2 Materials and methods
2.1 The Mongolian cyclone and the dust storm event during 18–22 March 2010
The dust storm that occurred from 18 to 22 March was the strongest dust storm event in spring 2010. From late 18 March, a large amount of dust was emitted into the atmosphere by strong surface winds associated with a Mongolian cyclone. Figures 1A, B show that the dust plume started from the Gobi Desert region (the red box in Figure 1A) and transported southeastward. While dust concentration observations were available over the target area (Wu et al., 2016), in this study, we verified the amount of dust using the aerosol optical depth (AOD) from Moderate Resolution Imaging Spectroradiometer (MODIS) onboard Aqua and Terra Satellites. This allowed us to better compare the spatial distribution of the dust plume. Note that other non-dust aerosols can also contribute to AOD, in particular over the downstream of the source desert areas. During this event, high AOD (>3) was observed over the Gobi Desert and Qinghai and Gansu Provinces in China (Loess Plateau) (Figures 1C, D). The dust plume was transported from Inner Mongolia far to the southeast, reaching Taiwan, Korea, and Japan. The thick dust plume significantly worsened the air quality and reduced visibility. China, Taiwan, Japan, and Korea monitored a significant increase of the PM10 (particular matter with a diameter of 10 microns or smaller) concentration during this event. In China, air pollution in several regions reached the Level 5 hazard, which was considered an extreme air pollution event. Many flights in Beijing were delayed or canceled. Air pollution readings in Hong Kong reached at least 15 times the recommended maximum levels by the World Health Organization. Taiwan reported a new record for the worst sandstorm conditions; the average concentration of PM10 within 10 h exceeded
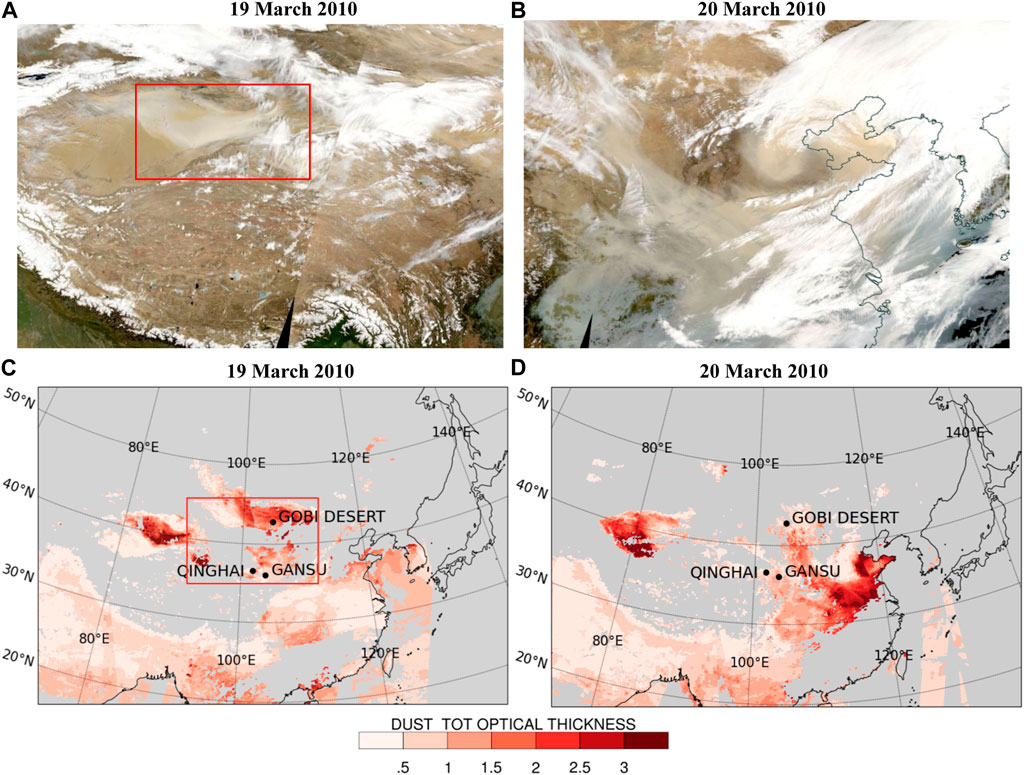
FIGURE 1. (A,B) Visible surface reflectance and (C,D) 550 nm aerosol optical depth (AOD) satellite images on 19 and 20 March, 2010. The AOD data (version 6.1) are from MODIS onboard Aqua and Terra satellites. The red boxes indicate the region where a high dust amount was emitted. Note that the plotting area in (C,D) is the domain 2 region.
The dust storm of interest originated near a Mongolian cyclone, which was formed around
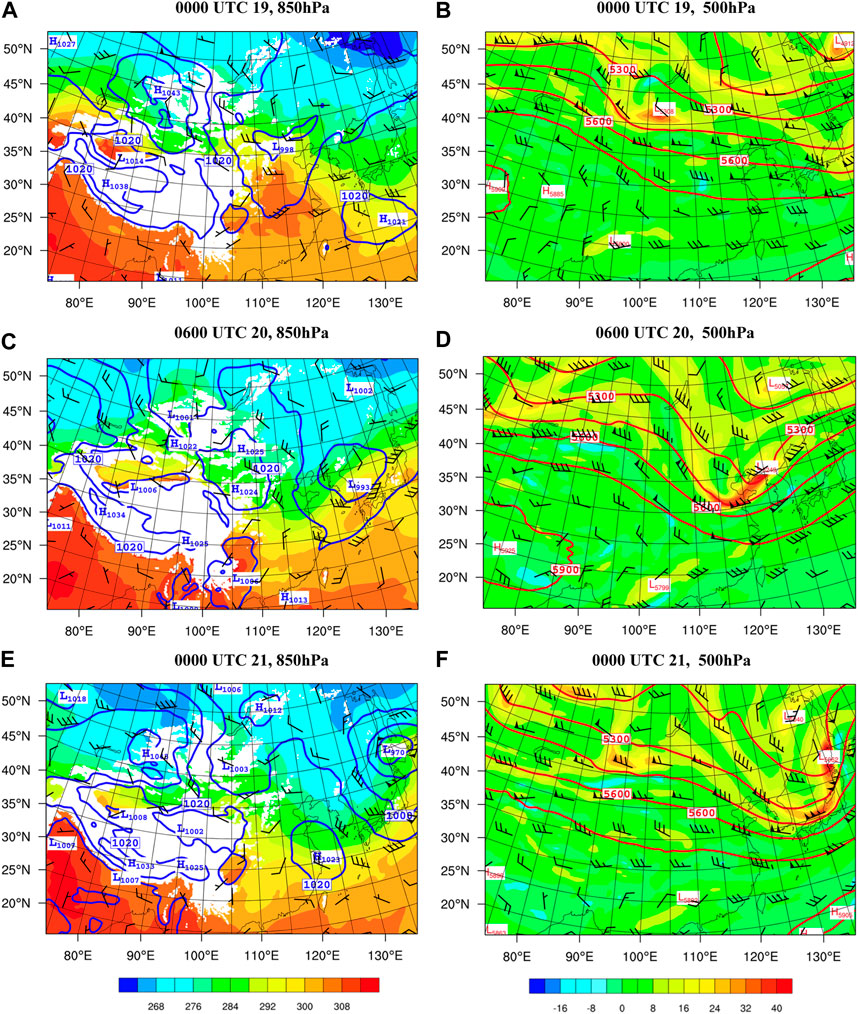
FIGURE 2. The FNL analyses of sea level pressure (hPa; blue contours), 850-hPa wind barbs (kts), and potential temperature (K; shaded) at (A) 0000 UTC 19, (C) 0600 UTC 20, and (E) 0000 UTC 21 March 2010. (B,D,F) show the FNL analyses of 500-hPa geopotential height (m; contours), wind barbs, and absolute vorticity (10−5s−1; shaded) at 0000 UTC 19, 0600 UTC 20, and 0000 UTC 21 March 2010, respectively.
While the Mongolian cyclone started forming on 18 March at the eastern Gobi Desert, a high-pressure system already existed to the northwest of the cyclone (Figure 2A). The high-pressure gradient between the high and the Mongolian cyclone induced strong near-surface winds, which caused a significant amount of dust emission over the Gobi Desert. This is evidenced by the high AOD (∼3) observed 1 day later on 19 March (the red box in Figure 1C). More discussion on the Mongolian cyclone and the high-pressure system is given in Section 3.1.
2.2 Model description
An online dust model that was developed based on the Weather Research and Forecasting (WRF) model (called WRF-Dust) (Chen et al., 2010; Chen et al., 2015) was used to assess the impact of the dust distribution and radiative effect on the development and movement of the Mongolian cyclone and its associated cold front at both day and night during 18–22 March 2010. In addition, the impact of dust on the boundary layer development and its feedback to dust emission was also evaluated. The WRF-Dust model is a compressible, non-hydrostatic model. The model uses the Runge-Kutta third order time scheme due to its higher order accuracy in time discretization, the allowance of a larger time step (i.e., a 1.73 current number) to remain model’s instability, and the requirement of only two-time level data for prognostics variables. The high-order advection schemes are available in the WRF model, and in this study, the fifth and third schemes in horizontal and vertical directions were chosen, respectively. A lower order accuracy scheme is used in the vertical direction since the resolution in the vertical direction is much higher than that in the horizontal direction. The WRF-Dust model considers the processes of dust emission, advection, sedimentation, wet scavenging, radiation interactions, and microphysical processes. The dust is integrated into a specific suite of physics schemes, which are used in the study (see Section 2.3). Once dust is emitted, it is advected and transported throughout the model, according to the standard set of the WRF governing equations, which are written in the flux form.
The WRF-Dust model includes five dust bins, centered at radii of 0.25, 0.5, 1, 2, and 4 μm. Dust emission flux (E) in the WRF-Dust model follows Tegen and Fung (1994), and E = max [α(u10 − u10c) x u102, 0], where α (= 0.4 μg m2s−5) is a dimensional constant, u10 is 10-m wind speed, and u10c (=6.5 m s−1) is the threshold of 10-m wind speed. The dust emission occurs when the vegetation type is barren (e.g., desert), the soil volumetric moisture less than 0.2, and a 10-m wind speed stronger than 6.5 m s−1 (Chen et al., 2015). The dust optical properties—single-scattering albedo, asymmetry parameter, and extinction coefficient—with respect to different wavelengths for both shortwave and longwave radiation and particle sizes are calculated using the Optical Properties of Aerosols and Cloud (OPAC) software package (Hess et al., 1998). These dust optical coefficients are then implemented as look-up tables in the Goddard shortwave and longwave radiation schemes (Chou et al., 1999; Chou et al., 2001).
The WRF-Dust model (Chen et al., 2015; Huang et al., 2019), instead of the WRF-Chemistry (WRF-Chem) model, is used in this study due to the two following reasons. First, from our previous experience, the dust simulations using both models are comparable, but WRF-Chem requires more computational time. Second, the dust-physics processes in WRF-Dust were developed by the authors and their collaborators, and thus these dust processes are more consistent in the model.
2.3 Experimental design
In this study, two experiments were conducted: with (DON) and without (DOFF) the dust-radiation interaction being the only difference between the two experiments. Note that only the dust-radiation effect is evaluated in this study because of two reasons. First, studies have shown that under a severe dust event with AOD greater than 1, the dust-radiation effect has a far greater influence than the dust-cloud effect on mesoscale convective systems (Shi et al., 2014; Huang et al., 2019). Second, more studies have focused on the dust-radiation interaction (Ahn et al., 2007; Heinold et al., 2008; Han et al., 2013; Shi et al., 2014; Bangalath and Stenchikov, 2015; Chen et al., 2015; Chen et al., 2021; and many others) than the dust-cloud interaction (Cheng et al., 2010; Li et al., 2017; Huang et al., 2019; Francis et al., 2021), in which the latter potentially possesses a larger uncertainty.
The physics schemes that were used in both simulations include: Cheng two-moment microphysics scheme (Cheng et al., 2010), Goddard shortwave and longwave radiation schemes (Chou et al., 1999; Chou et al., 2001), Medium Range Forecast (MRF) boundary layer scheme, and Kain-Fritsch cumulus scheme. Note that the dust-cloud interaction, in which dust particles can serve as CCN and IN (Huang et al., 2019), and dust wet scavenging are included in both experiments.
For both simulations, the WRF-Dust model was integrated for 5 days, starting from 0000 UTC 16 to 0000 UTC 21 March 2010, covering the time period when significant dust emission and long-range transport occurred over East Asia. The FNL 6-hourly analysis, with a resolution of 1° × 1°, was used to provide initial and boundary conditions for WRF-Dust simulations. Two nested domains with two-way interaction were configured. The resolutions for domains 1 and 2 were 36 and 12 km, respectively. The outer domain mainly covers East Asia, and the inner domain covers eastern China and the Gobi Desert. Thirty-seven vertical levels with stretched spacing grids, with a higher resolution in the lower troposphere, were used for both domains. Note that the dust event started from 18 March and our major interest period is during 19–20 March. Thus, this gives the model enough time to simulate the influence of dust on the development of the cyclone and its cold front.
3 Results and discussion
3.1 Synoptic-scale and AOD analysis and evaluation - DON
The model performance was first evaluated by comparing the simulation results of the DON experiment with FNL data. In general, the model synoptic-scale patterns at sea level, 850 hPa, and 500 hPa from DON showed a reasonable agreement with FNL analysis at 0000 UTC 19 March 2010 after a 72-h integration, but discrepancies existed (Figure 2 versus Figure 3). At 850 hPa, high winds—which were around
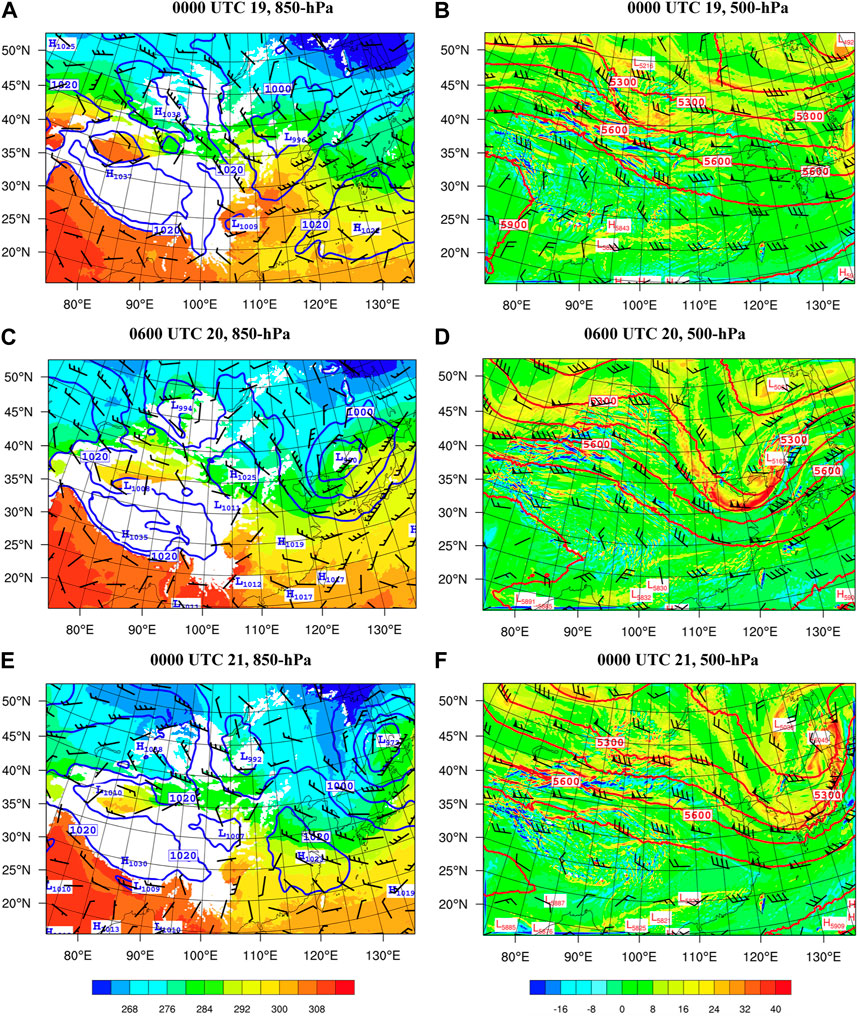
FIGURE 3. The same information as in Figure 2, except from the DON simulation.
The SLP at the center of the FNL cyclone intensified slightly after 0000 UTC 19 March, but started weakening 6 h later (i.e., 0600 UTC) until 1800 UTC 19 March with a SLP of 999 hPa. Its intensity then remained constant for 6 h and started rapidly intensifying after 0000 UTC 20 March; the SLP reached 970 hPa at 0000 UTC 21 March (Figure 2E). Unlike the FNL cyclone, the DON cyclone continued intensifying after 0600 UTC 19 March and the intensifying rate increased with time. The cyclone reached 987 hPa at 0000 UTC 20 March. Although both FNL and DON had a similar intensification rate in the previous 6 h, at 0600 UTC 20 March, the cyclone in DON had already developed stronger than that in FNL (993 hPa in FNL in Figure 2C and 980 hPa in DON in Figure 3C).
When the FNL cyclone weakened slightly from 0600 UTC to 1800 UTC 19 March, there was no large-scale support from low-level warm temperature advection and mid-level positive vorticity advection (PVA) (e.g., at 500 hPa). Although the surface system was located at the downstream side of a 500-hPa shortwave (∼3,000 km) trough, it was too much further south outside the major 500-hPa PVA region. On the other hand, while the cyclone in DON was also located at the downstream side of the 500-hPa trough, it was incorrectly shifted northward, close to the area underneath the 500-hPa PVA region, and thus intensified. After 0000 UTC 20 March, the cyclones in both DON and FNL were located beneath the 500-hPa PVA (or the positive vertical differential vorticity advection with height) region at the downstream of the mid-level trough and consistently intensified. At 0600 UTC 20 March, DON cyclone was 13 hPa more intense than FNL cyclone (Figure 3C versus Figure 2C). The vertical differential vorticity advection was the main mechanism explaining why both cyclones intensified (Figure 2D versus Figure 3D).
The high-pressure system in FNL weakened from 1,043 hPa at 0000 UTC 19 March (Figure 2A) to 1,032 hPa at 0000 UTC 20 March (figure not shown). As stated earlier, the high-pressure system in DON was weaker than that in FNL (1,038 hPa versus 1,043 hPa) at 0000 UTC 19 March. The center of the model high-pressure system weakened to 1,027 hPa at 0000 UTC 20 March with a similar weakening rate to that in FNL. However, during the following 6 hours the development of the high-pressure system was very different between DON and FNL: the former experienced a lower weakening rate than the latter (changed 2 hPa versus 7 hPa within 6 h). This is because the FNL high was beneath the mid-level PVA region. Although the high-pressure system was located beneath the upstream of the trough, where usually negative curvature vorticity advection dominates for a short Rossby wave, PVA was observed due to strong positive shear vorticity occurring at its upstream. For DON, this PVA mechanism was much weaker, and the weakening of the high-pressure system was much slower. At 0600 UTC 20 March, the high-pressure systems in both FNL and DON became quite comparable (1,025 hPa in both FNL and DON). After 0600 UTC 20 March, the system in FNL weakened slowly until 0000 UTC 2100 March (Figure 2E).
As a result of the development of both high- and low-pressure systems described above, stronger winds between the two synoptic-scale systems were obtained in DON at 0600 UTC 20 March due to a stronger pressure gradient. At 0000 UTC 21 March, the cyclone intensity in DON was very comparable to that in FNL (972 hPa in DON versus 970 hPa in FNL) and so did model’s 500-hPa vorticity. The positions of the cyclone were similar between DON and FNL (Figure 3E versus Figure 2E).
Comparing the aerosol optical depth (AOD) between DON (Figure 4A) and MODIS observation (Figure 1C) on 19 March, the patterns and locations from both were again similar. The highest AODs were within
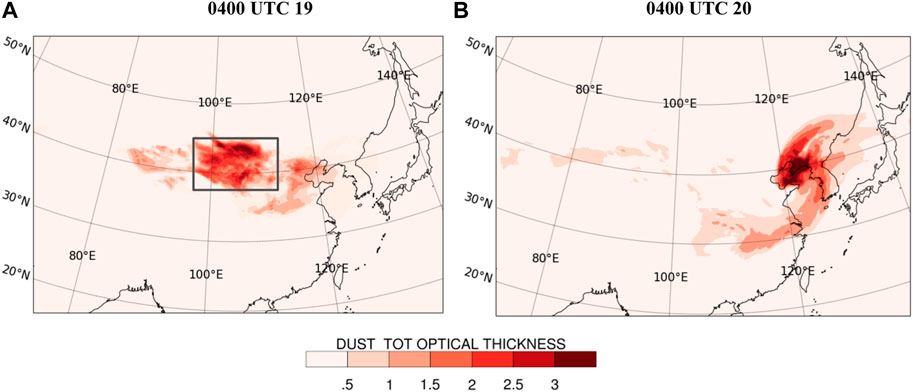
FIGURE 4. Aerosol optical depth (unitless) at (A) 0400 UTC 19 March and (B) 0400 UTC 20 March 2010 from DON.
Simulated dust moved from southern Mongolia to Inner Mongolia, Qinghai, Gansu province in China, East China, and Northeast China. Strong dust emission was found over the western-central Inner Mongolia, the eastern part of Northwest China and Qaidam Basin, with the maximum integrated total dust mass greater than 12 g m−2. This pattern is consistent with Wu et al. (2016), where they performed multiple simulations for the same dust event using the Community Earth System Model (CESM) and thoroughly evaluated the results with observations to investigate the impact of surface roughness elements.
Although the time evolutions of the low- and high-pressure systems between FNL and DON were different, since our focus is the dust radiative effect on the Mongolian cyclone and cold front development, as well as on their diurnal variation, the synoptic-scale patterns and AOD results obtained in DON are reasonable enough for the investigation of the dust radiative effect on the development of the cold front and Mongolian cyclone. Moreover, since the dust was advected from the cold air side of the cold front into the cyclone and right behind the cold front during 19–20 March, our analysis below focuses on this particular time period and we consider 0000 UTC—1200 UTC as local daytime.
3.2 Dust radiative effect on the energy budget and temperature
Dust absorbs and scatters shortwave and longwave radiation and emits longwave radiation, directly modifying the energy and temperature in the atmosphere and on the surface. Since the net effect of dust-radiation interaction is different from day to night as only longwave radiation operates at night, the impacts of dust on the energy and temperature during day and night are analyzed separately.
Figure 5 shows the SLP and the column-integrated dust field at different times from the DON experiment. A large amount of dust was emitted into the air by strong surface winds due to the high-pressure gradient discussed earlier. At 0800 UTC 19 March, the major dust plume was oriented in the west-southwest to east-northeast direction behind the cold front (Figure 5A). At this time, the dust plume was still away from the surface cold front and the center of the cyclone. Note that the dust at the warm side of the cold front was emitted from a different source region, the Hexi Corridor, on 17 March (Chen et al., 2021). With strong winds and the convergence flow at low levels, the dust plume was quickly advected to the center of the cyclone at 1800 UTC 19 March (figure not shown). At 2200 UTC 19 March, dust filled the center of the cyclone and reached the cold front from behind (Figure 5B). Our discussion about the impact of the dust radiative forcing on meteorological variables and the Mongolian cyclone focuses on 19 and early 20 March when dust propagated around and into the center of the cyclone and reached the cold front. Although the dust-radiation interaction was deactivated in DOFF, dust was still simulated in the experiment and dust-microphysics interaction was activated. DOFF produced a similar spatial and temporal dust distribution. However, it had a higher dust concentration, which is discussed in Section 3.3.
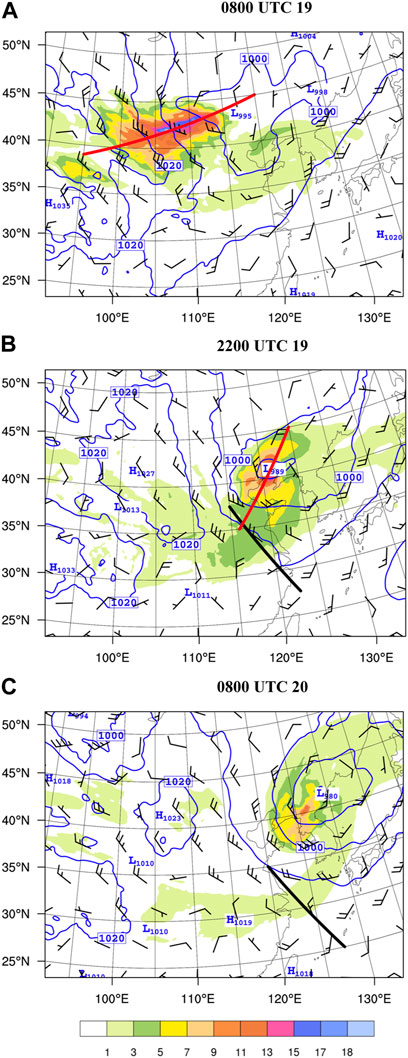
FIGURE 5. Sea level pressure (hPa; blue contours), column integrated total dust mass (g m-2; shaded), and sigma-level-2 wind barbs at (A) 0800 UTC 19, (B) 2200 UTC 19, and (C) 0800 UTC 20 March 2010 from DON. The red lines in (A,B) indicate the locations of the vertical cross sections of Figure 8A, Figures 10A, B and Figure 8B, respectively. The black lines in (B,C) indicate the locations of the vertical cross sections of Figure 9A, Figures 12A, B and Figure 9B, Figures 12C, D, respectively.
Figures 6A–C show the differences between DON and DOFF (DON—DOFF) for the downward surface longwave and net downward surface shortwave radiation fluxes and their summation, respectively, at 0800 UTC on 19 March 2010. Note that this time was chosen to discuss the energy change by dust during the daytime since, at this time, the downward surface longwave flux reached its maximum. Although the net downward surface shortwave flux reached its maximum at 0600 UTC, 2 hours earlier, the value remained large at 0800 UTC. Downward longwave radiative forcing was larger in DON (i.e., positive values), and the maximum difference was about
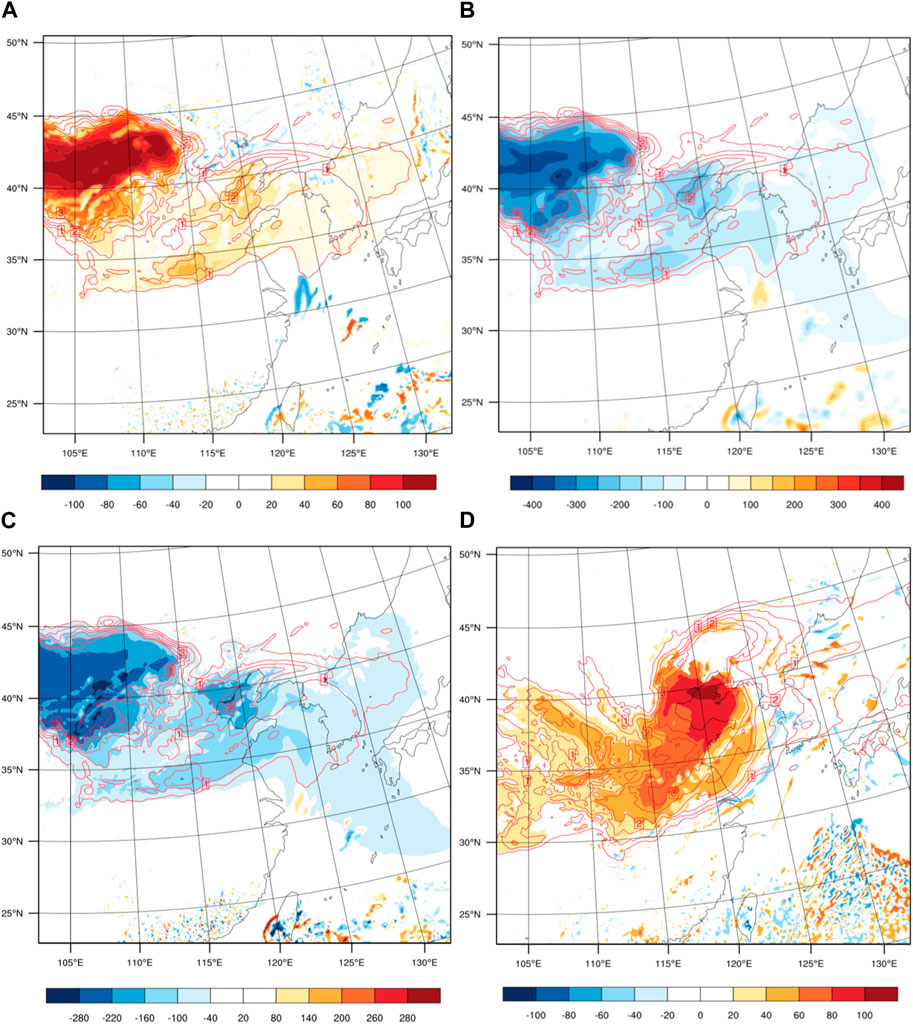
FIGURE 6. Differences of (A) downward surface longwave flux, (B) net downward surface shortwave flux, and (C) the summation of (A,B) (W m−2; shaded) between DON and DOFF (DON-DOFF), overlaid with DON dust aerosol optical depth (unitless; red contours), at 0800 UTC 19 March 2010. (D) The same as (A) except at 2200 UTC 19 March 2010.
During the daytime (e.g., 0800 UTC 19 March), dust-induced negative net downward radiative fluxes at low levels of the dust layer led to a significant cold temperature anomaly over the dust coverage area (e.g., the maximum magnitude about ∼1.6°C at sigma level 3 in Figure 7A). In the nighttime (e.g., 2200 UTC 19 March; Figure 7B), the temperature anomaly was small everywhere except the area where the dust amount was large, and the temperature anomaly was positive (∼2°C) due to the positive dust-longwave radiative forcing. When the height increased, the temperature anomalies caused by dust became quite different. In the daytime, the shortwave absorption became more important, and warm and cold anomalies were present at different locations. For example, at 700 hPa, temperature at most areas in the dust layer increased (
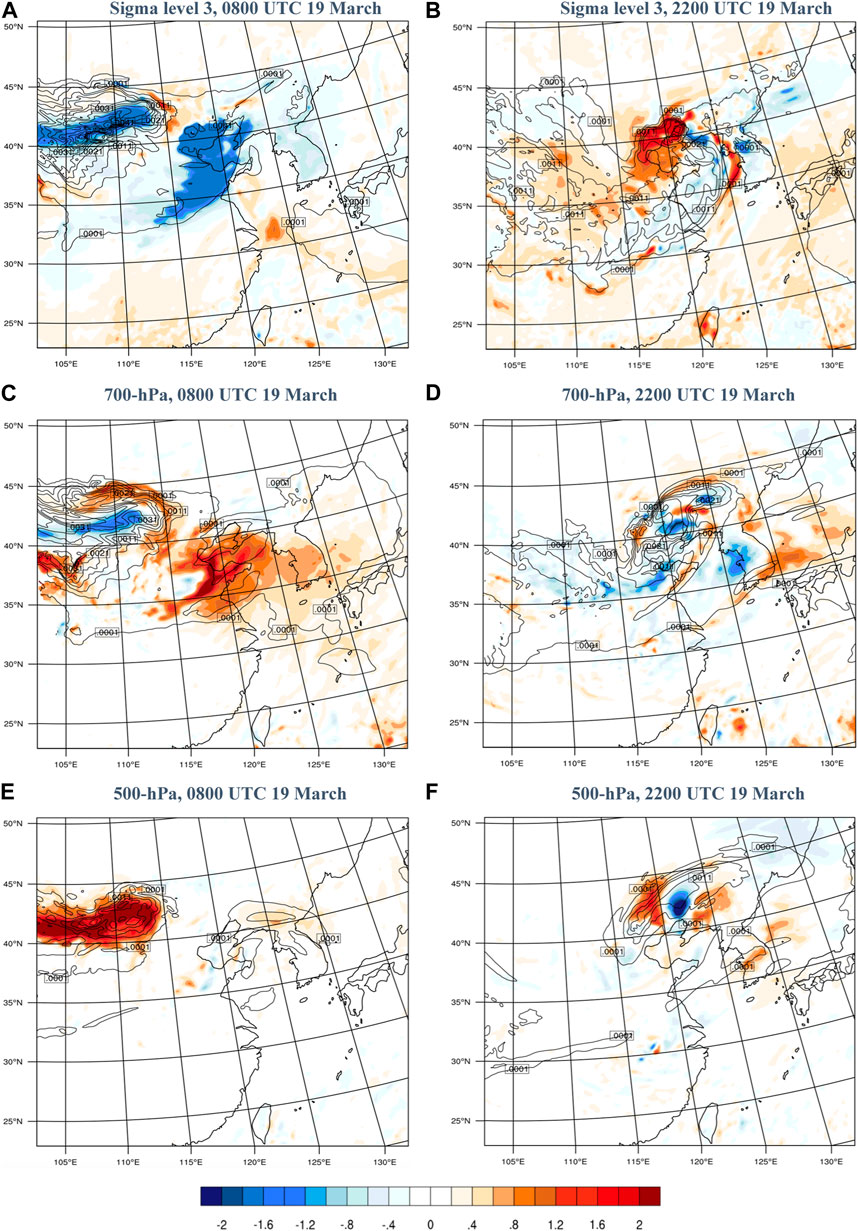
FIGURE 7. Temperature differences (°C; shaded) between DON and DOFF (DON—DOFF) at sigma level 3, overlaid with DON dust mixing ratio (g kg-1; black contours) at (A) 0800 UTC and (B) 2200 UTC 19, March 2010. (C,D) are the same as (A,B), respectively, except at 700 hPa. (E,F) are the same as (A,B), respectively, except at 500 hPa.
Figure 8 shows the vertical cross sections of temperature differences between DON and DOFF passing through the maximum dust concentration region along the elongated dust plume direction. The vertical cross section of temperature can be used to diagnose the stability change by dust. During the daytime at 0800 UTC 19 March (Figure 8A), the heating by dust was observed at the top of the dust plume since these dust aerosols took precedence to absorb incoming solar radiation before passing the energy downward. Beneath the heating, cold temperature anomalies occurred due to a low solar zenith angle in the early spring (i.e., smaller downward shortwave flux when compared to that in summertime) and the absorption and scattering of solar radiation by dust above. As a result, the temperature change by dust in the daytime stabilized the lower atmosphere, as clearly shown in the potential temperature field (blue contours versus red contours in Figure 8A), and thus decreased the boundary layer mixing. This is consistent with other studies (Wang et al., 2010; Chen et al., 2021; Francis et al., 2021). Meanwhile, the dust destabilized the layer right above the maximum heating, but with relatively small percentage due to its large stability (i.e., high positive potential temperature gradient with height). This implies that the impact of the stability change by dust was more significant within the boundary layer, particularly the change of the mixed boundary layer depth. During the nighttime at 2200 UTC (Figure 8B), the temperature anomaly pattern was opposite to that in the daytime and the magnitudes were larger. At night, the longwave radiative cooling occurred in the upper part of the dust plume, while heating occurred at the lower levels (Figure 8B) when the dust plume got into the center of the cyclone (near 121°E, 41°N), where the maximum dust amount was located. In addition, a warm anomaly also occurred above the dust plume. This sandwich temperature anomaly pattern at the center of the cyclone destabilized the layer below 750 hPa and stabilized the layer above.
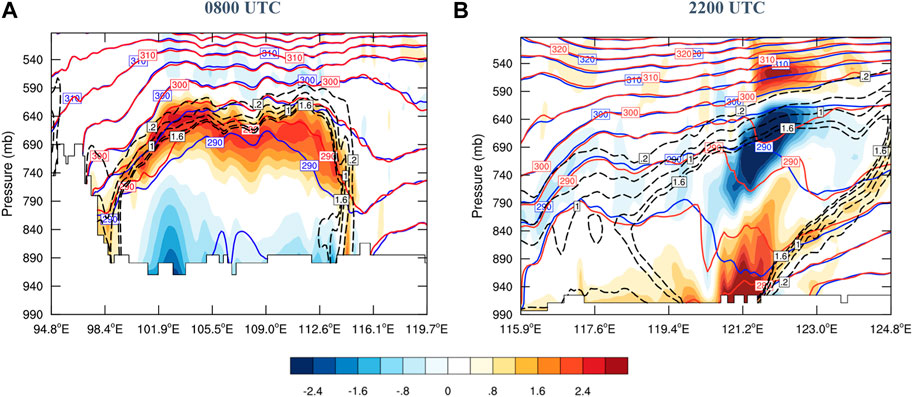
FIGURE 8. The vertical profiles of temperature difference between DON and DOFF (DON-DOFF;
Figures 9A, B show the vertical cross section of temperature differences between DON and DOFF passing through the dust plume edge and the cold front at 2200 UTC 19 and 0800 UTC 20 March 2010, respectively. Different from the maximum dust concentration region, the dust at the dust plume edge (near the surface) cooled the lower atmosphere at night, due to longwave cooling, whereas, due to the dominant dust-shortwave heating, the dust at the plume edge heated the lower atmosphere in the daytime. This dust direct radiative effect at the dust plume edge, with dust situated at low levels, was opposite to that at the maximum dust concentration region, leading to differing dust radiative effects on the cyclone and its cold front. The prominent dark blue shading in front of the dust (significant cooling) at ∼124oE (Figure 9B) was due to the shift of the front. Details are discussed in Section 3.4.
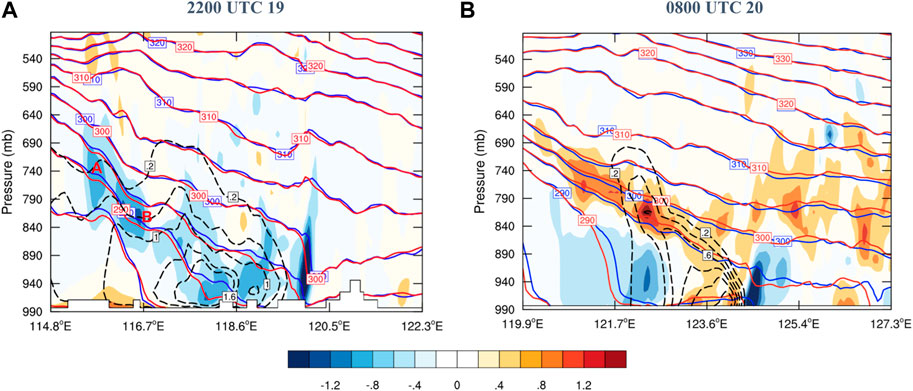
FIGURE 9. The vertical profile of temperature difference (
3.3 Dust radiative effect on PBL, wind field and dust emission in high dust load area
As discussed in Section 3.2, the daytime cooling effect near the surface and the heating effect in the middle troposphere by dust stabilized the lower atmosphere and reduced the boundary layer depth and mixing. Downward momentum transport by the PBL mixing can influence the strength of the surface wind speeds. A more stable lower atmosphere, caused by the dust radiative forcing, decreases the PBL mixing and weakens surface wind near the surface during the daytime. This is due to the reduction of downward momentum transport, which consequently reduces dust emission. As shown in the potential temperature field in blue contours in Figure 10, the PBL height in the DON experiment was lower than that in DOFF. The vertical cross section also clearly shows that stronger winds were mixed deeper down to the surface in DOFF compared to that in DON (Figure 10A versus Figure 10B), because the boundary layer in the latter was stabilized by dust. Dashed black contours in Figure 10 describe the concentration of total dust. The dust concentration decreased significantly with height in DON, due to weaker surface winds and a more stable boundary layer (i.e., difficult to mix and bring dust to higher levels). At night, the opposite processes occurred (not shown here). Increased near surface temperature destabilized the lower atmosphere, which enhanced turbulent mixing and led to slightly stronger surface winds.
FIGURE 10. The vertical cross sections of wind speed (m s-1; shaded), potential temperature (K; blue contours), and dust mixing ratio (mg kg-1; dashed black contours) at 0800 UTC 19 March 2010 from (A) DON and (B) DOFF. The locations of the vertical cross sections are indicated by the red line shown in Figure 5A.
Figure 11 shows time series plots for regional average of 10-m wind speed and surface dust flux on 19 March 2010. The region used to calculate the average was indicated by the black box in Figure 4A. A strong diurnal variation of surface wind speeds is shown in Figure 11A. Both experiments (DON and DOFF) had the same patterns of the wind speed change, largely controlled by the diurnal forcing. The 10-m wind speed started increasing after sunrise until afternoon (Figure 11A). However, the near surface wind peaked at 0800 UCT (4 p.m. LST) without dust and at 0600 UTC (2 h earlier) with dust on 19 March. The wind speed was stronger in DOFF during the day and the largest difference (∼2 m/s) occurred close to sunset (1000 UTC). The surface wind speed rapidly decreased after 0800 UTC (4 p.m. LST) and became much weaker at night because of the stable, shallow boundary layer (i.e., much smaller vertical mixing). At night, DON had a slightly stronger wind speed (∼0.5 m/s) than DOFF. This diurnal variation was in line with the stability change during the day and night, which controls the vertical momentum mixing.

FIGURE 11. Time series of the averaged (A) 10-m wind speed (m s−1), and (B) dust flux (mg s−1) within the dust source area (within the black box in Figure 4A) from two experiments on 19 March 2010.
For the total dust fluxes within the dust source area on 19 March (Figure 11B), the dust emission patterns between DON and DOFF were similar spatially and temporally. Emission peaked at 0800 UTC (4 p.m. LST) for DOFF and 0600 UTC (2 p.m. LST) for DON, consistent with surface averaged wind speeds as expected, and rapidly decreased after the sunset, becoming almost negligible during the night. Although the pattern of emission was similar between two simulations, important differences arose in the emission intensity, especially during the daytime. The feedback from the dust-radiation interaction decreases ∼30% of the dust emission, generally consistent with that (∼10%) in Chen et al. (2021) but with a larger amplitude. Later during the day (19 March 2010), the dust emission was approximately zero mainly because the high winds were moved out of the dust source region.
The result from this case study suggests that during the daytime, the dust-radiation interaction produces negative feedback in low-level wind speed and dust emission, consistent with other studies (Wang et al., 2010; Chen et al., 2021).
3.4 Dust radiative effect on the intensity and movement of cold front and Mongolian cyclone
As discussed earlier, dust emission occurred between the high- and low-pressure systems. The dust plume is then advected toward the cold front, and due to the low-level convergence of the cyclone, dust was also entrained into the center of the cyclone. Therefore, a question to ask is “what is the dust radiative effect on the intensity and movement of both the cyclone and cold front?” This question is addressed in this section.
3.4.1 Cold front
In this case study, the impact of dust on the cold front intensity change became more apparent from 1800 UTC 19 to 1000 UTC 20 March 2010 after the dust plume edge approached the cold front. Thus, our discussion mainly focuses on this time period. The influence of dust on the cold front varies depending on the daytime or nighttime, as well as the vertical distribution of dust due to different dust-radiation effects between longwave and shortwave, which were discussed in Section 3.2.
For the convenience of the discussion, a front is first defined. A front is a zone where the horizontal potential temperature gradient on a pressure surface is large. The horizontal potential temperature gradient was calculated by the formula below:
where
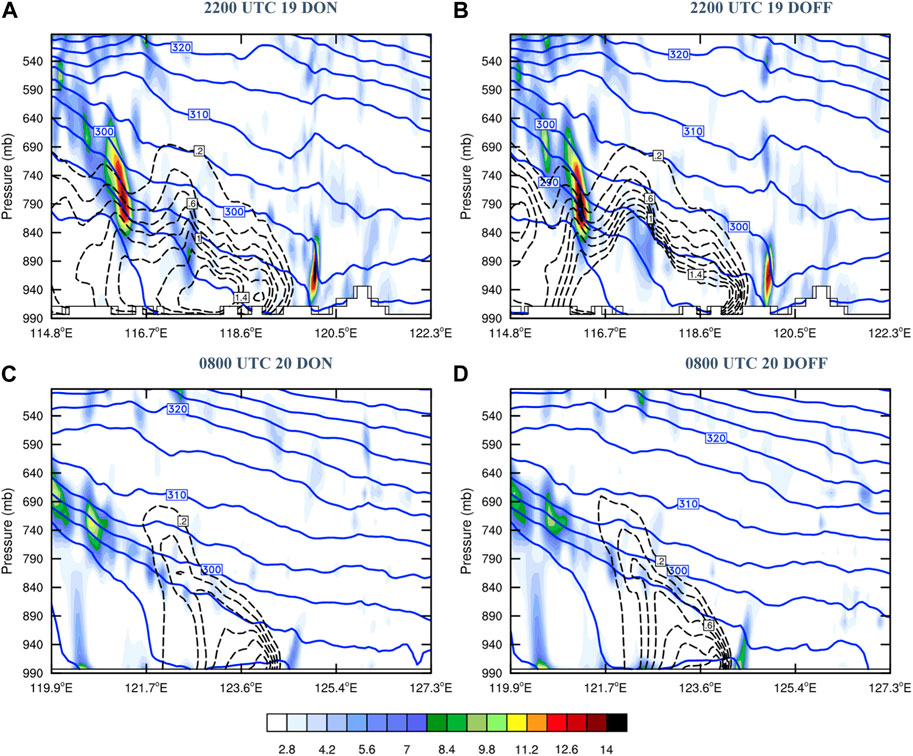
FIGURE 12. The vertical cross sections of horizontal potential temperature gradient magnitude (K/100 km; shaded), perpendicular to the cold front, overlaid with potential temperature (K; blue contours), dust mixing ratio (mg kg-1; dashed black contours) at 2200 UTC 19 and 0800 UTC 20 March 2010 from (A,C) DON and (B,D) DOFF. The locations of the vertical cross sections for (A,B) (C,D) are indicated by the black lines in Figures 5B, C, respectively.
At both day and night, the dust did not show a clear influence on the cold front’s movement. However, the surface cold front moved slightly faster in DON than in DOFF at both day (Figure 12C versus Figure 12D) and night (Figure 12A versus Figure 12B), and it was due to a more intense cyclone in DON (discussed in Section 3.4.2).
In summary, the cold front was mainly influenced by the dust at the edge of the dust plume. The impact of the dust direct radiative effect on the change of the cold front intensity highly depended on the dust three-dimensional distribution and time of a day (daytime versus nighttime). For the most common scenario, when a dust plume was trapped underneath and right behind a cold front, the dust radiative effect was expected to enhance the surface cold front during the nighttime and weaken the surface cold front during the daytime. A similar conclusion would have been applied to the front at the middle levels if the dust had stayed behind the cold front. Instead, the simulated dust plume existed above the frontal zone and reached the warm side of the middle level front; in consequence, the dust radiative effect weakened the cold front in the nighttime and intensified the cold front in the daytime at middle levels. The movement of the cold front was not evidently influenced by the dust radiative effect.
3.4.2 Cyclone
Similar to the cold front, dust had almost no impact on the cyclone intensity until the dust plume started intruding into the center of the cyclone at 0400 UTC 19 March. Figure 13 shows the time series of the minimum sea level pressure (MSLP) of the cyclones in DON and DOFF from 0400 UTC 19 to 1800 UTC 20. Overall, the intensity, in terms of MSLP, in DON was stronger than in DOFF during this time period, except from 2000 UTC 19 to 0100 UTC 20 (or from 4 a.m. to 9 a.m. LST). The maximum MSLP difference between the two experiments reached ∼4 hPa at 1200 UTC 20 March. Unlike the cold front, the dust impact on the cyclone not only depended on day and night, but also depended on which part of the dust plume resided at the center of the cyclone, which is discussed further below.
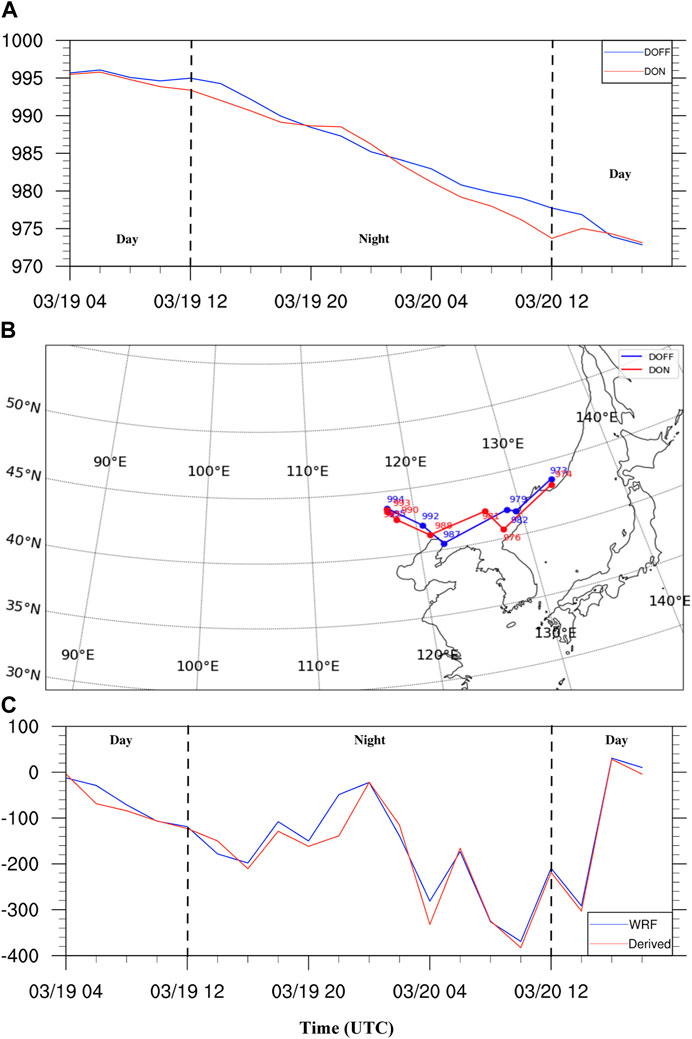
FIGURE 13. Time variation of (A) the minimum sea level pressure (hPa) at the cyclone center for both DON (red line) and DOFF (blue line), (B) the movement of the cyclone center for DON (red line) and DOFF (blue line), and (C) the surface pressure difference (Pa) between DON and DOFF (DON - DOFF) following the center of the cyclone in the DON experiment from 0400 UTC 19 to 1800 UTC 20 March. The blue line in (B) uses the surface pressure data from WRF outputs directly, while the red line uses derived data, based on Eq. 2.
As discussed in Section 3.2, the dust direct radiative effect had a different impact on temperature at different regions of the dust plume, i.e., the center of the dust plume versus the edge of the dust plume, and the upper-part of the dust plume versus the lower-part of the dust plume. The cyclone was influenced by dust in two phases: first, by the edge part of the dust plume when the major dust plume was close to the cyclone, and second, by a thicker dust layer after the major dust plume fed into the center of the cyclone. During the first phase, when the dust plume edge arrived at the center of the cyclone of interest in the afternoon (Figure 5A), the dust heated air near the surface at the center of the cyclone, i.e., the edge of the dust plume (Figures 7A, C, E and Figure 8A), which led to a slightly more intense cyclone (Figure 13A). In other words, the MSLP in DON decreased more compared to that in DOFF, although the major dust plume area to the west of the cyclone center greatly cooled the air near the surface (strong negative temperature anomaly in Figure 7A) due to the attenuation of irradiance by the heavy dust above. The heating at the dust plume edge explains why the MSLP in DON was lower than in DOFF during this first phase.
During the second phase when the major dust plume fed into and occupied the low levels of the cyclone center, the net heating/cooling effect by dust at the column of the cyclone center produced a negative cooling effect, which slowed down or plateaued the rate of decrease of the MSLP in DON (∼2000 UTC 19 March; red line in Figure 13A), while the cyclone in DOFF continued intensifying at a nearly constant rate (blue line). This explains why the blue and red lines in Figure 13A intersected at 2000 UTC 19 March. The cyclone of interest dissipated and a nearby cyclone to its east took over. The new cyclone started with a slightly weaker or similar intensity to that in DOFF. As the dust plume edge approached the cyclone, the cyclone started intensifying faster than the DOFF case, explaining why the second intersection of the red and blue lines occurred, until the center of the cyclone was filled with dust again, repeating what had occurred before. These processes of dust filling in and cyclone replacement explain why the MSLP value had a kink (i.e., rising, flattening, and then dropping of MSLP) in the DON case (i.e., red line in Figure 13A). In both phases, dust had no clear impact on the cyclone movement (Figure 13B).
To ensure that the surface pressure and MSLP change was mainly caused by the temperature change, we calculated the pressure change that was attributed to the temperature difference between DON and DOFF. We noted that while the temperature change was attributed to dust heating/cooling, advection, turbulent mixing, etc., they were all directly or indirectly caused by the dust radiative effect, since that was the only difference between the two experiments. Based on the hydrostatic balance equation, it is expected that a warm temperature or low air density anomaly will cause a low-pressure anomaly, while a cold temperature or high air density anomaly will cause a high-pressure anomaly. Since temperature modifications by dust can change signs in the vertical (see Figure 8B for an example), it is difficult to even qualitatively justify the sign of the surface pressure change by the vertical distribution of dust or temperature anomaly. Therefore, we used the hypsometric equation (Eq. 2) to quantitatively estimate the accumulated pressure change due to the temperature difference between DON and DOFF, assuming that the lapse rate is constant in each model layer.
where p is the pressure; T is the temperature; the subscript n indicates the height level, g is the gravitational force; R is the gas constant (287 J/kg/K); and
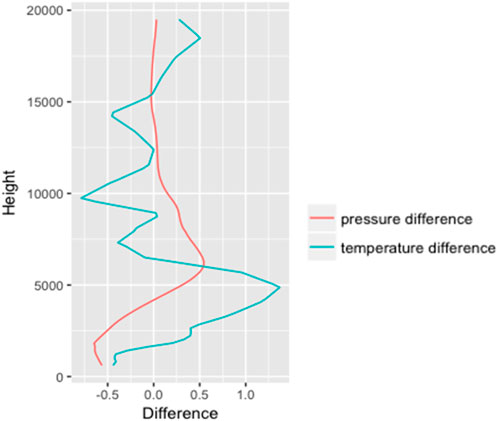
FIGURE 14. Derived (calculated) pressure difference (hPa, red line; DON-DOFF) and temperature difference (
4 Conclusion
Dust is an important contributor to air quality in certain regions of the world, such as eastern China and Europe. Dust can also be a key player in the modification of weather and climate, particularly near the dust source regions. In East Asia, strong winds associated with Mongolian cyclones are the main mechanism of the dust storms during the springtime, and these dust storms might have feedback to the cyclone development. Using the WRF-Dust model (Chen et al., 2010; Chen et al., 2015), this study investigates the impact of the dust radiative forcing on the development of a Mongolian cyclone and its cold front. A dust storm that occurred over East Asia during 18–22 March was chosen for the case study because it was the strongest dust storm event in 2010. To study the dust radiative feedback on these weather systems, two numerical experiments were conducted, which differed only in whether or not the dust-radiation interaction was activated.
Our results showed that both dust distribution and Mongolian cyclones were reasonably predicted in both numerical experiments. However, differences in temperature were present. During the daytime, dust absorbs and scatters the incoming solar radiation and decreases downward shortwave fluxes, leading to a heating effect at the upper part of the dust plume and cooling underneath. Dust absorbs, scatters, and emits longwave radiation throughout the course of a day, resulting in the cooling (warming) effect at the upper (lower) part of the dust plume. The dust-shortwave effect dominated the dust-longwave effect in the daytime and stabilized the PBL over the major dust plume region. The stabilization of the boundary layer reduced vertical mixing, which decreased the PBL height and the surface winds (less downward momentum mixing). In consequence, dust emission was reduced by ∼30%, i.e., negative feedback. In the nighttime when dust-longwave interaction operates alone, the dust heating effects are opposite. This result is consistent with previous studies (Perez et al., 2006; Wang et al., 2010; Remy et al., 2014; Chen et al., 2021; Francis et al., 2021).
Simulation results showed that the dust plume had almost no impact on the Mongolian cyclone and its cold front until the dust plume moved close to the cyclone or the cold front. The influence of the dust radiative forcing on either of the weather systems depended on the region of the dust plume that interacted with the system of interest. The cold front was mainly influenced by dust at the edge of the dust plume. Dust was trapped behind the surface front and mainly underneath the boundary layer; the only exception was behind the surface front, where the upper part of the dust plume extended upward to the warm side of the frontal zone, as illustrated in Figure 15. During the daytime, the dust plume edge heated the cold air side of the near-surface cold front and the warm air side of the middle-level cold front. As a result, the dust plume edge weakened the near-surface cold front, but intensified the middle-level cold front during the daytime (Figure 15A). Late at night, oppositely, the dust plume’s edge intensified the near-surface cold front while weakening the middle-level cold front (Figure 15B). The dust impact on the cyclone intensity was not only controlled by the diurnal cycle of the dust radiative effect, but also by the relative position of the dust plume. In addition, if a cyclone center replacement occurs, it also plays another role in the dust-Mongolian cyclone interaction. As illustrated in Figure 16, when the dust plume approached the center of the cyclone in the daytime or the early night, the dust radiative effect at the dust plume edge dominated, so that it heated the lower atmosphere, decreased the MSLP of the main cyclone (M), and intensified the cyclone (top panel in Figure 16). When the dust plume fed into the cyclone center (middle panel in Figure 16), the dust net cooling effect stopped or slowed down the intensifying rate (i.e., the MSLP of the main cyclone stopped decreasing). At the same time, another nearby cyclone (N) continued developing until its MSLP was lower than the main one (M). Subsequently, the main cyclone dissipated, and the nearby cyclone took over. This new cyclone in DON started from a weaker or similar intensity as in the DOFF case, and then the pattern repeated, as was shown in the bottom panel Figure 16 (i.e., intensifying and then leveling off).
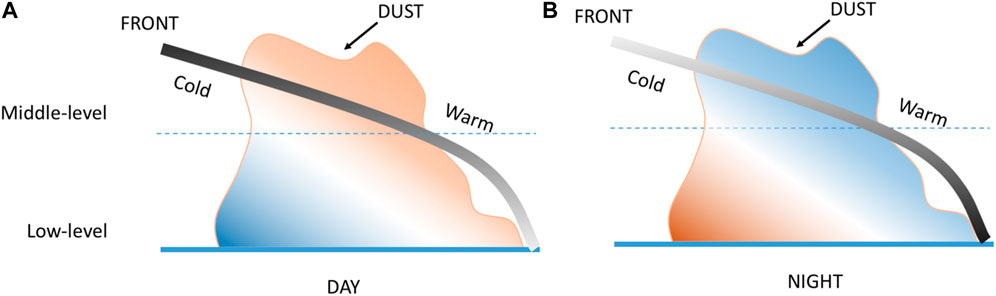
FIGURE 15. A schematic diagram for a dust plume influencing the cold front at (A) day, and (B) night. Line filled with the gradient black color represents the front: the darker the more strongly influenced by dust, while the lighter the more weakly influenced by dust. Blue represents cooling and red represents heating by dust.
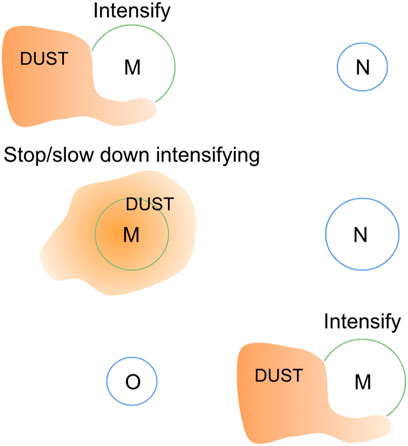
FIGURE 16. A schematic diagram for the dust (shaded) interaction with the Mongolian cyclone (circles) when a cyclone center replacement occurs. A larger circle represents a stronger cyclone. M indicates the main cyclone; N indicates the new developed cyclone; and O indicates the old main cyclone.
Although the present study demonstrates that the dust radiative forcing could influence the development of the Mongolian cyclone and its cold front and had almost nil impact on their movement, more case studies will be needed to obtain statistical results. In addition, dust particles can act as cloud condensation nuclei and ice nuclei, which can change cloud properties associated with these weather systems and the radiative budget in the atmosphere and at the surface. Although the dust indirect effect was included in both numerical simulations, the dust indirect effect on these weather systems was not examined in the study but will be studied in the future.
Data availability statement
The raw data supporting the conclusion of this article will be made available by the authors, without undue reservation.
Author contributions
S-HC designed the experiments and supervised the project. JL carried out the experiments, analyzed the results, made plots and drafted the manuscript. S-HC aided in interpreting the results, designed the figures and worked on the manuscript. All authors listed have made a substantial, direct, and intellectual contribution to the work and approved it for publication.
Funding
This work is supported by NSF Grant 1624414, NASA Grant 80NSSC20K0906, and the NASA High-End Computing (HEC) Program through the NASA Advanced Supercomputing (NAS) Division at Ames Research Center (SMD-16-7576). Data sources used in this study were NCEP FNL reanalysis data from the NCAR and MODIS Daily Level 2 AOD data from the NASA LAADS Web.
Conflict of interest
The authors declare that the research was conducted in the absence of any commercial or financial relationships that could be construed as a potential conflict of interest.
Publisher’s note
All claims expressed in this article are solely those of the authors and do not necessarily represent those of their affiliated organizations, or those of the publisher, the editors and the reviewers. Any product that may be evaluated in this article, or claim that may be made by its manufacturer, is not guaranteed or endorsed by the publisher.
References
Ahn, H.-J., Park, S.-U., and Chang, L.-S. (2007). Effect of direct radiative forcing of asian dust on the meteorological fields in East Asia during an asian dust event period. J. Appl. Meteorol. Climatol. 46 (10), 1655–1681. doi:10.1175/JAM2551.1
Alizadeh Choobari, O., Zawar-Reza, P., and Sturman, A. (2014). The global distribution of mineral dust and its impacts on the climate system: A review. Atmos. Res. 138, 152–165. doi:10.1016/j.atmosres.2013.11.007
Bangalath, H. K., and Stenchikov, G. (2015). Role of dust direct radiative effect on the tropical rain belt over Middle East and North Africa: A high-resolution agcm study. J. Geophys. Res. Atmos. 120 (10), 4564–4584. doi:10.1002/2015jd023122
Bercos-Hickey, E., Nathan, T. R., and Chen, S.-H. (2017). Saharan dust and the african easterly jet-african easterly wave system: Structure, location and energetics. Q. J. R. Meteorol. Soc. 143, 2797–2808. in press. doi:10.1002/qj.3128
Chen, S. H., Wang, S. H., and Waylonis, M. (2010). Modification of Saharan air layer and environmental shear over the eastern Atlantic Ocean by dust-radiation effects. J. Geophys. Res. Atmos. 115, D21202. doi:10.1029/2010jd014158
Chen, S.-H., Liu, Y.-C., Nathan, T. R., Davis, C., Torn, R., Sowa, N., et al. (2015). Modeling the effects of dust-radiative forcing on the movement of Hurricane Helene (2006). Q. J. R. Meteorol. Soc. 141 (692), 2563–2570. doi:10.1002/qj.2542
Chen, S.-H., McDowell, B., Huang, C.-C., and Nathan, T. R. (2021). Formation of a low-level barrier jet and its modulation by dust radiative forcing over the Hexi Corridor in Central China on March 17, 2010. Q. J. R. Meteorol. Soc. 147, 1873–1891. doi:10.1002/qj.4000
Cheng, C.-T., Wang, W.-C., and Chen, J.-P. (2010). Simulation of the effects of increasing cloud condensation nuclei on mixed-phase clouds and precipitation of a front system. Atmos. Res. 96 (2), 461–476. doi:10.1016/j.atmosres.2010.02.005
Cherian, R., Venkataraman, C., Kumar, A., Sarin, M. M., Sudheer, A. K., and Ramachandran, S. (2010). Source identification of aerosols influencing atmospheric extinction: Integrating PMF and PSCF with emission inventories and satellite observations. J. Geophys. Res. Atmos. 115 (D22), D22212. doi:10.1029/2009jd012975
Chou, M. D., Suarez, M. J., et al. Laboratory for Atmospheres (Goddard Space Flight Center)Goddard Space Flight CenterClimate and Radiation BranchLaboratory for Hydrospheric Processes (U.S.) (1999). A solar radiation parameterization for atmospheric studies NASA/TM 1999-104606 Technical report series on global modeling and data assimilation, 15, 1 online resource (x, 38 pages). Retrieved from http://purl.fdlp.gov/GPO/gpo60446.
Chou, M. D.Goddard Space Flight CenterUnited States. National Aeronautics and Space Administration (2001). A thermal infrared radiation parameterization for atmospheric studies NASA/TM 2001-104606 Technical report series on global modeling and data assimilation, 19, 1 online resource (x, 56 pages). Retrieved from http://purl.fdlp.gov/GPO/gpo60454.
Creamean, J. M., Suski, K. J., Rosenfeld, D., Cazorla, A., DeMott, P. J., Sullivan, R. C., et al. (2013). Dust and biological aerosols from the Sahara and Asia influence precipitation in the western U.S. Science 339, 1572–1578. doi:10.1126/science.1227279
Cuesta, J., Eremenko, M., Flamant, C., Dufour, G., Laurent, B., Bergametti, G., et al. (2015). Three-dimensional distribution of a major desert dust outbreak over East Asia in March 2008 derived from IASI satellite observations. J. Geophys. Res.-Atmos. 120 (14), 7099–7127. doi:10.1002/2014jd022406
da Rocha, R. P., Reboita, M. S., Gozzo, L. F., Dutra, L. M. M., and de Jesus, E. M. (2019). Subtropical cyclones over the oceanic basins: A review. Ann. N. Y. Acad. Sci. 1436 (1), 138–156. doi:10.1111/nyas.13927
Francis, D., Chaboureau, J.-P., Nelli, N., Cuesta, J., Alshamsi, N., Temimi, M., et al. (2021). Summertime dust storms over the arabian Peninsula and impacts on radiation, circulation, cloud development and rain. Atmos. Res. 250, 105364. doi:10.1016/j.atmosres.2020.105364
Grogan, D. F. P., Nathan, T. R., and Chen, S.-H. (2016). Effects of saharan dust on the linear dynamics of african easterly waves. J. Atmos. Sci. 73 (2), 891–911. doi:10.1175/JAS-D-15-0143.1
Grogan, D. F. P., Nathan, T. R., and Chen, S.-H. (2017). Saharan dust and the nonlinear evolution of the african easterly jet–african easterly wave system. J. Atmos. Sci. 74 (1), 27–47. doi:10.1175/JAS-D-16-0118.1
Gui, K., Yao, W., Che, H., An, L., Zheng, Y., Li, L., et al. (2022). Record-breaking dust loading during two mega dust storm events over northern China in March 2021: Aerosol optical and radiative properties and meteorological drivers. Atmos. Chem. Phys. 22 (12), 7905–7932. doi:10.5194/acp-22-7905-2022
Han, Z. W., Li, J. W., Guo, W. D., Xiong, Z., and Zhang, W. (2013). A study of dust radiative feedback on dust cycle and meteorology over East Asia by a coupled regional climate-chemistry-aerosol model. Atmos. Environ. 68, 54–63. doi:10.1016/j.atmosenv.2012.11.032
Heinold, B., Tegen, I., Schepanski, K., and Hellmuth, O. (2008). Dust radiative feedback on Saharan boundary layer dynamics and dust mobilization. Geophys. Res. Lett. 35 (20), L20817. doi:10.1029/2008gl035319
Hess, M., Kopke, P., and Schult, I. (1998). Optical properties of aerosols and clouds: The software package OPAC. Bull. Am. Meteorol. Soc. 79, 831–844. doi:10.1175/1520-0477(1998)079<0831:opoaac>2.0.co;2
Huang, C.-C., Chen, S.-H., Lin, Y.-C., Earl, K., MatsuiLeeChen, T. H.-H. I.-C. T., J.-P., Cheng, C.-T., et al. (2019). Impacts of dust–radiation versus dust–cloud interactions on the development of a modeled mesoscale convective system over North Africa. Mon. Wea. Rev. 147, 3301–3326. doi:10.1175/MWR-D-18-0459.1
Knippertz, P., and Stuut, J.-B. (2014). Mineral dust: A key player in the Earth system, Springer. doi:10.1007/978-94-017-8978-3
Lee, Y. C., Wenig, M., Zhang, Z. X., Sugimoto, N., Larko, D., and Diehl, T. (2012). Dust episodes in Hong Kong (South China) and their relationship with the Sharav and Mongolian cyclones and jet streams. Air Qual. Atmos. Health 5 (4), 413–424. doi:10.1007/s11869-011-0134-7
Li, R., Xue, D., Guo, J., Fu, Y., Zhao, C., Wang, Y., et al. (2017). Multi-modal discriminative dictionary learning for Alzheimer's disease and mild cognitive impairment. Sci. Rep. 7 (1), 1–8. doi:10.1016/j.cmpb.2017.07.003
Lin, C. Y., Sheng, Y. F., Chen, W. N., Wang, Z., Kuo, C. H., Chen, W. C., et al. (2012). The impact of channel effect on asian dust transport dynamics: A case in southeastern Asia. Atmos. Chem. Phys. 12 (1), 271–285. doi:10.5194/acp-12-271-2012
Liu, J. T., Jiang, X. G., Zheng, X. J., Kang, L., and Qi, F. Y. (2004). An intensive Mongolian cyclone Genesis induced severe dust storm. Terr. Atmos. Ocean. Sci. 15 (5), 1019–1033. doi:10.3319/tao.2004.15.5.1019(adse)
Mallone, S., Stafoggia, M., Faustini, A., Gobbi, G. .P., Marconi, A., and Forastiere, F (2011). Saharan dust and associations between particulate matter and daily mortality in Rome, Italy. Environ. Health Perspect.119(10):1409–1414. doi:10.1289/ehp.1003026
Miller, R. L., Perlwitz, J., and Tegen, I. (2004). Feedback upon dust emission by dust radiative forcing through the planetary boundary layer. J. Geophys. Res. Atmos. 109 (D24), D24209. doi:10.1029/2004jd004912
Nathan, T. R., Grogan, D. F. P., and Chen, S.-H. (2017). Subcritical destabilization of african easterly waves by saharan mineral dust. J. Atmos. Sci. 74 (4), 1039–1055. doi:10.1175/JAS-D-16-0247.1
Perez, C., Nickovic, S., Pejanovic, G., Baldasano, J. M., and Ozsoy, E. (2006). Interactive dust-radiation modeling: A step to improve weather forecasts. J. Geophys. Res. Atmos. 111 (D16), D16206. doi:10.1029/2005jd006717
Perlwitz, J., Tegen, I., and Miller, R. L. (2001). Interactive soil dust aerosol model in the GISS GCM 1. Sensitivity of the soil dust cycle to radiative properties of soil dust aerosols. J. Geophys. Res. Atmos. 106 (D16), 18167–18192. doi:10.1029/2000jd900668
Remy, S., Benedetti, A., Haiden, T., Jones, L., Razinger, M., Flemming, J., et al. (2014). Positive feedback of dust aerosol via its impact on atmospheric stability during dust storms in the Eastern Mediterranean. Atmos. Chem. Phys. Discuss. 14 (20), 28147–28201. doi:10.5194/acpd-14-28147-2014
Sanders, F., and Hoffman, E. G. (2002). A climatology of surface baroclinic zones. Weather Forecast. 17 (4), 774–782. doi:10.1175/1520-0434(2002)017<0774:acosbz>2.0.co;2
Shi, Y., and Liu, X. (2019). Dust radiative effects on climate by glaciating mixed-phase clouds. Geophys. Res. Lett. 46 (11), 6128–6137. doi:10.1029/2019gl082504
Shi, J. J., Matsui, T., Tao, W.-K., Tan, Q., Peters-Lidard, C., Chin, M., et al. (2014). Implementation of an aerosol–cloud–microphysics–radiation coupling into the NASA unified WRF: Simulation results for the 6–7 August 2006AMMA special observing period. Quart. J. Roy. Meteor. Soc. 140, 2158–2175. doi:10.1002/qj.2286
Spensberger, C., and Sprenger, M. (2018). Beyond cold and warm: An objective classification for maritime midlatitude fronts. Q. J. R. Meteorol. Soc. 144, 261–277. doi:10.1002/qj.3199
Sun, J. M., Zhang, M. Y., and Liu, T. S. (2001). Spatial and temporal characteristics of dust storms in China and its surrounding regions, 1960-1999: Relations to source area and climate. J. Geophys. Research-Atmospheres 106 (D10), 10325–10333. doi:10.1029/2000jd900665
Tegen, I., and Fung, I. (1994). Modeling of mineral dust in the atmosphere: Sources, transport, and optical thickness. J. Geophys. Res. 99, 22897–22914. doi:10.1029/94jd01928
Wang, H., Zhang, X., Gong, S., Chen, Y., Shi, G., and Li, W. (2010). Radiative feedback of dust aerosols on the East Asian dust storms. J. Geophys. Res. Atmos. 115 (D23), D23214. doi:10.1029/2009jd013430
Wu, C., Lin, Z., He, J., Zhang, M., Liu, X., Zhang, R., et al. (2016). A process-oriented evaluation of dust emission parameterizations in CESM: Simulation of a typical severe dust storm in East Asia. J. Adv. Model. Earth Syst. 8 (3), 1432–1452. doi:10.1002/2016ms000723
Zhao, L. N., and Zhao, S. X. (2006). Diagnosis and simulation of a rapidly developing cyclone related to a severe dust storm in East Asia. Glob. Planet. Change 52 (1-4), 105–120. doi:10.1016/j.gloplacha.2006.02.003
Zhao, C., Liu, X., Leung, L. R., and Hagos, S. (2011). Radiative impact of mineral dust on monsoon precipitation variability over West Africa. Atmos. Chem. Phys. 11 (5), 1879–1893. doi:10.5194/acp-11-1879-2011
Keywords: Mongolian cyclone, cold front, dust radiative forcing, WRF-Dust model, Gobi Desert
Citation: Li J and Chen S-H (2023) Dust impacts on Mongolian cyclone and cold front in East Asia: a case study during 18–22 March 2010. Front. Environ. Sci. 11:1167232. doi: 10.3389/fenvs.2023.1167232
Received: 16 February 2023; Accepted: 09 May 2023;
Published: 19 May 2023.
Edited by:
Jingyu Wang, Nanyang Technological University, SingaporeReviewed by:
Chunsong Lu, Nanjing University of Information Science and Technology, ChinaChenglai Wu, Chinese Academy of Sciences (CAS), China
Copyright © 2023 Li and Chen. This is an open-access article distributed under the terms of the Creative Commons Attribution License (CC BY). The use, distribution or reproduction in other forums is permitted, provided the original author(s) and the copyright owner(s) are credited and that the original publication in this journal is cited, in accordance with accepted academic practice. No use, distribution or reproduction is permitted which does not comply with these terms.
*Correspondence: Shu-Hua Chen, c2hhY2hlbkB1Y2RhdmlzLmVkdQ==