
94% of researchers rate our articles as excellent or good
Learn more about the work of our research integrity team to safeguard the quality of each article we publish.
Find out more
ORIGINAL RESEARCH article
Front. Environ. Sci., 16 June 2023
Sec. Environmental Informatics and Remote Sensing
Volume 11 - 2023 | https://doi.org/10.3389/fenvs.2023.1161106
 Feili Wei1,2,3
 Dahai Liu2*Ze Liang3Yueyao Wang3Jiashu Shen3Huan Wang3Yajuan Zhang3Yongxun Wang2
 Shuangcheng Li3*
Changes in land surface properties during urbanization have a significant impact on variations in precipitation. Little research has been carried out on spatial heterogeneity and influence strength of the driving factors of precipitation changes at different urbanization scales. Using a trend analysis and multi-scale geographically weighted regression, this study analysed the spatial heterogeneity and impact scale of driving factors of precipitation changes in 156 urban units in the Beijing-Tianjin-Hebei urban agglomeration region (Jing-Jin-Ji). In summer, RAD (radiation), RHU (relative humidity), WIN (wind speed), and POP (urban population density) were found to act on a small regional scale, AOD (aerosol optical depth) on a medium regional scale, and NDVI (normalized difference vegetation index), NLI (night time light intensity), UHI (urban heat island intensity), and AREA (urban area size) on a global scale. In winter, AREA and WIN acted on a medium regional scale, UHI on a large regional scale, and AOD, NDVI and NLI on a global scale. Across the whole year, NDVI and AREA had a medium regional impact and NLI a large regional one. Variations in natural factors, such as RAD and RHU, had a great influence on the spatial heterogeneity of precipitation changes, whereas human factors, such as NLI and UHI, had a small influence. In summer, AOD mainly affected Tangshan and Qinhuangdao in the northeast and Cangzhou in the southeast of the Jing-Jin-Ji. RHU and AREA primarily affected the cities of Handan and Xingtai. In winter, NLI, AREA, WIN, and UHI had significant effects in the cities of Handan and Xingtai, with AREA being the most important factor. In the Shijiazhuang-Hengshui area, RAD and NLI played a significant role; in the Beijing-Zhangjiakou-Chengde area, the most important factor affecting precipitation changes was the variation in POP. These results provide a scientific basis for flood disaster risk management in the Jing-Jin-Ji and the establishment of differentiated climate policies in different cities.
Urbanization is rapidly expanding worldwide (Zhang and Seto, 2011; Elhacham and Alpert, 2021; Koroso et al., 2021; Ouyang et al., 2021; Zhou et al., 2022). According to a report by UN-Habitat issued in 2022, 56% of the global population now lives in urban areas. Although COVID-19 has had a greater impact on urban areas, it will not affect the progress of urbanization, and the proportion of the global urban population will reach 68% by 2050 (UN-Habitat, 2020b). Further, in the process of urbanization the land area used for urban construction is expanding, and the speed of urban expansion exceeds the increase in the urban population. According to the results of a global sampling survey of 200 cities with populations of more than 100,000 people from 1990 to 2015, the urban area of developed countries increased 1.8-fold during that time period, while the urban population increased 1.2-fold. Relative to the population, urban land area increased by a factor of 1.5, whereas the area expansion was 3.5 times faster than the population growth in developing countries. Between 2015 and 2050, urban land expansion in developed and developing countries is expected to increase 1.1-fold and 2.5-fold, respectively, despite effective planning and management measures (UN-Habitat, 2020a).
The increase in the urban population, construction, and expansion of land use has greatly changed the natural environment. Urban surface albedo, evapotranspiration, soil moisture, surface roughness, earth-air flux exchange, energy, and water cycle changes all affect the atmospheric water thermal equilibrium, and thus have a significant influence on precipitation (Huang et al., 2022; Oleson et al., 2018; Seino et al., 2018; Song et al., 2021; Su et al., 2021; Sun et al., 2021; Yuan et al., 2022; Yuan et al., 2021; Zhang et al., 2018; Zhang Y. Z. et al., 2017; Zhao et al., 2014). In turn, variation in the amount, intensity, and frequency of precipitation in urban areas greatly affects the urban population, economy, infrastructure, and environment (Peleg et al., 2022; Zhang et al., 2018). Many studies have shown that when increases in urban heat island intensity (UHI) enhancement and aerosol concentration are superimposed with climate change, the impact of urbanization on extreme precipitation events is amplified (Seino et al., 2018; Zhang et al., 2018). Their frequency and intensity are aggravated (Yu M. et al., 2018; Zhang et al., 2018; Huang et al., 2022; Tang et al., 2022), the probability of urban flood occurrence increases (Glisan et al., 2014; Zhang et al., 2018), and densely populated urban areas are more vulnerable to extreme weather conditions (Yu R. et al., 2018; Debbage and Shepherd, 2019; Zhang et al., 2019). Urbanization intensifies urban precipitation variability and enhances the occurrence of events such as typhoons or hurricanes, making the risk of urban floods several times higher than in suburban areas (Zhang et al., 2018). For example, the storm that occurred in Beijing on 21 July 2012 was the most serious storm in more than 60 years. Mountain floods and building collapses took at least 77 people’s lives and forced nearly 60,000 people to evacuate their homeland, causing direct economic losses of about 10 billion yuan (about 1.6 billion US dollars) (Qiu, 2012). This is a general statement about rains and urbanization (https://www.nature.com/news/urbanization-contributed-to-beijing-storms-1. 11086). Similarly, Tokyo (Uchiyama et al., 2018), Houston (Zhang et al., 2018), Atlanta (Debbage and Shepherd, 2019), Mumbai (Paul et al., 2018; Patel et al., 2019), Berlin (Lorenz et al., 2019), and other cities have experienced extreme precipitation exacerbated by urbanization. Meyer et al. (2009) showed that the occurrence probability of and expected loss following extreme urban rainstorms exponentially increased with the increase in rain intensity and rainfall, which could have a serious impact on urban traffic, residents’ lives, and life and property safety. Therefore, studying the impact of urbanization on precipitation and clarifying the underlying key factors can provide a scientific basis for flood disaster risk management and formulation of differentiated climate policies for cities in different regions.
To date, many studies have been conducted to reveal the main driving factors influencing the effect of urbanization on precipitation from different perspectives, such as urban heat island (UHI) (Gu and Li, 2018; Yang et al., 2019; Steensen et al., 2022; Yang and Yao, 2022), aerosol optical thickness (Han et al., 2012; Zhong et al., 2017; Sarangi et al., 2018; Fan et al., 2020; Li et al., 2022), underlying surface changes (urban impervious area, vegetation cover, etc.) (Liu et al., 2020; Li et al., 2022), and anthropogenic heat emissions in cities (Li et al., 2016; Dimitrova et al., 2019). Some scholars have also revealed the physical mechanism of the effects of urbanization on precipitation using model simulations, suggesting that urbanization leads to friction velocity (Zhao et al., 2014; Zhang et al., 2018; Li C. et al., 2019). Furthermore, sensible and latent heat (Zhang et al., 2009) are said to be one of the main factors influencing precipitation changes in urban and suburban areas. Wei et al. (2020, 2022) combined socio-economic and natural factors to reveal the key factors affecting precipitation in the Beijing-Tianjin-Hebei urban agglomeration (Jing-Jin-Ji) region across seasons through assessment of the co-action of factors (Wei et al., 2022), single factors, and the interaction among them (Wei et al., 2020).
So far, studies on the effects of urbanization on precipitation have made many achievements; however, most scholars primarily focussed on a single city or factor analysis of urban rainfall changes, the physical mechanism behind certain precipitation changes (Yu M. et al., 2018; Song et al., 2019; Yang et al., 2019; Steensen et al., 2022), and used different scales for the city’s for long-term data. Additionally, they are characterised by the lack of large mesoscale, and the research results may have some contingency, which presents a poor baseline for long-term urban planning and climate policy-making. In addition, there are significant differences in the degree of urbanization and economic development between different regions and cities, as well as in human activity intensity and underlying surfaces. Hence, the key factors affecting urban precipitation changes are not homogenous. Moreover, different combinations of influencing factors may be present in different geographical regions, and the relationship between these influencing factors is spatially non-stationary (Wei et al., 2020). Therefore, the structure and relationship between influencing factors varies between geographical locations. In addition, the influence of natural factors, such as wind speed, precipitation, and surface vegetation changes, leads to spatial heterogeneity in the impact of urbanization on precipitation, which may be significant on a regional scale, but not a broader one. In addition, the impact of certain factors may be trans-regional and have different spatial scales. Thus, it is necessary to consider the scale of the factors to study the impacts of urbanization on precipitation. However, there are few studies on spatial heterogeneity and the specific influence of the various driving factors of the effects of urbanization on precipitation. Accordingly, scientific measurement of the spatial heterogeneity and impact scale of different influencing factors of precipitation have become a major scientific problem that needs to be solved urgently.
Currently, geographically weighted regression (GWR) is frequently used to reveal the spatial heterogeneity and impact scale of precipitation. However, because of the fixed GWR bandwidth, the spatial scale of each factor cannot be determined. With the development of science and technology, a new multi-scale geographically weighted regression model (MGWR) has recently emerged (Fotheringham et al., 2019). Compared with the GWR, the MGWR has the advantage that each variable can not only generate its own level of spatial smoothness but also search for the optimal bandwidth, which can be used as an indicator for the spatial scale of each process, through an adaptive search method. Thus, more accurate and useful spatial process models can be generated (Fotheringham et al., 2019; Li et al., 2020; Li and Fotheringham, 2020). For example, at present, housing price prediction includes numerous influencing factors and complex interrelationships (Shen et al., 2020), air quality (Fotheringham et al., 2019; Wei et al., 2021), and manufacturing location choice analysis (Yu et al., 2019). The MGWR has proven to be a reliable tool for revealing the spatial heterogeneity of geographical factors, but it has not yet been applied to study the effects of urbanization on precipitation.
Accordingly, the aim of this study was to apply an MGWR to explore the spatial differentiation characteristics and scale of precipitation changes as well as their key driving factors in 156 urban units located in the Jing-Jin-Ji from 2000 to 2018 using natural and socio-economic data on its urbanization. Then, to identify the importance ranking of the factors affecting precipitation in major cities (herein referred to as representative regions), this study investigated: 1) the spatial heterogeneity of the factors influencing precipitation in the Jing-Jin-Ji between 2000 and 2018 and the scale of their influences; 2) the spatial agglomeration effect of the scope of the impact factors and the existence of regions with two or more superimposed impact factors; and 3) the most important driving factors. The results of this study provide a basis for the establishment of climate policies for the Jing-Jin-Ji region.
This study chose 156 urban units in the Jing-Jin-Ji region, China, as the target area (Figure 1) and attempted to summarise the urban precipitation changes to provide a scientific basis for the coordinated development of cities in this region. The Jing-Jin-Ji was selected because this region has a large population, is one of the most densely populated areas globally, and has experienced rapid urbanization in recent decades. From 2000 to 2018, the urban area of the Jing-Jin-Ji has increased by 9450.77 km2, which is 2.5 times its growth rate between 1980 and 2000. Additionally, this region contains cities of different sizes, including large, medium, and small ones. The use of long-term data based on a large urban dataset can compensate for the shortcomings of previous case studies focussing on single cities and excluding conclusions of contingency. Further, the region is dominated by plains, in which most of its cities are located. Thus, the climate differences between cities are relatively small, suggesting that the influence of the regional climate (climate change) can be excluded. Lastly, this region is one of the areas with the highest degree of urbanization in China. With a developed economy and close development among regional cities, it is representative of coordinated regional development. The development level and management of cities can provide a reference for the coordinated development of other cities at different levels in the near future.
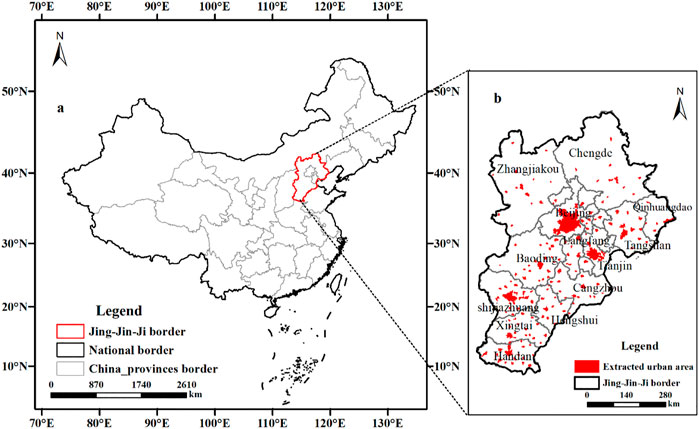
FIGURE 1. Location of the study in the Jing-Jin-Ji region. (A) is the location of Jing-Jin-Ji in China, (B) is the city-level boundary and the extracted 156 urban unit boundaries of Jing-Jin-Ji.
Considering the representativeness of factors and the significance of changes with urban development, nine factors were selected: urban area size (AREA), population density (POP), aerosol optical depth (AOD), night time light intensity (NLI), urban heat island (UHI), normalised difference vegetation index (NDVI), radiation (RAD), relative humidity (RHU), and wind speed (WIN). Wei et al., 2020, Wei et al., 2022 proved that changes in these nine factors have significant impacts on urban precipitation. They have discussed the key factors of different precipitation changes in various urban units in the Jing-Jin-Ji taking into account single factors, interactions between factors, and comprehensive effects of all factors. However, they did not investigate the spatial distribution characteristics of the heterogeneity of these factors across seasons, the scope of their influence, and whether there is a spill-over effect. Accordingly, here the rate of change of precipitation in different seasons from 2000 to 2018 was taken as the dependent variable, while the different seasonal change rates of the nine variables were taken as the independent variables in the MGWR, allowing for investigation of the spatial heterogeneity and scale of the influencing factors of precipitation in different cities in the Jing-Jin-Ji.
Five-phase remote sensing monitoring data on land use and cover status in 2000, 2005, 2010, 2015, and 2018 with a spatial resolution of 30 m were obtained from the Data Center for Resources and Environmental Sciences, Chinese Academy of Sciences (http://www.resdc.cn/). The urban area of each unit was calculated according to the AREA occupied by urban patches in the land use data for each period. POP was within the limits of each urban unit according to statistics from NASA’s Socioeconomic Data Center (http://sedac.ciesin.columbia.edu/data/set/gpw-v4-population-density-rev10), and had a spatial resolution of 30 km. NLI was the mean value of the night light intensity index of each town unit. The annual composite data were obtained using DMSP-OLS after calibration and time correction, and the spatial resolution was 1 km. AOD data were obtained from NASA’s latest air pollution data (https://www.nasa.gov/), having a spatial resolution of 1 km. NDVI, drawn from the Institute of Geographic Sciences and Natural Resources Research, Chinese Academy of Sciences (http://www.resdc.cn/DOI/doi. aspx?DOIid = 50), comprised monthly and yearly data from 2000 to 2018 with a spatial resolution of 1 km. Land surface temperature data were obtained using remote sensing inversion products from the Geospatial Data Cloud (http://www.gscloud.cn/), combining monthly surface temperatures from DIDLT1M with a spatial resolution of 1 km and calculating the UHI from the difference between urban and suburban average temperatures. Since relatively dense small cities and towns were included in this study, the 1 km resolution of the different types of data could provide us with sufficient spatial details for comparisons. RAD, RHU, WIN, and precipitation data from the China National Weather Service (http://data.cma.cn/data/detail/dataCode/A.0012.0001.html) were obtained using ANUSPLIN software (https://fennerschool-anu-edu-au.translate.goog/research/products/anusplin?_x_tr_sl=auto&_x_tr_tl=en&_x_tr_hl=zh-CN&_x_tr_pto=wapp) interpolation.
In this study, based on multi-source data, urban boundary and non-urban land patches were combined and screened according to the degree of patch continuity and the influence of the ocean or cities in other provinces. Continuous patches were taken as research units, and those affected by seawater or inaccurate classifications were excluded. Thus, through screening and merging, 156 urban units were identified (Figure 1B).
To measure the impact of urbanization on precipitation, ANUSPLIN software was used to interpolate meteorological data. The average precipitation per unit area in different cities across time periods was extracted from the urban boundary in 2000, and the precipitation of the 10 km buffer zone extracted from outside the urban unit boundary in 2018 was used as the background value. The average precipitation within the boundary of urban units in 2000 was subtracted from the average precipitation outside the 10 km buffer zone of the urban cell boundary in 2018 to obtain the influence of urbanization on local precipitation change. This method was mainly used to ensure that, between 2000 and 2018, the selected urban areas were located in cities and suburban areas were confined to suburbs, ensuring that precipitation changes between different cities were comparable across periods. Compared with temperature, precipitation has stronger spatial heterogeneity due to its spatial and temporal discontinuity; therefore, this measurement method also reflected the different characteristics of local hydrothermal combinations. In addition, since global climate change impacts are large in scale, it can be assumed that climate change impacts on inner urban areas (areas within the urban boundary of 2000) and suburbs (10 km buffer zone outside the urban boundary of 2018) were identical. Previous studies have shown that the combination of urbanization and climate change may increase the probability of extreme precipitation (Zhang et al., 2018). Therefore, based on these calculations, it was assumed that the impacts of climate change on urban areas were identical to those on buffer zones on a small regional scale, and the joint impacts of climate change were eliminated. The obtained precipitation changes not only considered the impacts of urbanization, but also included the impacts of the interaction between urbanization and climate change. Therefore, based on this measurement method, the effects of urbanization on precipitation were considered reliable.
Trend analysis is a common spatial analysis method based on the least-squares method (OLS) of the grid scale. It can better explore the change trend, distribution pattern, and spatial difference in geographical elements, and can be used to calculate their change direction, rate, and amplitude in a change range. This study used the trend analysis method to analyse the variation of urban precipitation and its influencing factors in different seasons from 2000 to 2018, and then the rate of change (
where
The calculation formula of the MGWR was as follows (Eq.(2)) (Fotheringham et al., 2019):
where buj represents the bandwidth used by the regression coefficient of the j variable. (
Each regression coefficient of the MGWR was obtained based on a local regression, and the bandwidth possessed specificity (Li Z. et al., 2019). The scale effects of the impact factors were determined by their bandwidth, which was calculated by the model to obtain the optimal bandwidth. The golden section was used to search for the optimal bandwidth of each impact factor by constantly narrowing the value range of the optimal value and comparing the optimisation scores of each model. A Monte Carlo test was used to test the model results and exclude the accidental results of influencing factor changes, making the model results more reliable. Local parameter estimates were obtained using the Monte Carlo test once, after which new local parameter estimates were derived repeatedly after random rearrangement of the data points to measure whether the change in each parameter surface was likely to be accidental.
A Hierarchical Regression analysis (HR) was used to determine the independent effects of different explanatory variables on the effect of urbanization on precipitation. HR is a method based on semi-parametric regression analysis that performs multiple random transformations of the raw data matrix to obtain the relative importance of each factor. Compared with traditional regression analyses, the biggest advantage of this method is that it can overcome the influence of multicollinearity common in environmental variables, making it highly suitable for multi-dimensional environmental data analysis (Mac Nally, 2000). Herein, this method was mainly used to identify the dominant factors of each area influenced by two or more factors (termed typical areas). According to the HR results, the independent importance was obtained using the variation in the R2 of each factor. The greater the change in R2, the greater the influence of that variable on precipitation. Then, results were re-ordered based on the magnitude of change in R2 to determine the dominant factors affecting urban precipitation in different seasons.
The reliability of the model was determined by comparing its predicted and measured values. Figure 2 shows a comparison between the measured precipitation changes and the simulated results based on the MGWR in different urban units of the Jing-Jin-Ji. The spatial distribution characteristics (Figures 2A–F) and trend (Figure 3) of the MGWR fitting precipitation changes were consistent with the actual observed values regardless of the season. The spatial variation in precipitation throughout the year showed an increasing trend in the north and a decrease in the south. Then, to verify the accuracy of the MGWR results, they were compared with the GWR commonly used for spatial heterogeneity analysis focussing on three factors: the goodness of fit (R2), Akaike Information Criterion (AIC), and residual square sum. If R2 increases, the goodness of fit is better; AIC is constructed based on the concept of entropy, which is used to balance the complexity of the estimated model and the excellence of the model fitting data. Under the same conditions, the smaller the AIC value, the better the model simulation. As can be seen from Table 1, globally, the adjustment R2 of the MGWR was larger than that of the GWR throughout the year, especially for the annual precipitation change, where the adjusted R2 of the MGWR was 0.52 higher than that of the GWR. Similarly, in terms of spatial distribution (Figures 2G–I), the minimum value of R2 was much higher than the maximum value of the GWR in all seasons. In addition, the AIC value and residual sum of the MGWR were much smaller than those of the GWR, which further confirmed that the MGWR model was superior overall. Finally, the MGWR results were compared with the residual results of the OLS (Figure 4), and it was found that MGWR had smaller residuals throughout the year, which indicated that it was more advantageous than the GWR and OLS.
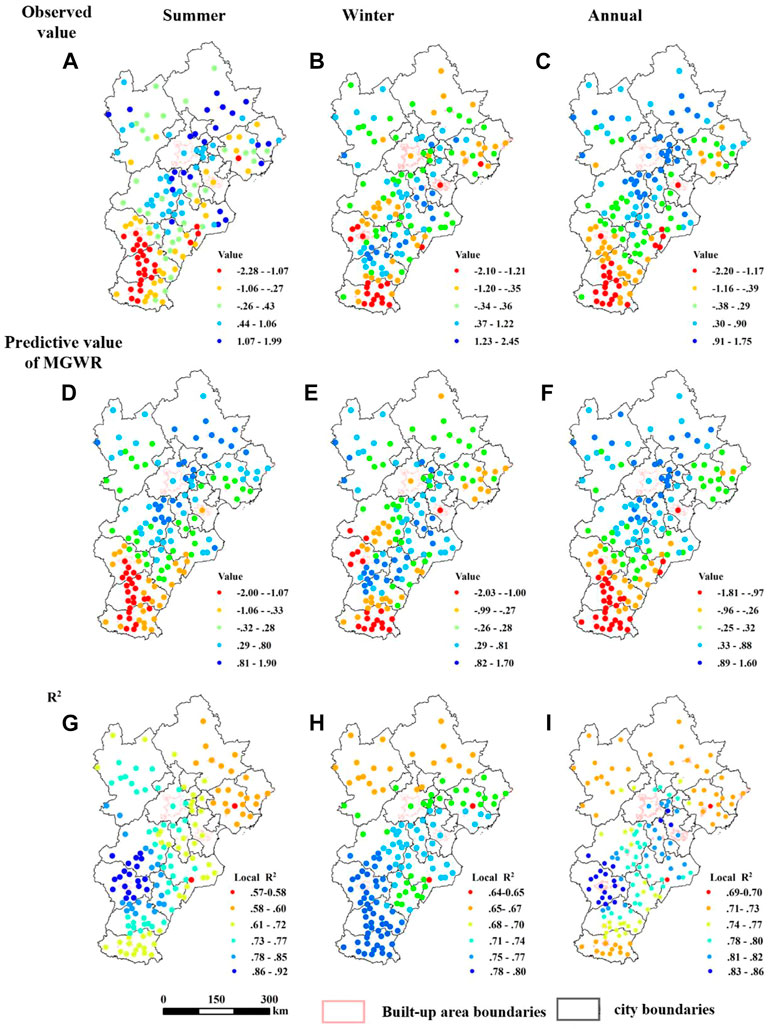
FIGURE 2. Comparison of changes in observed (A–C) and MGWR predicted (D–F) values in the Jing-Jin-Ji from 2000 to 2018, positive values indicate an increasing trend, negative values indicate a decreasing trend; (G–I) the are the goodness of fit of the MGWR. Panel A, D, and G visualise values during summer; b, e, and h those during winter; and C, F, and I the overall annual trends.
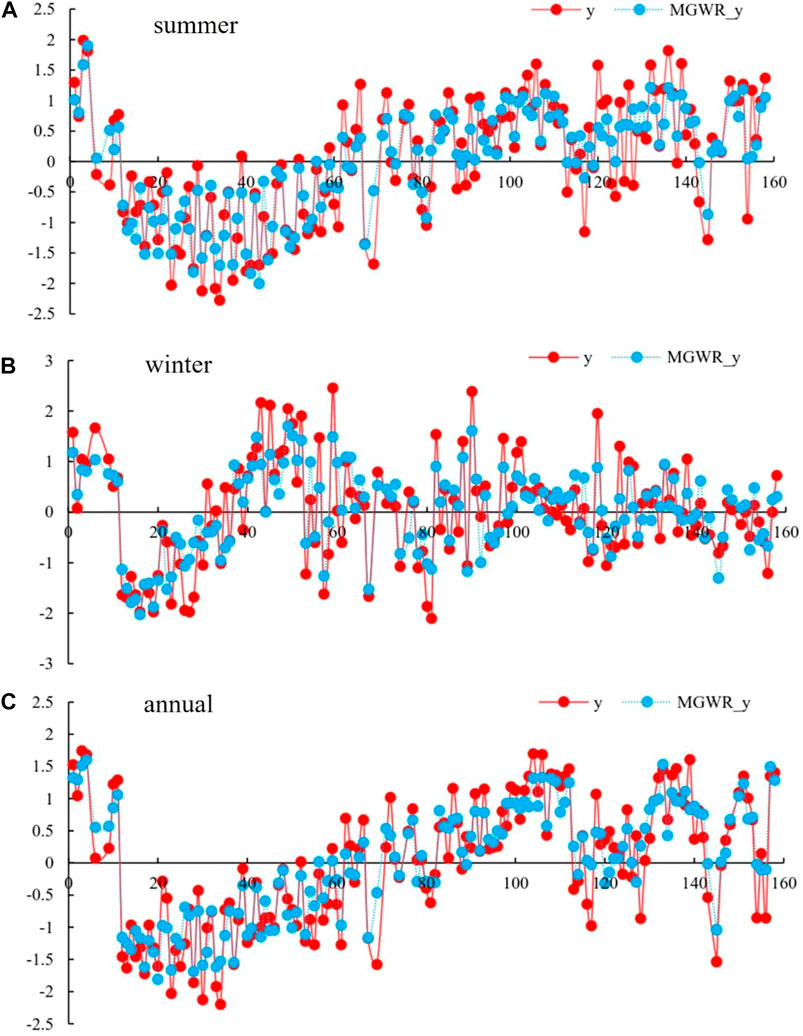
FIGURE 3. Comparison of changes in observed (y) and MGWR predicted (MGWR_y) values in the Jing-Jin-Ji from 2000 to 2018. The abscissa was the different urban units in Jing-Jin-Ji, and the ordinate was the change rate (slope) of precipitation corresponding to different urban units. A, B, and C are summer, winter, and annual respectively. (A–C) are summer, winter, and annual respectively.
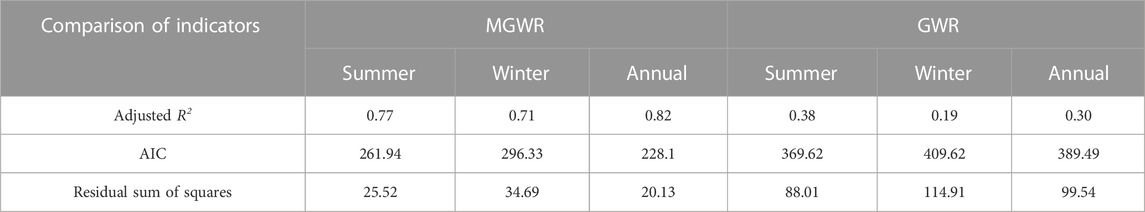
TABLE 1. Comparison of model indexes between MGWR and GWR.
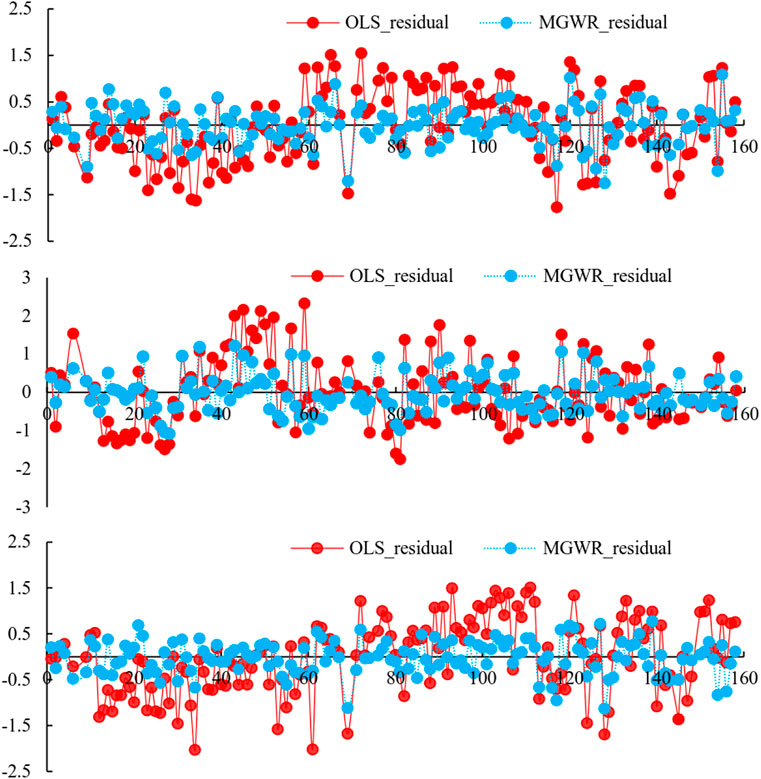
FIGURE 4. Comparison of prediction residuals between MGWR and OLS in different urban units. The abscissa was the different urban units in Jing-Jin-Ji, and the ordinate was the change rate (slope) of precipitation corresponding to different urban units.
The changes in precipitation in various cities during different seasons in the Jing-Jin-Ji are shown in Figures 2A–C. For the differences in precipitation between urban and suburban areas, the slope of the changes in urban precipitation in five periods was calculated using a trend analysis, and the results are shown in Supplementary Figure S1. Precipitation in the Jing-Jin-Ji mainly occurred during summer, accounting for more than 70% of the overall precipitation throughout the year, while there was little precipitation in winter. Therefore, only the evolution diagrams that show the differences between the average precipitation and background value in summer and throughout the whole year are presented herein (Supplementary Figures S2, S3).
As shown in Supplementary Figure S1, the average precipitation changes in various urban units in the Jing-Jin-Ji during different seasons from 2000 to 2018 differed significantly (Wei et al., 2022). In summer, the areas with increased precipitation were the large urban areas of Beijing, which was consistent with the results reported by Yang et al. (2019), and small towns located in the northeast of Zhangjiakou and Qinhuangdao and the south of Shijiazhuang, Xingtai, and Handan. Cities and towns such as Baoding and Tianjin (Supplementary Figure S1A) were areas with reduced precipitation. In winter, precipitation increased slightly in downtown areas and was primarily distributed across urban areas of Beijing, consistent with the results of Song et al. (2019), Baoding city and its surrounding towns, and Shijiazhuang. In contrast, in Tianjian, the northeast of Tangshan and Qinhuangdao, and in towns and cities in the south of Handan and Xingtai, precipitation decreased (Supplementary Figure S1B). Over the whole year (Supplementary Figure S1C), precipitation in different cities and towns showed a decreasing seasonal trend. Areas with significant decreases were mainly located in the south of the Jing-Jin-Ji, whereas the decrease was relatively low in the northern region, highlighting a decreasing gradient from south to north. Compared with the background value, the trend of precipitation changes in the entire Jing-Jin-Ji inner urban area was not obvious, with a coefficient of −0.012 (p < 0.01) (Supplementary Figure S2), which is consistent with the results of Jiang and Li (2014). During summer, the variation trend of the imparity between the urban areas across the entire Jing-Jin-Ji and of the background value over time was slightly positive (coefficient 0.0772, p < 0.01) (Supplementary Figure S3). However, urban precipitation in different regions varied greatly in space.
It is thus evident that there were significant variations in precipitation across different areas despite similar geographical locations and climate. Additionally, the contrast analysis shown in Supplementary Figures S1A–C shows that the precipitation in different cities, urban areas, and suburbs varied significantly, thus highlighting that the differences in degree of urbanization had a great influence on precipitation. As such, it is necessary to analyse the spatial heterogeneity and scale of the driving factors of precipitation changes.
Spatial scale effects can be determined using the bandwidths of different influencing factors after MGWR regression (Li et al., 2020; Li and Fotheringham, 2020; Wei et al., 2021). The smaller the bandwidth, the smaller the scale of the influence. Since urban units were the focus of this research, the scales encompassing areas larger than cities were categorised as regional or global scales. However, at present there is no unified definition of scale size. Therefore, this study combined the sample sizes with variable bandwidth ratios to re-define the scale: a bandwidth ratio of 0%–30% was defined as a small regional impact; 30%–50% a medium regional impact; 50%–70% a large regional impact; and >70% was defined as a global impact.
It can be seen from Table 2 that the bandwidths of all factors passed the 95% significance test. However, there were certain distinctions between the impact scales of the variables in different seasons. In summer, the average bandwidth of the intercept was ≤44, accounting for approximately 28.21% of the total, thus belonging to the small regional scale. Notably, since the minimum bandwidth in the model was 44, values of less than 44 all had a bandwidth of 44. Due to the complexity of the factors affecting precipitation changes, certain variables (e.g.,: urban form, landscape fragmentation, etc.) were omitted in this study. Therefore, the intercept indicated the influence of different geographical locations on the precipitation change for selected variables (Shen et al., 2020).
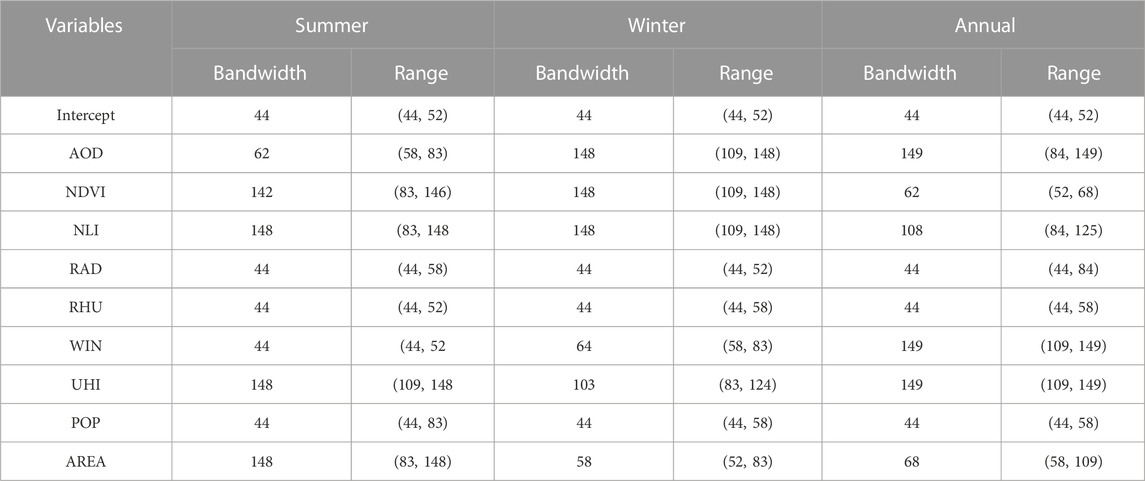
TABLE 2. MGWR bandwidths (Bandwidth Confidence Intervals: 95%).
As shown in Figure 5A, regardless of the season, the intercept had the smallest bandwidth, which indicated that precipitation changes in different seasons were sensitive to regional factors. Further, in line with our hypothesis, natural and human factors varied with locations owing to the different geographical conditions, and the inter-connected impact factors were getting more complex. Since this study focussed on impact factors with certain typical features, some variables (such as urban form, landscape fragmentation, etc.) were omitted. In such a case, the bandwidth of the intercept became very small, indicating that the location factor had strong spatial heterogeneity. Additionally, in summer, the average bandwidth of RAD, RHU, WIN, and POP was ≤44, which was similar to that of the intercept and accounted for 0%–30% of the sample size. This indicated that the scope of the influence of these four variables could be classified as being on a small regional scale, indicating that there was significant spatial heterogeneity in the influence of these factors on precipitation during the summer. Among these four variables, RAD, RHU, and WIN were natural factors, while POP was a social factor. As such, changes in natural factors caused by urbanization may have had a greater impact on the variation in precipitation than socio-economic factors, which is consistent with the conclusions of a study conducted by Wei et al. (2020). The average bandwidth of AOD was 62, accounting for 39.74% of the total; being within 30%–50%, this indicated that its influence acted on a medium regional scale. The proportions of the other variables were all greater than 80%, suggesting little to no spatial heterogeneity and global impact.

FIGURE 5. Percentages of the bandwidths of each impact factor, where the blue bars represent a small regional scale, the red ones a medium regional scale, the green ones a large regional scale, and the yellow bars a global scale. (A–C) are summer, winter and Annual respectively.
In winter, the average bandwidths of RAD, RHU, and POP were also ≤44, accounting for 28.21%, thus belonging to the small regional impact scale, which is consistent with the results for summer. As shown in Figure 5B, RAD, RHU, and POP had a small regional impact on the annual changes irrespective of the season, indicating that variations in these three factors had a strong, spatially heterogeneous effect on precipitation changes in the Jing-Jin-Ji throughout the year. The average bandwidths of AREA and WIN were 58 and 64, accounting for 37.18% and 41.03%, respectively, thus having a medium regional impact. UHI accounted for 66.03%; therefore, being in the range of 50%–70%, it was categorised as belonging to the large regional scale. The bandwidth ratios of the other factors were all greater than 80%, which indicated that they did not have spatial heterogeneity and that their impacts were global. In terms of the annual change scale, it can be seen in Figure 5C that, among the small-scale factors influencing precipitation, natural factors were more dominant, whereas on the large and global scales, anthropogenic factors such as NLI, AOD, and UHI were more dominant.
In the MGWR regression results, the number of factors that passed the Monte Carlo 95% significance test varied across seasons (Table 3). Except for the intercept, the overall coefficients of AOD, RAD, RHU, WIN, and POP were significant in summer and passed the Monte Carlo significance test (p < 0.05), whereas the regression coefficients of NDVI, NLI, UHI, and AREA were not significant (p > 0.05) (Table 3). In winter, in addition to location factors, variables that passed the Monte Carlo 95% significance test included RAD, RHU, WIN, UHI, POP and AREA (Table 3). There were more factors affecting precipitation and passing the 95% significance test in winter than in summer, which indicated that the mechanisms that influence precipitation changes in cities of the Jing-Jin-Ji in winter may be more complex owing to a decrease in temperature, which is similar to the conclusion of Wei et al. (2020). In terms of annual changes, only RAD, RHU, and POP passed the Monte Carlo significance test (p < 0.05). Factors that passed the 95% significance test had strong spatial heterogeneity in their impact on precipitation, whereas those that failed to pass it had weak to no spatial heterogeneity. The spatial heterogeneity of AOD, RAD, RHU, WIN, and POP in summer was relatively strong; similarly, the spatial heterogeneity of RAD, RHU, WIN, UHI, POP, and AREA in winter and that of RAD, RHU, and POP throughout the year was relatively strong. As shown in Figures 5A–C, the influences of the factors that passed the 95% significance test were mostly of a medium and small scale, which further indicated relatively strong spatial heterogeneity. In terms of summer, winter, and annual precipitation changes, changes in natural factors, such as RHU and RAD, had a significant impact on precipitation during urbanization, whereas socio-economic factors, such as population changes, had a greater impact on the spatial distribution of urban precipitation changes.
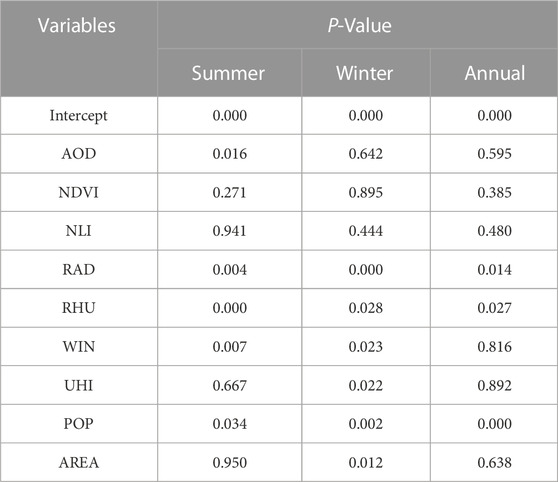
TABLE 3. Monte Carlo test for spatial variability.
As can be seen in Table 4, in summer, the intercept (location) had both positive and negative impacts on precipitation, and the average value was small but negative, indicating that geographical location changes had an important impact on the spatial distribution pattern of precipitation changes. The minimum bandwidth of the constant in Table 2 and Figure 4 further indicated that the zone had significant spatial heterogeneity. The average AOD values in different seasons were positive and negative. The minimum, maximum, and mean values of the AOD in summer were positive, indicating that AOD had a positive effect on precipitation in summer. Due to the temperate monsoon climate in the Jing-Jin-Ji, the humidity in summer is relatively high, and AOD can be used as an indicator for condensation, which can be conducive to higher precipitation. Since the AOD did not pass the 95% significance test in winter and over the whole year, the spatial heterogeneity of the negative effect of AOD changes on precipitation was concluded to be relatively small or non-existent. However, both the maximum and minimum values of the AOD coefficient were negative, which was consistent with our understanding of the Jing-Jin-Ji. Since the weather in the Jing-Jin-Ji is cold and dry during winter, the relative humidity of the atmosphere is low. When AOD concentration increases, the impact efficiency of water droplets is reduced; thus, the precipitation probability decreases accordingly.
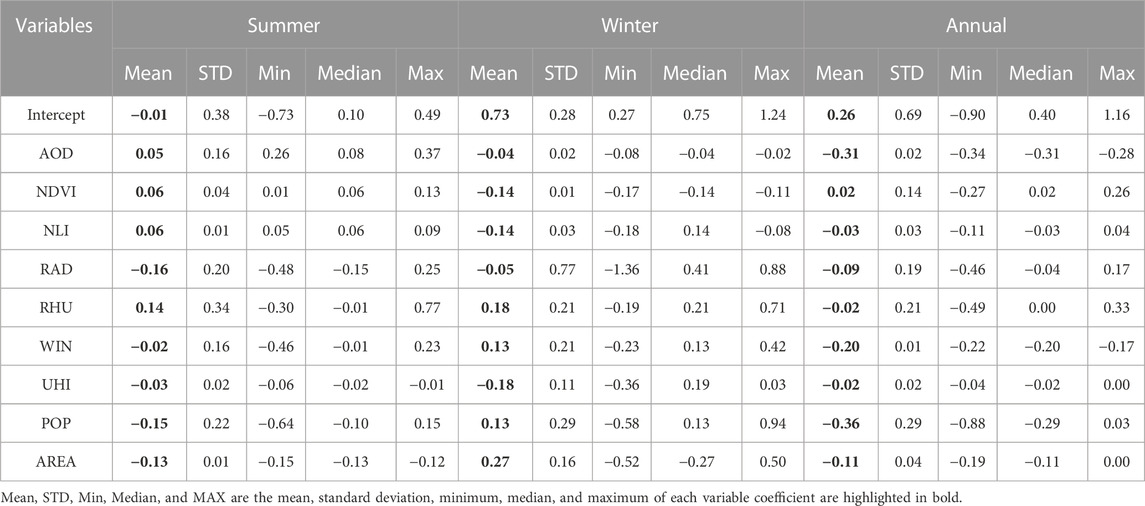
TABLE 4. Summary statistics for MGWR parameter estimates.
The mean value of the RAD coefficient was negative across seasons, while the minimum and maximum values were positive and negative, respectively, indicating that there was a large difference in the influence of RAD between different cities. The mean value of the RHU coefficient was positive both in summer and winter and the absolute value of the average coefficient was large, presenting as 0.14 and 0.18 respectively. This indicated that high humidity was conducive to precipitation. However, for the whole year, the average coefficient was −0.02, and its median was 0.00. Thus, comparing most urban units, relative humidity had a weak influence on annual precipitation changes. However, it is possible that relative humidity had a weak influence on precipitation in both spring and autumn, thus weakening its influence over the entire year. The mean WIN coefficient was negative in summer and over the whole year, with −0.02 and −0.20, respectively, but 0.13 in winter. This suggested that the mean WIN coefficient may also be negative in spring and autumn. From summer to winter, the influence of the WIN gradually changed from negative to positive. Generally, wind has both direct and indirect effects on precipitation. First, owing to the urban canopy, the air stream bifurcates and bypasses the urban area, then converges and lifts downwind to form precipitation or promote the convergence and rise of water vapour. Second, wind can indirectly affect precipitation through UHIs. Some scholars have shown that when wind speed increases, UHIs are weaker and atmospheric movement is dominated by dynamic thermal action. Urban atmospheric instability is enhanced and urban precipitation is increased (Zhang H. Y. et al., 2017; Jiang et al., 2020). The fact that the data used in this study were collected for the inner city may explain why WIN was found to have a negative impact on precipitation in summer. However, since more than 75% of the precipitation in the Jing-Jin-Ji occurs in summer, a negative average annual variation coefficient can be expected. In winter, when relative humidity is low and wind speeds are relatively high, the air flow converges and lifts at a higher height when blocked by the urban canopy. Hence, water vapour can easily condense to form precipitation. The mean UHI coefficient in summer and over the whole year did not pass the significance test (p > 0.05), indicating that the influence of UHI on the spatial distribution characteristics of precipitation changes did not have distinctive features in those periods. However, in winter the average coefficient showed a weak negative correlation, which is consistent with the conclusions drawn by Wang et al. (2018); Gu and Li (2018) carried out experimental studies on the sensitivity of UHIs and precipitation in the United States and found that UHI intensity was positively correlated with precipitation in summer but associated with less precipitation in winter. This conclusion was confirmed by ESM2Mb and Princeton forced experiments (Gu and Li, 2018). The so-called “urban dry islan” effect results in less precipitation in winter because UHIs enhance the sub-cloud evaporation process and reduce surface precipitation. The relationship between UHIs and precipitation in the Jing-Jin-Ji based on the MGWR found in this study conforms with these findings.
The mean POP coefficient had similar trends in summer and over the whole year, but had both negative and positive values in winter. In terms of the maximum and minimum values of the coefficients, the maximum values in summer, winter, and over the whole year were positive, whereas the minimum values were negative, and the modes were negative. These results indicated that the influence of POP was spatially heterogeneous across different regions. The average AREA coefficient in summer and over the whole year did not pass the significance test (p > 0.05); however, in winter the maximum was positive (0.50), the minimum was negative (−0.52), and the average was positive (0.16) (p < 0.05). Similar to POP, this may indicate large spatial heterogeneity in winter, which needs to be analysed further.
To better observe the spatial distribution characteristics of variables with significant spatial heterogeneity, the cities that passed the 95% significance test for each variable were extracted and plotted on a map (Figures 6, 10, 11). Figures 6, 7, 8 demonstrate the spatial distribution of the influencing factors in summer, winter, and over the whole year across the Jing-Jin-Ji, respectively.
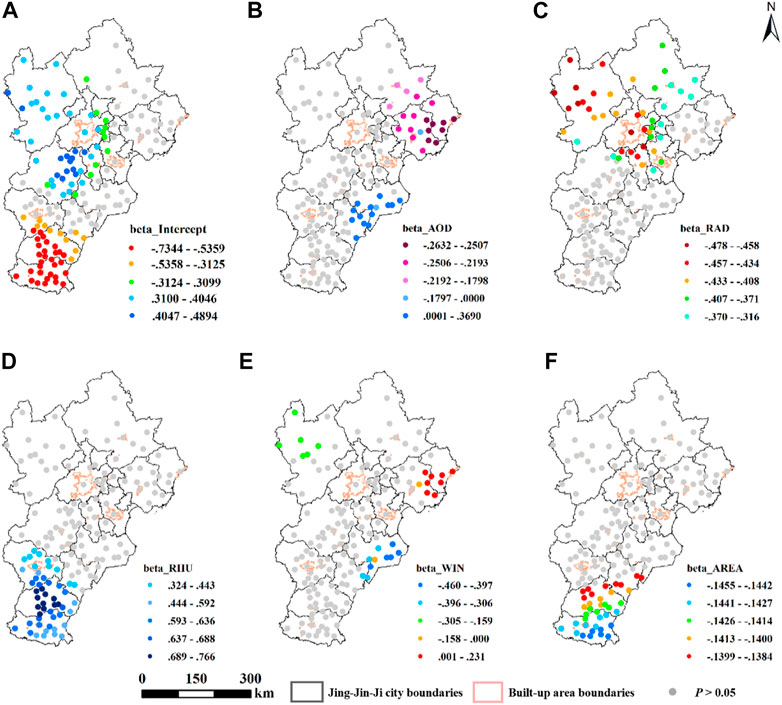
FIGURE 6. Spatial patterns of the MGWR coefficients in summer, where the coloured solid points are cities that passed 95% significance test (p < 0.05) and the gray solid points are cities that did not pass the 95% significance test (p > 0.05). (A) is the intercept, (B) the AOD, (C) the RAD, (D) the RHU, (E) the WIN, and (F) the AREA.
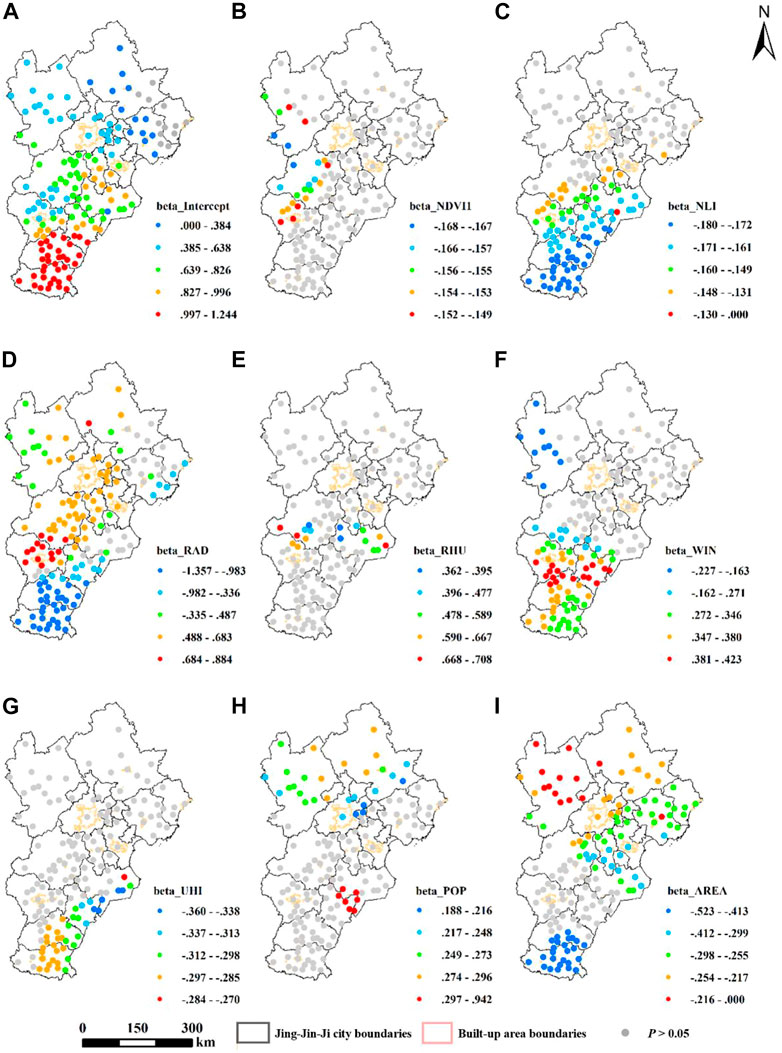
FIGURE 7. Spatial patterns of the MGWR coefficients in winter, where the coloured solid points are cities that passed 95% significance test (p < 0.05) and the gray solid points are cities that did not pass the 95% significance test (p > 0.05). (A) is the intercept, (B) the NDVI, (C) the NLI, (D) the RAD, (E) the RHU, (F) the WIN, (G) the UHI, (H) the POP, and (I) the AREA.
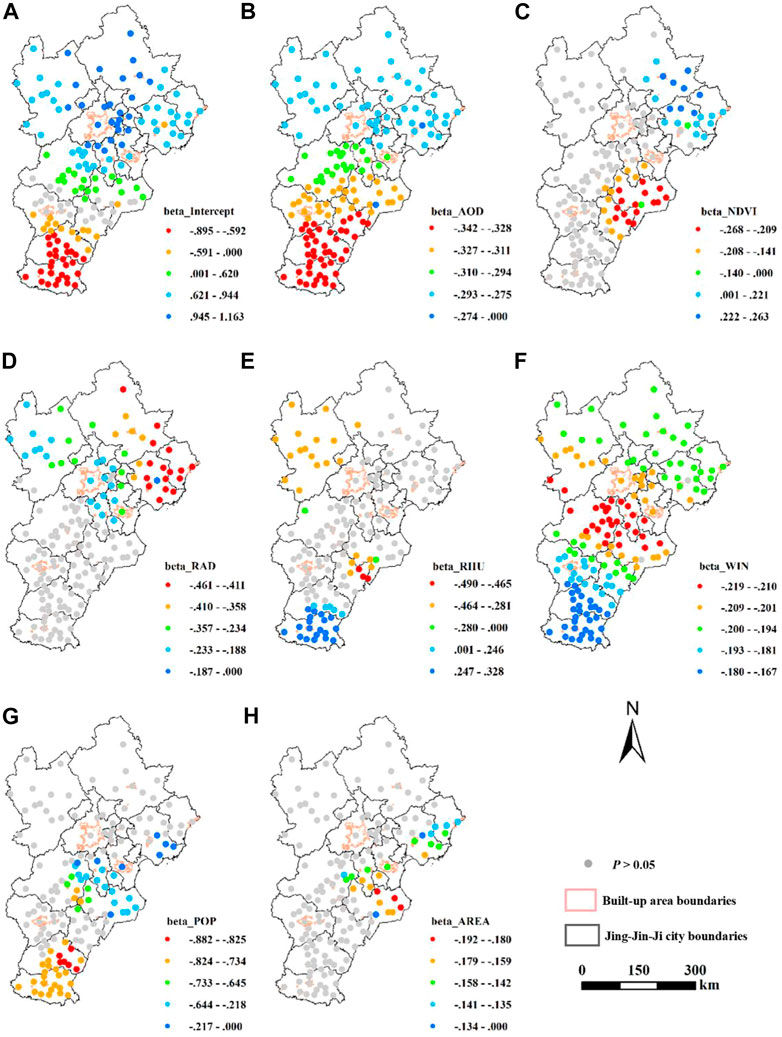
FIGURE 8. Spatial patterns of the MGWR coefficients in annual, where the coloured solid points are cities that passed 95% significance test (p < 0.05) and the gray solid points are cities that did not pass the 95% significance test (p > 0.05). (A) is the intercept, (B) the AOD, (C) the NDVI, (D) the RAD, (E) the RHU, (F) the WIN, (G) the POP, and (H) the AREA.
As can be seen from the figures, in summer (Figure 6A), winter (Figure 7A), and over the whole year (Figure 8A), the intercept was charaterised by a gradient from north to south. Areas with positive coefficients were mainly located in the north, such as Beijing, Baoding, and Zhangjiakou. In the southern regions, such as in the cities of Handan and Xingtai, the intercept showed a negative trend. In addition, the spatial variation of the coefficient generally showed a trend from south to north and gradually turned from negative to positive, especially in the mountainous region to the northwest. The spatial heterogeneity was highly significant, indicating that the changes in location had an important impact on precipitation diversity.
In summer, the impact of AOD on precipitation was mainly distributed in the northeast of the Jing-Jin-Ji, including southeast Chengde, Tangshan, and Qinhuangdao, as well as the southeast, represented by Cangzhou. These included the northeast regional AOD, where a negative effect on precipitation was found, and the positive effect of AOD in the southeast (Figure 6B). The spatial heterogeneity in other regions was not significant. Over the entire year, the influence of AOD on precipitation was negative, and the absolute value gradually decreased from south to north (Figure 8B). The spatial heterogeneity of the annual variation of the effect of AOD on precipitation in summer was more evident than across the whole year. The areas with significant RAD spatial heterogeneity in summer were mainly those in the northern and north-western parts, including Beijing, Tianjin, Zhangjiakou, and Chengde; in the south, spatial heterogeneity was weak or non-existent. The influence of RAD on precipitation in these regions was mainly negative, and the absolute value of the coefficient in the northwest was larger than that in Chengde in the north (Figure 6C). The spatial heterogeneity of RAD in winter was more significant. In the south, Handan, Xingtai, Hengshui, and some urban units in the northwest and northeast had negative values, whereas the central region, including Shijiazhuang, Baoding, Beijing, and Tianjin, had positive ones (Figure 7D). The variation in RAD was negatively correlated with precipitation throughout the whole year, and the distribution of significant areas with spatial heterogeneity was similar to that in summer. In annual, the spatial heterogeneity in Qinhuangdao and Tangshan in the northeast differed significantly (Figure 8D), resulting in this disparity. The spatial heterogeneity of the RHU varied across seasons. In summer, the spatial heterogeneity of the RHU was mainly distributed across Handan, Xingtai, Shijiazhuang, and other places in the south (Figure 6D). In winter, only some cities, such as Cangzhou in central Baoding, had strong spatial heterogeneity, while other regions had no or weak spatial heterogeneity (Figure 7E). Throughout the whole year, the spatial heterogeneity of RHU was relatively strong in Handan, some cities in Xingtai in the south, and in Zhangjiakou in the northwest (Figure 8E). In terms of the relationship with precipitation, the RHU across seasons was positively correlated with precipitation, indicating that the higher the humidity, the more conducive it is to precipitation. The areas with significant WIN spatial heterogeneity in summer were mainly cities such as Cangzhou in the southeast, Qinhuangdao in the northeast, and Tangshan and Zhangjiakou in the northwest. However, compared with the entire Jing-Jin-Ji, the number of urban units with spatial heterogeneity in the impact of WIN on precipitation was small (Figure 6E). The higher the humidity, the more conducive it was to precipitation. In winter, significant spatial heterogeneity of WIN was mainly found in Handan, Xingtai, and Cangzhou in the south and west, and in Zhangjiakou in the northwest. The positive effect of WIN on precipitation primarily appeared in the south, while the negative effects were mainly observed west of Zhangjiakou. Throughout the whole year, the distribution of the influence of WIN on precipitation appeared negative, and the degree of the negative effect gradually weakened from Baoding and Langfang, located in the middle, to the outer boundaries in the south. The significant spatial distribution of AREA differed between seasons. However, as can be seen from Figures 6F, 7I, and H8H, the impact of AREA on precipitation in areas with significant spatial heterogeneity was mainly negative. The regions with significant spatial heterogeneity of UHI were mainly those in the southeast of Beijing, Tianjin, and Hebei in winter, and the effect was mainly negative (Figure 7G). This may be related to the fact that UHIs change the saturation of atmospheric water vapour.
As can be seen from Figures 6–8, there may be two or more factors with significant spatial heterogeneity superimposed in certain regions with a significant agglomeration effect across seasons, which were defined as a typical region. To detect the significance ordering of the main impact factors on precipitation changes in different cities, a hierarchical regression analysis was used to obtain the independence of the explanation of each influence factor. The greater the changes in R2, the greater the influence of the corresponding factor on precipitation. A multi-level regression was used to analyse the importance of the selected factors since they were clustered in space, indicating that their variance across layers was small. Therefore, the use of multi-level regression to calculate specific regions could reduce the error to a minimum to obtain more reliable conclusions.
According to the MGWR results, there was a significant agglomeration phenomenon of impact factors areas in summer, with the typical areas that passed the significance test mainly distributed in town units in the south of Xingtai and Handan (Figure 9). This resulted in a significant spatial heterogeneity in both RHU and AREA. The regression results showed that the R2 variation of AREA was 0.175 (p < 0.05) while that of RHU was 0.08 (p < 0.05). Therefore, the change in AREA was the most important factor influencing precipitation changes in Xingtai and Handan in summer.
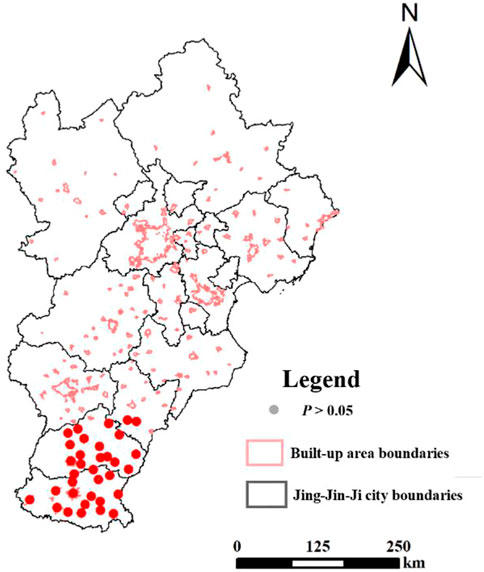
FIGURE 9. Typical regional distribution in summer. The red solid points are areas with a superposition of RHU and AREA.
Figure 10 shows the three regions that had significant spatial agglomeration factors and passed the significance test in winter. Specifically, region 1 mainly included urban units in cities of the Beijing-Zhangjiakou-Chengde area. The factors of significant spatial heterogeneity in this region were POP, RAD, and AREA, and the △R2 was 0.291 (p < 0.05), 0.019 (p < 0.05), and 0.084 (p < 0.05), respectively. Thus, in region 1, the change in POP was the most important factor affecting precipitation changes in winter, followed by the change in RAD. Region 2 mainly contained urban units located in the Shijiazhuang-Hengshui area, where the factors with significant spatial heterogeneity were RAD and NLI, indicating that radiation change and human activity intensity had an important impact on precipitation changes in this region. The R2 variation was 0.111 (p < 0.05) and 0.091 (p < 0.05), respectively, indicating that the change in RAD was the main factor affecting this region. Region 3 mainly consisted of urban units in the Handan-Xingtai region, and the significant factors influencing precipitation change in this region included RAD, NLI, AREA, WIN, and UHI. Among them, AREA had the most significant influence, with an △R2 of 0.310, followed by NLI with 0.017. The changes in RAD, UHI, and WIN were relatively small, with 0.007, 0.002, and 0.003, respectively. As such, the most important factors affecting the change in urban precipitation in winter in the Handan-Xingtai area were related to urban expansion and human activity intensity (Figure 11).
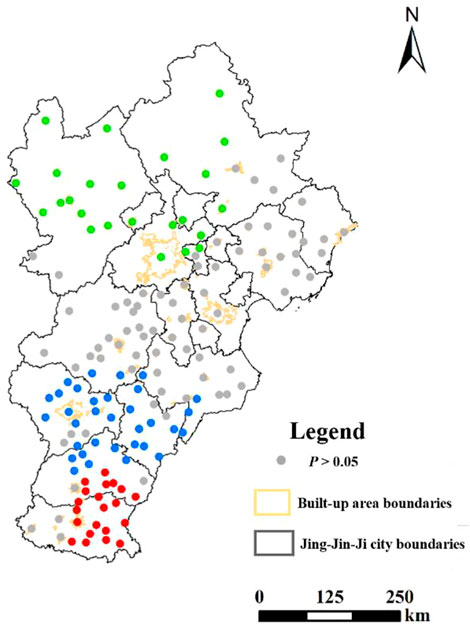
FIGURE 10. Typical regional distribution in winter. RHU and AREA show regions with significant spatial heterogeneity. where the coloured solid points are cities that passed 95% significance test (p < 0.05) and the gray solid points are cities that did not pass the 95% significance test (p > 0.05). The green solid points (region 1) are areas with a superposition of POP, RAD, and AREA, the blue solid points (region 2) are areas with a superposition of RAD and NLI, thee red solid points (region 3) are areas with a superposition of RAD, NLI, AREA, WIN, and UHI.
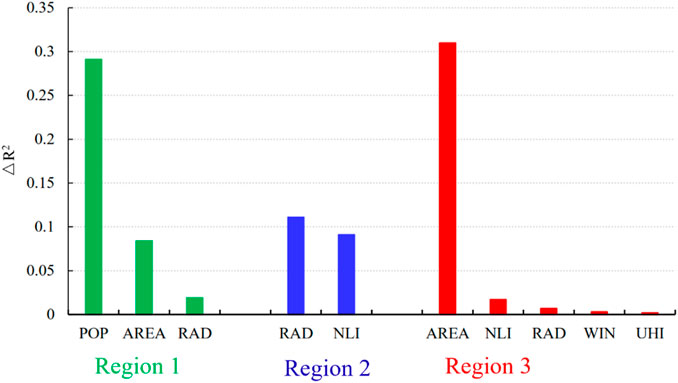
FIGURE 11. Ranking of important factors in three regions in winter. Regions 1–3 correspond to the regions represented by the solid dots of the same colour in Figure 10.
At the annual scale, four typical regions with significant agglomeration factors passed the significance test, as shown in Figure 12. Region 1 mainly comprised most urban units located in the northern Beijing-Tianjin-Hebei region, such as Beijing, Zhangjiakou, Chengde, Tangshan, and Qinhuangdao. This region mainly had superimposed RAD, AOD, and WIN (Figure 13) and the R2 values of these variables were 0.058 (p < 0.05), 0.059 (p < 0.05), and 0.086 (p < 0.05), respectively. Thus, it can be concluded that changes in WIN were the main factor affecting precipitation in this region (Figure 12), whereas the changes in RAD and AOD had little influence. Region 2 mainly included urban units located in the Tianjin-Cangzhou-Langfang and eastern Baoding regions, with a superposition of AOD, NDVI, POP, AREA, and WIN. Their R2 values were 0.006 (p < 0.05), 0.198 (p < 0.05), 0.394 (p < 0.05), 0.023 (p < 0.05), and 0.001 (p < 0.05), respectively. Thus, population changes had the greatest influence on precipitation in this region. Region 3 mainly included Handan and other urban units in the southern part of the Jing-Jin-Ji, with a superposition of POP (△R2 = 0.046), RHU (△R2 = 0.357), WIN (△R2 = 0.001), and AOD (△R2 = 0.005). Among them, RHU was the most important influencing factor, which could explain 35.7% of the precipitation variation in the region. Region 4 mainly comprised most urban units in the northeast of the Jing-Jin-Ji, such as Qinhuangdao, northern parts of Tangshan, and eastern regions of Chengde. In addition to the three elements present in region 1, this region was also affected by NDVI. The △R2 of RAD, AOD, WIN, and NDVI was 0.447 (p < 0.05), 0.092 (p < 0.05), 0.015 (p < 0.05), and 0.027 (p < 0.05), respectively. Therefore, RAD was the most important influencing factor here.
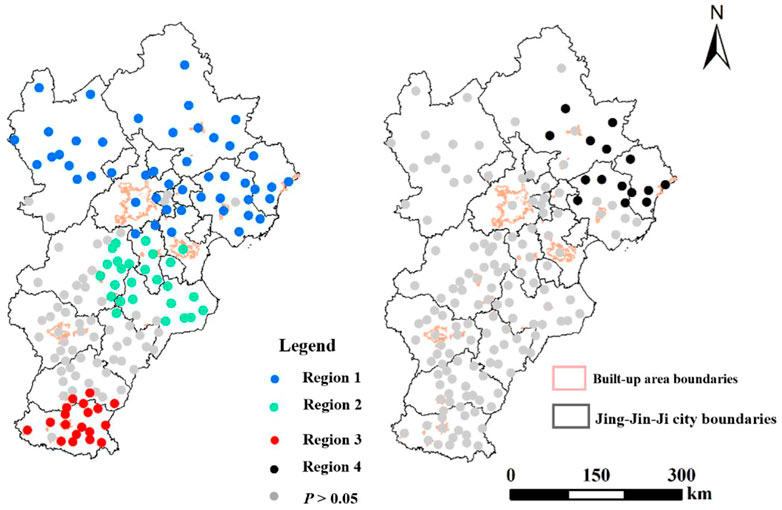
FIGURE 12. Typical regional distribution of annual changes, where the coloured solid points are cities that passed 95% significance test (p < 0.05) and the gray solid points are cities that did not pass the 95% significance test (p > 0.05). The blue solid points (region 1) are areas with a superposition of RAD, AOD, and WIN, the green solid points (region 2) are areas with a superposition of AOD, NDVI, POP, AREA, and WIN, the red solid points (region 3) are areas with a superposition of POP, RHU, WIN and AOD, the black solid points (region 4) are areas with a superposition of RAD, AOD, WIN, and NDVI.
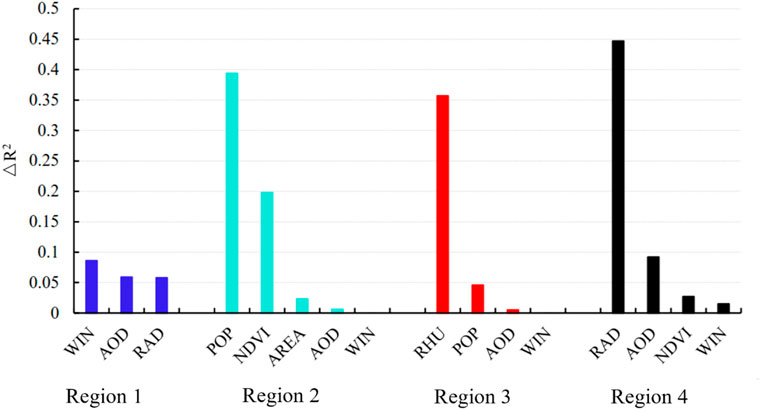
FIGURE 13. Ranking of important factors of annual changes in four regions. Regions 1–4 correspond to the regions represented by the solid dots of the same colour in Figure 12.
Based on an MGWR, this study analysed the impact scale and spatial heterogeneity distribution characteristics of influencing factors of urban precipitation changes in 156 urban units in the Jing-Jin-Ji. The following conclusions were drawn.
(1) In summer, the influence of RAD, RHU, WIN, and POP was on a small regional scale; AOD acted on a medium regional scale; NDVI, NLI, UHI, and AREA did so on a global scale. In winter, AREA and WIN had a medium regional influence, UHI are large one, and AOD, NDVI, and NLI had global ones. Considering the whole year, the influence of NDVI and AREA was at a medium regional scale, that of NLI on a large regional scale, and that of AOD, WIN, and UHI on a global scale.
(2) Natural factors, such as RAD and RHU, had a greater impact on the spatial heterogeneity of precipitation changes across seasons, whereas human factors, such as NLI and UHI, had a smaller impact. In summer, the significant area of influence of AOD comprised the southeast of Tangshan and northeast of Qinhuangdao in the Beijing-Tianjin-Hebei and Cangzhou regions. The areas significantly affected by RAD were Beijing, Zhangjiakou, and Chengde, where it had a negative effect on precipitation. The areas significantly affected by RHU and AREA were primarily Handan and Xingtai in the south. AREA changes had the greatest influence and a negative effect on precipitation, being the most important influencing factor of precipitation reduction in most urban units in Handan and Xingtai in summer. In winter, RAD, NLI, AREA, WIN, and UHI showed significant spatial heterogeneity in the urban units of Handan and Xingtai in the southern part of the Beijing-Tianjin-Hebei region, and, among them, AREA had the most significant effect. In the Shijiazhuang-Hengshui area, RAD and NLI played important roles. In the Beijing-Zhangjiakou-Chengde area, the most important factor affecting precipitation changes was variation in POP. In terms of annual variation, in most urban units in the northern Beijing-Tianjin-Hebei region, changes in WIN were the most important factor affecting precipitation changes. In the Tianjin-Cangzhou-Langfang area and eastern urban units of Baoding, changes in POP had the greatest impact on precipitation, and in Handan and other urban units in the southern Beijing-Tianjin-Hebei region, RHU had the highest effect.
The inclusion of a large number of urban units of the Jing-Jin-Ji compensated for the limitations of previous studies focussing on single cities and enabled us to avoid problems of contingency. The results can provide a solid foundation for the coordinated development of the Jing-Jin-Ji and the formulation of differentiated climate policies for different cities. However, this study had some limitations. To investigate the precipitation changes resulting from urbanization of inner cities in different periods, this study used the year 2000 for border extraction. This approach guaranteed that the classified urban areas were always within the limit of the actual urban areas, but did not take into account that the city’s influence on regional precipitation is not only confined to the inner city. Thus, this study did not investigate the factors leading to precipitation changes outside of urban areas. Furthermore, this study focussed on the effects of urbanization on precipitation, while the physical mechanisms of precipitation changes (e.g., latent heat, sensible heat flux, and albedo changes) were not investigated. As such, future studies should be appropriately combined with a WRF model and analyse the hidden factors influencing precipitation changes resulting from urbanization.
The raw data supporting the conclusion of this article will be made available by the authors, without undue reservation.
This manuscript is the result of the research of FW under the supervision of SL and DL, and the advising of ZL, JS, YW, HW, YZ, and YW. FW wrote the paper. All authors contributed to the article and approved the submitted version.
We thank the Ministry of Natural Resources High-Level Science and Technology Innovation Talent Project Funding Project (121106000000180039-2022), the Key Fund of National Natural Science Foundation of China (42230506) and the Construction of Key Laboratory of Coastal Zone Science and Integrated Management (GY0223L08) for their support.
The authors declare that the research was conducted in the absence of any commercial or financial relationships that could be construed as a potential conflict of interest.
All claims expressed in this article are solely those of the authors and do not necessarily represent those of their affiliated organizations, or those of the publisher, the editors and the reviewers. Any product that may be evaluated in this article, or claim that may be made by its manufacturer, is not guaranteed or endorsed by the publisher.
The Supplementary Material for this article can be found online at: https://www.frontiersin.org/articles/10.3389/fenvs.2023.1161106/full#supplementary-material
Debbage, N., and Shepherd, J. M. (2019). Urban influences on the spatiotemporal characteristics of runoff and precipitation during the 2009 Atlanta flood. J. Hydrometeorol. 20, 3–21. doi:10.1175/jhm-d-18-0010.1
Dimitrova, R., Danchovski, V., Egova, E., Vladimirov, E., Sharma, A., Gueorguiev, O., et al. (2019). Modeling the impact of urbanization on local meteorological conditions in sofia. Atmosphere 10, 366. doi:10.3390/atmos10070366
Elhacham, E., and Alpert, P. (2021). Temperature patterns along an arid coastline experiencing extreme and rapid urbanization, case study: Dubai. Sci. Total Environ. 784, 147168. doi:10.1016/j.scitotenv.2021.147168
Fan, J., Zhang, Y., Li, Z., Hu, J., and Rosenfeld, D. (2020). Urbanization-induced land and aerosol impacts on sea-breeze circulation and convective precipitation. Atmos. Chem. Phys. 20, 14163–14182. doi:10.5194/acp-20-14163-2020
Fotheringham, A., Yue, H., and Li, Z. (2019). Examining the influences of air quality in China's cities using multi-scale geographically weighted regression. Trans. GIS 23, 1444–1464. doi:10.1111/tgis.12580
Glisan, M, J., and Gutowski, J, W. (2014). WRF summer extreme daily precipitation over the CORDEX Arctic. J. Geophys. Res. Atmos. 119, 1720–1732. doi:10.1002/2013jd020697
Gu, Y., and Li, D. (2018). A modeling study of the sensitivity of urban heat islands to precipitation at climate scales. Urban Clim. 24, 982–993. doi:10.1016/j.uclim.2017.12.001
Han, J. Y., Baik, J. J., and Khain, A. P. (2012). A numerical study of urban aerosol impacts on clouds and precipitation. J. Atmos. Sci. 69, 504–520. doi:10.1175/jas-d-11-071.1
Huang, X., Wang, D., Ziegler, A. D., Liu, X., Zeng, H., Xu, Z., et al. (2022). Influence of urbanization on hourly extreme precipitation over China. Environ. Res. Lett. 17, 044010. doi:10.1088/1748-9326/ac59a6
Jiang, X., Luo, Y., Zhang, D.-L., and Wu, M. (2020). Urbanization enhanced summertime extreme hourly precipitation over the yangtze river delta. J. Clim. 33, 5809–5826. doi:10.1175/jcli-d-19-0884.1
Jiang, Z., and Li, Y. (2014). Impact of urbanization in different regions of eastern China on precipitation and its uncertainty. J. Trop. Meteorol. 30, 601–611.
Koroso, N. H., Lengoiboni, M., and Zevenbergen, J. A. (2021). Urbanization and urban land use efficiency: Evidence from regional and Addis Ababa satellite cities, Ethiopia. Habitat Int. 117, 102437. doi:10.1016/j.habitatint.2021.102437
Li, C., Yang, H., and Zhao, J. (2019). Combinational anomalies of atmospheric circulation system and occurrences of extreme weather/climate events. Trans. Atmos. Sci. 42, 321–333.
Li, F., Luo, Q., Lin, W., Li, J., and Jiang, B. (2022). Simulating the impact of biomass burning aerosols on an intensive precipitation event in urban areas of the Pearl River Delta. Atmos. Res. 266, 105966. doi:10.1016/j.atmosres.2021.105966
Li, X. X., Koh, T. Y., Panda, J., and Norford, L. K. (2016). Impact of urbanization patterns on the local climate of a tropical city, Singapore: An ensemble study. J. Geophys. Res.-Atmos. 121, 4386–4403. doi:10.1002/2015jd024452
Li, Z., and Fotheringham, A. S. (2020). Computational improvements to multi-scale geographically weighted regression. Int. J. Geogr. Inf. Sci. 34, 1378–1397. doi:10.1080/13658816.2020.1720692
Li, Z., Fotheringham, A. S., Li, W., and Oshan, T. (2019). Fast geographically weighted regression (FastGWR): A scalable algorithm to investigate spatial process heterogeneity in millions of observations. Int. J. Geogr. Inf. Sci. 33, 155–175. doi:10.1080/13658816.2018.1521523
Li, Z. Q., Fotheringham, A. S., Oshan, T. M., and Wolf, L. J. (2020). Measuring bandwidth uncertainty in multiscale geographically weighted regression using Akaike weights. Ann. Am. Assoc. Geogr. 110, 1500–1520. doi:10.1080/24694452.2019.1704680
Liu, J., Shao, W., Xiang, C., Mei, C., and Li, Z. (2020). Uncertainties of urban flood modeling: Influence of parameters for different underlying surfaces. Environ. Res. 182, 108929. doi:10.1016/j.envres.2019.108929
Lorenz, J. M., Kronenberg, R., Bernhofer, C., and Niyogi, D. (2019). Urban rainfall modification: Observational climatology over Berlin, Germany. J. Geophys. Res.-Atmos. 124, 731–746. doi:10.1029/2018jd028858
Mac Nally, R. (2000). Regression and model-building in conservation biology, biogeography and ecology: The distinction between – And reconciliation of – ‘predictive’ and ‘explanatory’ models. Biodivers. Conservation 9, 655–671. doi:10.1023/a:1008985925162
Meyer, V., Scheuer, S., and Haase, D. (2009). A multicriteria approach for flood risk mapping exemplified at the Mulde river, Germany. Nat. Hazards 48, 17–39. doi:10.1007/s11069-008-9244-4
Oleson, K. W., Anderson, G. B., Jones, B., McGinnis, S. A., and Sanderson, B. (2018). Avoided climate impacts of urban and rural heat and cold waves over the US using large climate model ensembles for RCP8.5 and RCP4.5. Clim. Change 146, 377–392. doi:10.1007/s10584-015-1504-1
Ouyang, X., Tang, L., Wei, X., and Li, Y. (2021). Spatial interaction between urbanization and ecosystem services in Chinese urban agglomerations. Land Use Policy 109, 105587. doi:10.1016/j.landusepol.2021.105587
Patel, P., Ghosh, S., Kaginalkar, A., Islam, S., and Karmakar, S. (2019). Performance evaluation of WRF for extreme flood forecasts in a coastal urban environment. Atmos. Res. 223, 39–48. doi:10.1016/j.atmosres.2019.03.005
Paul, S., Ghosh, S., Mathew, M., Devanand, A., Karmakar, S., and Niyogi, D. (2018). Increased spatial variability and intensification of extreme monsoon rainfall due to urbanization. Sci. Rep. 8, 3918. doi:10.1038/s41598-018-22322-9
Peleg, N., Ban, N., Gibson, M. J., Chen, A. S., Paschalis, A., Burlando, P., et al. (2022). Mapping storm spatial profiles for flood impact assessments. Adv. Water Resour. 166, 104258. doi:10.1016/j.advwatres.2022.104258
Qiu, J. (2012). Urbanization contributed to Beijing storms. Nature 10. 11086. doi:10.1038/nature.2012.11086
Sarangi, C., Tripathi, S. N., Qian, Y., Kumar, S., and Leung, L. R. (2018). Aerosol and urban land use effect on rainfall around cities in indo-gangetic basin from observations and cloud resolving model simulations. J. Geophys. Res.-Atmos. 123, 3645–3667. doi:10.1002/2017jd028004
Seino, N., Aoyagi, T., and Tsuguti, H. (2018). Numerical simulation of urban impact on precipitation in Tokyo: How does urban temperature rise affect precipitation? Urban Clim. 23, 8–35. doi:10.1016/j.uclim.2016.11.007
Shen, T., Yu, H., Zhou, L., Gu, H., and He, H. (2020). Hedonic price of second-hand house in beijing based on multi-scale geographically weighted regression: Scale expansion of spatial heterogeneity. Econ. Geogr. 40. doi:10.15957/j.cnki.jjdl.12020.15903.15001
Song, X., Mo, Y., Xuan, Y., Wang, Q. J., Wu, W., Zhang, J., et al. (2021). Impacts of urbanization on precipitation patterns in the greater Beijing–Tianjin–Hebei metropolitan region in northern China. Environ. Res. Lett. 16, 014042. doi:10.1088/1748-9326/abd212
Song, X., Zhang, J., Zou, X., Zhang, C., AghaKouchak, A., and Kong, F. (2019). Changes in precipitation extremes in the Beijing metropolitan area during 1960-2012. Atmos. Res. 222, 134–153. doi:10.1016/j.atmosres.2019.02.006
Steensen, B., Marelle, L., Hodnebrog, Ø., and Myhre, G. (2022). Future urban heat island influence on precipitation. Clim. Dyn. 58, 3393–3403. doi:10.1007/s00382-021-06105-z
Su, H., Wang, W., Jia, Y., Han, S.-C., Gao, H., Niu, C., et al. (2021). Impact of urbanization on precipitation and temperature over a lake-marsh wetland: A case study in xiong’an new area, China. Agric. Water Manage. 243, 106503. doi:10.1016/j.agwat.2020.106503
Sun, T., Sun, R., Khan, M. S., and Chen, L. (2021). Urbanization increased annual precipitation in temperate climate zone: A case in beijing-tianjin-hebei region of north China. Ecol. Indic. 126, 107621. doi:10.1016/j.ecolind.2021.107621
Tang, Y., Xu, G., Wan, R., and Wang, X. (2022). Characteristics of summer hourly precipitation under different urbanization background in central China. Sci. Rep. 12, 7551. doi:10.1038/s41598-022-11487-z
Uchiyama, R., Okochi, H., Kamiya, J., Asai, D., Kaneko, C., Ogata, H., et al. (2018). The impacts of "urban-induced heavy rains" on the distribution of deposition fluxes of inorganic acidic substances in the Tokyo metropolitan area in summer. Atmos. Res. 200, 109–116. doi:10.1016/j.atmosres.2017.10.008
Un-Habitat, (2020). “The walue of sustainable urbanization,”. World Cities Report (Nairobi, Kenya: Un-habitat)
Wang, J., Feng, J. M., and Yan, Z. W. (2018). Impact of extensive urbanization on summertime rainfall in the beijing region and the role of local precipitation recycling. J. Geophys. Res.-Atmos. 123, 3323–3340. doi:10.1002/2017jd027725
Wei, F., Li, S., Liang, Z., Huang, A., Wang, Z., Shen, J., et al. (2021). Analysis of spatial heterogeneity and the scale of the impact of changes in PM2.5 concentrations in major Chinese cities between 2005 and 2015. Energies 14, 3232. doi:10.3390/en14113232
Wei, F., Liang, Z., Ma, W., Shen, J., Wang, Y., Liu, D., et al. (2022). Dominant factors in the temporal and spatial distribution of precipitation change in the beijing-tianjin-hebei urban agglomeration. Remote Sens. 14, 2880. doi:10.3390/rs14122880
Wei, F., Liang, Z., Wang, Y., Huang, Z., Wang, H., Sun, F., et al. (2020). Exploring the driving factors of the spatiotemporal variation of precipitation in the jing-jin-ji urban agglomeration from 2000 to 2015. Sustainability 12, 7426. doi:10.3390/su12187426
Yang, P., Ren, G., and Hou, W. (2019). Impact of daytime precipitation duration on urban heat island intensity over Beijing city. Urban Clim. 28, 100463. doi:10.1016/j.uclim.2019.100463
Yang, X., and Yao, L. (2022). Reexamining the relationship between surface urban heat island intensity and annual precipitation: Effects of reference rural land cover. Urban Clim. 41, 101074. doi:10.1016/j.uclim.2021.101074
Yu, H., Zhou, L., and Shen, T. (2019). Location selection and spatial effects of agglomeration economy in manufacturing enterprises. Geogr. Res. 38, 1–12.
Yu, M., Miao, S. G., and Zhang, H. B. (2018). Uncertainties in the impact of urbanization on heavy rainfall: Case study of a rainfall event in beijing on 7 august 2015. J. Geophys. Res.-Atmos. 123, 6005–6021. doi:10.1029/2018jd028444
Yu, R., Zhai, P. M., and Lu, Y. Y. (2018). Implications of differential effects between 1.5 and 2 °C global warming on temperature and precipitation extremes in China's urban agglomerations: DIFFERENTIAL effects on extremes between 1.5 and 2 °C global warming. Int. J. Climatol. 38, 2374–2385. doi:10.1002/joc.5340
Yuan, J., Lin, Q., Chen, S., Zhao, H., Xie, X., Cai, Z., et al. (2022). Influence of global warming and urbanization on regional climate of megacity: A case study of chengdu, China. Urban Clim. 44, 101227. doi:10.1016/j.uclim.2022.101227
Yuan, Y., Zhai, P., Chen, Y., and Li, J. (2021). Hourly extreme precipitation changes under the influences of regional and urbanization effects in Beijing. Int. J. Climatol. 41, 1179–1189. doi:10.1002/joc.6784
Zhang, C., Miao, S., Li, Q., Xia, X., and Xuan, C. (2009). Impacts of urban expansion and future green planting on summer precipitation in the Beijing metropolitan area. J. Geophys. Res. 114, D02116. doi:10.1029/2008jd010328
Zhang, H. Y., Jin, M. L. S., and Leach, M. (2017). A study of the Oklahoma city urban heat island effect using a WRF/Single-Layer urban canopy model, a joint urban 2003 field campaign, and MODIS satellite observations. Climate 5, 72. doi:10.3390/cli5030072
Zhang, Q., and Seto, K. C. (2011). Mapping urbanization dynamics at regional and global scales using multi-temporal DMSP/OLS nighttime light data. Remote Sens. Environ. 115, 2320–2329. doi:10.1016/j.rse.2011.04.032
Zhang, W., Villarini, G., Vecchi, G. A., and Smith, J. A. (2018). Urbanization exacerbated the rainfall and flooding caused by hurricane Harvey in Houston. Nature 563, 384–388. doi:10.1038/s41586-018-0676-z
Zhang, Y. Y., Pang, X., Xia, J., Shao, Q. X., Yu, E. T., Zhao, T. T. G., et al. (2019). Regional patterns of extreme precipitation and urban signatures in metropolitan areas. J. Geophys. Res.-Atmos. 124, 641–663. doi:10.1029/2018jd029718
Zhang, Y. Z., Miao, S. G., Dai, Y. J., and Bornstein, R. (2017). Numerical simulation of urban land surface effects on summer convective rainfall under different UHI intensity in Beijing. J. Geophys. Res.-Atmos. 122, 7851–7868. doi:10.1002/2017jd026614
Zhao, L., Lee, X., Smith, R. B., and Oleson, K. (2014). Strong contributions of local background climate to urban heat islands. Nature 511, 216–219. doi:10.1038/nature13462
Zhong, S., Qian, Y., Zhao, C., Leung, R., Wang, H. L., Yang, B., et al. (2017). Urbanization-induced urban heat island and aerosol effects on climate extremes in the Yangtze River Delta region of China. Atmos. Chem. Phys. 17, 5439–5457. doi:10.5194/acp-17-5439-2017
Keywords: urbanization, precipitation, multi-scale geographically weighted regression, spatial heterogeneity, impact scale
Citation: Wei F, Liu D, Liang Z, Wang Y, Shen J, Wang H, Zhang Y, Wang Y and Li S (2023) Spatial heterogeneity and impact scales of driving factors of precipitation changes in the Beijing-Tianjin-Hebei region, China. Front. Environ. Sci. 11:1161106. doi: 10.3389/fenvs.2023.1161106
Received: 07 February 2023; Accepted: 19 May 2023;
Published: 16 June 2023.
Edited by:
Xu Zhao, Shandong University, ChinaCopyright © 2023 Wei, Liu, Liang, Wang, Shen, Wang, Zhang, Wang and Li. This is an open-access article distributed under the terms of the Creative Commons Attribution License (CC BY). The use, distribution or reproduction in other forums is permitted, provided the original author(s) and the copyright owner(s) are credited and that the original publication in this journal is cited, in accordance with accepted academic practice. No use, distribution or reproduction is permitted which does not comply with these terms.
*Correspondence: Dahai Liu, bGl1ZGFoYWlAZmlvLm9yZy5jbg==; Shuangcheng Li, c2NsaUB1cmJhbi5wa3UuZWR1LmNu
Disclaimer: All claims expressed in this article are solely those of the authors and do not necessarily represent those of their affiliated organizations, or those of the publisher, the editors and the reviewers. Any product that may be evaluated in this article or claim that may be made by its manufacturer is not guaranteed or endorsed by the publisher.
Research integrity at Frontiers
Learn more about the work of our research integrity team to safeguard the quality of each article we publish.