 Brandon M. Brewster
 Daniel J. Bain
- Geology and Environmental Science, University of Pittsburgh, Pittsburgh, PA, United States
Aging water infrastructure renewal in urban areas creates opportunities to systematically implement green infrastructure (GI) systems. However, historical soil contamination from gasoline lead additives, steel manufacturing by-products, and other historical industry raise the potential that novel GI drainage patterns and geochemical environments may mobilize these legacy pollutants to green infrastructure sites previously isolated from most hydrologic flows. Characterization of GI soil chemistries across GI type to build on previous observations in other cites/regions is fundamental to accurate assessments of these emerging management scenarios and the resultant risk of increased metal exposures in downstream environments. In particular, clarification of ecosystem services this metal sequestration may provide are vital to comprehensive assessment of green infrastructure function. During 2021, soil metal chemistry, specifically, As, Cr, Cu, Fe, Mn, Ni, Pb, V, and Zn was measured at a high spatial resolution in six Pittsburgh (Pennsylvania, United States) GI installations using a portable X-ray Fluorescence Spectrometer. Patterns of trace metal accumulation were identified in these installations and evaluated as a function of site age and GI connection to road systems. Trace metals including chromium, copper, manganese, and zinc all seem to be accumulating at roadside edges. Remobilization of historically contaminated soils also seems to be a potential mechanism for transporting legacy trace metal contamination, particularly lead, into GI systems. However, metals were not clearly accumulating in installations less connected to road inputs. These findings are consistent with literature reports of trace metal transport to GI systems and reconfirm that clarification of these processes is fundamental to effective stormwater planning and management.
1 Introduction
In the last 20 years, stormwater managers in the United States have begun to shift strategies to address aging water infrastructure systems. These water systems often have not been replaced/updated since they were installed in the late 1800s/early 1900s (Collins et al., 2004). As efforts to address aging infrastructure ramp up, managers are shifting toward green infrastructure (GI), water management structures that capture stormwater runoff from roads, parking lots, and buildings and divert it to slower flow paths through soils and groundwater. When GI captures runoff from the road, contaminated waters may be focused into soil and subsoil flow paths.
For example, Pittsburgh, Pennsylvania is bound by a consent decree that requires multi-billion-dollar fixes to its sewer overflow problem (National Research Council, 2005). The RAND Corporation’s 2017 pilot study estimates that more than 9 billion gallons of mixed sewage and stormwater is discharged to Pittsburgh surface waters in a typical year from combined sewer overflows (CSO) (Fischbach, et al., 2017). There is a concerted regional effort to “green” the substantial responses necessary to address water infrastructure challenges and promote the use of GI as part of a comprehensive regional management strategy (MacDonald, 2016; Allegheny County Sanitary Authority, 2019; Bain, et al., 2019).
Moreover, Pittsburgh has an extended history of industrial contamination. Most prominent is the long history of intense iron and steel manufacturing, beginning in the late 1700s with establishment of early iron furnaces (Sharp and Thomas, 1965) and continuing through present with operations at facilities including the Clairton Coke Works and the Edgar Thompson works (Tarr, 2004). Steel production and metal recycling contributed substantial loads of trace metals to background soils in the region (Maxim et al., 2022). In addition, urban soil inputs including lead gasoline additives and paint residue likely also impacted Pittsburgh soils, particularly at the roadside and dripline, similar to patterns in other cities (Schwarz et al., 2012; Wade et al., 2021). This legacy contaminant impacted soils represent a novel context for GI and raise the potential for new interactions between soil metal contaminants and stormwater flux.
As GI is increasingly used in stormwater management, the resultant evolution in GI soil chemistry is not as well documented. Stormwater infrastructure has long been recognized as a potential mechanism for directly introducing contamination to subsurface waters (Lerner, 1986; Bhaskar and Claire, 2012). Twenty years ago, Pitt et al. (1999) reviewed the potential for groundwater contamination by infiltration of urban stormwater during management; Marsalek et al. (2006) documented contaminated sediment in a variety of best management practices in Ontario, Canada. While GI sediments may be elevated relative to soil screening levels; Kondo et al. (2016) did not detect soil trace metal enrichment in green infrastructure relative to background soils across the City of Philadelphia (United States).
Recent work has focused on differentiating the spatial patterns of metals in green infrastructure. Gavrić et al. (2021) examined soil metals in a chronosequence of grassy swales in Sweden, but did not observe clear gradients in metals concentration with distance from road, and attributed the patterns to metals deposited during snow storage. Adhikari et al. (2023) sampled green infrastructure at storm water inlets and areas where water pools during retention, comparing both with reference measurements. In both cases, the relatively sparse sampling within the green infrastructure require reliance on broad assumptions about how materials are transported to and move within the green infrastructure.
Some have suggested this metal retention is an “ecosystem service” ((Sharma and Malaviya, 2021) is a recent review). However, this conceptualization centers surface water quality and doesn’t necessarily consider what happens to the metals once retained. When contaminated sediments are introduced to novel geochemical environments, contaminant cycling can evolve in unexpected ways (Danfoura and Gurdak, 2016). Further, metals can be mobilized by road deicer salts (Bäckström, et al., 2004; Wilhelm, et al., 2019) to complex soil water flow paths that create salt plumes that persist following the cold season (Rossi, et al., 2017). Further, even if GI are constructed with imported, relatively clean soil materials, these engineered soils interact with environments rich with legacy contamination. Once road salt influenced waters reach GI, they can create seasonal chemistry fluctuations that can mobilize legacy metal contamination (Mullins, et al., 2020). A combination of these GI moderated processes may reintroduce legacy contamination to local groundwater.
This study explores the concentrations and spatial distribution of metals and metalloids in GI soils in Pittsburgh. A handheld X-ray Fluorescence Spectrometer (XRF) was used to measure metal content in six GI across Pittsburgh, PA. during the summer of 2021 (Figure 1). Dense point samples from each site were interpolated into continuous estimates of soil metal concentrations using geographic information systems (GIS). Then, site soil metal patterns were compared with each other and examined in the context of roadside/parking lot connectivity and time since installation to evaluate the GI influences on soil metal chemistry in Pittsburgh.
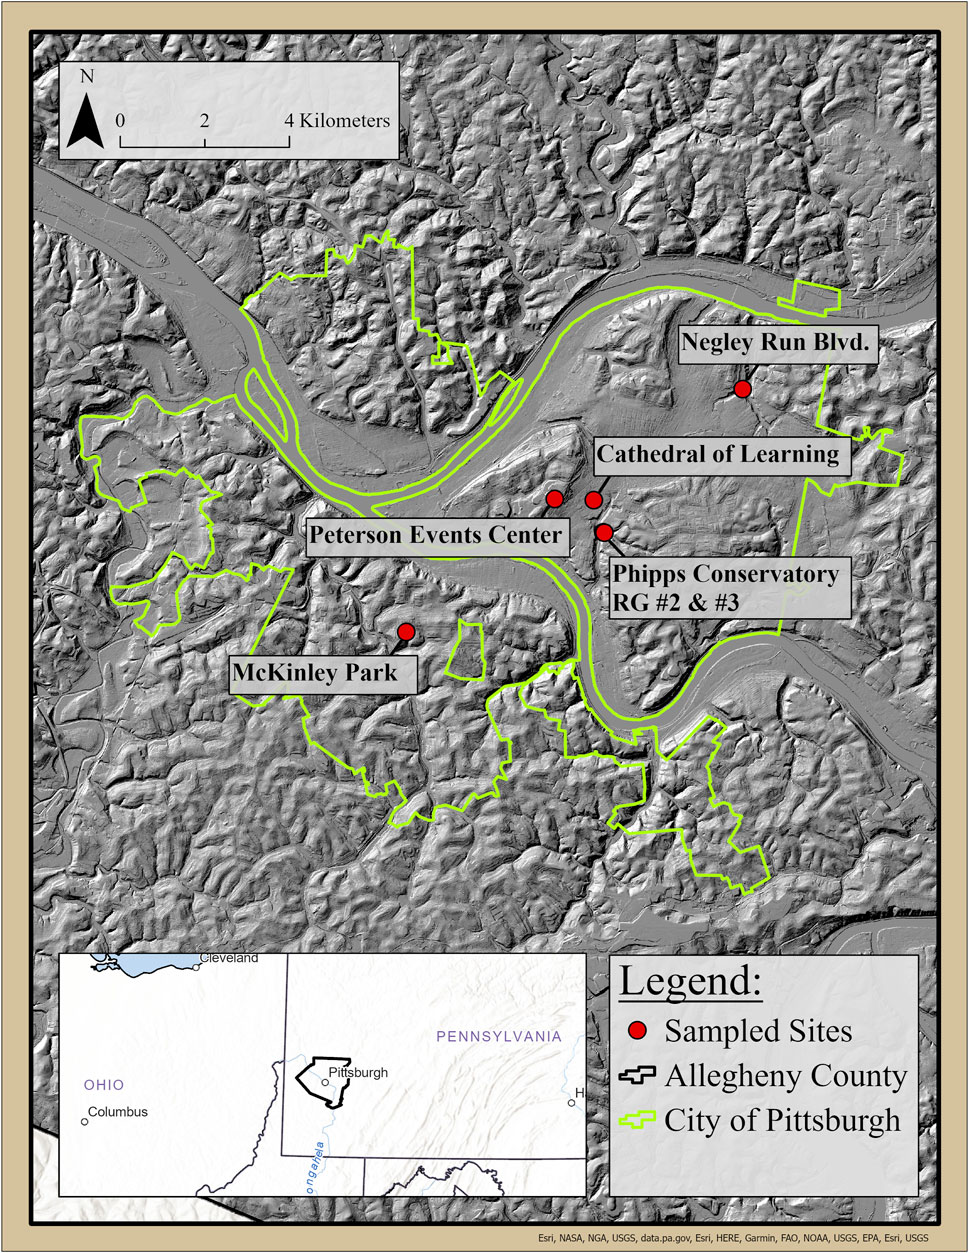
FIGURE 1. Map of Pittsburgh and sampled green infrastructure installations. Inset map of Allegheny County showing the county hillshade, City of Pittsburgh boundary (green), and sampled GI sites (red dots).
2 Methods
2.1 GI site selection
There are at least 340 potential green infrastructure sites to evaluate in Allegheny County (3RWW, 2022). Six infiltration-based sites were chosen for this study based on accessibility (i.e., this research was completed during the tail end of COVID risk mitigation, so complicated access permission processes were not within the scope of this work), green infrastructure installation age (i.e., time since installation), and how connected the GI system was to road inputs (Table 1). The Negley Run Bioswale is the only site adjacent to a state road (i.e., with traffic data) and it had an annual average daily traffic of 3,704 in 2022 (Pennsylvania Department of Transportation, 2022).
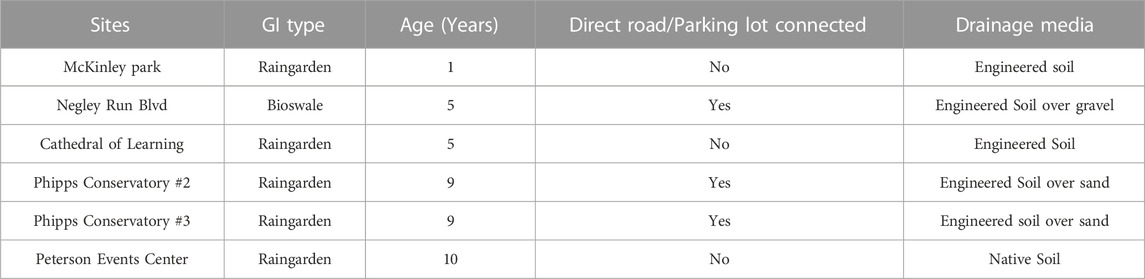
TABLE 1. Green Infrastructure site characteristics, age, and direct road connection relationship.
Pittsburgh has mean minimum January temperatures of −6.7°C and mean maximum July temperatures of 36°C and receives approximately 1 m of precipitation, distributed evenly throughout the year (National Research Council, 2005). The city lies on the rugged Allegheny Plateau, underlain by deeply incised stratigraphic sequences of shale, sandstone, mudstone, and limestone (National Research Council, 2005). These bedrocks tend to weather to clay-rich soils (National Research Council, 2005). Soil chemistry are surprisingly consistent across the city and observed patterns reflect historical human impacts rather than underlying geology (Maxim et al., 2022). Further, five of the six green infrastructure sites contained artificial, engineered soils, limiting reliance on parent material chemistry for inference. While geochemistry can be an important factor in green infrastructure metal content, the sites in this study are not sensitive to geochemical variability. The importance of legacy contamination is considered in the discussion.
2.2 Sampling grid setup
At each site-meter sampling grid was set up with measuring tapes and pin flags. Specific grid setup information for each green infrastructure site is provided below:
Negley Run Bioswale (Figure 2A): This grid was 130 m long by 3 m wide. The first 30 m were above the bioswale and are interpreted to reflect pre-bioswale soil conditions and serve as a positive control, reflecting pre-installation conditions. The remaining 100 m of grid length was in the bioswale. During construction, legacy soil in the bioswale was excavated and replaced with a gravel-sand aggregate covered by mesh and topsoil. Sampling stations were then established along three rows parallel to the road and 1 meter apart, forming a grid. The near road sample stations were located ∼13 cm from the pavement edge. Measurements were made every meter along each of the rows. Row 1 was roadside, row 2 fell in the middle of the swale, and row 3 on the side of the swale away from the road.
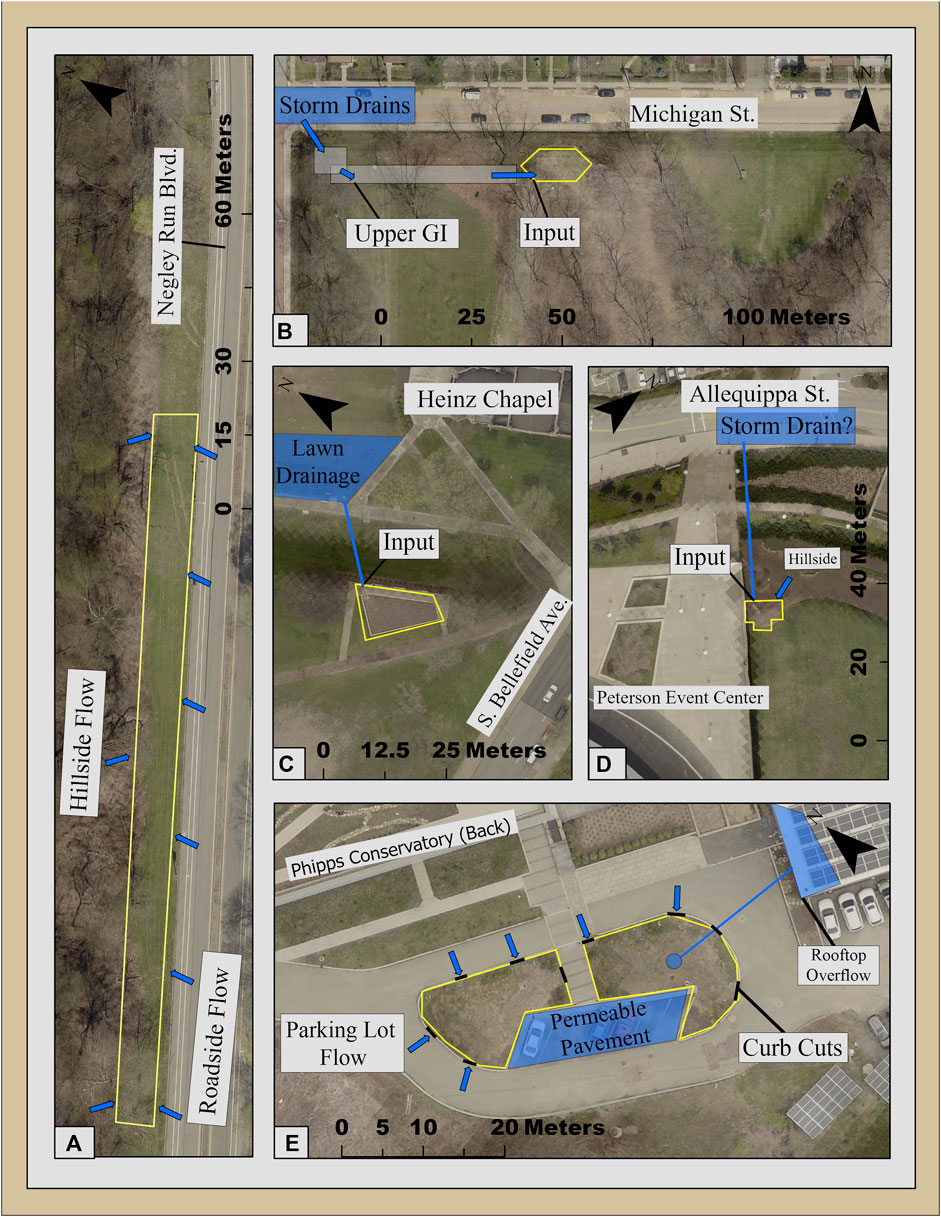
FIGURE 2. Maps of sampled GI installations, (A) The Negley Run Blvd. Bioswale and Control soil, (B) The McKinley Park lower raingarden, (C) The Cathedral of Learning raingarden, (D) The Peterson Event Center raingarden, (E) The Phipps Conservatory raingardens #2 and #3. The Allegheny County high resolution imagery (Allegheny County Division of Computer Services Geographic Information Systems Group, 2017a) is slightly transparent with the county 6 ft hillshade underneath accentuating areas with steeper slopes in black (Allegheny County Division of Computer Services Geographic Information Systems Group, 2017b).
Cathedral of Learning Rain Garden (Figure 2C): A triangular grid was laid out as follows: the longest side is at the bottom (southwest side) of Figure 2C (∼17 m), and the gird extends ∼10 m to the west.
Peterson Events Center Rain Garden (Figure 2D): The grid was laid out as follows: the longest side (8 m) is the northwest edge nearest to Allequippa Street and the second longest (6 m) is the southwest edge adjacent to the Peterson Event Center.
McKinley Park Lower Rain Garden (Figure 2B): The grid was laid out relative to a midline tracing the longest portion of the raingarden (∼16.5 m). Perpendicular lines were laid at each meter marker with longest secondary axis of ∼10.5 m.
Phipps Conservatory Rain Garden #2 (Figure 2E. Left): Due to its irregular shape, a grid was laid out Phipps Conservatory side (northeastern) in a southwest direction. The longest width of the raingarden was 1 meter into the garden from the parking lot pedestrian path that separates the gardens (∼18 m) and was used as centerline. Perpendicular lines were laid at each meter marker with the longest secondary axis of (∼12.5 m).
Phipps Conservatory Rain Garden #3 (Figure 2E. Right): The grid was laid similar to rain garden #2 but in reverse order, as they mirror one another. The longest width about 1 m into the pedestrian path from the parking lot bottom (∼18 m) acted as a centerline. Perpendicular lines were laid at each meter marker with the longest secondary axis of ∼11 m.
2.3 XRF measurements
An Olympus Delta X-ray Fluorescence Spectrometer was used to measure soil concentrations. XRF measurements were made at least 1 hour after precipitation to avoid potential dilution of the metal concentration measurement. The XRF analyzer was calibrated with its 316 stainless steel calibration check reference coin before each site visit and after a battery was depleted and replaced. The calibration procedure includes internal accuracy checks as part of the calibration. Before a soil measurement was made, grass/vegetation was removed from the soil surface, and a clear plastic film was laid down to preserve the mylar film protecting the X-Ray source. The plastic was replaced approximately every 50 measurements or when it was torn/punctured. For each soil measurement, the XRF analyzer’s X-Ray source was placed level with the soil surface and held in that position till test completion, assuring the XRF was a uniform distance from the soil. Soil metal content (K, Ca, S, P, Cl, Ti, V, Cr, Mn, Fe, Co, Ni, Cu, Zn, W, Hg, As, Pb, Bi, Se, Th, Rb, U, Sr, Y, Zr, Mo, Ag, Cd, Sn, and Sb) was measured using all three of the instrument’s beams (1. 40 kV Si-PIN, 2. 40 kV SDD and 3. 50 kV SDD). In this manuscript we focus on and report the following elements (As, Cr, Fe, Ni, V, Cu, Mn, Pb, and Zn).
In situ measurement with portable XRF instruments can be confounded by soil moisture, as variations in moisture can change the apparent concentration. Regardless, these instruments are widely used in urban systems (Schwarz et al., 2012; Kondo et al., 2016). In particular, we were seeking methods that did not require repeated soil disturbance (i.e., removal of samples) to allow future measurement of the GI soils and assessment of accumulation processes. Differences between saturated soils and adjacent unsaturated soils were evaluated to assess the impacts of soil moisture variations.
2.4 Metal concentration interpolation using ArcGIS
After sampling, each data set was imported to ArcGIS using the workflow in Supplementary Figure S1. Data collected by the XRF analyzer were downloaded in .csv format. The data were cleaned to remove any incomplete tests. Grid coordinates were then imported to ArcGIS Pro (2.7.0) and displayed using the Display XY Data tool. Then GI site extent polygons were generated using the Aggregate Points tool. Kriged interpolations of soil metal concentration were generated for each site and each element using the Geostatistical Analyst tool (ArcGIS Pro 2.x). The Kriging/CoKriging methods were used with simple kriging to generate statistical surfaces. The data were then optimized based on semivariograms as the function type. Interpolations were restricted to the site polygon. A uniform concentration shading was developed for each element based on the Negley Run Blvd. data (i.e., the site with the most measurements). These ranges were then used for each site’s legend. Any maximum value exceeding the Negley dataset maximum were added to the legend’s highest value and the range extended. In some sites the measured element concentration range did not span the Negley dataset ranges. In these cases, legends were simplified to fewer classification bins, e.g., for elements including As and Ni in Supplementary Figures S2, S3, S5. In some instances, the kriged results smoothed out extreme concentration values and made patterns in chemistry change less apparent. In cases where this variability is important, Inverse Distance Weighted (IDW) surfaces were generated to visualize conditions in the GI.
3 Results
Soil chemistry data, measured in mg/kg, for metals analyzed in this study are organized by site and site age (Table 2).
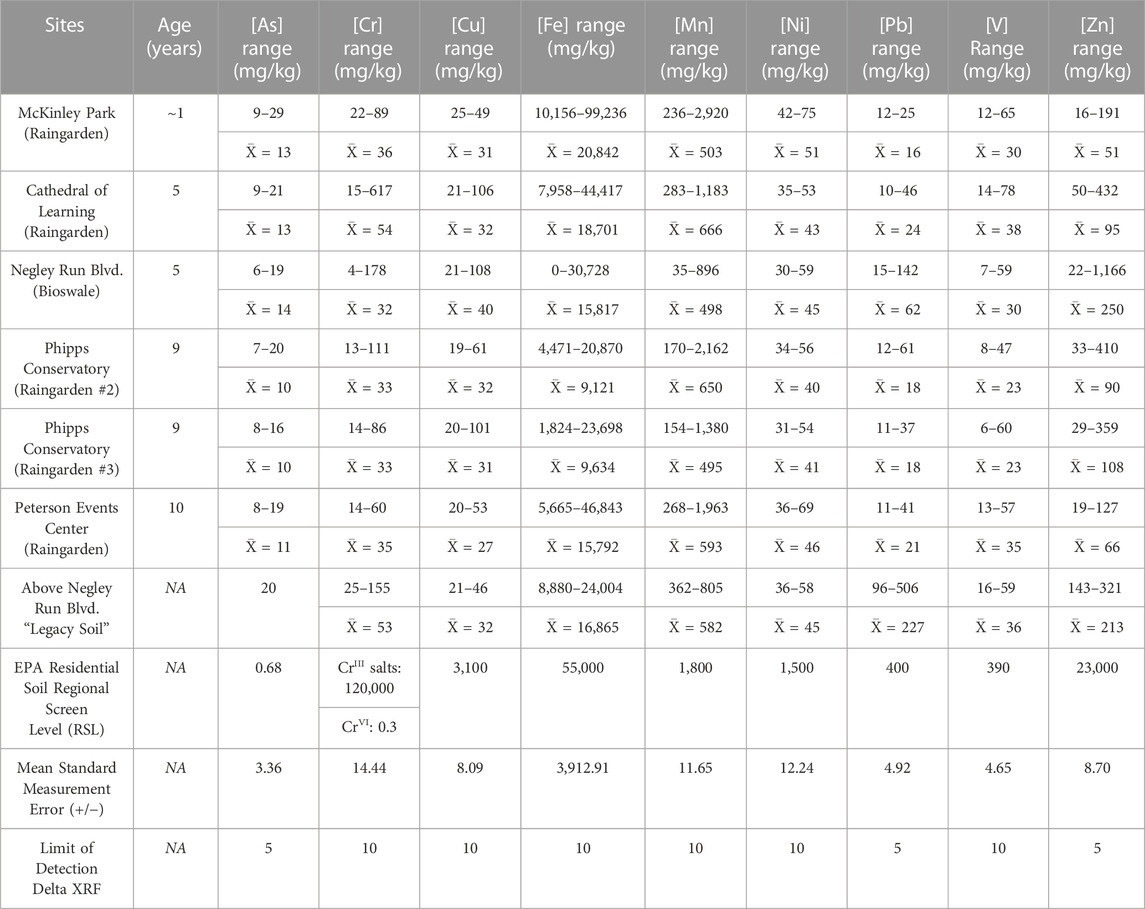
TABLE 2. Ranges of metal concentrations observed within each GI installment. Table is organized by age of the site, newest to oldest and reported relative to sampling in the summer of 2021. Limits of detection were obtained from Olympus NDT.
3.1 McKinley Park raingarden
The McKinley Park raingarden receives inputs from a storm drain in the northwestern area of Figure 2 at the street intersection. Runoff is fed into an upper raingarden, flowing down a sloped-rocky cascade, and finally reaching the lower raingarden through the input pipe in the southwestern corner Figure 2.
Compared with the other GI, the McKinley Park raingarden had the highest sampled concentrations for As at 29 mg/kg, Fe at 99,236 mg/kg, Ni at 75 mg/kg, and Mn at 2,920 mg/kg though the relatively low surrounding concentrations obscure these hotspots when kriged (Figure 2; Table 2). The measured concentrations for Pb and Zn were low at ranges 12–25 mg/kg and 16–191 mg/kg respectively. While the Kriging for this installment did not show any clear patterns relative to the input pipe, when individuals points were compared, Mn and V concentrations were higher on the western side of the garden (t-tests, p < 0.05) (Figure 2).
3.2 Cathedral of Learning raingarden
The Cathedral of Learning raingarden receives inputs from a pipe in the northwestern corner of the installation. This pipe is fed by stormwater runoff from an engineered turf between the Heinz Chapel (North) and the Cathedral of Learning at the University of Pittsburgh. The raingarden was constructed below grade with a ∼0.5 m tall concrete wall surrounding it at ground level. This raingarden had the highest measured concentration of Cr at 617 mg/kg and V at 78 mg/kg (Figure 3; Table 2). The garden has comparatively low concentrations of Pb, with an average concentration of 16 mg/kg, and the lowest measured concentration of Zn at 16 mg/kg, with an average Zn concentration of 51 mg/kg. Concentrations of As, Fe, Mn, and V appear elevated around the input pipe in the western corner of the Cathedral raingarden, however, only the mean Mn concentrations were significantly different (p < 0.5) (Figure 3; Supplementary Figure S3). In addition, there are single elevated concentrations of Cr and Cu observed in the eastern and southeastern corner of the garden, respectively, that create apparent hotspots in Supplementary Figure S3. These are single measurements, so are probably outliers rather than hotspots. Concentrations of As, Fe, Mn and V were elevated in the center-western portion of the raingarden (the average concentration for As, Fe, and V are all significantly higher than the concentrations in the rest of the garden (t-test, p < 0.5), mean Mn concentrations are not significantly different (Figure 3).
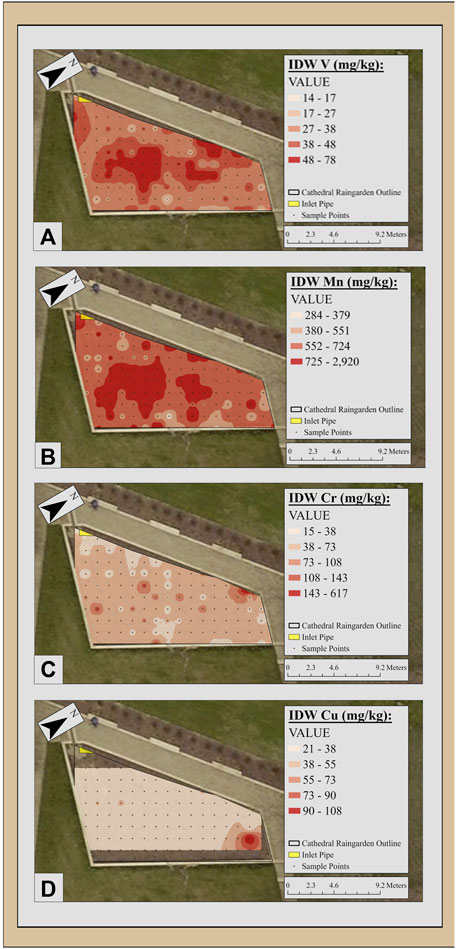
FIGURE 3. Inverse Distance Weighted (IDW) maps of soil metal concentrations in the Cathedral of Learning raingarden (panel (A): V, panel (B): Mn, panel (C): Cr, panel (D): Cu). Yellow triangle is inlet location. IDW surface interpolations are based on data collected for this study and scales generated based on ranges from within this site. All kriged metal patterns for this site are shown in Supplementary Figure S3.
3.3 Negley Run Boulevard bioswale (100 m)
The Negley Run Boulevard bioswale receives inputs from precipitation and runoff directly from Negley Run Boulevard as the curb is cut to grade. Portions of the swale with soils that were elevated above the level of the road surface are labeled with green in Figure 4; Supplementary Figure S5. Similarly, storm drains and streetlights with concrete berms potentially obstructing runoff flow are labeled with yellow and cyan respectively Figure 4; Supplementary Figure S5. The bioswale had the second highest concentration of Cr at 178 mg/kg, highest concentration of Cu at 108 mg/kg, second highest concentration of Pb at 142 mg/kg, and highest concentration and average concentration of Zn at 1,166 mg/kg and 250 mg/kg (Table 2). Elements As, Fe, Mn, Ni, and V all had average concentrations similar to the other sampled GI averages.
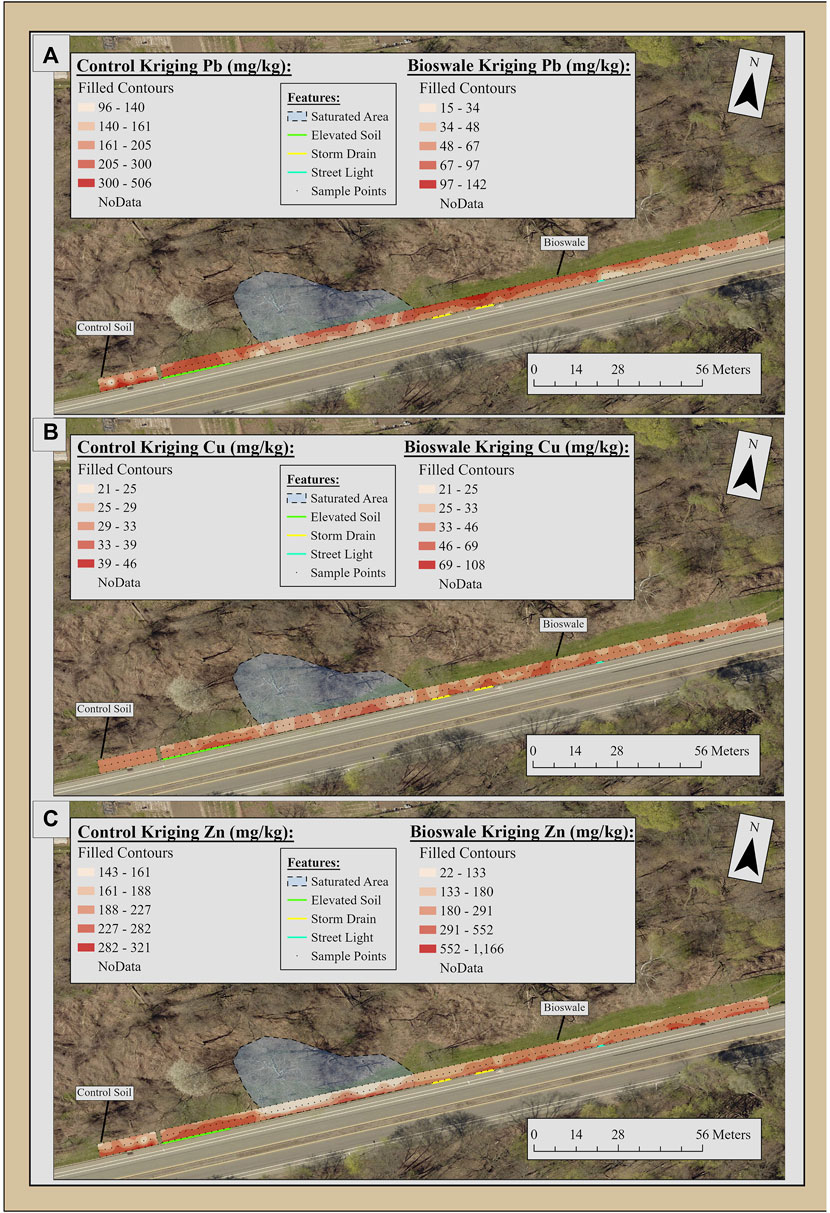
FIGURE 4. Inverse distance weighted (IDW) maps of soil metal concentrations in the Negley Bioswale (panel (A): Pb, panel (B): Cu, panel (C): Zn). IDW surface interpolations are based on data collected for this study and scales generated based on ranges from within this site. All kriged metal patterns for this site are shown in Supplementary Figure S4.
Chromium, Cu, Mn, Ni, and Zn were all measured at elevated concentrations in near-road portions of the bioswale soil. Arsenic was not observed in the legacy soils or southwestern portion of the bioswale soils (Supplementary Figure S4). Both Fe and As concentrations were lower in areas where the bioswale soils were saturated by the hillside flow and elevated in the drier soils in the northeastern portion (Supplementary Figure S4). Manganese was measured in the 552–724 and 725–896 range throughout the bioswale. Nickel had higher measured concentrations in non-saturated areas (Supplementary Figure S4). Finally, lead was measured at higher concentrations, 96–506 mg/kg, in the legacy soil along the roadside and was not observed at high concentrations at roadside in the bioswale soils (Figure 4; Supplementary Figure S5).
The Negley Run Boulevard bioswale legacy soil (upstream of upper limit of the swale) was not replaced during bioswale construction and assumed to reflect chemistry of soils in place prior to the bioswale construction. For example, this portion reflects a more traditional road construction including a curb separating the road and soil in this area. Therefore, while it receives similar modern inputs from precipitation, it also contains any historical pollutants or contamination from lead fuel combustion and steel industry deposited prior to 2016. This soil area had the highest concentrations of lead measured ranging from 96–506 mg/kg. These lead concentrations exceed the EPA’s regional screening levels in residential soils of 400 mg/kg (Table 2) (EPA, 2021). It also had the second highest concentration of Cr at 25–155 mg/kg (Table 2). Roadside patterns of accumulation are visible for Cu, Mn, Pb, and Zn similar to patterns observed in the bioswale soil (Figure 4; Supplementary Figure S5).
3.4 Phipps Conservatory raingarden #2 & #3
The Phipps Conservatory raingarden’s #2 (Supplementary Figure S5) and #3 (Supplementary Figure S6) receive inputs via curb cuts in the cement perimeter. The raingarden #3 also receives stormwater from the building to the east via a pipe. These raingardens had the same average concentrations of As, Cr, Pb, and V, while average concentrations of Cu and Ni only varied by 1 mg/kg (Table 2).
Both raingardens have low concentrations of Pb (Avg. of 18 mg/kg) and Zn (#2 avg. of 90, #3 avg. of 108 mg/kg) compared to the other sampled GI. Hotspots of As and Cu are present in the southwest center of raingarden #2. In raingarden #2 higher concentrations of Ni were measured in the flow paths extending into the center of the garden from two northwestern curb cuts (Supplementary Figure S5). Additionally, elevated concentrations of Cr and Mn relative to the rest of the garden were measured near the pedestrian walkway (eastern side of the maps) in raingarden #2 and similarly in raingarden #3 for Ni and Mn (Figure 5; Supplementary Figures S5, S6).
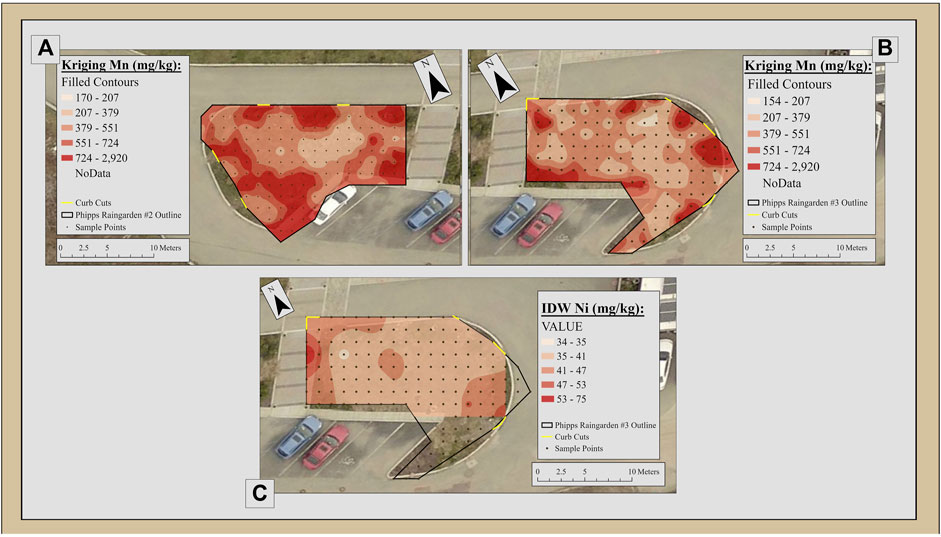
FIGURE 5. Inverse Distance Weighted (IDW) maps of soil metal concentrations in the Phipps Rain Garden #2 (panel (A): Mn), and Phipps Garden #3 panel (B) Mn and panel (C) Ni). IDW surface interpolations are based on data collected for this study and scales generated based on ranges from within this site. All kriged metal patterns for this site are shown in Supplementary Figure S5.
3.6 Peterson Event Center raingarden
The Peterson Event Center raingarden received precipitation and allegedly runoff from a stormwater drain on an upgradient street (Allequippa). Storm drain water is piped into the raingarden and is deposited in the western portion of the installation (Supplementary Figure S7, yellow rectangle). Though the oldest raingarden in this study, its average metal concentrations were consistent with the other GI (Table 2). It has the second highest Ni sample at 69 mg/kg. It is unclear whether patterns in the concentrations of Cr, Ni, Mn, and V are developing from piped runoff or the hillside (Supplementary Figure S7). However, concentrations of As, Cr, Fe, Mn, Ni, and V are all elevated in the southeastern raingarden soil, above and below the pipe. It is not clear the GI is functioning as planned.
3.7 Differences in XRF measurements between saturated and non-saturated soils
As noted in the methods, wet soils can appear less concentrated due to the apparent additional mass of water in the sampled volume. We chose not to conduct the standard practice of removing the soil and drying to minimize disturbance to the green infrastructure. However, it is important to estimate the impacts of soil saturation on the measured values. We ran t-tests between the Negley Bioswale soils upstream of the saturated zone (Figure 6) and soils within the saturated zone. The t-test results indicate that Cr, Zn, and Pb mean concentrations are significantly lower in the saturated zone (p < 0.05). In contrast, Mn mean concentrations were significantly higher in the saturated zone (p < 0.05). All other differences in means were not significant.
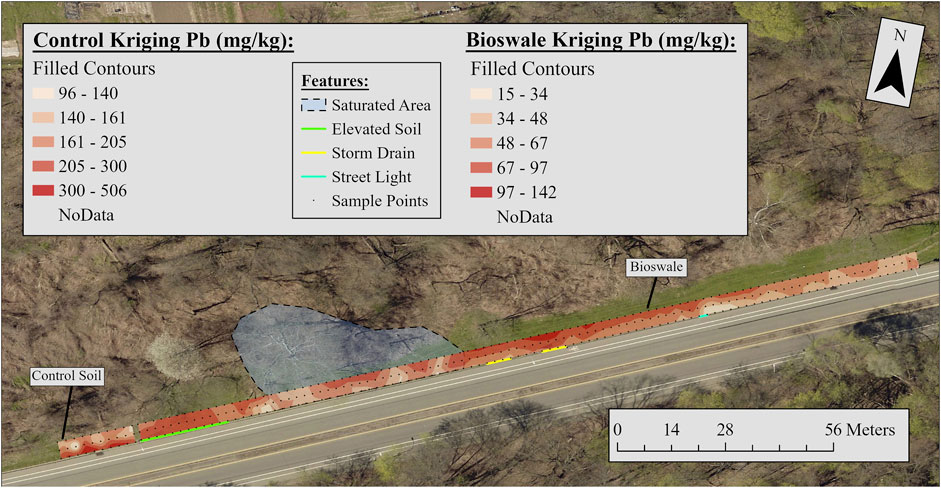
FIGURE 6. Kriged interpolation of soil metal content in the Negley Run Bioswale. The control “legacy” soil (left-most) and the bioswale soil (right). Two separate color scales are used to allow clearer visualization of concentration pattern. However, the shorter length of “control” soil on the left cannot be directly compared with the much longer GI soils on the right. Note the elevated levels of lead measured at the roadside in the “control” soil. In contrast, areas of elevated Pb concentration in the GI soil are on the slope side of the swale, away from the road and near the hillslope.
4 Discussion
4.1 Roadside/road connected GI and patterns of accumulation
Historically trace metals like Zn, Cr, and Pb have been deposited in urban soils due to automobile emissions, both from gasoline lead additives and from automobile wear (tires and brake pads) (Kabata-Pendias and Pendias, 2011). In Pittsburgh intense metallurgy introduced a wide variety of metal contaminants (Tarr, 2004). Lead deposition has diminished substantially following removal of gasoline additives by Clean Air Act regulations. However, other metals including Zn, Cr, Cu, and V seem to be accumulating in GI soils influenced by road runoff inputs traffic (Figure 4; Supplementary Figure S8). In particular, portions of the Negley Run Bioswale located directly adjacent to the road have soil metal concentrations up to 3.6 times larger than soils only a meter away. It is important to consider these soils had been accumulating materials for less than 5 years when measured in 2021 (Table 1).
Bioswale soils directly adjacent to the road (row 1) had higher average concentrations of Cr (71 mg/kg), Cu (53 mg/kg), and Zn (434 mg/kg) than soils not directly connected to the road (rows 2&3) Cr (12 &13 mg/kg), Cu (30 & 29 mg/kg), and Zn (171 & 142 mg/kg) (t-tests, p<<0.05) (Supplementary Figure S8). In the legacy soil (i.e., measured soils not in the GI) Pb and Zn had higher concentrations at the roadside (row 1) than in soils further from the road (rows 2&3) (t-test, p<<0.05). These measurements show a gradient of higher concentrations of metals accumulating at the edge of the bioswale indicative of pollutant transport originating from the road.
While the Phipps Conservatory raingardens #2 & #3 are fed directly by parking lot runoff, when compared to inputs from the road at the Negley Run bioswale, we expected metals to accumulate more slowly. In these raingardens, areas downstream of curb cuts seem to have elevated metal concentrations, specifically Zn and Fe (Supplementary Figure S9). We examined associations between inlet location and concentrations, however, there are too many unconstrained factors (e.g., soil carbon) in addition to simple proximity to demonstrate a statistical association. That said, these concentration patterns suggest inputs at the curb cuts may in turn be focusing the metal inputs into the garden.
These observations seem to indicate that roadside/road connectivity drive at least part of the observed metal accumulation in GI soils. Any patterns of metal accumulation were not clear in GI fed by runoff sources not connected to roads or indirectly connected to the road.
4.2 Soil metal patterns in GI not connected to roads
The McKinley Park, Cathedral of Learning, and Peterson Event Center raingardens were still expected to accumulate metals over time due to general increased metal fluxes in urban areas. However, in these GI sites, concentration patterns were not clearly elevated in areas near inputs delivering runoff. For example, the McKinley Park raingarden does not have concentration gradients between the input pipe in the southwestern corner and the rest of the garden (Figure 2).While this infiltration pond was only a year old when measured and there are additional upstream GI elements at this site that could accumulate metals, when this pattern is considered in conjunction with all of these sites, metal inputs to these GI soils do not seem to be dominated by stormwater inputs.
The interpolated soil chemistry patterns in the Cathedral of Learning raingarden seem to indicate elevated concentrations of As, Fe, Mn, and V that suggest a source contribution at the center of the garden (Supplementary Figure S3). Areas of elevated concentration were not associated with the input pipe in the northwestern corner, so the metals do not seem to be transported by the stormwater inputs. The reason for hotspots in the center of the garden are not clear.
Finally, the patterns observed in the Peterson Event Center raingarden are also not associated with the input pipe location (Supplementary Figure S7). There are hotspots of V, Fe, and As concentrations that seem to straddle the pipe outlet (Supplementary Figure S7). These hot spots could be associated with runoff inputs, however, it is not clear why only these metals are associated with the pipe, as there are hot spots of other metal concentrations (Cr & Ni) upgradient of the pipe. Concentrations up gradient of the input may result from overland flow from the road or sidewalks bordering the garden. In addition, this rain garden was built in a fill from the old University of Pittsburgh stadium, so there is a higher probability the patterns in this garden may have been inherited prior to establishment of the GI. Nonetheless, mechanisms responsible for this combination of accumulation patterns in this GI are hard to explain with available data.
When considered as a group of observations, the McKinley Park, Cathedral of Learning, and Peterson Event Center raingardens reflect metal chemistry patterns that do not seem to be associated with known input outfalls. However, some of these cases are not, or less, directly connected to road systems and runoff moves through design elements that may also accumulate metals [a cascade of infiltration basins (McKinley) and a formal lawn (Cathedral)]. Ultimately, these GI have lower metal concentrations when compared to more directly road connected GI. While all of these GI have hotspots of elevated metal concentrations, these patterns are not associated with input outfalls. These observations underline the importance of local inputs and the relative position of the GI in treatment trains when evaluating risks of metal accumulation in specific installations.
4.3 Site age and characteristics
Site age was expected to reflect GI soil metal accumulation over time. That is, if metal content reflects accumulation over time, older GI installations should have more metal content in the soils. We could not identify any cases where it seems that soils have been replaced as part of a management regime in the study set, an event that would “reset the clock.” In most cases rain gardens were constructed with engineered sediments and therefore screened before emplacement. While this baseline condition likely varied from installation to installation, the baseline would minimize metal contaminant content at time zero.
However, the McKinley Park raingarden was the youngest GI sampled (1-year-old) and had the highest point concentrations of several elements (As, Fe, Ni, and Fe). The elevated concentrations were not associated with the inlet and other elements (Cr, Cu, Pb, or Zn) were not associated with this hotspot. This evidence suggests these contaminants were present at installation. The rain garden is situated in a location that may have been a historical coal mine portal and the elevated concentration element mix is consistent with coal geochemistry (i.e., elevated Fe, As, etc.), However, we do not have sufficient evidence to confirm this possibility.
As another example, the Cathedral of Learning raingarden is about the same age (5 years old) as the Negley Run bioswale but shows virtually no metal accumulation when compared to the strong Zn, Cu, and Cr concentration gradients measured in the swale (Supplementary Figure S8). The Cathedral raingarden was primarily installed to manage drainage water from the formal lawn engineered to prevent standing water and turf mortality. The organic carbon rich topsoil in the lawn would likely bind any metals upstream of the GI, effectively treating inputs before transport to the rain garden. Again, this example highlights the importance of relative loads to GI metal accumulation.
Finally, the Peterson Event Center raingarden was the oldest infrastructure sampled (10 years old) and had relatively average metal concentrations when compared to the other study sites. The Peterson garden design is the most nebulous of our study sites as it was completed as a student driven project with minimal formal planning documents. While the rain garden was intended to be connected to storm water inlets on the ridge top above, it is not clear this connection happened. For example, the soil metal concentrations in the installation are not clearly associated with the inlet outfall. GI soil chemistry is more heavily influenced by the site-specific inputs at the Peterson Event Center rather than road impacts. As GI are increasingly used to treat road and parking lot runoff, these installations have a stronger probability of accumulating road contaminants and becoming deleterious landscape units (e.g., ecological traps) (Clevenot et al., 2018).
4.4 Mobilization of legacy soil to green infrastructure
Lead was expected to accumulate in some amount at the road edge due to remobilization of legacy roadside lead during normal traffic. However, in general, Pb was well below USEPA action levels across the sites and only exceeded action levels in the portion of the Negley Run Bioswale where we measured “historical” soils above the bioswale footprint (action levels for all metals are summarized in Table 2). These soils can be considered “background” soils for comparison of relative contamination levels. Unexpectedly elevated Pb concentrations (at levels similar to those measured in the legacy soils) were observed along the edge of the Negley Run Bioswale opposite from the road. We interpret this concentration pattern as slow transport of legacy soil contaminated during historical periods through solifluction of hillslope soils into the bioswale (Figure 6). In this case, these processes may be exacerbated by mowing of the toe slope, particularly during wet periods when soils are pushed down by the weight of the mowing equipment. During field measurements, this transport was not clearly apparent, suggesting these processes may not be detectable to visual inspection alone.
These observations suggest an additional complication when integrating green infrastructure into road stormwater management systems. Legacy contamination of all roads in place by at least 1986 likely have elevated concentrations of Pb. If these soils are transported to the novel geochemical environments in GI (Danfoura and Gurdak, 2016), geochemical processes such as reduction of binding iron oxyhydroxides can mobilize otherwise relatively unavailable metals. The transport of contaminated sediments to GI remains a primary source of uncertainty in our evaluation of the net benefits of green infrastructure for associated systems, particularly benefits to biotic and ecological systems.
5 Conclusion
XRF analysis provides rapid, high-resolution characterizations of soil chemistry patterns in green infrastructure. Soil Cr, Cu, Mn, and Zn patterns in GI most closely connected to road inputs (Negley Run Bioswale, Phipps raingardens) indicate accumulation of road inputs associated with road runoff inputs in these installations. However, in GI not directly connected to road sources, metals were not clearly accumulating. In addition, site age does not clearly influence metal accumulation in these systems, suggesting local input chemistries are more important than time in GI soil metal accumulation.
The concentrations reported here are relatively lower than other measurements in green infrastructure (e.g., Kondo et al., 2016). However, this work uses an in situ XRF approach to map metal concentrations across the entire green infrastructure installation. While more qualitative than other approaches, it minimizes disturbance and should allow for examination of longer term changes in these patterns. Costs associated with more intense chemical assays generally result in a trade off with sample numbers (e.g., Marsalek et al., 2006; Kondo et al., 2016; Adhikari et al., 2023 all have limited samples in the green infrastructure, often 3 or less). Therefore, this approach allows a less ambiguous means to track change (i.e., one doesn’t have to worry about disturbance created by repeated resampling) and a finer scale rendering of chemical patterns.
In particular, while observed Pb concentrations appeared to be well below actions levels in most of the GI sites, the patterns at the Negley Bioswale raise an often-overlooked source of metals to GI, legacy contaminated soils. In the Negley Bioswale Pb concentrations are highest on the side of the bioswale away from the roadside and adjacent to legacy soils. Slow hillslope processes seem to be transporting contaminated legacy soil to the green infrastructure and introducing these sediments to novel geochemical environments. The potential implications of this process are not clear, limiting our ability to evaluate potential risks to connected systems (e.g., ecological).
Ultimately, these findings indicate metals are accumulating in some of the GI installations, particularly in GI with direct connections to the roads. The approach outlined here allows rapid reassessment in future periods, allowing a relatively inexpensive and rapid assessment of metal accumulation in GI. However, these findings also suggest continued examination of chemistry within installations [e.g. (Danfoura and Gurdak, 2016; Mullins, et al., 2020)] is vital to assessing the potential for geochemical environments that facilitate metal transport from the green infrastructure to connected subsurface flow paths.
Data availability statement
The raw data supporting the conclusion of this article will be made available by the authors, without undue reservation.
Author contributions
BB was responsible for the development of research framework, data collection/analysis, and drafting of the manuscript. DB was responsible for supervising research, assisting with data collection and analysis, and co-authoring the manuscript. All authors contributed to the article and approved the submitted version.
Funding
This research was funded by NSF #1854827, NSF #2012409, and the Heinz Endowments.
Acknowledgments
We are extremely grateful to Jonathan Burgess and the Allegheny County Conservation District for their generous sharing of the handheld XRF spectrometer. We appreciate Drs Sarah States and Shishir Paudel at the Phipps Conservancy for coordinating access to their raingardens. Thanks to Claire Burns, Julianna Cooper, and Aaron Carr for assistance in field sampling of these sites. We appreciate the careful attention and helpful guidance of peer reviewers.
Conflict of interest
The authors declare that the research was conducted in the absence of any commercial or financial relationships that could be construed as a potential conflict of interest.
Publisher’s note
All claims expressed in this article are solely those of the authors and do not necessarily represent those of their affiliated organizations, or those of the publisher, the editors and the reviewers. Any product that may be evaluated in this article, or claim that may be made by its manufacturer, is not guaranteed or endorsed by the publisher.
Supplementary material
The Supplementary Material for this article can be found online at: https://www.frontiersin.org/articles/10.3389/fenvs.2023.1155789/full#supplementary-material
References
3RWW (2022). 3 rivers wet weather green infrastructure atlas. Available at: https://3rww.maps.arcgis.com/apps/webappviewer/index.html?id=a9d29d4710194416b4938a4c9098773e.
Adhikari, B., Perlman, R., Rigden, A., Todd Walter, M., Clark, S., and McPhillips, L. (2023). Field assessment of metal and base cation accumulation in green stormwater infrastructure soils. Sci. Total Environ. 875, 162500. doi:10.1016/j.scitotenv.2023.162500
Allegheny County Division of Computer Services Geographic Information Systems Group (2017a). Allegheny county imagery 2017. Web. Available at: https://www.pasda.psu.edu/.
Allegheny County Division of Computer Services Geographic Information Systems Group (2017b). Allegheny county lidar and terrain products 2017. Available at: https://www.pasda.psu.edu/.
Allegheny County Sanitary Authority (2019). Green stormwater infrastructure and source control monitoring guide. Pittsburgh: ALCOSAN.
Bäckström, M., Karlsson, S., Bäckman, L., Folkeson, L., and Bo, L. (2004). Mobilisation of heavy metals by deicing salts in a roadside environment. Water Res. 38, 720–732. doi:10.1016/j.watres.2003.11.006
Bain, D., Elliot, E., Thomas, B., and River, M. (2019). Green infrastructure for stormwater management: Knowledge gaps and approaches. Available at: http://d-scholarship.pitt.edu/36717/15/Green%20Infrastructure%20for%20Stormwater%20Management.pdf (Accessed November 20, 2018).
Bhaskar, A. S., and Claire, W. (2012). Water balances along an urban-to-rural gradient of metropolitan Baltimore, 2001–2009. Environ. Eng. Geosci. 18 (1), 37–50. doi:10.2113/gseegeosci.18.1.37
Clevenot, L., Carré, C., and Pech, P. (2018). A review of the factors that determine whether stormwater ponds are ecological traps and/or high-quality breeding sites for Amphibians. Front. Ecol. Evol. 40, 00040. doi:10.3389/fevo.2018.00040
Collins, T. M., Muller, E. K., and Tarr, J. A. (2004). “Pittsburgh's rivers: From urban industrial infrastructure to environmental infrastructure,” in Rivers in history: Waterways in europe and north America (Washington: German Historical Institute), 31.
Danfoura, M. N., and Gurdak, J. J. (2016). Redox dynamics and oxygen reduction rates of infiltrating urban stormwater beneath low impact development (LID). Water 8 (10), 435. doi:10.3390/w8100435
EPA (2021). Regional screening levels generic tables. Available at: https://www.epa.gov/risk/regional-screening-levels-rsls-generic-tables (Accessed December 5, 2022).
Fischbach, R. J., Kyle, E. S., Devin, T., Michael, W. T., Lauren, C. M., and Linnea, M. W. (2017). Robust stormwater management in the Pittsburgh region: A pilot study. Santa Monica, CA: RAND Corporation, 1–149.
Gavrić, S., Leonhardt, G., Österlund, H., Marsalek, J., and Viklander, M. (2021). Metal enrichment of soils in three urban drainage grass swales used for seasonal snow storage. Sci. Total Environ. 760, 144136. doi:10.1016/j.scitotenv.2020.144136
Kabata-Pendias, A., and Pendias, H. (2011). Trace elements in spils and plants 4th. Boca Raton, FL: CRC Press.
Kondo, M. C., Sharma, R., Plante, A. F., Yang, Y., and Burstyn, I. (2016). Elemental concentrations in urban green stormwater infrastructure soils. J. Environ. Qual. 45 (1), 107–118. doi:10.2134/jeq2014.10.0421
Lerner, D. N. (1986). Leaking pipes recharge ground water. Groundwater 24 (5), 654–662. doi:10.1111/j.1745-6584.1986.tb03714.x
MacDonald, Mott (2016). The green first plan: A city-wide green infrastructure assessment. Pittsburgh: Pittsburgh Water and Sewer Authority.
Marsalek, J., Watt, W. E., and Anderson, B. C. (2006). Trace metal levels in sediments deposited in urban stormwater management facilities. Water Sci. Technol. 53, 175–183. doi:10.2166/wst.2006.051
Maxim, A., Bain, D. J., and Burgess, J. (2022). Urban soils in a historically industrial city: Patterns of trace metals in Pittsburgh, Pennsylvania. Environ. Res. Commun. 4 (7), 075004. doi:10.1088/2515-7620/ac7cc2
Mullins, A. R., Bain, D. J., Pfeil-McCullough, E., Hopkins, K. G., Lavin, S., and Copeland, E. (2020). Seasonal drivers of Chemical and hydrological patterns in roadside infiltration-based green infrastructure. Sci. Total Environ. 714, 136503. doi:10.1016/j.scitotenv.2020.136503
National Research Council (2005). Regional cooperation for water quality improvement in southwestern Pennsylvania. Washington, DC: The National Academies Press.
Pitt, R., Clark, S., and Field, R. (1999). Groundwater contamination potential from stormwater infiltration practices. Urban water 1 (3), 217–236. doi:10.1016/s1462-0758(99)00014-x
Rossi, R. J., Bain, D. J., Elliot, E. M., Divers, M., O'Neill, B., and O'Neill, B. (2017). Hillslope soil water flowpaths and the dynamics of roadside soil cation pools influenced by road deicers. Hydrol. Process. 31 (1), 177–190. doi:10.1002/hyp.10989
Schwarz, K., Pickett, S. T. A., Lathrop, R. G., Cadenasso, M. L., Weathers, K. C., Pouyat, R. V., et al. (2012). The effects of the urban built environment on the spatial distribution of lead in residential soils. Environ. Pollut. 163, 32–39. doi:10.1016/j.envpol.2011.12.003
Sharma, R., and Malaviya, P. (2021). Management of stormwater pollution using green infrastructure: The role of rain gardens. Wiley Interdiscip. Rev. Water 8 (2), e1507. doi:10.1002/wat2.1507
Sharp, M. B., and Thomas, W. H. (1965). “A guide to the old stone blast furnaces in Western Pennsylvania part I,” in Western Pennsylvania history. 48 (1–4), 77–100.
Tarr., J. A. (2004). Devastation and renewal: An environmental history of Pittsburgh and its region. Pittsburgh, PA: University of Pittsburgh Press.
Wade, A. M., Richter, D. D., Craft, C. B., Nancy, Y., Bao, P. R. H., Osteen, M. C., et al. (2021). Urban-soil pedogenesis drives contrasting legacies of lead from paint and gasoline in city soil. Environ. Sci. Technol. 55 (12), 7981–7989. doi:10.1021/acs.est.1c00546
Keywords: heavy metals, green infrastructure, legacy pollution, stormwater, cities
Citation: Brewster BM and Bain DJ (2023) Metal accumulation patterns in Pittsburgh, PA (United States) green infrastructure soils: road connections and legacy soil inputs. Front. Environ. Sci. 11:1155789. doi: 10.3389/fenvs.2023.1155789
Received: 31 January 2023; Accepted: 04 July 2023;
Published: 13 July 2023.
Edited by:
Carl Mitchell, University of Toronto Scarborough, CanadaReviewed by:
Steven T. Goldsmith, Villanova University, United StatesJustin Byron Richardson, University of Massachusetts Amherst, United States
Copyright © 2023 Brewster and Bain. This is an open-access article distributed under the terms of the Creative Commons Attribution License (CC BY). The use, distribution or reproduction in other forums is permitted, provided the original author(s) and the copyright owner(s) are credited and that the original publication in this journal is cited, in accordance with accepted academic practice. No use, distribution or reproduction is permitted which does not comply with these terms.
*Correspondence: Brandon M. Brewster, Ym1iMTQ0QHBpdHQuZWR1; Daniel J. Bain, ZGJhaW5AcGl0dC5lZHU=