- 1Department of Urban and Rural Planning, School of Architecture, Harbin Institute of Technology, Harbin, China
- 2Department of Landscape, School of Architecture, Harbin Institute of Technology, Harbin, China
As a naturally-based solution (NBS), green infrastructural network constructing can improve urban ecological resilience and support sustainable urban development. However, as the Frontier of urban expansion, the boundary of built-up areas has little research on the boundary green infrastructure (BGI) connecting natural and artificial spaces. In order to make up for the shortcomings of relevant research, we propose a method for identifying BGI and analyze its landscape pattern characteristics. We selected 15 European cities as cases to extract the boundaries of built-up areas. Moreover, we used morphological pattern analysis (MSPA) to identify the ecological source and select the best distance threshold for the landscape connectivity model to identify the BGI range. Through the gradient area method and MSPA, the BGI landscape pattern characteristics of the case cities were analyzed quantitatively. The BGI scale was affected by the area of the built-up area and the threshold of GI landscape connectivity distance. Additionally, the BGI space contained a small number of large ecological sources and many scattered and small fragmented patches. The best landscape model of BGI was the surrounding pattern, followed by the aggregation pattern, which had good landscape connectivity; however, the fragmentation of the scattered pattern was high. Lastly, the ecological core area in BGI was the main landscape type; it has a high landscape connection function for the GI network inside and outside the built-up area and promotes biological exchange inside and outside the built-up area. This study proves that BGI has an important ecological significance, can guarantee the scientific nature of the NBS method, and ensures the ecological security pattern of cities.
1 Introduction
The rapid development of urbanization has caused many ecological problems, severely degrading the city’s and surrounding areas’ environment (Peng et al., 2018a). The ecosystem has been unable to bear the ecological pressure brought by urban development, leading to the decline of the ecological resilience of the city (Jie Yi et al., 2022). Balancing ecological protection and urban construction and realizing sustainable urban development has become a pressing problem worldwide (Kabisch et al., 2017; Su and Haonan, 2022). Naturally-based solutions (NBS) emerged as a new approach to social challenges in this context (Mackinnon, 2008; Eggermont et al., 2015). The green infrastructure (GI) network, as an NBS method (Nadja et al., 2016; Mabon, 2019), is an important strategy to enhance ecological resilience and achieve sustainable development (Panagopoulos et al., 2016; Song et al., 2018). As the Frontier of urban expansion, the contradiction between human activities and environmental protection is prominent (Manachini et al., 2013). Therefore, it is essential to study the GI located at the boundary of an urban built-up area for the research and practice of NBS.
GI is an ecological network formed by the interconnection of multi-functional natural areas and open green spaces (Tzoulas et al., 2007; Bartesaghi Koc et al., 2017). Landscape connectivity is the basis of species communication among ecological patches, and maintaining such connectivity is vital to ensure sustainable development (J. Peng et al., 2018b; Wimberly et al., 2018). Therefore, GI located at the boundary of urban built-up areas (BGI) must ensure the GI network structure’s connectivity and functional transition inside and outside built-up areas. Chen et al. built GI networks in urban fringe areas to improve landscape patterns and enhance landscape connectivity (Cui et al., 2020; Zhong et al., 2020; Liang et al., 2022); however, few studies considered the multi-level landscape connectivity characteristics of GI in urban fringe areas. There are two main reasons for the fragmentation of GI networks inside and outside urban built-up areas. First, urban built-up areas are used as resistance surfaces for biological migration (Dong et al., 2020; Xindi Zhang, 2022). Second, the GI area in urban built-up areas is small; hence, they are not usually selected as ecological sources (Liuyang et al., 2018). Therefore, ignoring GI at the boundary of built-up urban areas negatively affects ecological processes, causing the separation of GI networks inside and outside built-up areas, and it is difficult to maintain the security and stability of the ecosystem. Therefore, a BGI range identification method can be established from the perspective of landscape connectivity characteristics to determine the GI space near the built-up area boundary that can generate effective landscape connections for internal and external GI networks.
BGI—an important connecting space of the GI network inside and outside built-up areas—comprises patches and corridors (Forman, 1995). Studies on GI patterns mostly focus on urban central areas and regional scales (Xiao Ran et al., 2015; Gu et al., 2017; Jiaxing et al., 2019; Jeong et al., 2020; Kan et al., 2021; Jiang et al., 2022). Additionally, analysis models, such as landscape pattern (Wang et al., 2019), landscape connectivity index, and landscape pattern index of GI (Huang et al., 2021; Modica et al., 2021), are usually applied to analyze and evaluate GI patterns based on specific scope and elements. However, studies on the spatial structure and landscape pattern characteristics of BGI are relatively weak. Studying the structural composition and landscape pattern characteristics of BGI helps reveal the GI network’s structural characteristics and ecological processes, strengthen the connection degree of natural and artificial GI space, and improve the structural integrity.
As a part of the GI network, BGI is the NBS method for improving urban ecological resilience. Based on the landscape connectivity characteristics of BGI, we established the spatial identification method of BGI and analyzed its landscape pattern characteristics. Distance threshold is the maximum diffusion distance of biological flow used to determine the presence or strength of landscape connectivity between patches in the study area (Meng et al., 2016; Qinghe et al., 2017). As an important method to measure landscape patterns and function, the landscape connectivity model based on graph theory can obtain the optimal distance threshold (Almenar et al., 2019). In this study, we used PC, IIC, and other connectivity indexes to analyze and determine the optimal diffusion distance threshold. Based on this, the spatial range of BGI with landscape connectivity function for GI networks inside and outside the built-up area was defined. Moreover, we selected the gradient area and morphological spatial pattern analysis (MSPA) methods to evaluate the overall landscape pattern and structure of BGI. In this study, 15 United Kingdom, France, and German cities were selected as research objects. Based on ArcGIS, GuidosToolbox, and other software, MSPA and landscape connectivity model based on graph theory were adopted to identify the spatial scope of case BGI and analyze the landscape pattern. The results can provide a reference and basis for urban BGI spatial identification and pattern optimization.
2 Material and methods
The city is a complex system (Bonnes et al., 1990). Due to the high degree of human intervention inside the built-up area, urban green infrastructure (UGI) is mainly artificial green space integrating various ecosystem service functions (Chengcheng et al., 2021). The primary function of regional green infrastructure (RGI) outside built-up areas is to maintain ecosystem stability and protect biodiversity, including natural ecological spaces, such as woodland and grassland (Tang Xiaolan, 2011).
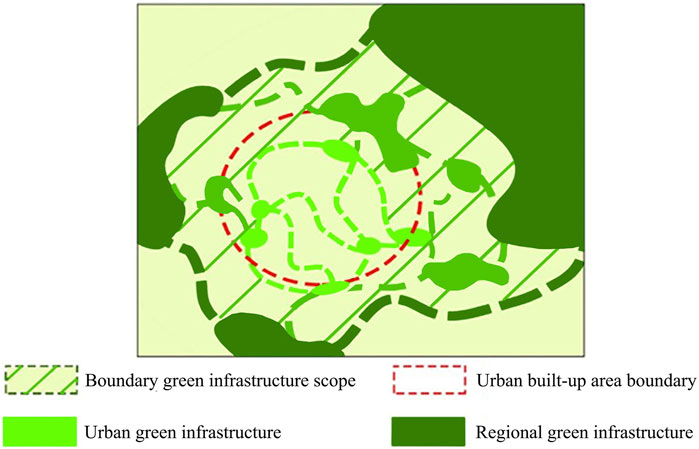
In this study, BGI is the GI located at the boundary of the urban built-up area, including a certain range of UGI and RGI on both sides of the boundary, which plays a role of landscape connection for the GI network between the built-up area and the region (Figure 1). In the BGI space, BGI connects the GI network inside and outside the built-up area, ensures multi-level landscape connectivity, and maintains the stability and biodiversity of the urban ecosystem. The primary functions of GI inside and outside the built-up area transition are to ensure that the biological flow in the regional GI network can move to the built-up area and extend the composite functionality of GI in the built-up area outward.
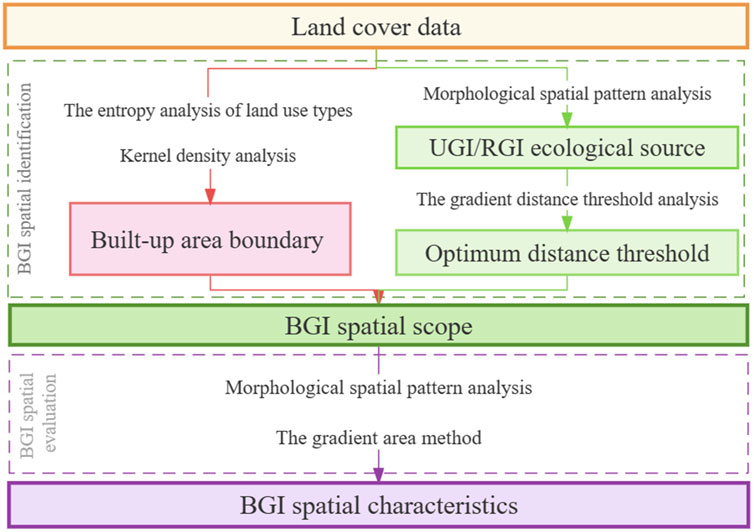
The study of BGI space in the cases is divided into two parts (Figure 2). First, delineating the BGI space scope, which involves two steps. a) Identifying the built-up area boundary of the case city. b) Determining the most suitable landscape connection distance threshold between the built-up area and the regional GI network of the case according to BGI’s landscape connection characteristics. Second, analyzing the case cities’ BGI spatial landscape pattern and structure.
The data in this study is mainly the land cover data of case cities in Germany, the United Kingdom, and France in 2020 (spatial resolution 30 m, data source: http://www.globallandcover.com/).
2.1 BGI spatial identification
2.1.1 Built-up area boundary extraction
The entropy analysis of land use types is an information model that expresses the richness and orderliness of land use types through the number of land use types and the proportion of the unit area occupied by the types (Figure 3). Its principle is similar to that of thermodynamics, in which entropy represents the degree of molecular disorder in a thermodynamic system (Prunkl, 2018). We selected the standard deviation (S) of a simple statistical variable to represent the richness of land use type information. The formula is as follows:
Where
Through kernel density analysis of the binary raster data of land type, the raster data is converted into vector point elements, and the result of boundary extraction of the built-up area is optimized. When the land type changes, the point density of a single attribute decreases rapidly, and the kernel density value drops sharply. Therefore, kernel density analysis can reflect the spatial boundary of a sudden change in land use type, and it is calculated as follows (Zhang and Lu, 2009):
Where
2.1.2 Ecological source selection
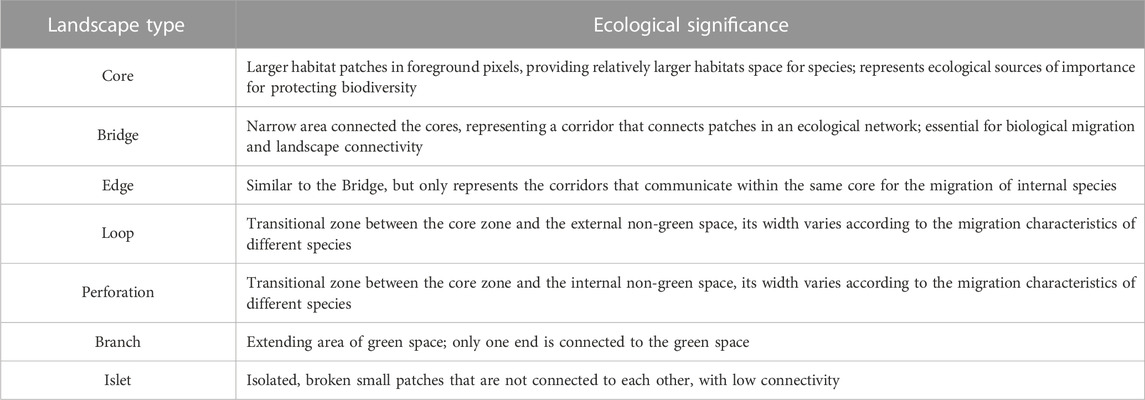
MSPA can identify ecological patches that significantly impact the ecological connectivity of the study area (Soille and Vogt, 2009). Notably, the MSPA method can only identify patches and corridors with ecological protection significance using land use raster data (Julien Carlier, 2019). According to morphology, spatial pattern, impact on the overall landscape connectivity, and other factors, the ecological land raster data is divided into seven non-overlapping landscape types (Nan-nan et al., 2021). The ecological core and bridging areas have high ecological connectivity and can protect regional biological diversity. This method has important significance in improving the scientific nature of ecological source selection.
Within the boundaries of built-up areas, the GI primarily enhances the function of recreation service, biodiversity protection is relatively weak, and the ecological land area is small. In this study, ecological patches with an area of ≥0.5 km2 were selected as the ecological source area at the built-up area scale (He et al., 2019). At the regional scale, the ecological land within 50 km outside the built-up area boundary was selected for MSPA analysis based on the reachable range of species diffusion (Meng et al., 2016). As an important ecology for regional biodiversity conservation, the biological habitat must have sufficient scale. Therefore, the core area of ≥5 km2 was selected as the ecological source area at the regional scale (MT et al., 2017).
2.1.3 Distance threshold selection
The gradient distance threshold analysis can identify the study area’s most suitable landscape connection distance threshold (Baranyi et al., 2011; DU et al., 2019). We selected the threshold range of landscape diffusion distance in the built-up area and regional scale based on the study area and biological migration characteristics.
There are few tracks of large wildlife activities in urban built-up areas, and the study scale is relatively small (Wei al. 2009). Therefore, 15 distance threshholds at 200 m interval from 200 to 3,000, plus 4,000, 5,000 and 10000 selected to analyze of the built-up area scale. Outside the built-up area, combined with the characteristics of biological migration (Meng et al., 2016), we selected 1,000, 2,000, 2,500, 3,000, 3,500, 4,000, 4,500, 5,000, 5,500, 6,000, 6,500, 7,000, 7500, 8000, 8500, 9,000, 9500, 10000, 15000, 20000 m; therefore, 20 distance thresholds were used for regional scale analysis.
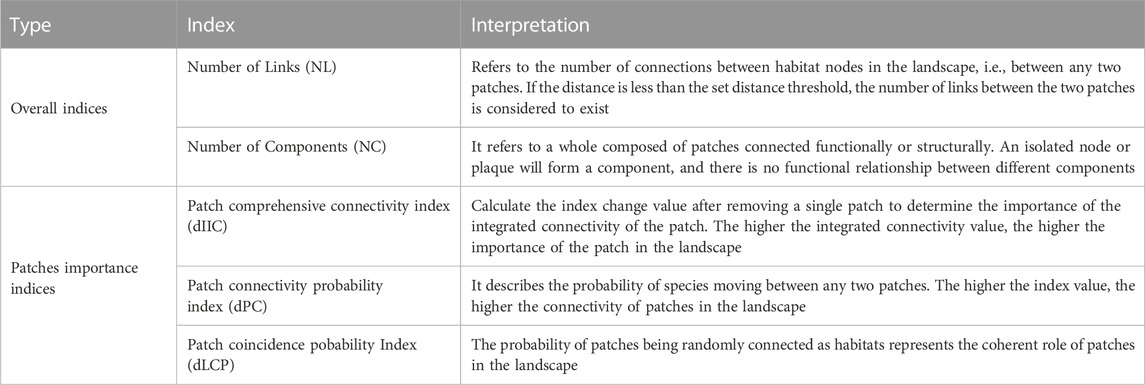
The stable range of landscape connectivity can be preliminarily determined using the number of links between patches (NL) and landscape component score (NC) as the indicators of landscape connectivity (Montis et al., 2019). Furthermore, the importance index of each BGI patch is calculated within the stable distance threshold range of landscape connection (Table 1). Moreover, by comparing the importance index of each patch, the most suitable threshold of landscape connection distance is determined. The higher the consistency of the index change trend of each patch, the more effective the selection of distance threshold (DU Zhibo al. 2019).
2.1.4 BGI spatial scoping
Using the boundary of the urban built-up area as the baseline, the best distance threshold for buffering UGI inward and outward of the boundary was determined. Additionally, the combination of the inner and outer buffer zones constitutes the BGI spatial range of the case city. This scope can ensure that BGI space has an effective landscape connection between the area and the GI of the built-up area and can identify the GI connection and transition space between the built-up area and the area.
2.2 BGI spatial feature quantification
2.2.1 BGI landscape composition analysis
To ensure the stable development of ecological functions, ecological patches should have a specific scale (Urban, 2001; Baguette et al., 2013). The purpose of the gradient area method is to retain the habitat patches of great significance for biodiversity conservation and remove a large number of fragmented, isolated patches. Setting the area threshold by comprehensively considering the number of patches, patch area, and the proportion of screened patches to the total area of the ecological space can ensure that the basic ecological functions and processes are unaffected (Xiaolin et al., 2021). We extracted the continuously distributed forest land, grassland, and other vegetation cover land included in the BGI space as the BGI patch and calculated the patch area. Additionally, we selected 16 area thresholds between 0 and 3 km2 in steps of 0.2 km2 (Mao Quan et al., 2019). Next, we analyzed the changing trend of patch number, area, and proportion of total ecological land area with the area threshold to determine the patch size and composition in the landscape.
2.2.2 BGI landscape pattern quantification
The MSPA method can divide the grid data of patches into core, island, perforation, edge, loop, bridge, and branch (Table 2). The core area and bridge are the landscape types with the connectivity of the landscape structure (Yong Zheng et al., 2022).
3 Results
3.1 BGI space identification
3.1.1 Extraction results of the built-up area boundary
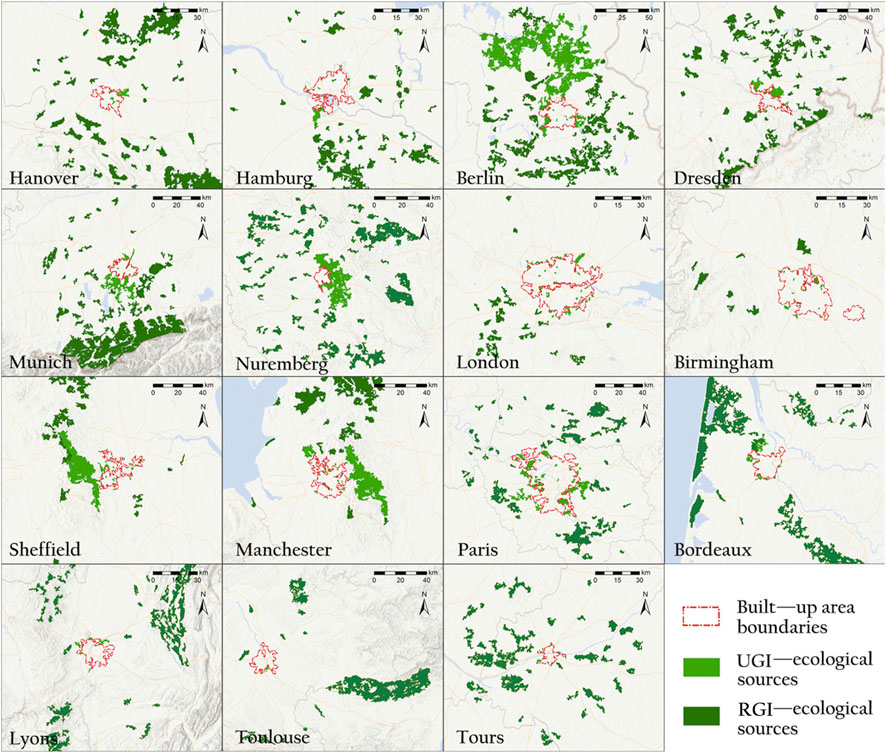
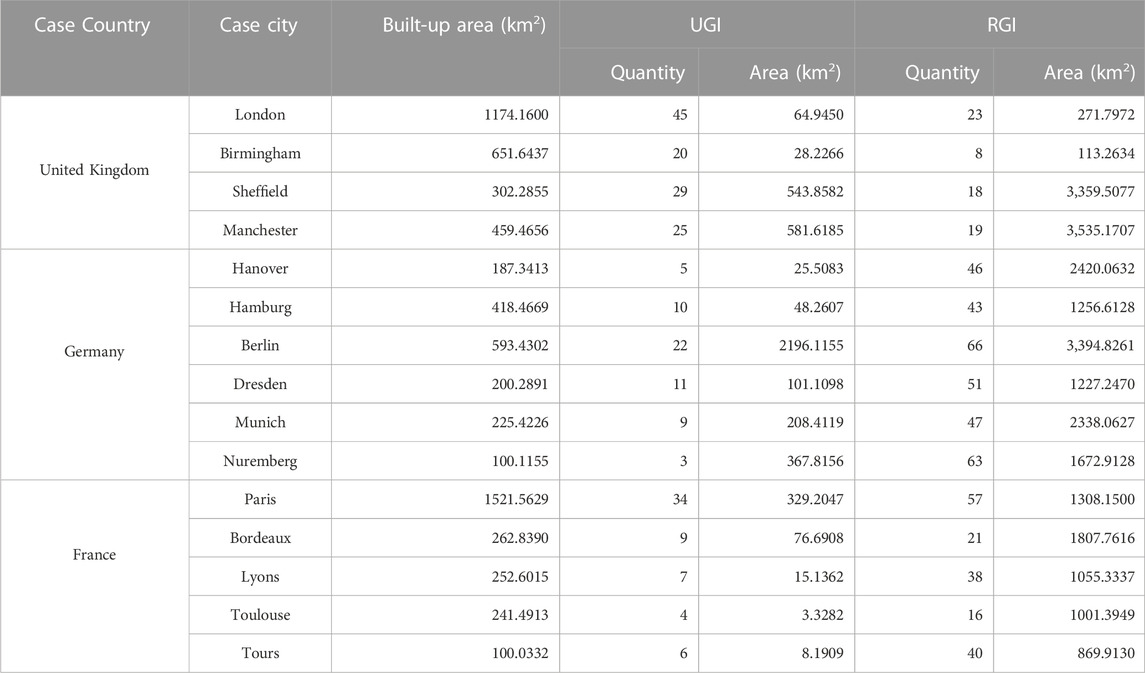
The extraction results are presented in Figure 4 and Table 3. The built-up areas of the case cities were >100 km 2. London and Paris had the highest built-up area, 1174.16 km2 and 1521.5629 km 2, respectively. However, Nuremberg and Toulouse had the smallest built-up area, 100.1155 km 2 and 100.0332 km2, respectively The size of the built-up area reflects the construction scale of the city. Moreover, the differences in the built-up areas of the case cities were large. It can analyze cities with different built-up areas scales and better study the BGI characteristics of cities with different sizes.
3.1.2 Ecological source identification
Figure 4 shows the case cities’ UGI and RGI ecological sources, and each city’s ecological source area and quantity are listed in Table 3. London had the highest number of UGI ecological sources, with 45 patches, mainly small parks and greenbelts. However, the UGI ecological source area in the built-up area of Berlin was the largest, with strong ecological functions. Notably, there were only 4 UGI ecological sources in the built-up area of Toulouse, with a total area of only 3.328 km2; therefore, biodiversity protection was relatively weak. Berlin had the highest number of regional ecological sources outside the built-up area, with 66 patches. However, the total area of regional ecological sources in Sheffield, Manchester, and Berlin was >3,000 km2, which can maintain regional ecological security (Ma et al., 2004) and biodiversity. The GI inside and outside the built-up area of the case cities had certain ecological and landscape connectivity functions, which can provide a good basis for identifying and analyzing BGI.
3.1.3 Determination of optimum distance threshold
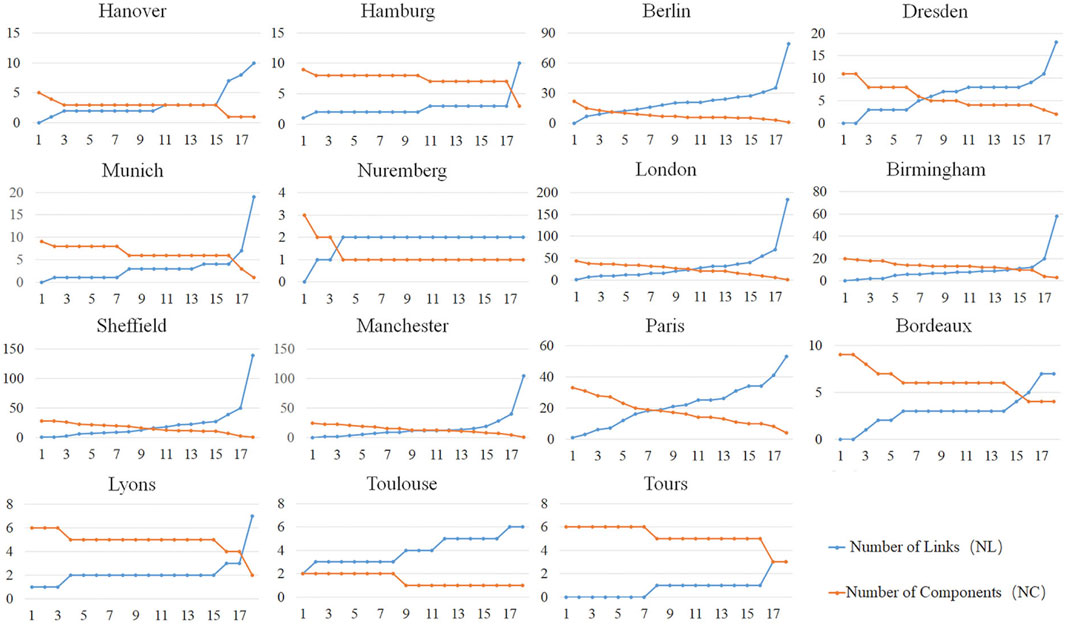
Berlin—the city with the best UGI landscape connectivity in German case cities—had many ecological patches, and a relatively close distance between patches is superior to the other five case cities (Figure 5). Additionally, the landscape connectivity of four United Kingdom cities was good in the built-up area. At the 10,000 m distance threshold, all the landscape elements were connected into a landscape component, and the NC value reached 1. According to the NL value, the UGI landscape connectivity in London’s built-up area was the strongest, and that in Birmingham was relatively weak. Among the French cities, Paris had many UGI patches, high NL value, and a small and stable increase trend. However, the number of UGI patches in other cities was <10, and the patch distribution was relatively discrete. The overall NC and NL values changed step wisely with the distance threshold in a stepwise manner.
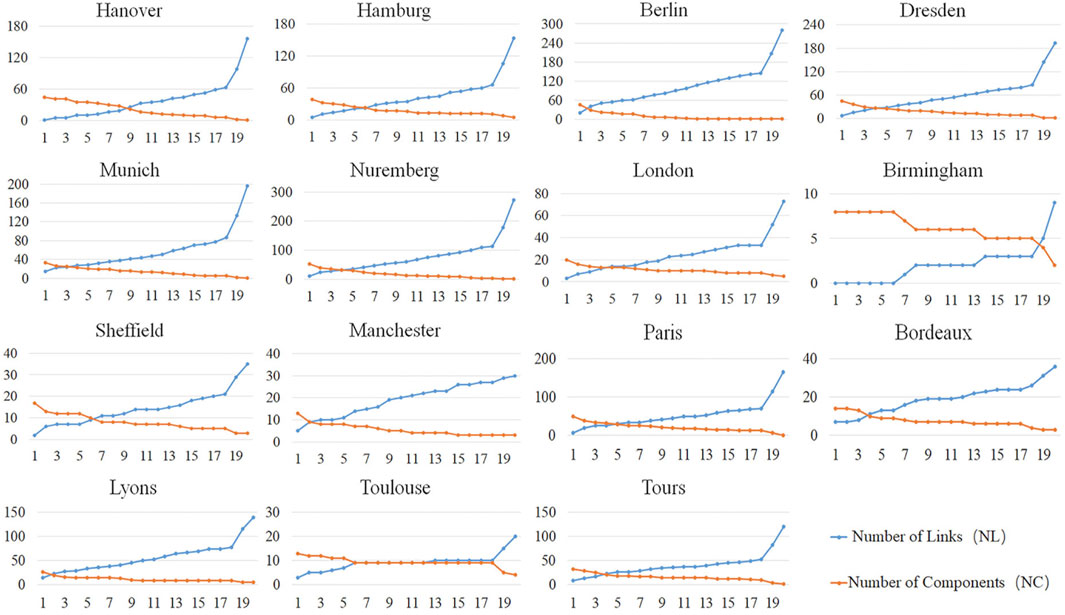
In the RGI analysis result shown in Figure 6, London, Manchester, and Sheffield in the United Kingdom had good connectivity. With the change of distance threshold, there were stages of a small change rate of NC and NL and stable value. Furthermore, the number of RGI patches in Birmingham was relatively small, and the distribution was relatively discrete; therefore, the NC and NL values changed stepwise with the increased distance threshold. Moreover, the number of RGI patches in German case cities was large and closely distributed. With the change in distance threshold, the change in NC and NL values was relatively stable. Excluding Dresden, other cases could be connected into a landscape component when the distance reached 20000 m, indicating that the regional ecological source can meet the needs of biological migration and diffusion. Furthermore, the number of RGI patches in Toulouse, France, was relatively small, and the distribution was relatively sparse, resulting in the NC and NL change curves showing a constant interval with the increase of the distance threshold.
The trend of curve change in Figure 5, Figure 6 can be divided into several stages.
(a) The NC value decreased rapidly, and the NL value increased rapidly. The increase in landscape connectivity indicates that it promotes ecosystem stability. When the change of distance threshold causes a drastic change in landscape connectivity, it indicates that the landscape connectivity is unstable, and this interval distance threshold is unsuitable for the correlation analysis of landscape connectivity in the study area.
(b) The NC value gradually decreased or remained unchanged, and the NL value slowly increased or remained stable. In this interval, the landscape component fraction changes slightly, and the number of connections increases steadily, indicating that the landscape connection stability is less affected by the change in distance threshold. Therefore, the landscape connection in this section is in a relatively stable state, which is suitable for studying landscape connectivity.
(c) The NC curve changes slightly; however, the NL curve significantly increases. The landscape connection between patches becomes increasingly strong with the increased diffusion distance. However, the NL value changes significantly, which cannot reflect the study area’s landscape pattern and ecological process, and it is unsuitable to be selected as the stable distance threshold range.
(d) The NC value is = 1. This means that all ecological sources are connected and can be considered biological habitats. However, this situation does not conform to the actual landscape pattern in the study area and cannot be used as the stable distance threshold range for the landscape connectivity study.
The selected stable distance threshold ranges are listed in Table 4. The NL curve of RGI in Bordeaux showed a staged growth, and the NC curve showed a fluctuating stable state; therefore, two stable distance threshold intervals were selected. Since the number of UGI patches in Nuremberg, Toulouse, and Toure was very small, when the diffusion distance reached a fixed value, the NC and NL values did not change; therefore, there was no threshold range to maintain the stable connection of the landscape.
For example, in Berlin, 20 RGI patches were screened, and the distance thresholds of 7,000, 7,500, and 8000 m were set. Additionally, the changes in plaque importance index dLCP, dIIC, and dPC were analyzed, and the results are shown in Figure 7. Moreover, when the distance threshold is set to 8,000 m, the difference in plaque importance index is the smallest, and the index trend of each patch is the most consistent, so it is selected as the optimal distance threshold. Notably, when the distance threshold was 8,000 m, the difference in plaque importance index was the smallest, making it the best distance threshold. The appropriate distance threshold between each case city’s RGI and UGI ecological source was determined similarly, and the results are presented in Table 4.
The appropriate distance threshold between patches is affected by the distance between patches. The closer the patch distribution, the more stable the landscape pattern, and the lower the appropriate distance threshold. Sheffield’s UGI pattern was good, with many patches, a large total area, and a relatively close distribution. Moreover, Munich’s RGI pattern was good, and the area and quantity of ecological sources were large and close, which is conducive to biological diffusion.
3.1.4 BGI width determination
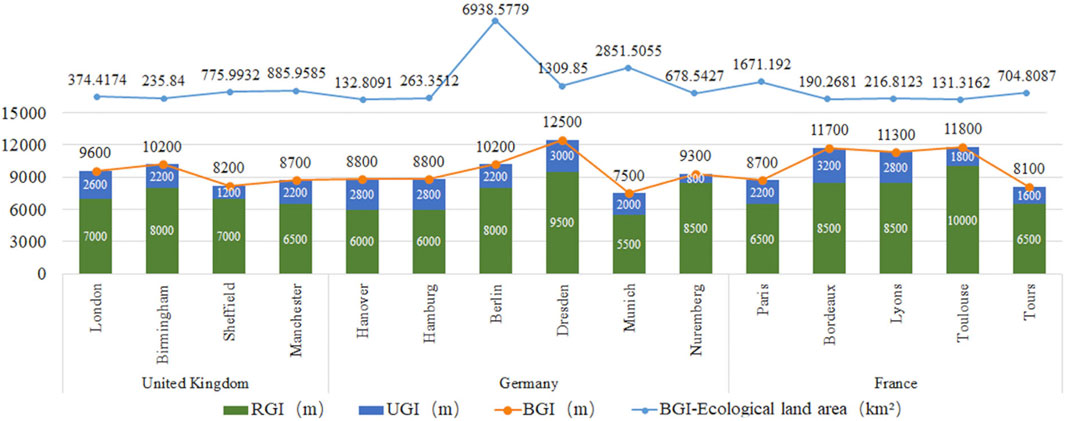
The width and area of BGI in each case city are shown in Figure 8, and the spatial distribution of BGI is shown in Figure 10. BGI scope is affected by the appropriate distance threshold of GI and the scale of the built-up area. The closer the distribution of ecological patches inside and outside the built-up area, the stronger the landscape connection and the smaller the coverage width of BGI.
3.2 BGI spatial evaluation
3.2.1 Differences in the characteristics of BGI pattern
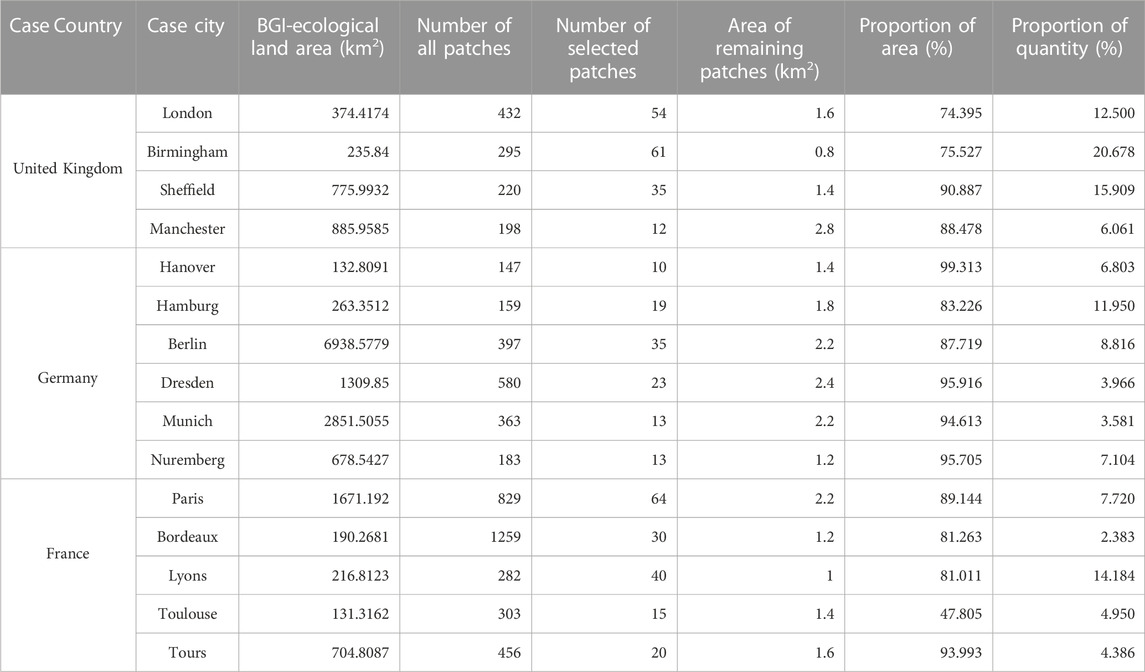
The total ecological land area of case BGI was >100 km2, and the number of BGI patches was >100 (Table 5). In the BGI space, the ecological land has a certain scale. The larger the ecological source area, the better the ecological function. At the urban boundary, the intensity of human activities was gradually weakened. Additionally, the total ecological area and the number of patches increased, higher than those in the urban built-up areas. Within the scope of BGI, the increase in the number of patches indicates that the number of nodes in the GI network has increased, and the landscape connection has improved.
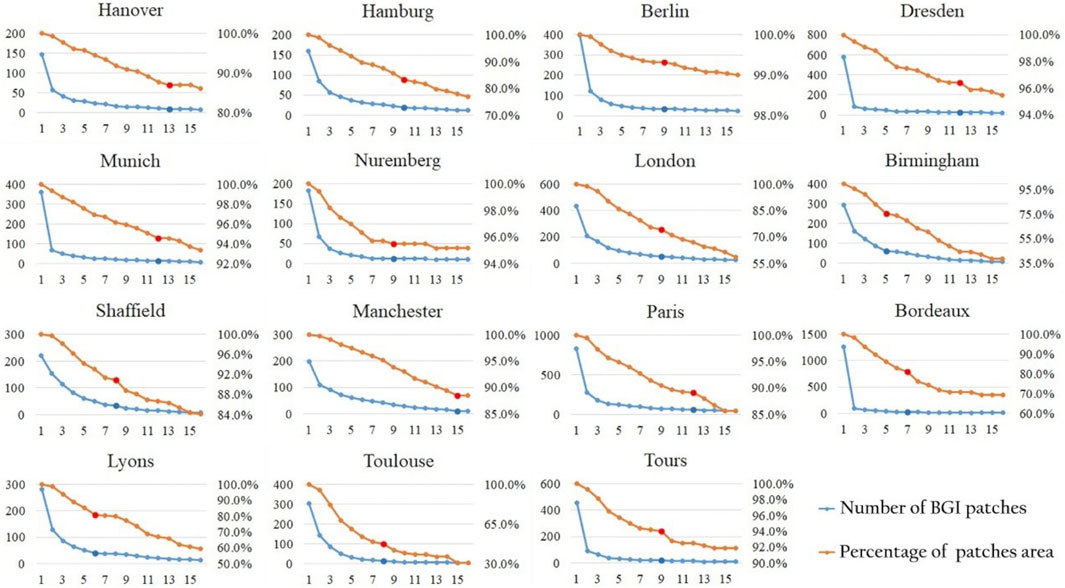
Among the numerous patches, a large area of ecological core could provide habitats for organisms, and small and scattered serve patches as stepping stone patches. Using the gradient area threshold analysis of the BGI patches in the case cities, the composition of the BGI patches in each case was analyzed according to the inflection point of the curve in Figure 9. The results are presented in Table 5.
The number of scattered small patches in Birmingham’s BGI was large, accounting for about 25% of the total area. Moreover, the BGI was relatively broken, and the proportion of large patches was relatively low. Furthermore, the BGI in Toulouse contains many small ecological patches, and the landscape pattern was severely fragmented. Hanover’s BGI had a high proportion of medium and large patch areas, a complete overall ecological pattern, and stable function. In all cases, the BGI space contained a large area of ecological sources to ensure biodiversity and ecological security, and many small patches were stepping stones in the biological migration and diffusion path.
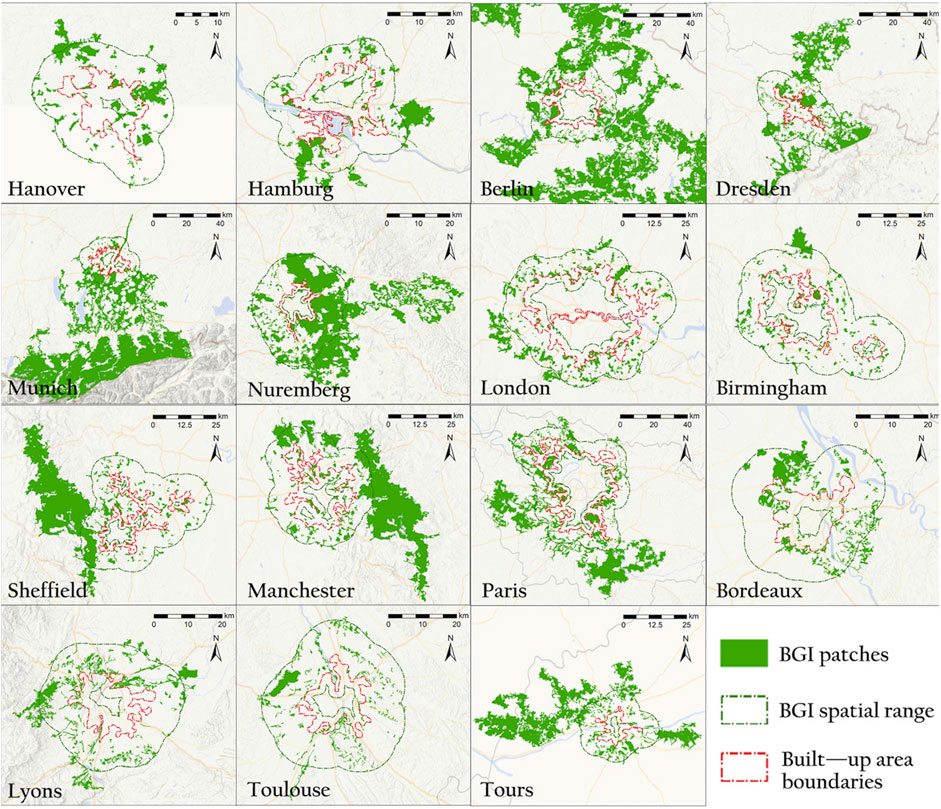
According to the distribution location and spatial pattern of BGI in Figure 10, the BGI model of the case cities can be divided into three types.
1) Surrounding pattern: The patches can be closely surrounded by the urban built-up area, forming a circular or semi-circular structure conducive to biological flow between GI networks and the biological migration and diffusion in BGI space. There are two types of surrounding patterns. First, a large ecological source outside the built-up area with a very high landscape structure and functional connection seen in Berlin and Paris. Second, many small artificial green spaces clustered to form a green ring structure surrounding the built-up area seen in London. This type of BGI has a high overall structural connectivity; however, the functional connectivity of the patch is weaker than that of the large regional ecological source.
2) Aggregation pattern. Local patches are clustered and distributed around the built-up area, and multiple clustered and distributed GI network nodes connect the GI landscape. For example, in Hamburg, Bordeaux, and Sheffield, the ecological patches were clustered and distributed and had a certain scale without forming a semi-ring or ring structure. The more the number and area of patches, the stronger the landscape connection function between the two ecological networks and the better the landscape stability.
3) Scattered pattern. The patches are scattered in the BGI space, and the patch area is generally small. The landscape connection function of BGI was relatively weak in Birmingham and Toulouse. Small-area ecological patches are suitable stepping stones in the biological migration path and play a relatively weak role in biodiversity protection. The scattered distribution pattern can easily cause landscape fragmentation.
3.2.2 BGI landscape pattern analysis
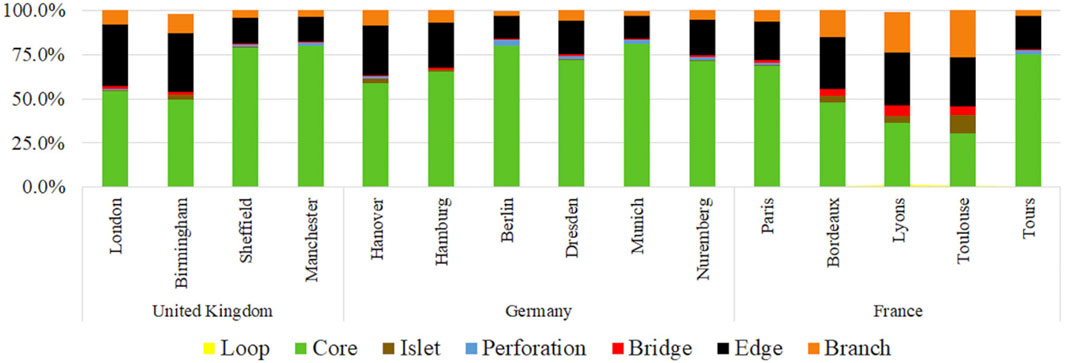
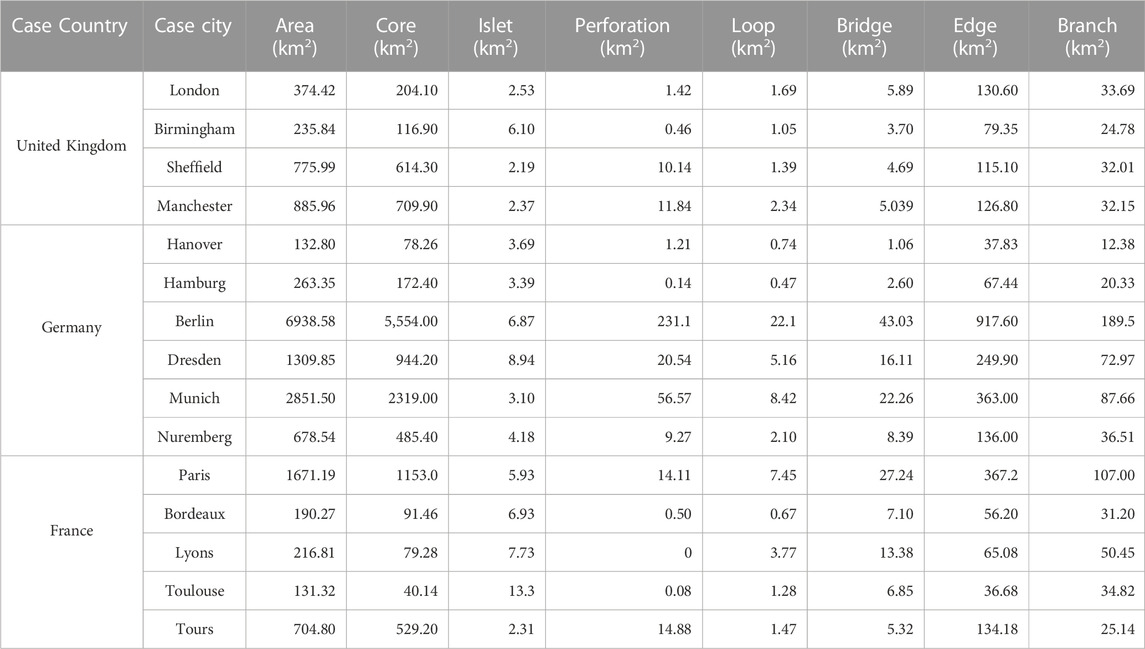
Figure 11 and Table 6 present the analysis results of MSPA. The proportion of core in BGI was the highest (>30%) in all case cities. Munich had the highest proportion of BGI core area, and Berlin had the largest BGI core area. As a landscape type with high structure connectivity function and less disturbance, the core mainly serves as the habitat of organisms and protects diversity. Therefore, the case cities’ BGI can protect biodiversity, of which Berlin and Munich had the strongest biodiversity protection function, and Toulouse had a relatively weak ecological function.
The edge area comes after the core area. In all cases, the proportion of marginal areas in BGI was >10%. Moreover, the area of BGI edge in Berlin and Munich was large; however, the proportion was small, 13.22% and 12.73%, respectively. This situation is because the edge area usually surrounds the ecological core area, and the patch’s size, quantity, and geometric shape can significantly affect the area and proportion of the edge area.
The third area is the branch, which can promote the material and energy exchange between the core area and the outside world. The area of branch lines in Berlin BGI was the largest; however, the proportion was the lowest due to the huge total area of Berlin BGI. Additionally, the branch has certain landscape connectivity, which enhances landscape connectivity and biodiversity protection by establishing ecological corridors.
As a narrow and long area connecting the ecological core areas, the bridge can serve as a corridor for biological migration and diffusion, which is essential for biodiversity protection. In the MSPA analysis of the case cities, Toulouse and Lyon BGI had the highest proportion of bridging areas. Notably, insufficient bridging area leads to a lack of connectivity between BGI patches and limited species migration and gene exchange, which is unconducive for maintaining biodiversity.
Furthermore, the loop is a shortcut for species migration within the patch, which is conducive to species migration within the same patch. In these cases, the area of the BGI loop in Lyon accounted for 1.739%; however, that of other cities was <1%, indicating that there are few patches in the BGI core area.
The perforation and the edge are the transition areas between the core and other land types; however, the perforation is located in the core of the patch, which easily affects the ecological process in the core. The low proportion of perforation area in BGI indicates that the impact on the interior of the BGI patch is small, and the ecological process in the core area can be well protected.
The landscape connectivity of islands is relatively low, and the possibility of internal material and energy exchange and transmission is relatively small. The BGI of the case cities contained a small number of islands, and the proportion of isolated patches in the BGI was small. This indicates that BGI had a relatively low landscape fragmentation degree, good landscape connectivity, and small stepping-stone ecological patches to ensure the activity and diffusion of organisms.
According to the MSPA analysis results, the core in BGI space was the most important landscape type, with the highest proportion and the largest area. This suggests that BGI’ primarily protects the normal migration and organism diffusion, maintains of ecosystem’s stability, and ensures the GI network’s landscape connectivity. Furthermore, the high proportion of edge was due to the weakening of the development intensity at the boundary of urban built-up areas compared with that in the built-up areas; however, there were still human activities around the edge of BGI patches. Moreover, the extremely low proportion of perforation indicates that human development and construction of GI patches are usually not in the core areas to prevent interference with ecological processes in the core areas. Additionally, the branch, bridge, and loop area all had certain proportions, indicating that BGI can provide corridors for the migration and diffusion of species, which is conducive to GI network connectivity and biodiversity protection.
4 Discussion
In the BGI space of the case, cities such as Berlin, Paris, and Bordeaux have large ecological sources, while cities such as Birmingham, Toulouse, and London only have small-area ecological patches (Figure 10). Among them, the BGI space in Berlin contains many large ecological sources with the highest total ecological area, and ecological patches are interconnected to form a surrounding pattern. The BGI space in Bordeaux also contains large ecological sources, but the patches are only locally clustered and cannot form a circular structure. The BGI of Birmingham is composed of many small patches, and the patches are scattered, with poor landscape connectivity and serious fragmentation. Similarly, there is no large ecological source in BGI space in London, but the patches are closely distributed and the landscape connectivity is high, forming a circular structure composed of many small-area patches. Therefore, in the BGI space, the larger the area of the ecological source and the stronger the connection function, the better the ecological function can be played. Moreover, the landscape pattern of BGI also plays a crucial role, the closer the distribution between the patches, the stronger the landscape connectivity, and the more conducive to the connection between the urban and the regional GI network.
In this study, BGI can play an important role in ensuring the integrity and connectivity of urban and regional GI network structures, which is consistent with other studies on the strengthening of urban-rural ecological connections between urban and rural GI at urban and rural margins (Zhong et al., 2020). The connectivity of urban and rural ecological networks is limited by the lack of ecological areas and the lack of stepping stone patches in some urban marginal areas (Cui et al., 2020; Zhong et al., 2020; Liang et al., 2022). In contrast, the border green infrastructure of European case cities can better maintain the biological flow between GI networks. By summarizing the pattern of case BGI and identifying different spatial pattern characteristics, the BGI of European case cities can support the connection between cities and regional GI networks. In addition, the results of the MSPA analysis showed that the BGI plaque of the case could provide services for human activities and also had a high biodiversity conservation function. In summary, BGI contains the composite functions of urban green infrastructure and regional green infrastructure and is an important part of the GI network.
When extracting ecological sources, MSPA considers the area factor and the structural characteristics and connectivity functions of landscape elements, preventing the subjectivity of source extraction and improving accuracy. However, MSPA analysis has a strong scale and edge effects, and the analysis results at different research scales are quite different (Ya-Ping et al., 2016). Therefore, it is important to select the appropriate analysis scale when using MSPA to analyze the characteristics of landscape patterns. To retain the small but important landscape elements in the built-up area and ensure the accuracy of the results, the grid size of the built-up area scale was set to 30 m, and the grid size outside the built-up area was set to 90 m (Tanner and Fuhlendorf, 2018). However, the reasonable selection of grid data granularity and edge width for different research areas still needs further research.
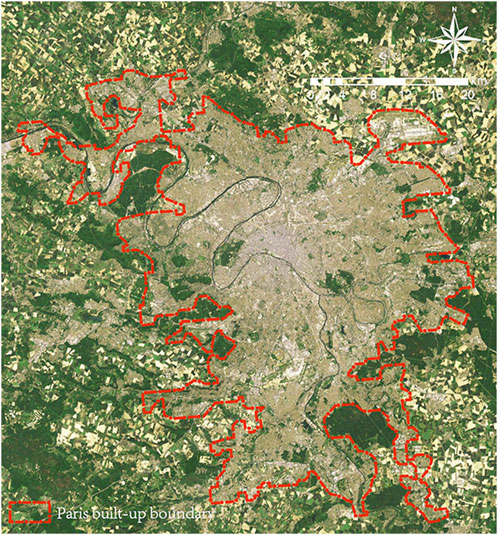
When extracting the boundaries of urban built-up areas, the edges of built-up areas extracted using the land-use entropy method were severely fragmented and showed an obvious sawtooth shape. Moreover, many holes were observed in the built-up area extracted by the POI kernel density analysis method, and the POI category was inconsistent with the land type (Jinhua et al., 2021). Notably, the boundary of the built-up area extracted in this study was accurate and can overcome the information-missing phenomenon of the extracted results. The comparison between the extraction results of the built-up area in Paris obtained by this method and the remote sensing satellite images is shown in Figure 12. The built-up area was close to the actual boundary, improving the “salt and pepper particles” phenomenon of the boundary of the built-up area determined using the land-use entropy method to extract the built-up area. Therefore, this method reflects the boundary details of urban built-up areas and has good applicability. Moreover, the extraction effect of built-up area boundaries in cities of different sizes had good accuracy.
The distance threshold needs to be determined when analyzing the landscape connectivity between the built-up area and the regional GI using Conefor software. However, the selection of distance threshold requires careful consideration of many factors, among which the diffusion range of species is the key factor, which varies widely for different species. Furthermore, when the landscape connectivity index is used to screen the landscape distance threshold, the appropriate distance threshold is closely related to the current distribution of BGI landscape patches. In this study, IIC, PC, and other landscape connectivity indexes were used to screen the appropriate distance threshold of the study area, and the selection index was small. Lastly, when selecting the distance threshold, the rationality of landscape connectivity and the ecological process of different scales should be considered to determine the most suitable distance threshold for the case city.
5 Conclusion
In conclusion, high-intensity urban development has led to the isolation of built-up areas and natural ecological space. GI network planning–has been ignored at the boundary of built-up areas, and its scientific and rational nature has been questioned. The innovation of this study lies in identifying the scope of BGI and analyzing its landscape pattern characteristics using the GI network’s continuity, transition, and systematic characteristics at the boundary of urban built-up areas. Based on the landscape connectivity model, MSPA, and other methods, this method can effectively analyze the best landscape distance threshold of UGI and RGI and delimit the scope of BGI. Additionally, we analyzed and summarized the landscape pattern and structural characteristics of BGI space, providing reference and guidance for planners and decision-makers. By studying the European case cities, we proved that BGI is a vital in the GI network under the context of rapid urbanization.
Overall, a BGI with a landscape connection between UGI and RGI at the boundary of the urban built-up area was observed, and its scope was affected by the scale of the built-up area and the optimum distance threshold of UGI and RGI. Moreover, the BGI contained many small ecological patches and a small number of large ecological patches. Moreover, the proportion of large patches in the BGI area was high, and the total area of broken small patches was small. Additionally, large-scale ecological patches in BGI spaces performed major ecological functions. Patch distribution in BGI space can be divided into the surrounding, aggregation, and scattered patterns. The BGI of the surrounding pattern can improve the landscape connection between UGI and RGI and enable the migration and diffusion of organisms inside and outside the built-up area. The best landscape model of BGI was the surrounding pattern, followed by the aggregation pattern; however, the fragmentation of the scattered pattern was high. Lastly, The ecological core area in BGI is the main landscape type, followed by the marginal area. Therefore, BGI can promote the habitat and migration of organisms, maintain biodiversity and ensure ecological security, and is an important part of the NBS method in the context of rapid urbanization.
Data availability statement
The original contributions presented in the study are included in the article/supplementary material, further inquiries can be directed to the corresponding author.
Author contributions
JY Conceptualization, Methodology, Resources, Writing–original draft, Writing–review and editing. BW Methodology, Vali-dation, Investigation. XL Validation, Visualization, Resources. ML Writing–review and editing, Visualization. All authors contributed to the article and approved the submitted version.
Acknowledgments
Thanks to Institute of Planning of Landscape and Ecological. School of Architecture, Harbin Institute of Technology.
Conflict of interest
The authors declare that the research was conducted in the absence of any commercial or financial relationships that could be construed as a potential conflict of interest.
Publisher’s note
All claims expressed in this article are solely those of the authors and do not necessarily represent those of their affiliated organizations, or those of the publisher, the editors and the reviewers. Any product that may be evaluated in this article, or claim that may be made by its manufacturer, is not guaranteed or endorsed by the publisher.
Abbreviations
NBS, Naturally-Based Solution; BGI, Boundary Green Infrastructure; MSPA Morphological Spatial Pattern Analysis; UGI, Urban Green Infrastructure; RGI, Rregional Green Infrastructure; NL, Number of Links between patches; LC, Landscape omponent score.
References
Almenar, J., Bolowich, A., Elliot, T., Geneletti, D., and Rugani, B. (2019). Assessing habitat loss, fragmentation and ecological connectivity in Luxembourg to support spatial planning. Landsc. Urban Plan. 189, 335–351. doi:10.1016/j.landurbplan.2019.05.004
Baguette, M., Blanchet, S., Legrand, D., Stevens, V. M., and Turlure, C. (2013). Individual dispersal, landscape connectivity and ecological networks. Biol. Rev. 88 (2), 310–326. doi:10.1111/brv.12000
Baranyi, G., Saura, S., Podani, J., and Jordan, F. (2011). Contribution of habitat patches to network connectivity: Redundancy and uniqueness of topological indices. Ecol. Indic. 11 (5), 1301–1310. doi:10.1016/j.ecolind.2011.02.003
Bartesaghi Koc, C., Osmond, P., and Peters, A. (2017). Towards a comprehensive green infrastructure typology: A systematic review of approaches, methods and typologies. Urban Ecosyst. 20 (1), 15–35. doi:10.1007/s11252-016-0578-5
Bonnes, M., Mannetti, L., Secchiaroli, G., and Tanucci, G. (1990). The city as a multi-place system: An analysis of people—Urban environment transactions. J. Environ. Psychol. 10 (1), 37–65. doi:10.1016/s0272-4944(05)80023-4
Chengcheng, D., Min, Z., Xuechao, S., and Peng, P. (2021). Establishing multi-scale urban ecological network:hefei case. Planners 37 (03), 35–43. doi:10.3969/j.issn.1006-0022.2021.03.005
Cui, L., Wang, J., Sun, L., and Lv, C. (2020). Construction and optimization of green space ecological networks in urban fringe areas: A case study with the urban fringe area of tongzhou district in beijing. J. Clean. Prod. 276 (2), 124266. doi:10.1016/j.jclepro.2020.124266
Dong, J., Peng, J., Liu, Y., Qiu, S., and Han, Y. (2020). Integrating spatial continuous wavelet transform and kernel density estimation to identify ecological corridors in megacities. Landsc. Urban Plan. 199103815, 103815. doi:10.1016/j.landurbplan.2020.103815
Du, Z., Hongyuan, L., and Weiqing, M. (2019). Distance thresholds of wetland landscape connectivity in tianjin binhai new area. Acta Ecol. Sin. 39 (17), 6534–6544. doi:10.5846/stxb201804190897
Eggermont, H., Balian, E., Azevedo, J. M. N., Beumer, V., Brodin, T., Claudet, J., et al. (2015). Nature-based solutions: New influence for environmental management and research in europe. GAIA - Ecol. Perspect. Sci. Soc. 24, 243–248. doi:10.14512/gaia.24.4.9
Forman, R. T. T. (1995). Land mosaics: The ecology of the landscapes and regions. Proc. Sca 26, 201–208.
Gu, F., Huang, Y. X., Chen, C. M., Cheng, D. L., and Guo, J. L. (2017). Construction and optimization of ecological network for nature reserves in Fujian Province, China. Ying yong sheng tai xue bao = J. Appl. Ecol. 28 (3), 1013–1020. doi:10.13287/j.1001-9332.201703.022
He, H., Kun Yong, Y., Ya Ling, G., and Jian, L. (2019). Building green infrastructure network of fuzhou using MSPA. Chin. Landsc. Archit. 35 (11), 70–75.
Huang, X., Wang, H., Shan, L., and Xiao, F. (2021). Constructing and optimizing urban ecological network in the context of rapid urbanization for improving landscape connectivity. Ecol. Indic. 132, 108319. doi:10.1016/j.ecolind.2021.108319
Peng, J., Yang, Y., Liu, Y., Hu, Y., Du, Y., Meersmans, J., et al. (2018a), Linking ecosystem services and circuit theory to identify ecological security patterns, Sci. Total Environ. 644, 781–790. doi:10.1016/j.scitotenv.2018.06.292
Jeong, D., Min, K., Song, K., and Lee, J. (2020). Planning a green infrastructure network to integrate potential evacuation routes and the urban green space in a coastal city: The case study of haeundae district, busan, South Korea. Sci. Total Environ. 761 (5737), 143179. doi:10.1016/j.scitotenv.2020.143179
Jiang, H., Zhao, Y., Xu, D., and Dong, J. (2022). Zoning for ecosystem restoration based on ecological network in mountainous region. Ecol. Indic. 142, 109138. doi:10.1016/j.ecolind.2022.109138
Jiaxing, W., Yi, S., Yun Cai, W., and Wei Ning, X. (2019). Urban green infrastructure building for sustainability in areas of rapid urbanization based on evaluating spatial priority: A case study of pukou in China. Acta Ecol. Sin. 39 (4). doi:10.5846/stxb201808241802
Jie Yi, T., Ping, D., and Yu Qi, L. (2022). Spatial-temporal analysis and influencing factors of ecological resilience in yangtze river delta. Resour. Environ. Yangtze Basin 31 (09), 1975–1987.
Jinhua, L., Jiawei, Z., and Kun, J. (2021). Boundary identification and spatial pattern optimization of central urban areas based on POI data: taking Gaotang County for example. Urban Devel. Stud. 28(06), 74–83. doi:10.3969/j.issn.1006-3862.2021.06.018
Julien Carlier, J. M., and Moran, J. (2019). Landscape typology and ecological connectivity assessment to inform Greenway design. Sci. Total Environ. 651, 3241–3252. doi:10.1016/j.scitotenv.2018.10.077
Kabisch, N., Bosch, M. V. D., and Lafortezza, R. (2017). The health benefits of nature-based solutions to urbanization challenges for children and the elderly - a systematic review. Environ. Res. 159, 362–373. doi:10.1016/j.envres.2017.08.004
Kan, H., Tao, L., Jian Fang, W., Meng Fei, S., Lian, L., and Guo Chang, D. (2021). Construction of green infrastructure network based on spatial priority in downtown of Fuzhou, China. Chin. J. Appl. Ecol. 32 (04), 1424–1432.
Liang, C., Zeng, J., Zhang, R. C., and Wang, Q. W. (2022). Connecting urban area with rural hinterland: A stepwise ecological security network construction approach in the urban–rural fringe. Ecol. Indic. 138, 108794. doi:10.1016/j.ecolind.2022.108794
Liuyang, D., Zhanfeng, S., and Yingming, K. (2018). Built-up area extraction and urban expansion analysis based on remote sensing images. J. Geo-Information Sci. 20 (07), 996–1003. doi:10.12082/dqxxkx.2018.170571
Ma, K. M., Fu, B.-J., Li, X. Y., and Guan, W. B. (2004). The regional pattern for ecological security (RPES): the concept and theoretical. Acta Ecol. 24 (4), 761–768.
Mabon, L. (2019). Enhancing post-disaster resilience by 'building back greener': Evaluating the contribution of nature-based solutions to recovery planning in Futaba County, Fukushima Prefecture, Japan. Landsc. Urban Plan. 187, 187105–187118. doi:10.1016/j.landurbplan.2019.03.013
Mackinnon, K. (2008). Biodiversity, climate change, and adaptation: Nature-based solutions from the world bank portfolio. World Bank Other Operational Studies.
Manachini, B., Billeci, N., and Palla, F. (2013). Exotic insect pests: The impact of the Red Palm Weevil on natural and cultural heritage in Palermo (Italy). J. Cult. Herit. 14 (3), e177–e182. doi:10.1016/j.culher.2012.11.028
Mao Quan, W., Meng Meng, H., Tao, W., Chen, F., and Bei Cheng, X. (2019). Recognition of urban ecological source area based on ecological security pattern and multi-scale landscape connectivity. Acta Ecol. Sin. 39 (13), 4720–4731.
Meng, J. J., Xiao Dong, W., Nan Shan, Y., and Li Kai, Z. (2016). Dynamic changes of landscape connectivity for ecological lands and distance thresholds in the middle reaches of the Heihe River,Northwest China. Chin. J. Appl. Ecol. 27 (06), 1715–1726. doi:10.13287/j.1001-9332.201606.015
Modica, G., Praticò, S., Laudari, L., Ledda, A., Montis, A. D., and De Montis, A. (2021). Implementation of multispecies ecological networks at the regional scale: Analysis and multi-temporal assessment. J. Environ. Manag. 289 (4), 112494. doi:10.1016/j.jenvman.2021.112494
Montis, A. D., Ganciu, A., Cabras, M., Bardi, A., and Mulas, M. (2019). Resilient ecological networks: A comparative approach. Land Use Policy 89104207.
Mt, C. F. T. F., Jian, P., Xiao-Nan, G., Yi-Na, H., and Yan-Xu, L. (2017). Constructing ecological security patterns in mountain areas based on geological disaster sensitivity:A case study in Yuxi City,Yunnan Province,China. Chin. J. Appl. Ecol. 28 (02), 627–635. doi:10.13287/j.1001-9332.201702.013
Nadja, K., Niki, F., Stephan, P., Sandra, N., Mckenna, D., Martina, A., et al. (2016). Nature-based solutions to climate change mitigation and adaptation in urban areas: Perspectives on indicators, knowledge gaps, barriers, and opportunities for action. Ecol. Soc. 21 (2), art39. doi:10.5751/es-08373-210239
Nan-Nan, C., Shuai-Zhi, K., Yong-Hua, Z., Yu-Jie, Z., Jin, Y., and Ya-Ru, L. (2021). Construction of ecological network in Qinling Mountains of Shaanxi, China based on MSPA and MCR model. Chin. J. Appl. Ecol. 32 (05), 1545–1553.
Panagopoulos, T., Duque, J. A. G., and Dan, M. B. (2016). Urban planning with respect to environmental quality and human well-being. Environ. Pollut. 208, 137–144. doi:10.1016/j.envpol.2015.07.038
Peng, J., Pan, Y., Liu, Y., Zhao, H., and Wang, Y. (2018b). Linking ecological degradation risk to identify ecological security patterns in a rapidly urbanizing landscape. Habitat Int. 71, 110–124. doi:10.1016/j.habitatint.2017.11.010
Qinghe, Z., Lijiao, M., Qian, L., Shengyan, D., Xunling, L., Zihao, C., et al. (2017). Landscape connectivity and network construction of riparian vegetation in typical reach of the middle and lower reaches of Yellow River. Chin. J. Eco-Agriculture 25 (7), 10. doi:10.10.13930/j.cnki.cjea.161125
Soille, P., and Vogt, P. (2009). Morphological segmentation of binary patterns. Pattern Recognit. Lett. 30 (4), 456–459. doi:10.1016/j.patrec.2008.10.015
Song, K., You, S., and Chon, J. (2018). Simulation modeling for a resilience improvement plan for natural disasters in a coastal area. Environ. Pollut. 242, 1970–1980. doi:10.1016/j.envpol.2018.07.057
Su, L., and Haonan, L. (2022). Spatio-temporal pattern evolution of coupling coordination between urbanization and ecological resilience in arid region:A case of Ningxia Hui Autonomous Region. Arid. Land Geogr. 45 (04), 1281–1290.
Tanner, E. P., and Fuhlendorf, S. D. (2018). Impact of an agri-environmental scheme on landscape patterns. Ecological Indicators 85, 956–965. doi:10.1016/j.ecolind.2017.11.043
Tang Xiaolan, D. Y. (2011). Study on ecological management and building of green infrastructure in arid area——a case study in the lower reaches of the tarim river. Arid Zone Res. 28 (03), 413–420.
Tzoulas, K., Korpela, K., Venn, S., Yli-Pelkonen, V. J., Kazmierczak, A., Niemela, J., et al. (2007). Promoting ecosystem and human health in urban areas using green infrastructure: A literature review. Netherlands: Elsevier.
Urban, D. K., and Keitt, T. (2001). Landscape connectivity: A graph-theoretic perspective. Ecology 82 (5), 1205–1218. doi:10.1890/0012-9658(2001)082[1205:lcagtp]2.0.co;2
Wang, J., Xu, C., Pauleit, S., Kindler, A., and Banzhaf, E. (2019). Spatial patterns of urban green infrastructure for equity: A novel exploration. J. Clean. Prod. 238117858, 117858. doi:10.1016/j.jclepro.2019.117858
Wimberly, M. C., Narem, D. M., Bauman, P. J., Carlson, B. T., and Ahlering, M. A. (2018). Grassland connectivity in fragmented agricultural landscapes of the north-central United States. Biol. Conserv. 217, 121–130. doi:10.1016/j.biocon.2017.10.031
Xiao Ran, L., Yang Bing, L., Yong Yan, W., and Jin Gan, S. (2015). Identification of ecological security patterns for county-level landscapes and function division of the three gorges reservoir area: A case in fengjie. Chin. J. Ecol. 34 (07), 1959–1967.
Xiaolin, Z., Xiaobin, J., Bo, H., Rui, S., Xinyuan, L., Hanbing, L., et al. (2021). Identification and optimization of ecological network in the plain area of the lower yangtze river: A case study of jintan district, changzhou. Acta Ecol. Sin. 41 (09), 3449–3461.
Xindi Zhang, X. W. C. Z., Wang, X., Zhang, C., and Zhai, J. (2022). Development of a cross-scale landscape infrastructure network guided by the new jiangnan watertown urbanism: a case study of the ecological green integration demonstration zone in the yangtze river delta, China. Ecol. Indic. 143, 109317. doi:10.1016/j.ecolind.2022.109317
Ya-Ping, Y. U., Yin, H. W., Kong, F. H., Wang, J. J., and Wen-Bin, X. U. (2016). Analysis of the temporal and spatial pattern of the green infrastructure network in Nanjing, based on MSPA. Chinese Journal of Ecology. doi:10.13292/j.1(X)0-4890.201606.026
Yong Zheng, W., Jiu Lin, L., Kang Kang, G., and Lin, L. (2022). Optimization of urban green infrastructure network layout based on MSPA-CIRCUIT: Case of Hefei. Acta Ecol. Sin. 42 (05), 2022–2032.
Zhang, Q., and Lu, X. (2009). Delimitating central areas of cities based on road density: A case study of guangzhou city. Proc. SPIE - Int. Soc. Opt. Eng. 7146.
Keywords: green infrastructure, BGI, boundary green infrastructure, urban development, ecological resilience, biodiversity
Citation: Yuan J, Wu B, Liu X and Lu M (2023) Boundary green infrastructure: a green infrastructure connecting natural and artificial spaces. Front. Environ. Sci. 11:1155036. doi: 10.3389/fenvs.2023.1155036
Received: 31 January 2023; Accepted: 15 August 2023;
Published: 14 September 2023.
Edited by:
Zhaowu Yu, Fudan University, ChinaReviewed by:
Guoping Huang, University of Southern California, United StatesYuncai Wang, Tongji University, China
Copyright © 2023 Yuan, Wu, Liu and Lu. This is an open-access article distributed under the terms of the Creative Commons Attribution License (CC BY). The use, distribution or reproduction in other forums is permitted, provided the original author(s) and the copyright owner(s) are credited and that the original publication in this journal is cited, in accordance with accepted academic practice. No use, distribution or reproduction is permitted which does not comply with these terms.
*Correspondence: Bing Wu, d3ViaW5nQGhpdC5lZHUuY24=
 Jingyuan Yuan
 Bing Wu
 Xiaoguang Liu2