 Ruosha Zeng
 Chris M. Mannaerts1
95% of researchers rate our articles as excellent or good
Learn more about the work of our research integrity team to safeguard the quality of each article we publish.
Find out more
ORIGINAL RESEARCH article
Front. Environ. Sci. , 20 April 2023
Sec. Environmental Informatics and Remote Sensing
Volume 11 - 2023 | https://doi.org/10.3389/fenvs.2023.1152536
This article is part of the Research Topic Advances of Spectroscopy and Artificial Intelligence in Environmental Monitoring and Remote Sensing View all 6 articles
Several ultraviolet-visible (UV-VIS) spectral analysis methods have been used to quantify the absorption properties of chromophoric or colored dissolved organic matter (CDOM). Different spectroscopic parameters can be used as surrogates of optical properties; furthermore, advanced mathematical tools have also been applied to investigate the absorption spectrum. This study evaluated the most commonly used spectroscopic parameters in remote sensing research and advanced mathematical methods using absorption data on primary biomass constituents (BCs) in aqueous states. We found that, out of the eight spectrometric parameters, the spectral slope in the 275–295 nm range (S275–295) had the strongest correlation with the hydrogen to carbon ratio (H/C), and the spectral slope ratio (275–295 to 350–400 nm) SR and the absorbance ratio between 465 and 665 nm (E4/E6) had a strong correlation with the oxygen to carbon ratio (O/C). Additionally, the spectroscopic parameter values for the solutions of the BCs exhibited distinguishable differences. Gaussian fitting was suitable for single CDOM components but not for complex mixtures. Derivative analysis can be used for single-component discrimination with an extensive investigation of the absorption properties of this component. Additionally, we propose a possible bottom-up perspective to track the origins of CDOM through the absorption spectrum.
Chromophoric or colored dissolved organic matter (CDOM, also known as gelbstoff or yellow substances) is optically active organic matter that is ubiquitous in natural waters. Most CDOM in aquatic systems originates from the decomposition of plant material, whether terrestrial or aquatic vegetation (Sulzberger and Durisch-Kaiser, 2009). The fundamental organic materials in plants are cellulose and lignin: their proportions vary by plant type (Novaes et al., 2010; Schadel et al., 2010; Basu, 2018). CDOM plays an essential role in the carbon dynamics of aquatic systems and strongly interacts with penetrating sunlight, which can subsequently have more general effects on the climate and environment (Carlson and Hansell, 2015). Therefore, investigating and characterizing the optical properties and environmental behavior of CDOM is necessary. One of the most commonly used methods for characterizing the optical properties of CDOM is ultraviolet-visible (UV-VIS) spectrometry.
Spectral data from UV-VIS spectrometers have been applied in various disciplines (e.g., analytical chemistry and oceanography) using different analytical methods, such as a single absorption coefficient or ratios of two absorption bands, exponential fitting, Gaussian fitting, and derivative analysis. Single absorption coefficients and absorption ratios are facile and commonly used to obtain quantitative information on a known water constituent to indicate aromaticity, molecular weight (MW), and the source of the CDOM (Chen et al., 1977; De Haan and De Boer, 1987; Summers et al., 1987; Peuravuori and Pihlaja, 1997; Weishaar et al., 2003). Spectral slopes derived from the exponential fitting of different wavelength intervals have typically been used to describe CDOM absorption (Loiselle et al., 2009), track MW changes, and indicate the source of the CDOM (Helms et al., 2008). However, using these simple methods or an exponential fit alone cannot differentiate multiple components in water because different components may have absorption signals at the same wavelengths. Moreover, owing to the interactions among various components, the spectroscopic parameters derived from these simple methods are inaccurate in complex water bodies. Other advanced mathematical tools, such as Gaussian fitting (Schwarz et al., 2002; Massicotte and Markager, 2016), derivative analysis (Aguirre-Gomez et al., 1995; Torrecilla et al., 2009), the differential spectrum (Yan et al., 2013), and two-dimensional correlation spectroscopy (2D-COS) analysis (Noda et al., 2000; Hur et al., 2011; Guo et al., 2019), can improve the sensitivity or maximize the absorption properties; however, these methods remain under development. Furthermore, a priori knowledge of the presented component is usually required to use these advanced methods to quantify chemical components.
Information on the CDOM spectroscopic properties and characterization is required to better understand complex waters, i.e., case II water bodies (IOCCG, 2000), such as riverine, estuarine, and coastal waters, as well as to obtain source information from absorption data with reasonable confidence. This study investigated the optical UV-VIS properties of primary biomass constituents (BCs) in aqueous states. Subsequently, combined with elementary analysis, we evaluated the commonly used spectroscopic parameters derived from the absorption spectrum and examined two advanced mathematical tools: derivative analysis and Gaussian decomposition. Finally, we explored these complementary methods and discussed their future applications in tracing the origin of CDOM. We suggest that this information on the UV-VIS absorption of the 3 BCs can be used as a reference for deciphering the chemical and optical properties of natural CDOM in future studies. This study derived widely used spectroscopic parameters for characterizing CDOM in water chemistry analysis and remote sensing using absorption spectroscopy. Moreover, to track the origins of CDOM in the absorption spectrum, we proposed a possible bottom-up procedure.
Aquatic solutions were prepared using commercial BCs. We selected three types of BCs (cellulose, lignin, and humic acid) to examine the absorption properties of different organic sources of CDOM and their elementary chemical properties. Cellulose and lignin are essential components of plant cells. Humic acid is ubiquitous in terrestrial and aquatic environments.
The commercial BCs were i) cellulose (Sigma-Aldrich C6288, fibers), ii) lignin (Sigma-Aldrich 370959), and iii) humic acid (Sigma-Aldrich 53680, technical). The molecular weight was humic acid > lignin > cellulose. The Supplementary Information shows their molecular structures (Supplementary Figure S1). Each BC was obtained as duplicate 0.1 wt% solutions and continuously stirred at 300 rpm for 1 hour. We prepared six three-component (cellulose/lignin/humic acid) mixtures combined in different proportions (mixture 1 to 6, listed in Supplementary Table S1). In the mixed solution, the weight proportion of the total solids was the same as that of a single BC solution (0.1 wt%).
In operation, we defined the dissolved organic matter (DOM) as the organic matter that could pass through a filter (0.2–0.4 µm) (Sulzberger and Durisch-Kaiser, 2009; Nelson and Siegel, 2013). Therefore, the liquid solution was filtered with a 0.2 μm GF/C glass fiber filter (Whatman™) before measuring its absorption spectrum in our experiments. A blank control group was operated by filtering ultra-pure water (18 MΩ cm, MilliQ) with the same glass fiber filter using the same procedure.
A Shimadzu TOC-L analyzer was used for the determination of both inorganic and total carbon. All filtered liquid samples were analyzed using a Shimadzu TOC-L CPH analyzer at the end of the batch experiment. The water samples were combusted at 680°C. The total organic carbon (TOC) was calculated by subtracting the inorganic carbon (IC) from the total carbon (TC). The TOC standard stock solutions (1,000 mg/L) were prepared by dissolving 0.8833 g of sodium carbonate (for IC, Nacalai Tesque, Inc.) and 0.2127 g of potassium hydrogen phthalate (for OC, Nacalai Tesque, Inc.) in 100 mL of ultra-pure water. Two calibration lines (0–10 mg/L, 0–100 mg/L) for both TC and IC were measured before each run. Ultra-pure water was used as a blank control for calibration.
To determine the weight percentage of carbon, hydrogen, and nitrogen in the commercial BCs, we used a CHN analyzer (Perkin Elmer 2400 Series II) and a thermogravimetric analysis (TGA, Perkin Elmer TGA 8000). For the TGA analysis, we used a program that involved pyrolysis in a nitrogen atmosphere (40 mL/min), starting at 50°C and heating at a rate of 35°C/min to 900°C, where the temperature was held for ten minutes. We loaded approximately 5 mg of each sample into a crucible and flushed it with a continuous carrier gas flow (60 mL/min). After pyrolysis, the temperature was set to 650°C, and the gas carrier switched to air (40 mL/min) to burn out the organic matter resulting in the ash content.
To express the constituent elements of carbon (C), hydrogen (H), nitrogen (N), oxygen (O), and sulfur (S) on a dry-ash-free (daf) basis, we divided the measured amounts by the total mass to eliminate the moisture and ash which were quantified through TGA (Basu, 2018). We calculated the element percentage on a “daf” basis using Eq. 1 (taking carbon as an example):
To calculate the oxygen content (wt%), we subtracted C, H, N, and S (wt%) from 100 wt% as follows:
The S content was determined via ICP-OES (Perkin Elmer 8300DV).
Prior to ICP-OES analysis, the commercial BCs were digested. For each sample, 100 mg was weigthed in a small beaker covered with a watch glass. Next, HNO3 (2 mL, 69%, Suprapur, Merck) was added repeatedly and heated to 175°C–185°C for digestion until a clear solution was obtained. After digestion, ultra-pure water was added to dissolve the yellowish residue (Lievens et al., 2008; Lievens et al., 2009). The obtained solutions were analyzed for sulfur concentration using ICP-OES after calibration with dilutions of 10,000 mg/L S ICP-MS standards (Merck).
The absorption spectra of the samples were measured using a quartz cuvette (path length of 1 cm) on a UV-VIS spectrophotometer (VWR, UV-6300PC) using an ultra-pure water solution as a reference. All the samples were measured after filtration. Two samples composed of humic acid and six samples of mixed components were diluted 10 times after filtration to fit the detection limits of the spectrometer.
Previous studies have extensively discussed the definition of absorbance and the absorption coefficient (Hu et al., 2002). The following equation was used to convert the absorbance into the absorption coefficient (m–1):
where
The details of the spectroscopic analysis methods are discussed below.
Absorption at 254 nm after normalization to the DOM concentration is referred to as the specific absorption coefficient at 254 nm (SUVA254). Another commonly used parameter, the absorption ratio, which is the ratio of absorbance at two wavelengths, can be correlated with the molecular weight (MW), aromaticity, and source of the CDOM. In this study, E2/E3 was the absorbance quotient at 250 and 365 nm, where E2/E4 denotes the absorbance ratio at 254 and 436 nm. E4/E6 is the absorbance ratio at 465 and 665 nm. We selected E2/E3, E2/E4, and E4/E6 for comparison.
Previous studies have found that the absorption curve of the CDOM can be fitted by an exponential equation (Jerlov, 1968; Maul and Gordon, 1975; Bricaud et al., 1981). Bricaud et al. (1981) introduced the “mean slope” by fitting the absorption coefficients with an exponential method using least-square linear regression. Based on previous studies (Twardowski et al., 2004; Helms et al., 2008), the slope values (S) derived from exponential fitting differ from the chosen wavelength range. When a spectral interval of 20 nm is selected, the slope has the smallest residual (Loiselle et al., 2009).
Following the fitting routine described by Helms et al. (2008), we calculated the spectral slopes for three comparable wavelength ranges (275–300 nm, 350–400 nm, and the visible range of 300–700 nm) by fitting the absorption coefficient to the following equation:
where
The earlier application of Gaussian methods to absorption spectra focused on chlorophyll and other algae pigments (Zucchelli et al., 1994; Küpper et al., 2000; Bricaud, 2004; Küpper et al., 2007). A similar approach was later applied to CDOM (Massicotte and Markager, 2016). As illustrated in Massicotte and Markager (2016), a baseline exponential method for the entire spectrum was first calculated. Then, the residuals and differential absorbance data were fitted to a Gaussian function (Yan et al., 2013). We used the ASFit software, which was developed for absorption spectra fitting (Omanović et al., 2019), for Gaussian fitting. The modeling method used in this study was proposed by Massicotte and Markager (2016) and can be expressed using Eq. 6:
where i denote a particular Gaussian component, n is the number of identified Gaussian curve,
Derivative analysis is sensitive to noise in the spectrum. Therefore, we carefully smoothed the spectrum and selected the derivative parameters (Ohaver and Begley, 1981; Torrecilla et al., 2009). We calculated the higher-order derivatives using consecutive smoothing and first derivative calculations instead of directly calculating the higher-order derivatives in one step, following the method of Hur et al. (2006). First, the absorbance data were normalized to the DOC concentration. Then, to calculate the first-through fourth-order derivative spectra, the DOC-normalized absorbance was consecutively smoothed with a Savitzky-Golay filter (Savitzky and Golay, 1964) and applied with a first-derivative calculation using Origin 8.5 (Microcal Software, Inc.).
Absorption spectra have been widely used in analytical chemistry and remote sensing. Table 1 summarizes information on UV-VIS spectrum analysis methods from different user communities. We compared different analytical methods and spectroscopic parameters derived from absorption data and connected the spectral information with the elementary chemical characterization.
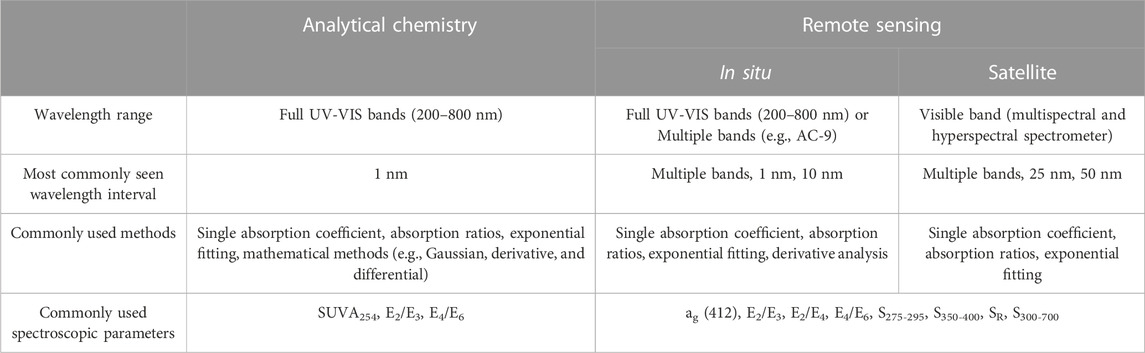
TABLE 1. Information content of UV-VIS spectroscopic methods for different user communities.
To compare the absorption properties of the chemical components, instead of the relationship between the absorption signal and concentration, we used a specific absorption coefficient, which is a DOC-independent spectrum. The concentration was expressed as carbon (DOC, mg·C/L), as measured by the TOC analyzer, and is listed in Supplementary Table S1. Figure 1 shows the specific absorption coefficient spectra of the dissolved BC and mixture solutions in the full UV-VIS range (250–700 nm). The visible range (350–700 nm), which is more extensively utilized in the remote sensing domain, was emphasized in the light yellow area. All of the spectra deducted the blank spectrum; all results followed this pattern.
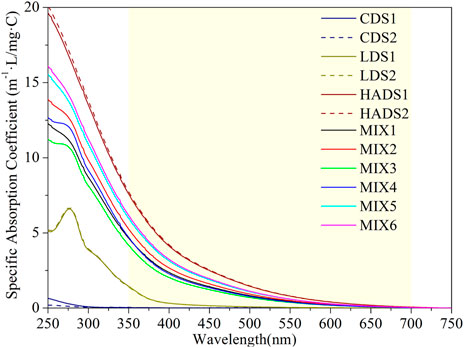
FIGURE 1. Specific absorption coefficient spectra for sample solutions (duplicate in dash line) in range 250–750 nm. The light yellow area emphasized the visible range from 350 to 700 nm.
Figure 1 shows that the specific absorption spectra of the cellulose-dissolved solution (CDS) samples were near zero. Their maximum was located in the strong UV-B band at 250 nm and was almost zero after 300 nm. For the spectra of the lignin-dissolved solution (LDS), we identified a maximum at approximately 276 nm and a shoulder after 300 nm. The last spectra last in the visible blue wavelength reached up to 450 nm. There was no clear peak for the spectra of the humic acid dissolved solution (HADS), but a long exponential-shaped curve after the maximum at 250 nm; the spectra decreased to a minimum after 650 nm. Mixture solutions showed a spectrum between the LDS and HADS, but all had an exponential shape after 300 nm.
Based on the single-component solution spectra in Figure 3, we note that the edge of absorption shifted to the right (as the color of water became darker when viewed by the human eye) while the MW increased (see Section 2.1 for the MW order). This phenomenon can be explained using a hypothesis based on the energy band theory (Kumada, 1987). During the humification and carbonization of organic matter, the valence electron band and conduction band gradually approach each other. The absorption edge then shifts to the infrared region, resulting in a color change from yellow to dark brown and even black. This process is also referred to as the darkening of humic substances.
Absorbance at 254 nm was used as a surrogate parameter for DOC in humic substances (Summers et al., 1987). Table 2 presents the absorption properties at 254 nm for the three investigated BCs. The aromaticity of our sample followed humic acid > lignin > cellulose, corresponding to their chemical structures.
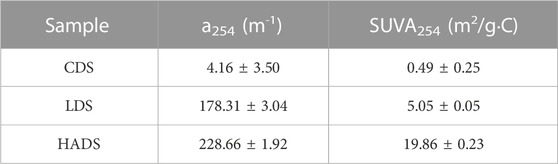
TABLE 2. DOM absorption properties at 254 nm.
Absorbance ratios of aqueous CDOM solutions are widely used in remote sensing research, and Li and Hur (2017) have summarized different ratios as spectroscopic parameters for characterizing and identifying the sources of DOM. Table 3 presents the spectroscopic ratio results and their standard deviations (SD) derived from the absorbance of duplicate dissolved solution samples. However, as the CDS hardly dissolves in water, the absorption signal of CDS was close to the detection limit, resulting in a significant standard deviation for CDS. Therefore, the results for CDS were considered unreliable. In comparison, Lignin, which has a simple structure, low aromaticity, and low molecular weight, had higher E2/E3, E2/E4, and E4/E6 values than those of humic acid.
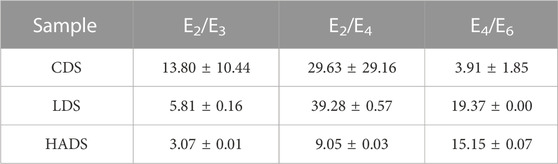
TABLE 3. Ratios calculated from absorbance data.
Figure 2 shows the exponential fitting for CDS, LDS, and HADS in the band range from 300 to 700 nm (blank-excluded). CDOM usually has a stronger absorption signal in the ultra-violet and near-UV bands (<380 nm). The LDS and HADS samples clearly exhibited this phenomenon. Table 4 presents the slope values and their standard deviations calculated from the UV-VIS (300–700 nm) spectra. The CDS samples had the highest S value, with a band range of 275–295 nm. Among the 3 BCs, slope S275–295 decreased with an increasing MW. LDS and HADS had the highest S, with a band range of 350–400 nm. However, the S values of the LDS in the different bands showed more variation. This could be because LDS had a clear peak from 250 to 300 nm, instead of a smooth exponential curve such as that of HADS, as shown in Figure 1.
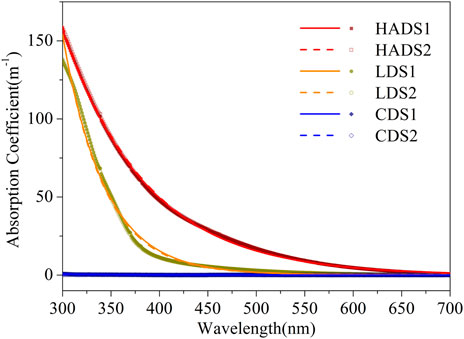
FIGURE 2. Absorption coefficient spectra (dots) and corresponding exponential fit (lines).
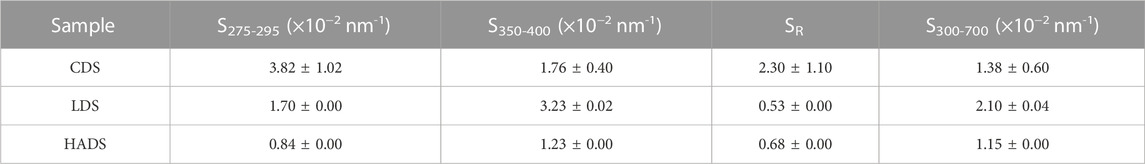
TABLE 4. Slopes derived from absorption spectra.
Table 5 lists the average values of the weight percentage of the elements and the ratio of hydrogen to carbon (H/C) and oxygen to carbon (O/C). The order of the H/C values from high to low was cellulose > lignin > humic acid; the order of the O/C values was cellulose > humic acid > lignin. Consistent with the molecular structure described in Section 2.1, cellulose had the highest H/C ratio; neither N nor S was present.
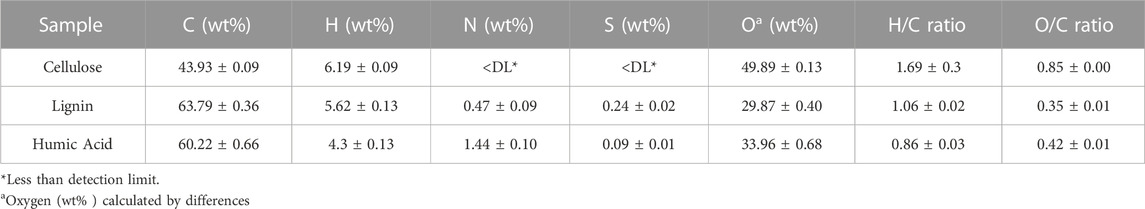
TABLE 5. Elementary analysis of commercial BCs sample at a dry ash-free basis (duplicate sample on average value).
To investigate the relationship between spectroscopic parameters and chemical compounds of the three BCs, we performed a simple linear regression for the elementary ratios and spectroscopic parameters derived from the methods mentioned above. As shown in Table 6, SUVA254 had a strongly negative correlation with the H/C ratio, while S275–295 and E2/E3 had a strong positive correlation with the H/C ratio. Additionally, E4/E6 and SR strongly correlated with the O/C ratio, and all correlations were significant at the 0.01 level. However, there was no clear relationship between S300—700 and the H/C ratio (correlation coefficient = 0).
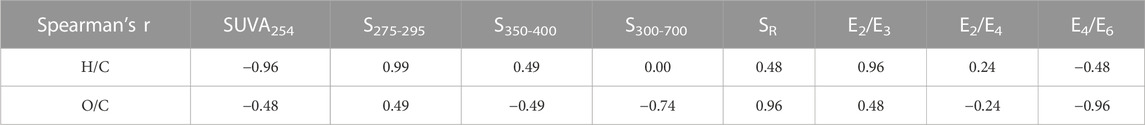
TABLE 6. Correlation coefficients for the elementary ratios (H/C and O/C ratios) and spectroscopic parameters derived from the aforementioned methods.
We input the LDS and HADS absorption coefficients into a Gaussian equation using two options in the ASFit software. The first is a Gaussian fit without an exponential curve (Gaussian-only fitting) and the second is a Gaussian with an exponential fit (Gaussian-exponential combining method). For both fitting models, we used the optimized option of the Gaussian peak number in the ASFit software to determine the number of Gaussian peaks. Supplementary Figures S2–S5 shows the optimization results. For CDS, the exponential fitting was sufficient. Therefore, the Gaussian method was not required for the CDS spectra.
Figures 3, 4 present the Gaussian curve fitting of the LDS and HADS absorption coefficient curves, which only use Gaussian equations. With the optimized Gaussian peak number, the LDS curves were decomposed into four Gaussian peaks (located at approximately 272, 318, 341, and 368 nm). The HADS curves were decomposed into two Gaussian peaks (located at approximately 215 and 327 nm). Supplementary Table S2 presents the details of the Gaussian fits. Supplementary Figures S2, S3 show the residuals and their root mean square errors (RMSE) between the fitting curve and the original curve.
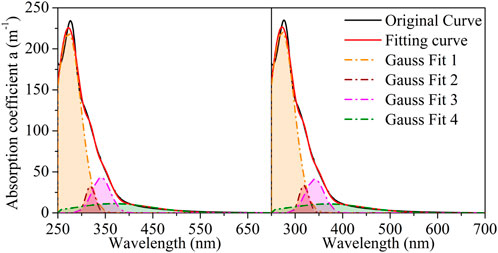
FIGURE 3. Gaussian-only fitting for lignin-dissolved solution (LDS1 and LSD2 denote to the duplicated samples, LDS1 on the left and LDS2 on the right).
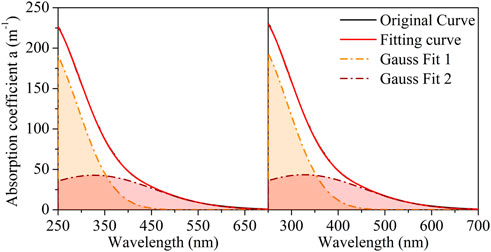
FIGURE 4. Gaussian-only fitting for humic acid-dissolved solution (HADS1 and HAD2 denote to the duplicated samples, HADS1 on the left and HADS2 on the right).
As shown in Figure 5, the absorption spectrum of LDS was decomposed into one exponential curve and two Gaussian curves (located at approximately 271 and 342 nm). For the slope calculated from the fitted exponential curve (SGauss), the average SGauss of the LDS was 0.42 × 10⁻² nm–1, with a standard deviation of 0.00 × 10⁻² nm–1. In Figure 6, the absorption spectrum of HADS was separated into one exponential curve and four Gaussian curves (located at approximately 241, 332, 376, and 440 nm). The average SGauss of the HADS was 0.44 × 10⁻² nm–1, with a standard deviation of 0.00 × 10⁻² nm–1. Table SI3 presents the details of the Gaussian fit. Supplementary Figures S4, S5 show the residuals and their root mean square errors (RMSE) between the fitting curve and original curve.
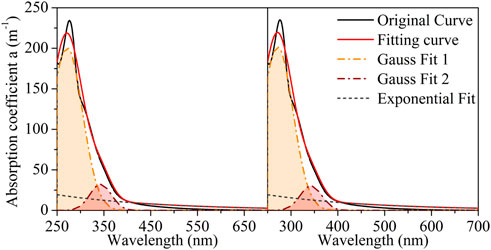
FIGURE 5. Gaussian-exponential combining method fitting for lignin-dissolved solution (LDS1 and LSD2 denote to the duplicated samples, LDS1 on the left and LDS2 on the right).
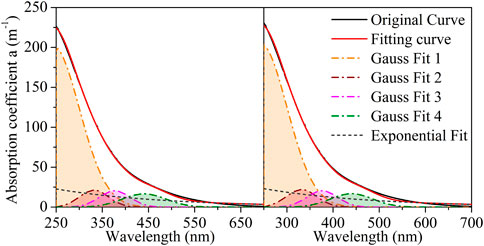
FIGURE 6. Gaussian-exponential combining method fitting for humic acid-dissolved solution (HADS1 and HAD2 denote to the duplicated samples, HADS1 on the left and HADS2 on the right).
The first derivative can eliminate the linear background-like baseline shifts (Talsky et al., 1978). Second- and higher-order derivatives were used to determine the multiple components in the samples (Torrecilla et al., 2009). Fourth-derivative analysis is the most commonly used method for recognizing the inflection of a spectrum (Aguirre-Gomez et al., 1995; Cieslewicz and Gonet, 2004). First, the extremes of the fundamental spectrum are most easily recognized in even-numbered (2n) derivatives. Then, when a unipolar fundamental curve is converted to bipolar maxima and minima, the optimum conditions are generally reached (Talsky et al., 1978). To distinguish different components in a multicomponent sample, we must first acquire the absorption properties of a single BC component. Figure 7 shows the first to fourth derivations of the absorbance curve of the single BC component. The acquired absorbance data were divided into DOC concentrations before calculating the derivatives, indicating that it is a specific property of a single constituent independent of concentration. Figure 8 shows the derivative analysis of the six mixture samples. Supplementary Table S1 lists the proportions of their components. Supplementary Table S4 lists the peak position of the 3rd and 4th derivative curves.
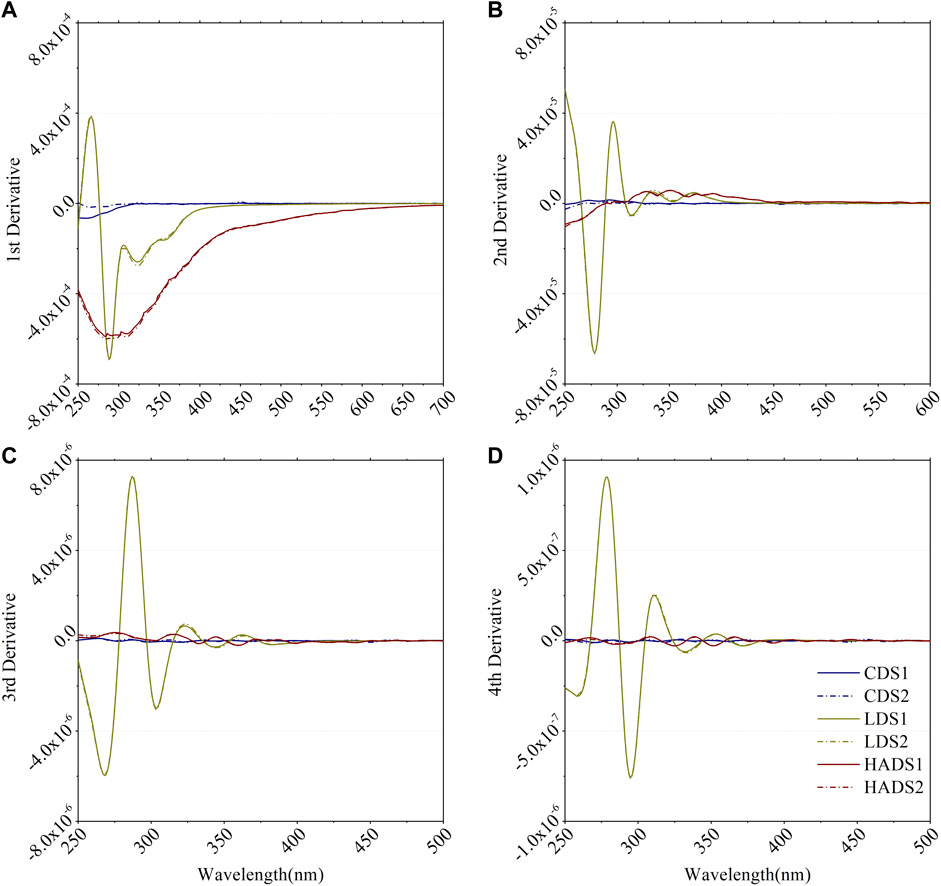
FIGURE 7. (A) 1st derivative, (B) 2nd derivative, (C) 3rd derivative and (D) 4th derivative of smoothed specific absorbance spectra for blank and single component BCs in duplicate. CDS, LDS and HADS are cellulose-dissolved solution, lignin-dissolved solution and humic acid-dissolved solution respectively. 1 and 2 denote to the duplicated samples.
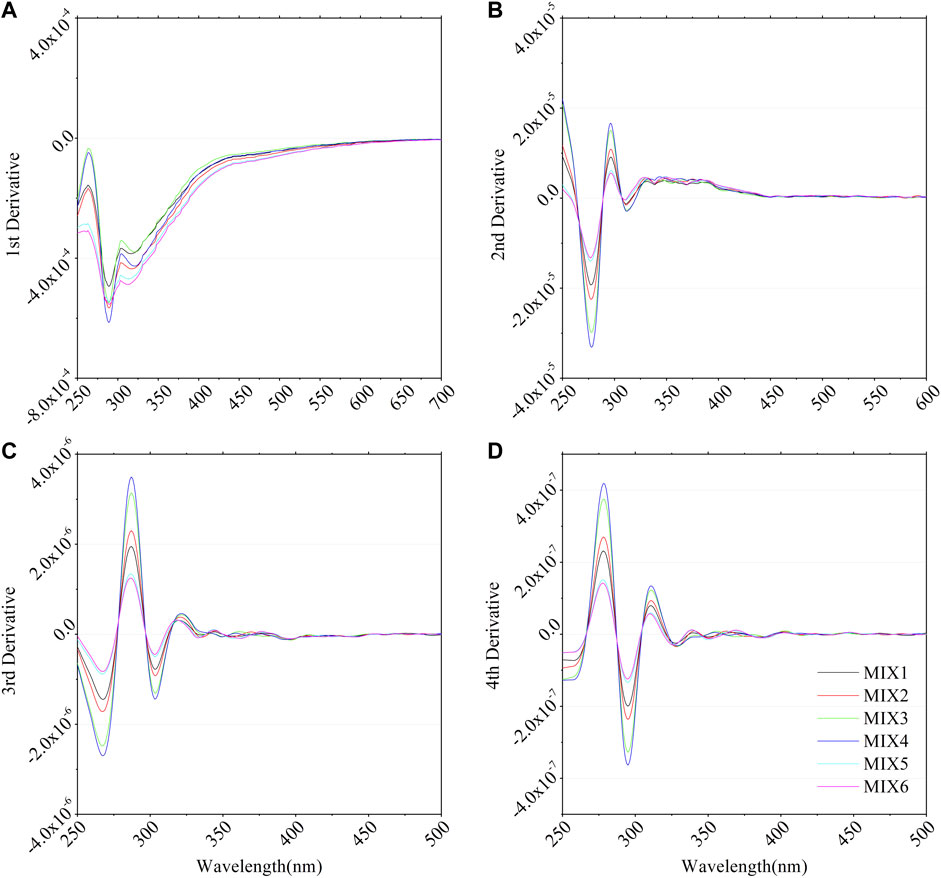
FIGURE 8. (A) 1st derivative, (B) 2nd derivative, (C) 3rd derivative and (D) 4th derivative of smoothed absorbance spectra for mixed BCs samples. MIX 1 to 6 denote to the mixture samples. The proportions of their component (cellulose/lignin/humic acid) are listed in Supplementary Table S1.
As shown in Figure 7, the CDS absorbance was close to zero. HADS had a clear signal and a long tail at a longer wavelength (>400 nm) in the first derivative curve. However, from the second derivative, the signal became relatively small compared with the first derivative curve. It also showed a trough at approximately 260 nm and a broad peak from 300 to 450 nm. The LDS curve had the strongest signal and several peaks and troughs in all of the deviation curves. LDS only had a positive signal at the first deviation.
Figure 8 shows the derivative results for the mixture samples. The lignin domains in these curves (the first two peak positions on the left are the same as those in the lignin derivative curves). However, we still observed a long tail in the first deviation and a weak peak in the second deviation, which corresponds to the absorption properties of HADS. Among these six samples, mixtures 1 (MIX1) and 2 (MIX2) had the lowest signal, but no apparent differences from the others. Mixtures 3 (MIX3) and 4 (MIX4) had the most prominent peaks and troughs and contained more lignin (Supplementary Table S1). Mixtures 5 (MIX5) and 6 (MIX6) had the most significant signal in the first derivative and showed a higher signal in the long-tail and weak peaks, which are properties of HADS; they contained higher acid. As cellulose had a negligible signal, the peak positions shifted minimally in mixtures 1 and 2 from Supplementary Table S4. The third and fourth peaks of mixtures 5 and 6 were dominated by the main component, which was humic acid.
Spectroscopic parameters are easily used and have historical precedence. As listed in Table 2, the specific absorption coefficients, especially SUVA254, had a strong linear correlation with the aromaticity of CDOM (Weishaar et al., 2003; Hur et al., 2006). However, DOC data were required to calculate the SUVA. DOC data can be difficult to acquire at a remote sensing (RS) scale. Therefore, remote sensing studies typically use ratios and slopes to express the absorption properties because they are independent of the DOC concentration.
The results of the ratios in Table 3 corresponded with previous studies that stated that E2/E3 and E4/E6 are negatively correlated with aromaticity and MW. E2/E3 decreased with an increasing MW because high MW had stronger light absorption at longer wavelengths (De Haan and De Boer, 1987; Peuravuori and Pihlaja, 1997). E4/E6 had an inverse correlation with CDOM aromaticity (Summers et al., 1987; Chin et al., 1994). Moreover, E4/E6 has been extensively examined (Chen et al., 1977) and does not use an ultraviolet (UV) band signal. Therefore, E4/E6 is more suitable for RS.
As different types of biomass sources lead to slope differences, slope has been used to trace the source of CDOM over a wide range using remote sensing data (Helms et al., 2008; Loiselle et al., 2009). The average slope value of the ocean is 0.014 ± 0.001 nm–1. In this study, the S300–700 CDS (0.0138 nm–1) was similar to the average value of the open ocean. The S300–700 of the LDS was 0.021 nm–1, which was significantly higher than the average slope. This was smaller than the average slope for HADS (0.0115 nm−1). The S275–295 values of CDS, LDS, and HADS were 0.0382, 0.017, and 0.0084 nm–1, respectively, which follow observations from a previous study (Helms et al., 2008). DOM showed specific absorption characteristics in the UV band, especially at 254 nm. Thus, S275–295 is preferred if the absorption data in the UV bands are available.
The Gaussian-only method is more suitable for obtaining preliminary knowledge of the absorption characteristics of a single component. The residual RMSE (Supplementary Figures S2–S5) calculated using the Gaussian-only method (Figures 3, 4) was slightly lower than that calculated using the Gaussian-exponential combining method (Figures 5, 6). This may have been because the Gaussian was better than the exponential fit for pure component solutions. After characterizing the Gaussian peaks, the same conditions for the Gaussian methods should be applied with or without using the ASFit software to obtain comparable results. During the Gaussian fitting of the absorption spectrum for the DOM, the results varied with the pre-set Gaussian fitting conditions. In this study, multiple parameters for optimizing the curve-fitting results were adjusted using the ASFit software. The exponential curve was adapted to the number and shape of the Gaussian curves selected in the software. Therefore, the slopes (SGauss) were significantly smaller than those commonly measured. To report the results in a comparable manner, we suggest creating a standardized mathematical or operational Gaussian fitting process and a preliminary analysis of known components.
Derivative analysis has been used to determine organic and inorganic components in analytical chemistry (Talsky et al., 1978). It is also used to enhance subtle spectral features and improve the sensitivity of absorbance spectra (Li and Hur, 2017; Chen and Yu, 2021). This permits the analysis of a spectrum with low spectral resolution, such as multispectral or hyperspectral remote sensing data (Torrecilla et al., 2009). We report the derivative curve details for dissolved cellulose, lignin, and humic acid in Figure 7. Based on this priori knowledge, we could distinguish the spectrum properties of LDS and HADS, but not CDS (Figure 8 and Supplementary Table S4). As the absorption signal of CDS is too low, it cannot discriminate cellulose from the other components.
In addition to applying only one mathematical tool, advanced mathematical methods can be used by combining two or more methods. For instance, the third derivative has been used as a tool to determine the peak number and position of the Gaussian fit (Omanović et al., 2019). Moreover, after Gaussian fitting combined with the differential spectrum, the derived slopes were used to track the metal-binding affinity (Yan et al., 2013). The combination of different mathematical methods for analyzing absorption data remains under investigation. Furthermore, by combining advanced mathematical methods with other analytical instruments, researchers can investigate the optical properties of functional groups and understand the environmental behavior of CDOM. However, these methods usually require a priori knowledge of the components presented, such that it is more challenging to couple them with remote sensing.
Developing a CDOM retrieval model from spectral reflectance data is more difficult than developing a pigment-retrieval model for four reasons. First, CDOM had a small scattering signal. Second, the CDOM absorption curve had no significant peaks or trough-like pigments. However, it only fits the exponentially decreasing curve. Third, the exponential curve had the highest absorbance in the UV and blue wavelength regions, which has a weak remote sensing signal in aquatic systems and is difficult to obtain due to strong atmospheric interference during the application of satellite remote sensing. Another challenge is that natural DOM originates from terrigenous or autochthonous plants (Sulzberger and Durisch-Kaiser, 2009; Stedmon and Nelson, 2015; Cartisano et al., 2018), with a complex composition. As a result, clearly identifying the chemical components of DOM is difficult, in contrast to many pigments, which show typical absorption spectra and known chemical structures (e.g., chlorophylls).
Two different photophysical models, the superposition model and charge transfer model, were used to explain the chemical mechanism in the optical properties of CDOM. The superposition model describes the spectra as a linear combination of non-interacting chromophoric moieties. The charge transfer model considers the optical signal due to electronically interacting moieties. These two models were critically reviewed until 2020 (McKay, 2020). The superposition model has been widely applied in previous studies, particularly in remote sensing (Mueller et al., 2003). If the optical properties of CDOM follow the charge transfer model, simply adding the different spectra of different components can be considered improper for identifying the CDOM chemical composition or quantifying their concentration using remote sensing applications.
Resolving the source of complex compounds, such as CDOM, is difficult. Therefore, we propose a bottom-up approach. First, combined with other chemical analyses, we investigated the absorption properties of simple biomass components and known organic components of CDOM sources. Different methods should be used in different scenarios. Large-scale remote-sensing data tend to use simple spectrum analysis. Mathematical methods are commonly used to obtain chemical compound information (well-examined components with a priori knowledge provided). With preliminary knowledge, we can discriminate the organic composition through absorption information. Finally, we can possibly link geographic data from remote sensing to track the sources of CDOM.
Several UV-VIS spectral analysis methods were applied to obtain commonly used spectroscopic parameters from the absorbance spectra of the dissolved solutions of three fundamental biomass constituents (BCs) in aqueous states. By combining these methods with elementary analysis, we found that the spectral slope S275–295 had the strongest correlation with the H/C ratio, and the spectral slope ratio (275–295 to 350–400 nm) SR and absorption ratio between 465 and 665 nm or E4/E6 had strong correlation with the O/C ratio. We also observed distinguishable differences in the spectroscopic parameters of the BCs’ solutions. While spectroscopic parameters use only a small part of the absorption spectrum, advanced mathematical tools can utilize the entire spectrum. Gaussian fitting is suitable for single CDOM components but not for complex mixtures. Moreover, it is unstable due to the variability in the parameters. On the other hand, derivative analysis is suitable for single-component discrimination and peak position localization, particularly for analyzing multicomponent samples. The peak positions of the third and fourth derivatives offer an excellent opportunity to retrieve information from multicomponent CDOM mixtures. However, more a priori chemical structure information of biomass or primary CDOM components is required and knowledge of these complex and slow decay compounds is currently still insufficient. Therefore, we suggest further studies on the optical properties of simple biomass constituents and known organic components of CDOM sources. Additionally, standard procedures for advanced mathematical tools are urgently needed to obtain valuable chemical compound information on CDOM in complex natural water bodies in the future.
The raw data supporting the conclusion of this article will be made available by the authors, without undue reservation.
All authors listed have made a substantial, direct, and intellectual contribution to the work and approved it for publication.
We thank the GeoScience laboratory staff of ITC for their support. The first author gives her appreciation to the China Scholarship Council for funding her PhD research.
The authors declare that the research was conducted in the absence of any commercial or financial relationships that could be construed as a potential conflict of interest.
All claims expressed in this article are solely those of the authors and do not necessarily represent those of their affiliated organizations, or those of the publisher, the editors and the reviewers. Any product that may be evaluated in this article, or claim that may be made by its manufacturer, is not guaranteed or endorsed by the publisher.
The Supplementary Material for this article can be found online at: https://www.frontiersin.org/articles/10.3389/fenvs.2023.1152536/full#supplementary-material
Aguirre-Gomez, R., Boxall, S. R., and Weeks, A. R. (1995). “Identification of algal pigments using high order derivatives,” in 1995 International Geoscience and Remote Sensing Symposium, IGARSS '95. Quantitative Remote Sensing for Science and Applications, Firenze, Italy, 10-14 July 1995, 2084–2086. doi:10.1109/igarss.1995.524115
Basu, P. (Editor) (2018). “Biomass characteristics,” in Biomass gasification, pyrolysis and torrefaction. Academic Press, 49–91.
Bricaud, A., Morel, A., and Prieur, L. (1981). Absorption by dissolved organic matter of the sea (yellow substance) in the UV and visible domains. Limnol. Oceanogr. 26 (1), 43–53. doi:10.4319/lo.1981.26.1.0043
Bricaud, A. (2004). Natural variability of phytoplanktonic absorption in oceanic waters: Influence of the size structure of algal populations. J. Geophys. Res. 109, C11010. doi:10.1029/2004jc002419
Carlson, C. A., and Hansell, D. A. (2015). “DOM sources, sinks, reactivity, and budgets,” in Biogeochemistry of marine dissolved organic matter. Editors D. A. Hansell, and C. A. Carlson (London: Academic Press), 65–126.
Cartisano, C. M., Del Vecchio, R., Bianca, M. R., and Blough, N. V. (2018). Investigating the sources and structure of chromophoric dissolved organic matter (CDOM) in the North Pacific Ocean (NPO) utilizing optical spectroscopy combined with solid phase extraction and borohydride reduction. Mar. Chem. 204, 20–35. doi:10.1016/j.marchem.2018.05.005
Chen, W., and Yu, H. Q. (2021). Advances in the characterization and monitoring of natural organic matter using spectroscopic approaches. Water Res. 190, 116759. doi:10.1016/j.watres.2020.116759
Chen, Y., Senesi, N., and Schnitzer, M. (1977). Information provided on humic substances by E4/E6 ratios. Soil Sci. Soc. Am. J. 41 (2), 352–358. doi:10.2136/sssaj1977.03615995004100020037x
Chin, Y. P., Aiken, G., and O'Loughlin, E. (1994). Molecular weight, polydispersity, and spectroscopic properties of aquatic humic substances. Environ. Sci. Technol. 28 (11), 1853–1858. doi:10.1021/es00060a015
Cieslewicz, J., and Gonet, S. S. (2004). Properties of humic acids as biomarkers of lake catchment management. Aquatic Sci. - Res. Across Boundaries 66 (2), 178–184. doi:10.1007/s00027-004-0702-0
De Haan, H., and De Boer, T. (1987). Applicability of light absorbance and fluorescence as measures of concentration and molecular size of dissolved organic carbon in humic Lake Tjeukemeer. Water Res. 21 (6), 731–734. doi:10.1016/0043-1354(87)90086-8
Guo, X. J., He, X. S., Li, C. W., and Li, N. X. (2019). The binding properties of copper and lead onto compost-derived DOM using Fourier-transform infrared, UV-vis and fluorescence spectra combined with two-dimensional correlation analysis. J. Hazard Mater 365, 457–466. doi:10.1016/j.jhazmat.2018.11.035
Helms, J. R., Stubbins, A., Ritchie, J. D., Minor, E. C., Kieber, D. J., and Mopper, K. (2008). Absorption spectral slopes and slope ratios as indicators of molecular weight, source, and photobleaching of chromophoric dissolved organic matter. Limnol. Oceanogr. 53 (3), 955–969. doi:10.4319/lo.2008.53.3.0955
Hu, C., Muller-Karger, F. E., and Zepp, R. G. (2002). Absorbance, absorption coefficient, and apparent quantum yield: A comment on common ambiguity in the use of these optical concepts. Limnol. Oceanogr. 47 (4), 1261–1267. doi:10.4319/lo.2002.47.4.1261
Hur, J., Jung, K. Y., and Jung, Y. M. (2011). Characterization of spectral responses of humic substances upon UV irradiation using two-dimensional correlation spectroscopy. Water Res. 45 (9), 2965–2974. doi:10.1016/j.watres.2011.03.013
Hur, J., Williams, M. A., and Schlautman, M. A. (2006). Evaluating spectroscopic and chromatographic techniques to resolve dissolved organic matter via end member mixing analysis. Chemosphere 63 (3), 387–402. doi:10.1016/j.chemosphere.2005.08.069
IOCCG (2000). Remote Sensing of Ocean Colour in Coastal, and Other Optically-Complex, Waters. Editor S. Sathyendranath Dartmouth, NS, Canada: International Ocean-Colour Coordinating Group (IOCCG), 140. (Reports of the International Ocean-Colour Coordinating Group, No. 3). doi:10.25607/OBP-95
Kumada, K. (1987). “Spectroscopic Characteristics of Humic Acids and Fulvic Acids,” in Developments in Soil Science. Editor K. Kumada Elsevier, 34–56.
Küpper, H., Seibert, S., and Parameswaran, A. (2007). Fast, sensitive, and inexpensive alternative to analytical pigment HPLC: Quantification of chlorophylls and carotenoids in crude extracts by fitting with gauss peak spectra. Anal. Chem. 79 (20), 7611–7627. doi:10.1021/ac070236m
Küpper, H., Spiller, M., and Küpper, F. C. (2000). Photometric method for the quantification of chlorophylls and their derivatives in complex mixtures: Fitting with gauss-peak spectra. Anal. Biochem. 286 (2), 247–256. doi:10.1006/abio.2000.4794
Li, P., and Hur, J. (2017). Utilization of UV-vis spectroscopy and related data analyses for dissolved organic matter (DOM) studies: A review. Crit. Rev. Environ. Sci. Technol. 47 (3), 131–154. doi:10.1080/10643389.2017.1309186
Lievens, C., Carleer, R., Cornelissen, T., and Yperman, J. (2009). Fast pyrolysis of heavy metal contaminated willow: Influence of the plant part. Fuel 88 (8), 1417–1425. doi:10.1016/j.fuel.2009.02.007
Lievens, C., Yperman, J., Vangronsveld, J., and Carleer, R. (2008). Study of the potential valorisation of heavy metal contaminated biomass via phytoremediation by fast pyrolysis: Part I. Influence of temperature, biomass species and solid heat carrier on the behaviour of heavy metals. Fuel 87 (10-11), 1894–1905. doi:10.1016/j.fuel.2007.10.021
Loiselle, S. A., Bracchini, L., Dattilo, A. M., Ricci, M., Tognazzi, A., Cózar, A., et al. (2009). The optical characterization of chromophoric dissolved organic matter using wavelength distribution of absorption spectral slopes. Limnol. Oceanogr. 54 (2), 590–597. doi:10.4319/lo.2009.54.2.0590
Massicotte, P., and Markager, S. (2016). Using a Gaussian decomposition approach to model absorption spectra of chromophoric dissolved organic matter. Mar. Chem. 180, 24–32. doi:10.1016/j.marchem.2016.01.008
Maul, G. A., and Gordon, H. R. (1975). On the use of the earth resources technology satellite (LANDSAT-1) in optical oceanography. Remote Sens. Environ. 4, 95–128. doi:10.1016/0034-4257(75)90008-5
McKay, G. (2020). Emerging investigator series: Critical review of photophysical models for the optical and photochemical properties of dissolved organic matter. Environ. Sci. Process Impacts 22 (5), 1139–1165. doi:10.1039/d0em00056f
Mueller, J. L., Morel, A., Fargion, G. S., and McClain, C. R. (2003). Ocean optics protocols for satellite ocean color sensor validation, revision 4. Volume IV. United States: NASA.
Nelson, N. B., and Siegel, D. A. (2013). The global distribution and dynamics of chromophoric dissolved organic matter. Ann. Rev. Mar. Sci. 5, 447–476. doi:10.1146/annurev-marine-120710-100751
Noda, I., Dowrey, A. E., Marcott, C., Story, G. M., and Ozaki, Y. (2000). Generalized two-dimensional correlation spectroscopy. Appl. Spectrosc. 54 (7), 236A–248A. doi:10.1366/0003702001950454
Novaes, E., Kirst, M., Chiang, V., Winter-Sederoff, H., and Sederoff, R. (2010). Lignin and biomass: A negative correlation for wood formation and lignin content in trees. Plant Physiol. 154 (2), 555–561. doi:10.1104/pp.110.161281
Ohaver, T. C., and Begley, T. (1981). Signal-to-Noise ratio in higher-order derivative spectrometry. Anal. Chem. 53 (12), 1876–1878. doi:10.1021/ac00235a036
Omanović, D., Santinelli, C., Marcinek, S., and Gonnelli, M. (2019). ASFit - an all-inclusive tool for analysis of UV–Vis spectra of colored dissolved organic matter (CDOM). Comput. Geosciences 133, 104334. doi:10.1016/j.cageo.2019.104334
Peuravuori, J., and Pihlaja, K. (1997). Molecular size distribution and spectroscopic properties of aquatic humic substances. Anal. Chim. Acta 337 (2), 133–149. doi:10.1016/s0003-2670(96)00412-6
Savitzky, A., and Golay, M. J. E. (1964). Smoothing and differentiation of data by simplified least squares procedures. Anal. Chem. 36 (8), 1627–1639. doi:10.1021/ac60214a047
Schadel, C., Blochl, A., Richter, A., and Hoch, G. (2010). Quantification and monosaccharide composition of hemicelluloses from different plant functional types. Plant Physiol. Biochem. 48 (1), 1–8. doi:10.1016/j.plaphy.2009.09.008
Schwarz, J. N., Kowalczuk, P., Kaczmarek, S., Cota, G. F., Mitchell, B. G., Kahru, M., et al. (2002). Two models for absorption by coloured dissolved organic matter (CDOM). Oceanologia 44 (2), 209–241.
Stedmon, C. A., and Nelson, N. B. (2015). “The optical properties of DOM in the ocean,” in Biogeochemistry of marine dissolved organic matter. Editor D. A. C. Hansell, and A. Craig London: Academic Press, 481–508.
Sulzberger, B., and Durisch-Kaiser, E. (2009). Chemical characterization of dissolved organic matter (DOM): A prerequisite for understanding UV-induced changes of DOM absorption properties and bioavailability. Aquat. Sci. 71 (2), 104–126. doi:10.1007/s00027-008-8082-5
Summers, R. S., Cornel, P. K., and Roberts, P. V. (1987). Molecular size distribution and spectroscopic characterization of humic substances. Sci. Total Environ. 62, 27–37. doi:10.1016/0048-9697(87)90478-5
Talsky, G., Mayring, L., and Kreuzer, H. (1978). High-resolution, higher-order UV/VIS derivative spectrophotometry. Angewandte Chemie Int. Ed. Engl. 17 (11), 785–799. doi:10.1002/anie.197807853
Torrecilla, E., Piera, J., and Vilasec, M. (2009). “Derivative analysis of hyperspectral oceanographic data,” in Advances in Geoscience and Remote Sensing. Editor G. Jedlovec London: IntechOpen, 597–618.
Twardowski, M. S., Boss, E., Sullivan, J. M., and Donaghay, P. L. (2004). Modeling the spectral shape of absorption by chromophoric dissolved organic matter. Mar. Chem. 89 (1-4), 69–88. doi:10.1016/j.marchem.2004.02.008
Weishaar, J. L., Aiken, G. R., Bergamaschi, B. A., Fram, M. S., Fujii, R., and Mopper, K. (2003). Evaluation of specific ultraviolet absorbance as an indicator of the chemical composition and reactivity of dissolved organic carbon. Environ. Sci. Technol. 37 (20), 4702–4708. doi:10.1021/es030360x
Yan, M., Dryer, D., Korshin, G. V., and Benedetti, M. F. (2013). In situ study of binding of copper by fulvic acid: Comparison of differential absorbance data and model predictions. Water Res. 47 (2), 588–596. doi:10.1016/j.watres.2012.10.020
Keywords: UV-VIS absorption, Chromophoric Dissolved Organic Matter (CDOM), spectroscopic parameters, Gaussian fit, derivative analysis
Citation: Zeng R, Mannaerts CM and Lievens C (2023) Assessment of UV-VIS spectra analysis methods for quantifying the absorption properties of chromophoric dissolved organic matter (CDOM). Front. Environ. Sci. 11:1152536. doi: 10.3389/fenvs.2023.1152536
Received: 27 January 2023; Accepted: 04 April 2023;
Published: 20 April 2023.
Edited by:
Geer Teng, University of Oxford, United KingdomCopyright © 2023 Zeng, Mannaerts and Lievens. This is an open-access article distributed under the terms of the Creative Commons Attribution License (CC BY). The use, distribution or reproduction in other forums is permitted, provided the original author(s) and the copyright owner(s) are credited and that the original publication in this journal is cited, in accordance with accepted academic practice. No use, distribution or reproduction is permitted which does not comply with these terms.
*Correspondence: Ruosha Zeng, ci56ZW5nQHV0d2VudGUubmw=
Disclaimer: All claims expressed in this article are solely those of the authors and do not necessarily represent those of their affiliated organizations, or those of the publisher, the editors and the reviewers. Any product that may be evaluated in this article or claim that may be made by its manufacturer is not guaranteed or endorsed by the publisher.
Research integrity at Frontiers
Learn more about the work of our research integrity team to safeguard the quality of each article we publish.