- 1College of Water Conservancy and Hydropower Engineering, Hohai University, Nanjing, China
- 2Hebei Institute of Water Science, Hebei, China
In water resources management on a global scale, it is important to reconcile the conflicting interests of different regions and actors regarding water use. To solve this issue more effectively, an optimal allocation model of water resources that coordinates the interests of regional multi-level water resource managers and balances the benefits acquired by regional multi-level water resource managers was proposed. The model consisted of three components, including option generation, option selection, and fallback bargaining. The Hybrid Strategy Whale Optimization Algorithm (HSWOA) was created to generate the initial alternative set throughout the alternative generation process. In the alternative screening process, quick non-dominated sorting was used to choose Pareto alternatives from the initial alternative set. Through many rounds of negotiations, water resource managers at all levels reached a consensual water resource allocation plan during fallback bargaining. This model was used to reconcile the conflicting water interests of municipal and county water managers in Handan, China, in terms of economic, social, and ecological benefits. It was also compared with the Pareto solution set obtained from NSGA-III. In terms of convergence speed and accuracy, the results demonstrated that HSWOA outperformed the Whale Optimization Algorithm (WOA). The results show that several rounds of discussions between municipal and county water management eventually resulted in Nash equilibrium. In normal flow year, the recommended scheme could yield economic benefit of 315.08×10⁸ Yuan, social benefit of 0.1700, and ecological benefit of 5.70 × 10⁶ m3, whereas in low flow year, the recommended scheme could yield economic benefit of 354.85×10⁸ Yuan, social benefit of 0.2103, and ecological benefit of 57.82 × 10⁶ m3. Compared to existing studies, the recommended scheme has clear advantages in terms of social and ecological benefits. The proposed optimal water resource allocation was Pareto optimal. This paper presented a new way of thinking about reconciling the conflicting interests of different levels of water resource managers in the process of water allocation.
1 Introduction
Water is a valuable fundamental resource, a vital economic resource, and a public social resource (Wang et al., 2022). Currently, only 0.007% of the world’s water resources are available for direct human use (Loucks and Van Beek, 2017). With rapid socio-economic development and continued population growth, global water demand is anticipated to increase for some time (Sone et al., 2022). When there are insufficient water resources to meet demand, rivalry and conflict will arise between different areas and water users, posing a major challenge to water resource managers (Sohrabi et al., 2022). As an important method of dealing with water shortage and coordinating water competition, the optimal allocation of water resources has become a major issue in water resources management (Li et al., 2020; 2022; Yuan et al., 2022).
The optimal allocation of water resources must not only optimize water use efficiency and consider the equity of water supply between upstream and downstream areas and various water users, but also preserve the ecological environment’s health. As a result, this is a high-dimensional, non-linear, constrained optimization problem (Deng et al., 2022). In recent years, multi-objective decision-making methods have been widely used to solve water resources optimization problems, such as multi-objective linear programming (Zhuang et al., 2015; Avarideh et al., 2017; Zeng et al., 2018; Yue et al., 2022), non-linear programming (Zeng et al., 2015a; Zeng et al., 2015b.; Grové, 2019; Yan et al., 2021), multi-objective evolutionary algorithms (Fang et al., 2018; Hatamkhani et al., 2022; Yan et al., 2022; Yousefi and Moridi, 2022), etc., Zeng et al. (2015a) developed a two-stage interval-stochastic water trading (TIWT) model by combining interval parametric planning techniques with two-stage stochastic planning techniques to consider the water allocation of the Kaidu-Kongchu River under a water rights trading scenario. However, the study did not consider in-channel and off-channel ecological water needs in the water allocation process, nor did the objectives of the allocation take the ecological environment into account. Avarideh et al. (2017) developed a system of indicators to determine the water allocation of the transboundary river Sirwan-Diyala between Iran and Iraq, based on the UN Watercourses Convention. They also carried out water supply simulations using the Water Evaluation and Planning (WEAP) model to assess the impact of the water allocation results on both countries under different scenarios. However, the method only considered scenarios for the selection of the three indicator weights and did not perform an optimization search for the weights, so the proposed weights may not be the optimal solution. Hatamkhani et al. (2022) coupled multi-objective particle swarm optimization (MOPSO) with WEAP, aiming at the largest cultivated area in the agricultural sector and the highest water supply reliability for environmental flow requirements. Moreover, they allocated water resources for the Karkheh River Basin in Iran. However, this study did not consider the water demands of other water users besides agriculture and wetland ecology. Besides, the above research assumes that there is only one authoritative water resource manager who proposes a non-inferior solution or set of Pareto solutions that maximize the overall benefit to the region. He then chooses the final water allocation solution based on his own preferences. However, in practical water resource management, there are frequently multiple levels of water resource managers, with the higher-level water resource managers responsible for safeguarding the water needs of the regional ecosystem and coordinating water supply conflicts between sub-regions. On the other hand, lower-level water resource managers are more concerned with the economic benefits of water supply (Yao et al., 2019). The multi-objective decision-making process is characterized by a low level of participation by sub-water managers, whose interests are not clearly articulated and who may be dissatisfied with the water distribution options, thus affecting their implementation. As a result, there is an urgent need to propose a model for optimizing water resource allocation that takes into account the interests of various levels of water resource managers in order to better balance individual interests with the overall interests.
Fallback bargaining is a non-cooperative game strategy proposed by Brams and Kilgour (2001) that seeks to maximize the self-interest of all game participants. The game players, according to the principle, rank the alternatives based on their own interest maximization from a set of alternatives. By gradually lowering their own expectations of their own interests, they consistently choose the lower-ranked alternatives until there is an alternative that satisfies the interest objectives of all game players, thus achieving Nash equilibrium (Facchinei and Kanzow, 2010). The method is simple, with a high degree of participation from all game participants. The chosen solution is accepted by all players and is easily implementable. Lee (2012) developed a multi-objective fallback bargaining model to balance land pollution loads with the economic benefits of land use in the Zengwen Reservoir area of Taiwan. Moradi and Limaei (2018) used a backward bargaining approach in watershed land management to reunite environmentalists (seeking to reduce soil erosion and sedimentation) and land users (seeking economic benefits from land use). He also compared it with traditional multi-objective optimization methods, showing that the Nash equilibrium solution is closer to the Pareto frontier. Yu et al. (2021) developed a reservoir multi-objective game model to resolve the conflicts between reservoir managers, local government officials, and water users in the receiving area between annual power generation, ecological flows, and socio-economic water demand, using the Three Gorges Reservoir in China as their case study. However, few studies have applied the principle of fallback bargaining to the problem of optimal regional water allocation, particularly the coordination of conflicts between different levels of water managers in the optimal allocation of water resources. In addition, existing studies have calculated the maximum and minimum values of each party’s interest and divided n equally between them as alternatives. This method has two shortcomings. First, n lacks a reasonable and clear criterion for its value. Second, the alternative proposed by n may not be a feasible solution to the objective function. Therefore, a new alternative selection method needs to be proposed to enhance the efficiency and feasibility of fallback bargaining.
Efficient optimization algorithms are a crucial tool for selecting water allocation options. WOA is a meta-heuristic optimization algorithm proposed by Mirjalili and Lewis (2016) in 2016 that features a unique search mechanism with few parameters and easy understanding. A number of scholars have applied WOA to water demand forecasting, water resource optimization, and water-wind-light complementary energy scheduling, and the results demonstrated WOA’s efficiency in dealing with the above research problems (Yan et al., 2018; Yin et al., 2019; Guo et al., 2020). However, similar to other intelligent optimization algorithms, WOA suffers from slow convergence and a tendency to fall into local optima (Yang et al., 2022).
In summary, based on the contradictory distribution of interests between different levels of regional water resource managers in the optimal allocation of water resources, this paper proposes a new model for the optimal allocation of water resources that allocates all available water resources in the region to all types of water users. It takes into account the different needs of various levels of water managers in terms of ecological, social, and economic benefits. It also generates initial water allocation options by constructing an HSWOA. Lastly, it selects the options using a fast non-dominated ranking method (Deb et al., 2002), and introduces a fallback bargaining method to simulate the process of multiple rounds of negotiation between different levels of water managers. The model was applied to the city of Handan, China, to optimize water allocation under normal and drought conditions in 2025 and compared with the Pareto solution set proposed by NSGA-III to verify the soundness of the model. This study provides a new perspective on how to improve the interactivity of different levels of water resource managers in the water allocation process, resulting in water allocation options that are acceptable to different levels of water resource managers. This helps reduce conflicts between different levels of water resource managers.
The rest of this paper is organized as follows: The second section details the process and details of the water resource optimization model proposed in this paper to coordinate the interests of different levels of water resource managers. The third section presents an overview of the study area and data sources. The fourth section shows the results of the distribution of benefits to different levels of water resource managers. The fifth section contains the conclusions and limitations.
2 Methodology
2.1 Optimal water allocation model at city and county levels
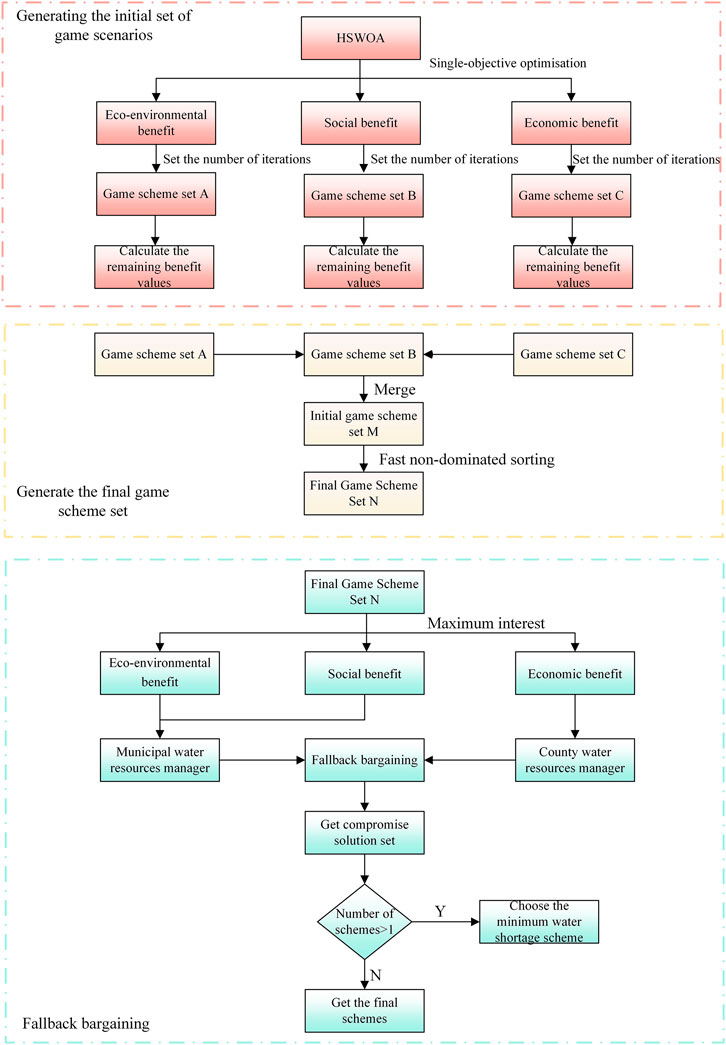
This study suggests a comprehensive alternative generation-alternative screening-fallback bargaining model for optimal allocation of water resources at the city and county levels, as shown in Figure 1. Construct HSWOA to solve for ecological and environmental benefits, social benefits, and economic benefits, respectively. Generate an initial set of options for optimal water resource allocation. Calculate the remaining benefit values for each option. Combine the options and introduce a fast, non-dominated ranking method to select the representative options to generate the final set of options. The municipal and county water managers rank the options according to their own best interests and initiate a fallback bargaining session until the compromise set is not empty for the first time. If there is more than one choice in the compromise set, the option with the smallest water deficit is selected. If there is only one option in the compromise set, then that option is the last one.
2.2 Goals and limits for an optimal water resource allocation model at the city and county levels
The objectives of optimal allocation of water resources usually include ecological benefit, social benefit, and economic benefit. Moreover, the constraints mainly include water supply capacity constraints, water demand constraints, water balance constraints, etc., (Jin-Yan et al., 2021). These three objectives are contradictory. For example, the pursuit of maximizing the economic benefits of water allocation may lead to difficulties in securing ecological water that does not directly generate economic benefit. Also, areas with low water efficiency may be allocated less water and have a less equitable water supply. The ideal water allocation solution for municipal water managers is one that reduces the ecological deficit of water in the region and ensures equitable water supply for all sub-regions. On the other hand, county water managers seek to maximize their own net return on water supply. As a result, there is a conflict between municipal and county water managers in the development of water allocation schemes, and a suitable model needs to be proposed to reconcile this conflict. This paper defines the ecological deficit as an ecological benefit, the gap in water supply satisfaction between regions within the sub-basin as a social benefit, and the net benefit of water supply as an economic benefit, with each benefit explained in more detail below.
2.2.1 Ecological benefit
The regional ecological environment water demand includes the ecological environment water demand in the river and the ecological environment water demand outside the river. The objective of ecological benefit is to minimize the ecological environment’s water shortage in the river and outside the river.
2.2.2 Social benefit
Often, a municipality has many sub-basins. Moreover, calculation units situated in the same sub-basin are closely linked hydraulically, with water abstraction from upstream calculation units significantly affecting the amount of available water for downstream calculation units. Therefore, the social benefit objective is to achieve the smallest water supply gap for the calculation units inside the sub-catchment. The Gini coefficient is one of the most prominent measures used to assess regional income differences and is widely employed in economics (Gini, 1921). The Gini coefficient is defined as the ratio of the area between the diagonal and the Lorentz curve to the area between the entire triangle below the diagonal (Figure 2). It also takes on a value ranging from 0 to 1, with larger values indicating a more unequal distribution of resources. This paper calculates the Gini coefficient of satisfaction with water supply using the trapezoidal approach (Dai et al., 2018), after defining water supply satisfaction as:
Arrange
Based on the definition of the Gini coefficient, the calculation of the Gini coefficient is derived as follows:
The social benefit objective for water allocation can be expressed as:
2.2.3 Economic benefit
The economic benefit is mainly expressed through the net economic benefit generated by the water supply. The objective function is as follows:
2.2.4 Constraints
The above objective functions for optimal allocation of water resources are subject to the following constraints:
(1) Water allocation rule constraints
According to the water supply topology between water sources and water users,
(2) Water supply balance constraint
(3) Water supply capacity constraints
(4) Water demand constraint
(5) Non-negative constraints
2.3 The procedure for determining the optimal allocation of water at the municipal and county levels
2.3.1 Initial option set generation
The quantity and quality of the initial set of options have a direct impact on the effectiveness of the final water allocation solution. Commonly used water resource configuration tools include MIKE BASIN (Liu et al., 2019), WEAP (Khalil et al., 2018), GWAS (Yan et al., 2020), and others. However, these models are suitable for modeling regional water resource conditions given different water supply and demand scenarios and can only produce one outcome per simulation. This does not allow for a large number of water allocation options to be negotiated at different levels of water managers. Therefore, they are not suitable for solving the problems presented in this study. It is essential to propose an efficient optimization algorithm to acquire a high-quality initial set of options. A Sobol sequence is used to initialize the population, and the convergence factor is non-linearized in an effort to address the drawbacks of WOA, such as its slow convergence speed and tendency to fall into a local optimum. Based on Particle Swarm Optimization (PSO) (Kennedy and Eberhart, 1995), a “global-local” guided adaptive weight is designed, and the scout bee mechanism in the Artificial Bee Colony Algorithm (ABC) (Karaboga, 2005) is introduced to enhance the convergence speed of WOA and the ability to jump out of a local optimal solution.
2.3.1.1 Standard WOA
(1) Search for prey
The population size is first determined by the number of whales participating in the hunting behavior, with each whale representing a set of solution vectors
Where
Where
(2) Surrounding the prey
As the number of iterations t increases,
Where
(3) Spiral bubble net hunting
Whales have a unique way of hunting that involves finding their prey, swimming in a spiral upward, spitting out vast quantities of air bubbles to limit their prey’s range of movement, and then feeding upward from the bottom of the spiral. This process of predation can be expressed by the following mathematical model:
Where c is the coefficient controlling the shape of the helix, in this paper we take c = 1.
Noting that whale schools have both surrounding prey and spiral bubble net hunting behavior while attacking prey, random probabilities are used to update the optimal locations of whale individuals. When the probability is p ≥ 0.5, the group of whales performs a spiral bubble net hunt, and when the probability is p < 0.5, the group encircles the prey based on the location of the optimal individual whale. As the number of iterations increases,
2.3.1.2 WOA enhancement Strategies
(1) Sobol sequence to initialize populations
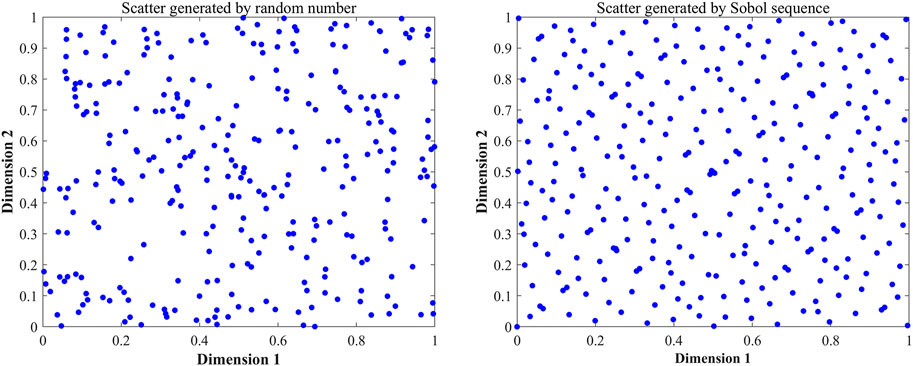
In intelligent algorithms, the distribution of the initial population has a direct impact on convergence speed and the search accuracy of the algorithm (Dokeroglu et al., 2019). It should also be as uniform as possible to ensure high traversal and diversity, hence enhancing the search efficiency (Mirjalili and Gandomi, 2017). The typical WOA initializes the population with a method of generating random numbers, which is less traversable and has an uneven distribution of individuals. A Sobol sequence is a random sequence made up of radical inversions with base 2 in each dimension of the population. Each dimension has its own unique matrix of Radical Inversions, resulting in non-repetitive and homogeneous points (Joe and Kuo, 2003). Figure 3 shows the two-dimensional distribution of 300 random numbers in the interval [0, 1] created by the Sobol sequence. The Sobol sequence generates random numbers that are more uniformly dispersed in space and have a greater degree of domain coverage.
(2) Non-linear convergence factors and adaptive weights
As seen from Eq. 18, the convergence factors a decrease linearly with the number of iterations. This results in the standard WOA having an incomplete global search at the beginning of the iteration and a weaker ability to jump out of the local optimal solution in the later local search. To address this problem, a new non-linear convergence factor update formulation is proposed in this paper:
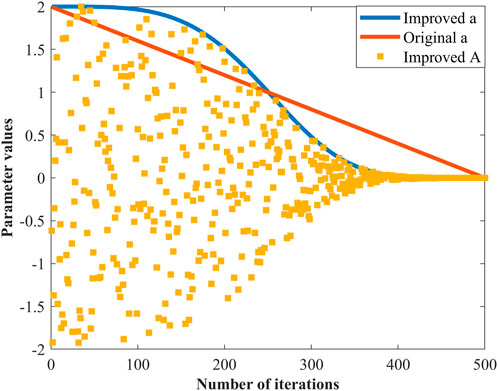
Figure 4 shows how the convergence factor a is spread out before and after the improvement, as well as how the improved coefficient A is spread out as the number of iterations goes up. The improved convergence factors a take larger values and decay more slowly at the beginning of the iteration, so that the coefficient A has a larger range of values and the algorithm has a stronger global search capability. In the late iteration, the convergence factors a drop quickly to a smaller value. This helps the algorithm improve its ability to search locally and speeds up the process of the population coming together.
Inspired by PSO, an adaptive weight is added to the process of individual whale position update in order to reduce the impact of the most adapted whale on the current whale population position update at the beginning of the iteration, thereby enhancing the algorithm’s early global search capability. Therefore, improving the global search capability of the algorithm in its early stages. When the number of iterations is high, the degree of influence of the most adapted individual whale on the position of the whale population is gradually increased, improving the speed of convergence of the algorithm. The adaptive weights are calculated as follows:
Equations 13, 18, 20 then become:
(3) Mechanisms for detecting whales
Inspired by ABC, the scout whale mechanism is introduced in WOA, where the scout whale search is triggered when the individual whale with the highest fitness level remains constant for a certain number of iterations, attempting to jump out of the local optimal solution by generating a larger location update. In this paper, the location of the scout whales is changed using a Cauchy-Gaussian variation strategy, which is calculated as follows:
2.3.1.3 HSWOA main Steps
Step 1. Initialize the algorithm-related parameters, including the population size N, the objective function F, the variable dimension dim, the search space [ub, lb] of the population, the threshold limit for the number of iterations for detecting whale generation, and the maximum number of iterations tmax.
Step 2. Generate the initial populations using Sobol sequences
Step 3. Substitute the population position into the objective function for calculation to obtain the position of the individual whale with the highest current fitness.
Step 4. If the optimal whale position remains constant for the limit of iterations, then the detection whale is triggered. Moreover, apply a Cauchy-Gaussian variation to the detection whale according to Eq. 29.
Step 5. Update the non-linear convergence factor according to Eq. 23, and update the coefficient A according to Eq. 15. Moreover, update the adaptive weights according to Eq. 24 along with the coefficient B and the probability p.
Step 6. Search for prey using Eq. 25 if p < 0.5 and
Step 7. Hunt for spiral bubble nets using Eq. 27 if p ≥ 0.5.
Step 8. Determine whether the iteration termination condition is satisfied. If so, the global optimal solution is output, and the solution vector is output. Otherwise, continue to calculate the whale’s individual fitness and record the optimal individual position.The HSWOA flowchart with pseudo-code can be found in Supplementary Appendix SA.
2.3.2 Initial option set selection method
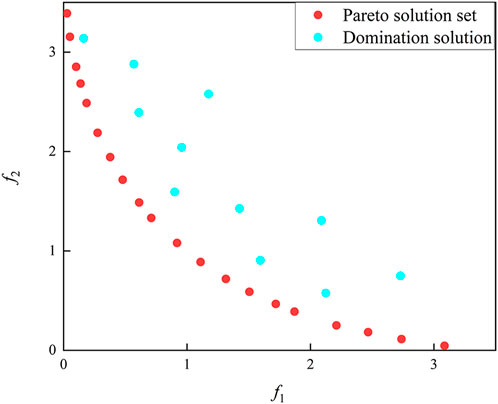
Deb et al. proposed the quick non-dominated sorting method for screening non-dominated populations in NSGA-II. The basic principle of the method is to compare the fitness of each individual to that of the others in order to identify a subset of Pareto solution sets that are superior to the others in terms of fitness and in which the people do not dominate one another. Figure 5 depicts the distribution of the bi-objective Pareto solution set. There is always at least one solution in the Pareto solution set whose fitness is vastly superior to that of the dominant solution. Moreover, solutions within the Pareto solution set are not dominated by one another due to the large number of options in the initial set of alternatives and the existence of a set of options that can fully dominate the others. As a result, a fast, non-dominated ranking method is introduced to filter the initial set of alternatives and retain the Pareto option as the final set of alternatives in order to enhance the efficiency of the water resource optimal allocation method. In the work of Deb et al., the precise steps of the rapid, non-dominated sorting approach are described in depth.
2.3.3 Fallback bargaining
Fallback bargaining is a non-cooperative game approach to resolving the conflicting interests of multiple stakeholders, as proposed by Brams et al. An example of a typical fallback bargaining method is as follows:
From Eq. 29, we can see that example has two game subjects, and each game subject ranks all options based on their own preferences to generate the alternative matrix A. Next, each game subject proposes their own interests in the option to negotiate. In the first round of negotiations, game subject 1 proposes option a, while game subject 2 proposes option c. Obviously, the two parties did not agree in the first round of negotiations. Therefore, they enter the second round of negotiation. In the second round of negotiations, subject 1 proposes option b, and subject 2 proposes option d. Still, no agreement can be reached, so it goes to the next round of negotiations. In the third round of negotiation, game subject 1 proposes option c, and game subject 2 proposes option a. At this point, both options a and c are acceptable to both game subjects and form a compromise set
This paper introduces a fallback bargaining strategy, setting up municipal and county water resource managers as game subjects, with municipal water resource managers seeking to maximize social and ecological benefits and county water resource managers seeking to maximize economic benefits. Each game player ranks the options based on their own interests, and through multiple rounds of negotiation, they eventually come up with a water allocation solution, that is, acceptable to all game players.
3 Model application
3.1 Study area
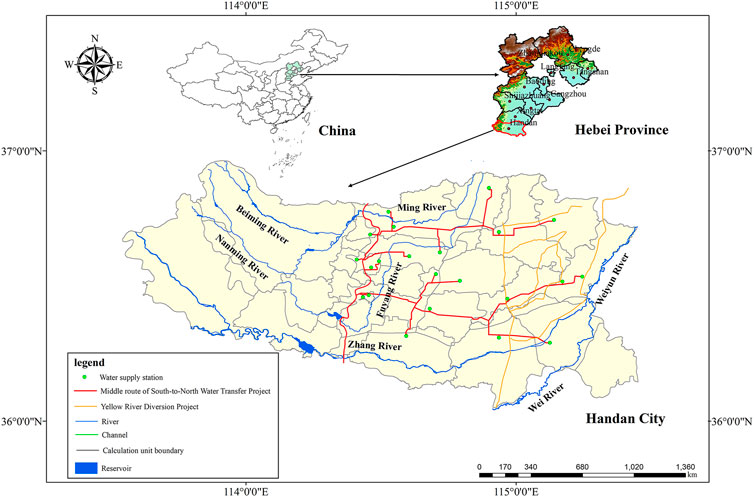
Handan is situated in the southernmost part of Hebei Province, China, at latitudes 36° 04′–37° 01′N and longitudes 113° 28′–115° 28′E. It has a land area of 12,047 km2. It has a warm, temperate, semi-humid, semi-arid continental monsoon climate with an annual precipitation average of 537.6 mm (1956–2016). In 2021, Handan will have a resident population of 9,367,000, a gross regional product (GDP) of 411.48 billion RMB, and a per capita GDP of 43,929 RMB. Its water resources per capita are 133.31 m3, which is only 6.4% of the Chinese average, making it a resource-based water-scarce region. Due to the scarcity of local surface water resources, groundwater overexploitation is a serious problem, triggering a series of problems such as falling groundwater levels and ground subsidence. The geographical location of Handan is shown in Figure 6.
3.2 Data collection and processing
3.2.1 Water allocation network map
The water allocation network map shows the relationship between regional water resources supply, usage, consumption, and outflow and serves as the foundation for the development of an optimal water resources allocation model. Due to the complexity of water resource distribution concerns, it is difficult to accurately simulate regional water supply patterns. In this study, the major traits and patterns are depicted realistically in the water resource allocation network diagram. On the other hand, other minor aspects are adequately generalized based on the goal of water resource allocation and the actual regional water supply situation. Wei and Wang (2007) outline the basics of water distribution network mapping.
According to the Handan Water Conservancy Bureau’s map of water conservancy projects layout in Handan, the Third Handan Water Resources Survey and Evaluation Report, and the Handan water resources zoning set of administrative zoning, forty water resources optimization calculation units were identified. The water resource allocation network of Handan is designed in accordance with the transmission relationship and hydraulic connection between each calculating unit and the water conservation project, as seen in Figure 7. Figure 7A depicts the relationship between water supply and water consumption in Handan in 2021 and water supply and demands data from the 2021 Water Resources Bulletin provided by the Handan Municipal Water Resources Bureau. The relationships between water demand, supply, utilization, and discharge in Handan are shown in Figure 7B, which is used as the basis for the design of an optimal water allocation model.
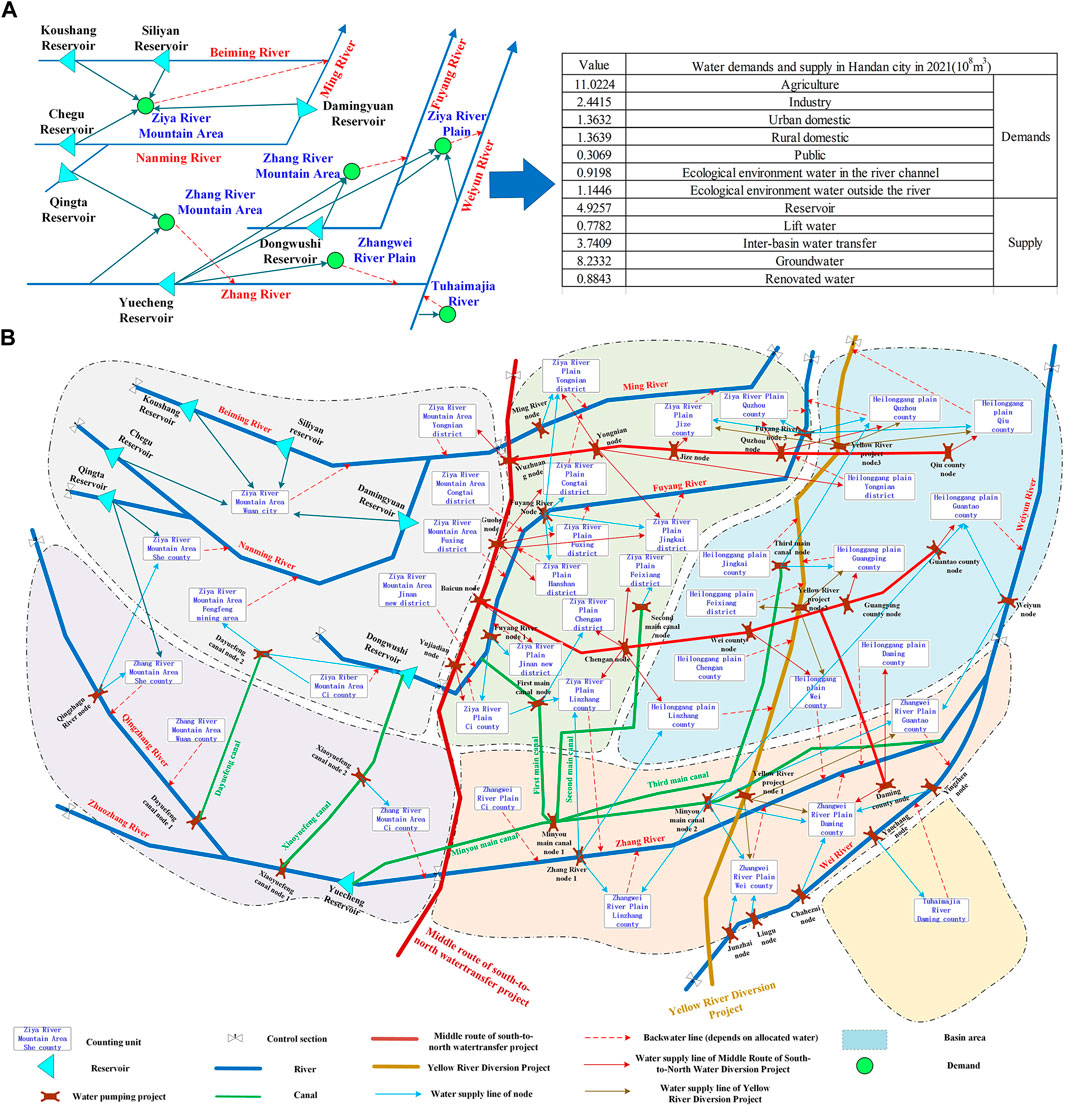
FIGURE 7. Water allocation network map. (A) The relationship between water supply and water consumption in Handan in 2021 (B) Water allocation network map in Handan.
3.2.2 Planned annual water supply capacity and water demand
Based on the Handan Water Resources Development and Utilization Plan approved by the Handan Water Resources Bureau, the available water supply from various water sources in Handan in 2025 is 2,450.6 million m3 in normal flow year and 2,128.19 million m3 in low flow year. However, the total water demand from various industries is 2,947.86 million m3 and 3,396.47 million m3 in normal and low flow year, respectively. Supplementary Appendix SA details the amount of water available and required in each county for normal and low flow year.
3.2.3 Water supply rules and model key parameters
3.2.3.1 Water supply rules
The guidelines for water source allocation are based on the requirements of various water users for the quality of each water source, the water supply routes of water conservation projects, and the cost of water supply.
(1) The use of water for urban domestic use (Urb), rural domestic use (Rur), and urban public use (Pub) is prioritized above the use of water transferred from the south to the north (Nor), with groundwater serving as a secondary supplement (Grd).
(2) Industrial water use (Ind) prioritizes the Nor, followed by renovated water (Ren), then reservoir water (Res), and finally the Grd for replenishment.
(3) The ecological environment water in the river channel (Inn) is given priority over the use of lift water (Lif), followed by the Res, and finally supplemented by the Ren.
(4) The ecological environment water outside the river (Out) is given priority over the use of Ren, followed by the Lif, and finally the use of Yellow River water (Yel) to supplement.
(5) Priority is given to Lif for agricultural water (Agr), then Res, Yel, and finally Grd. Water users are prioritized as follows: Urb, Rur, Ind, Pub, Inn, Out, and Arg. Based on Eqs 7, 8, the water supply priority factor and the receiving water priority factor are computed. The results are displayed in Supplementary Appendix SA.
3.2.3.2 Main parameters of the model
(1) Water supply advantage factor
Referring to the method proposed by Yan et al. (2018) for calculating
(2) Water supply cost factor
According to the water tariff standards for various sectors in Handan, the cost factor for water supply for the Urb and Rur is 4.22/m³ RMB. Moreover, the cost factor for water supply for the Ind is 9.2/m³ RMB, the cost factor for water supply for the Pub is 5.8/m³ RMB, the cost factor for water supply for the Inn and Out is 1.8/m³ RMB, and the cost factor for water supply for Agr is 0.38/m³ RMB.
4 Results and discussion
4.1 Comparison of HSWOA to Different benchmarking function algorithms
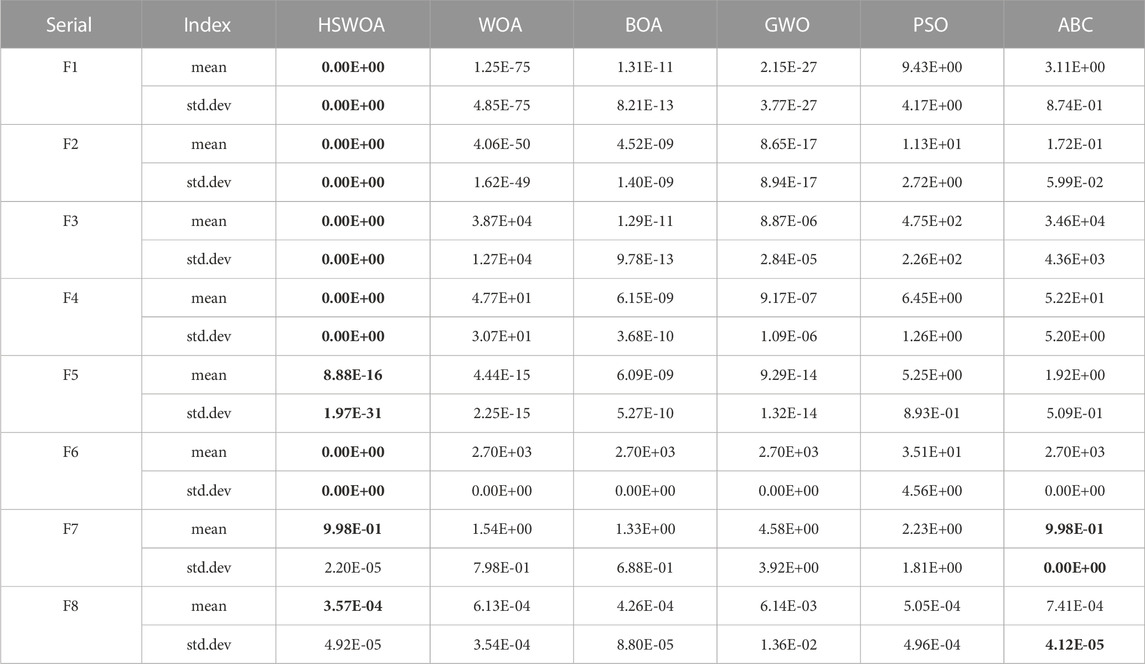
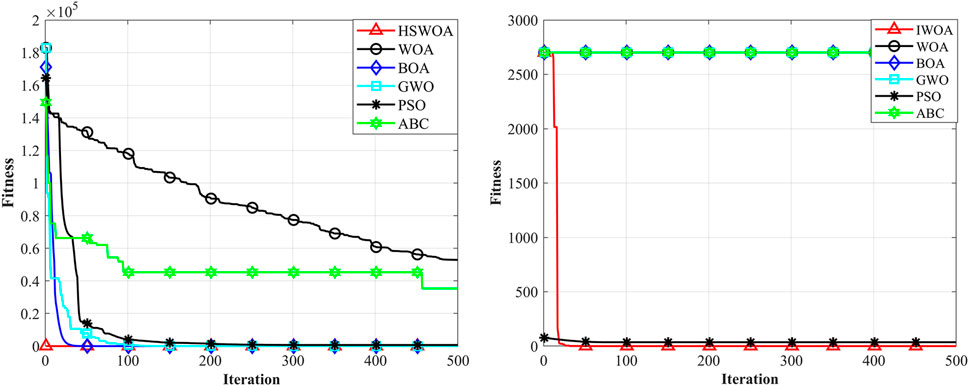
To simulate and test the algorithm, this paper was built on the Intel(R) Core(TM) i9-9980HK CPU, 2.40 GHz main frequency, 32 GB of RAM, and Windows 10 (64-bit) system environment, with MATLAB 2021b serving as the programming tools. Referencing the set of benchmark test functions proposed by Yao et al. (1999), the mean and standard deviation of eight benchmark test functions were selected for comparison in two aspects: F1–F4 are single-peaked benchmark test functions for testing the convergence speed of the algorithm, and F5–F8 are multi-peaked benchmark test functions for testing the algorithm’s ability to jump out of the local optimal solution. The benchmark test function information is displayed in Supplementary Appendix SA. The population size for HSWOA, normal WOA, Butterfly Optimization Algorithm (BOA), Grey Wolf Optimization Algorithm (GWO), PSO, and ABC was set to 30 with a maximum of 500 iterations and 20 runs. Table 1 displays the results of algorithmic performance testing. HSWOA was able to locate the global optimal solution for all single-peaked benchmark test functions, and the output optimal solution was unaffected by the number of algorithm runs, demonstrating robustness, whereas the remaining five comparison algorithms were unable to locate the global optimal solution. Figure 8A depicts the convergence performance of each algorithm for the single-peak benchmark test function F3. At the initial population fitness calculation stage, HSWOA found the global optimal solution thanks to the Sabol sequence, whereas the standard WOA converged more slowly than the other algorithms, indicating that the Sabol sequence for population initialization facilitates the rapid convergence of WOA to the global optimal solution. HSWOA’s overall optimization accuracy in the multi-peak benchmark test function was lower than that of the single-peak benchmark test function, and it only found the global optimal solution in F6. However, the convergence accuracy in all multi-peak benchmark test functions was higher than that of the other algorithms, with the smallest standard deviation in F5 and F6 and only slightly higher than that of ABC in F7 and F8. Figure 8B depicts the convergence performance of each algorithm for the multi-peaked benchmark test function F6. Except for HSWOA and PSO, all algorithms converged to local optimal solutions. Both HSWOA and PSO converged faster, but HSWOA’s convergence accuracy was greater than that of PSO, demonstrating that HSWOA has clear advantages over normal WOA in avoiding the global optimal solution.
4.2 Processes and results for optimizing water allocation at city and county levels
4.2.1 Generate a set of options
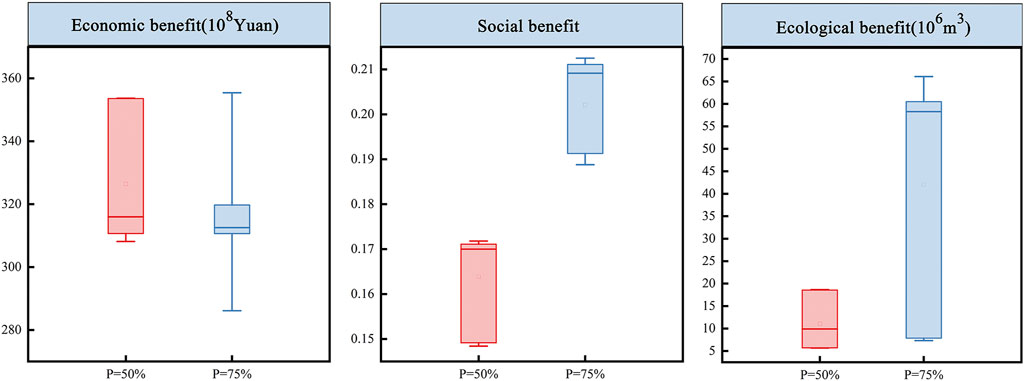
Using HSWOA, the ecological, social, and economic advantages were solved independently, with the number of populations set to 200, the number of iterations set to 350, and the trigger threshold for detecting whales set to 10. The optimal HSWOA outcome varies with the number of iterations. To ensure the efficiency of the optimal solution, the number of HSWOA calculations was set to twenty, and the optimal solution among them was chosen as the final solution. Additionally, the optimal solution of each generation in the optimal solution iteration process was included in the initial set of alternatives, and the remaining two benefits were calculated. A rapid non-dominated sorting approach was developed to filter non-dominated alternatives into the final set of options. Figure 9 depicts benefit values for different level-year option sets in 2025. In terms of economic benefit, the median and average economic benefit were greater in normal flow year than in low flow year. This is mainly because the amount of water available from reservoirs and diversions decreased in low flow years while the Agr increased, resulting in a lower economic benefit overall than in nomal flow year. In terms of social benefit, the median and average social benefit were greater in low flow year than in normal flow year. This is mainly because of the decrease in water availability and increase in water demand in low flow year. This exacerbated the contradiction in water withdrawal for each calculation unit in the sub-basin, resulting in a Gini coefficient of water supply satisfaction that was significantly greater in low flow year than in normal flow year. In terms of ecological benefit, the mean and median ecological benefits were greater in low flow year compared to normal flow year. This is mainly as a result of the reduction in water availability in low flow year, which increased the Inn and Out, and the increase in the Agr, which displaced some of the water that should have been used to meet ecological needs.
4.2.2 The process of optimizing water allocation at city and county levels
The set of options for optimizing water allocation at the city and county levels served as the basis for a fallback bargaining process, with water managers at the city and county levels ranking the options according to their own best interests if the initial options proposed by both parties did not agree. In fallback bargaining, municipal and county water managers made concessions to their respective interests in each round of negotiations, i.e., they selected options that were marginally suboptimal, there was a solution that met both their benefit objectives. Tables 2, 3 illustrate the process of optimizing the allocation of water resources at the municipal and county levels in normal and low flow year. Table 2 illustrates the process of optimizing the allocation of water resources at the municipal and county levels in normal flow year, with both levels proposing ideal solutions and expected targets based on maximizing their respective benefits, i.e., an ideal social benefit value of 0.1484, an ideal ecological benefit value of 5.66 × 10⁶ m3, and an ideal economic benefit value of 353.69×10⁸ yuan. It is evident that the ideal solution numbers proposed by both levels have not been harmonized. Therefore, the fallback bargaining procedure was initiated. During the initial round of fallback bargaining, the parties compromised on their respective benefit objectives, which were still closer to ideal at this stage. Comparisons revealed that no option satisfied both benefit objectives; hence, the following round of fallback bargaining was conducted. Up until Round 10, county water managers presented Option 11, which satisfied both benefit objectives and reached Nash equilibrium, and was therefore the last option recommended for water allocation in normal flow year. In Table 3, city and county water managers were unable to reach an agreement, so they initiated the fallback bargaining procedure. Alternative 10, which satisfied the benefit objectives of both municipal and county water managers, was the final scheme recommended for water allocation in low flow year as the fallback bargaining reached its 28th round.
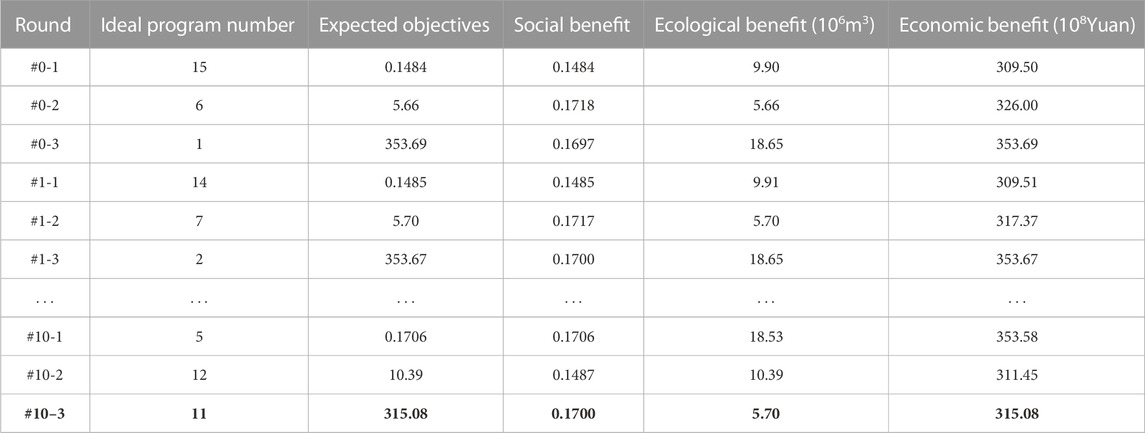
TABLE 2. The process of optimizing water resource allocation at city and county levels in normal flow year.
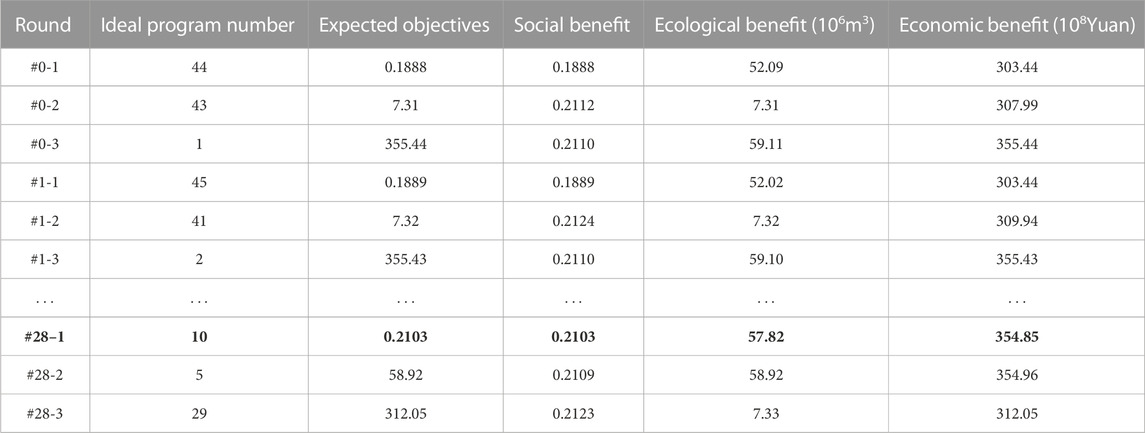
TABLE 3. The process of optimizing water resource allocation at city and county levels in low flow year.
Handan in 2021 is high flow year. Compared with 2021, the economic benefit of the recommended scheme in a normal flow year increases by 28.98 × 10⁸ Yuan, the social benefit decreases by 0.0013, and the ecological benefit decreases by 5.70 × 10⁶ m3. In a low flow year, the economic benefit of the recommended option increases by 67.59 × 10⁸ Yuan, the social benefit increases by 0.039, and the ecological benefit decreases by 57.82 × 10⁶ m3. To further verify the efficiency of this model, the results of water allocation in Handan in 2025, as proposed by Ma et al. (2022) were used to calculate the ecological, social, and economic benefit according to the objective function of this study. The results show that the ecological benefit proposed in this study is reduced by 38.65 × 10⁶ m3, social benefit by 0.3261, and the economic benefit by 38.5 × 10⁸ Yuan in a normal flow year. In a low-flow year, the ecological benefit is reduced by 2.9 × 10⁶ m3, the social benefit by 0.1297, and the economic benefit by 11.09 × 10⁸ Yuan compared to Ma et al. (2022). Therefore, the water resource optimization model proposed in this study significantly improves the equity of inter-regional water supply and significantly reduces the ecological water shortage compared to existing studies. An important factor that makes the economic benefit smaller than existing studies is that the existing studies do not consider the rule that different water sources supply water to different water users, and the amount of available water is larger compared to this study, thus making the economic benefits higher than this study.
4.2.3 Results of optimal water allocation at city and county levels
According to the recommended scheme, the results of water allocation in Handan in normal and low flow year were shown in Figure 10. Figure 10A shows the results of water allocation in Handan in normal flow year. In terms of water supply structure, Grd and Res were the main sources of water supply in Handan, accounting for 36.58% and 33.94% of the total water supply, respectively. Moreover, 48.40% of the Grd and 89.08% of the Res were supplied to Agr, who use the most water. In terms of water supply ratios, the highest ratio of Yel was 100%, followed by Res at 92.82%. However, the ratios of Nor and Ren were significantly lower than the remaining four types of water sources. This indicated that there were certain shortcomings in the spatial layout of these two water sources, with excess supply capacity of Nor and Ren in some regions while the demand for these two water sources in some areas had not been met. This could be addressed through cross-regional trading of water rights through the establishment of a water market to increase the ratio of Nor and Ren. In terms of water supply satisfaction, due to the better ecological benefit of the 2025 normal flow year recommendation, the Inn and Out satisfaction rates were significantly higher than the rest of the water users, at 100.00% and 96.38%, respectively. On the other hand, the Agr satisfaction rate was the lowest at 60.72%. Agr should be reduced in the future by promoting water-saving irrigation facilities and adjusting crop cultivation structures.
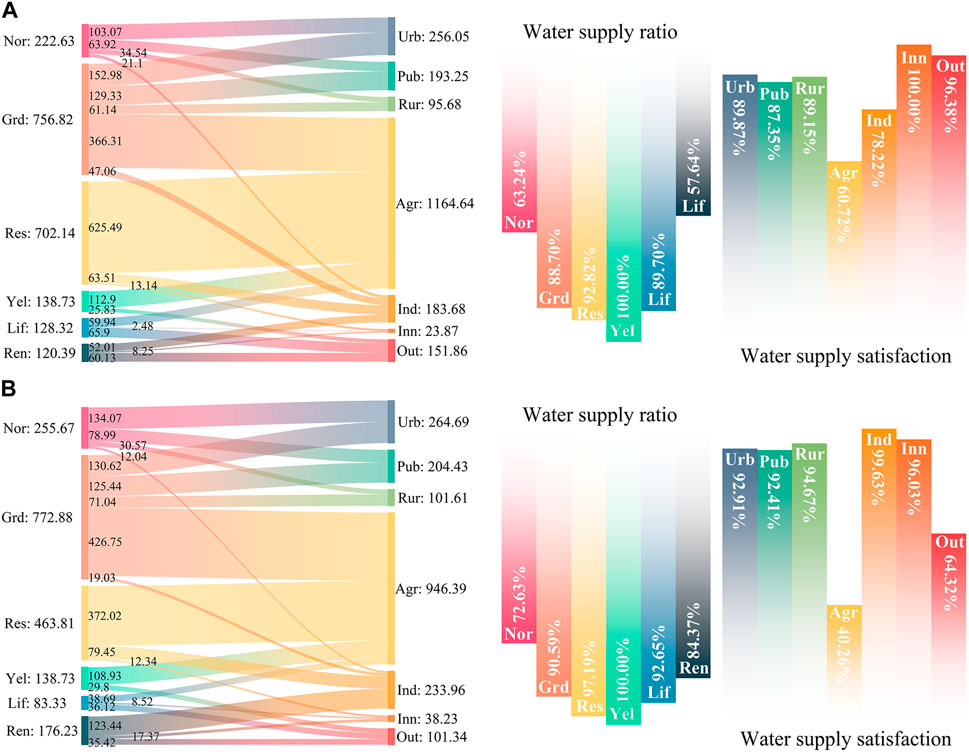
FIGURE 10. The results of optimal allocation of water resources in Handan in normal and low flow year (106m3). (A) Normal year (B) Low flow year.
Figure 10B shows the results of the optimal allocation of water resources in Handan in low flow year. Compared to normal flow year, the Res and Lif were significantly reduced due to a lack of natural water supply, and the remaining sources increased their water supply to mitigate losses from reduced supply. A 33.94% reduction in Res resulted in an 18.74% reduction in Agr compared to normal flow year. When compared to normal flow year, a 35.06% reduction in the amount of water supplied by the lake resulted in a 33.27% reduction in the amount of Out. In terms of water supply ratios, due to the decrease in natural water supply, the ratio of water supply from all sources had increased compared to normal flow year, with the ratio from Nor still being the smallest. In terms of water supply satisfaction, due to the better economic benefit of the recommended scheme in low flow year, water supply satisfaction among water users with higher economic benefit (Urb, Pub, Rur, and Ind) all increased significantly compared to normal flow year, especially the Ind, which increased from 78.22% to 99.63% in normal flow year. On the other hand, the Inn, Out, and Agr decreased significantly compared to normal flow year, with the largest decrease being in the amount of the Out, from 96.38% to 64.32% in normal flow year, reflecting the contradiction and conflict between economic and ecological benefits.
4.3 Relationship between the nash equilibrium solution and the pareto solution
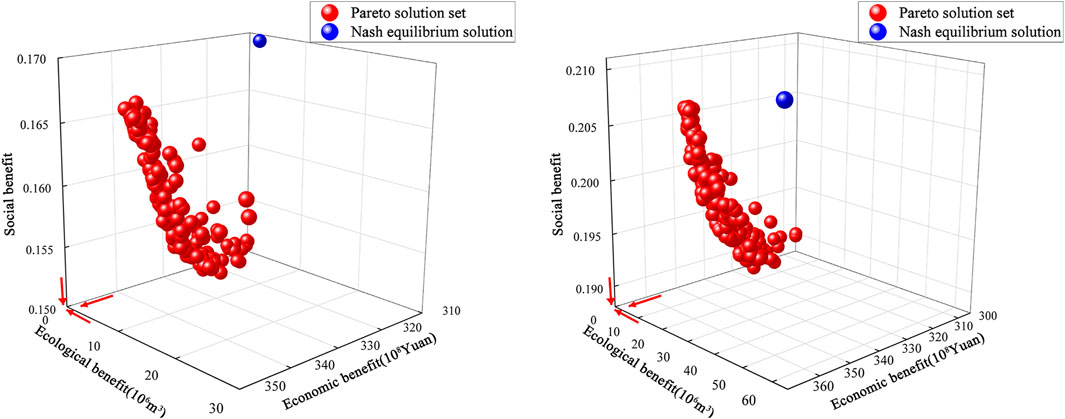
Water resources have both public good and market characteristics. In a certain region, especially in water-scarce areas, limited freshwater resources are faced with the problems of safeguarding ecological needs, maintaining stable social development, and generating economic returns. Therefore, the Pareto solution is an ideal state that balances the public good and the market nature of water resources. To compare the connection between the Pareto solution set generated by conventional multi-objective optimization models and the Nash equilibrium solution obtained in this research, NSGA-III was implemented to solve the optimal water resource allocation problem for Handan. NSGA-III is an enhancement on NSGA-II by Deb et al. (Deb and Jain, 2013), which introduces a reference point technique to individual selection and has good performance in solving high-dimensional multi-objective optimization problems (3–15 goals) (Lyu et al., 2022). The initial number of populations was set to 200, the number of reference points was set to 20, and the maximum number of iterations was set to 350 (consistent with HSWOA). Moreover, the crossover probability was set to 0.90, and the variance probability was set to 0.05. The set of Pareto solutions and Nash equilibrium solutions for the optimal allocation of water resources in Handan at different level years in 2025 are shown in Figure 11. NSGA-III developed a Pareto solution set with strong convergence and homogeneity. Although the Nash equilibrium solution was at a certain distance from the Pareto solution set, the ecological benefit of the Nash equilibrium solution in normal flow year was greater than the full Pareto solution set. Furthermore, the economic benefit of the Nash equilibrium solution in low flow year was also greater than the full Pareto solution set. Consequently, the Nash equilibrium solution obtained from the optimal allocation of water resources at city and county levels proposes the optimal allocation of water resources at city and county levels. This model eliminates the requirement to construct a Pareto solution set and then filter the optimal solution, unlike conventional multi-objective optimization techniques. The proposed Nash equilibrium solution satisfied the efficiency objectives of all the subjects involved in the decision and was therefore easier to apply to practical water resource planning and management.
5 Conclusion
The implementation of water allocation plans has been hindered by the conflicting interests of several tiers of water resource management within the region. This paper proposes a model for optimizing the allocation of water resources by coordinating the interests of different levels of water resource managers. The model consists of three main components: 1) The generation of initial alternatives. 2) The screening of initial alternatives. 3) The search for recommended schemes through fallback bargaining. In presenting the initial possibilities, the study presented the HSWOA in order to optimize the early advantages for water resource managers at various administrative levels. During the preliminary screening of alternatives, a rapid non-dominated sorting approach was implemented to pick non-dominated alternatives from the preliminary alternatives. The model was used in Handan, China, to propose an optimal allocation of water resources that fulfilled the interests of municipal and county water managers in normal and low flow year in 2025. It was also compared to the Pareto solution set created by NSGA-III. The particular results were as follows:
(1) In the single-peak benchmark test function solution, HSWOA was able to swiftly converge to the global optimal solution at the start of the run. Moreover, the calculation results did not change as the number of runs increased, indicating that the algorithm is highly robust. HSWOA fared less well while solving the multi-peak benchmark test function than when solving the single-peak benchmark test function. However, its convergence accuracy was still superior to the other comparative algorithms.
(2) The values of the benefits of the alternative sets varied significantly under various incoming water conditions. The median and mean economic benefit values were somewhat lower in low flow year compared to normal flow years. In terms of societal and ecological benefit, the median and mean values for low flow year were much greater than for normal flow year.
(3) The fallback bargaining reflected the process and decision-making behavior of municipal and county-level water resource managers to reconcile competing interests. Besides, the proposed recommendation reached a Nash equilibrium. There was some difference in the scenarios advised for various incoming water scenarios. In terms of water supply, the ratio of water supply from each source was lower in years of normal precipitation than in years of drought. On the water demand side, water satisfaction for Agr, Inn, and Out was greater in years with average precipitation than in low flow year. The social and ecological benefits of normal flow year were greater than those of low flow year, although the economic gain was smaller.
(4) Compared to the Pareto solution set found by NSGA-III, the recommended schemes in normal and low flow years were on the Pareto frontier. This means that the recommended schemes met both Pareto optimality and Nash equilibrium, taking both overall and individual interests into account. In a normal flow year, the recommended scheme could yield an economic benefit of 315.08×10⁸ Yuan, a social benefit of 0.1700, and an ecological benefit of 5.70 × 10⁶ m3. However, in a low flow year, the recommended scheme could yield an economic benefit of 354.85×10⁸ Yuan, a social benefit of 0.2103, and an ecological benefit of 57.82 × 10⁶ m3. Compared to existing studies, the recommended scheme proposed in this study has clear advantages in terms of social and ecological benefits.
In order to apply the recommended water allocation schemes proposed in this study to actual water resource management, it is recommended that municipal water resource managers develop regional water allocation schemes based on the recommended schemes, specifying the water rights of different water sources owned by each county water resource manager. Based on the recommended schemes and the water rights obtained, the county water managers will allocate the water rights within the region to various water users through the issuance of abstraction permits. As a result, ensuring that the recommended schemes can be applied to the actual management of water resources in the region.
The limitations of this study warrant further research. First, this study is based on the optimal allocation of water resources based on defined incoming water conditions and water demand. However, due to climate change and human activities, there is a certain degree of uncertainty in the annual supply and demand of water at the planning level. Moreover, the concept of intervals could be considered in the future to characterize the uncertainty in water supply and demand. Second, this study only discusses the conflict of interest between different levels of water resource managers. In fact, there is also a conflict of interest between water resource managers, water conservancy project operators, and water users regarding the optimal allocation of water resources. In the future, consideration could be given to reconciling the interests of these three parties in optimizing the allocation of water resources in order to arrive at a more satisfactory solution.
Data availability statement
The original contributions presented in the study are included in the article/Supplementary Material, further inquiries can be directed to the corresponding authors.
Author contributions
SZ: Conceptualization, Methodology, Software, and Writing—Original draft. GF: Methodology, Writing—Original draft, Writing—Review and Editing. DZ: Financial aid, Data collection and Investigation. MJ: Conceptualization, Data calculation, and Supervision. HZ: Data curation and Visualization.
Funding
This work was supported by Hebei Provincial Key Research Projects (CN) (grant number 21374201D).
Acknowledgments
The authors are grateful to the reviewers and the editors for their helpful comments and assistance.
Conflict of interest
The authors declare that the research was conducted in the absence of any commercial or financial relationships that could be construed as a potential conflict of interest.
Publisher’s note
All claims expressed in this article are solely those of the authors and do not necessarily represent those of their affiliated organizations, or those of the publisher, the editors and the reviewers. Any product that may be evaluated in this article, or claim that may be made by its manufacturer, is not guaranteed or endorsed by the publisher.
Supplementary material
The Supplementary Material for this article can be found online at: https://www.frontiersin.org/articles/10.3389/fenvs.2023.1152296/full#supplementary-material
References
Avarideh, F., Attari, J., and Moridi, A. (2017). Modelling equitable and reasonable water sharing in transboundary rivers: The case of sirwan-diyala river. Water Resour. Manage 31, 1191–1207. doi:10.1007/s11269-017-1570-4
Brams, S. J., and Kilgour, D. M. (2001). Fallback bargaining. Group Decis. Negot. 10, 287–316. doi:10.1023/A:1011252808608
Dai, C., Qin, X. S., Chen, Y., and Guo, H. C. (2018). Dealing with equality and benefit for water allocation in a lake watershed: A gini-coefficient based stochastic optimization approach. J. Hydrology 561, 322–334. doi:10.1016/j.jhydrol.2018.04.012
Deb, K., and Jain, H. (2013). An evolutionary many-objective optimization algorithm using reference-point-based nondominated sorting approach, part I: solving problems with box constraints. IEEE transactions on evolutionary computation 18 (4), 577–601.
Deb, K., Pratap, A., Agarwal, S., and Meyarivan, T. (2002). A fast and elitist multiobjective genetic algorithm: NSGA-II. IEEE Trans. Evol. Comput. 6, 182–197. doi:10.1109/4235.996017
Deng, L., Guo, S., Yin, J., Zeng, Y., and Chen, K. (2022). Multi-objective optimization of water resources allocation in Han River basin (China) integrating efficiency, equity and sustainability. Sci. Rep. 12, 798. doi:10.1038/s41598-021-04734-2
Dokeroglu, T., Sevinc, E., Kucukyilmaz, T., and Cosar, A. (2019). A survey on new generation metaheuristic algorithms. Comput. Industrial Eng. 137, 106040. doi:10.1016/j.cie.2019.106040
Facchinei, F., and Kanzow, C. (2010). Generalized Nash equilibrium problems. Ann. Operations Res. 175, 177–211. doi:10.1007/s10479-009-0653-x
Fang, G., Guo, Y., Wen, X., Fu, X., Lei, X., Tian, Y., et al. (2018). Multi-objective differential evolution-chaos shuffled frog leaping algorithm for water resources system optimization. Water Resour. Manag. 32, 3835–3852. doi:10.1007/s11269-018-2021-6
Grové, B. (2019). Improved water allocation under limited water supplies using integrated soil-moisture balance calculations and nonlinear programming. Water Resour. Manag. 33, 423–437. doi:10.1007/s11269-018-2110-6
Guo, W., Liu, T., Dai, F., and Xu, P. (2020). An improved whale optimization algorithm for forecasting water resources demand. Appl. Soft Comput. 86, 105925. doi:10.1016/j.asoc.2019.105925
Hatamkhani, A., KhazaiePoul, A., and Moridi, A. (2022). Sustainable water resource planning at the basin scale with simultaneous goals of agricultural development and wetland conservation. J. Water Supply Res. Technology-Aqua 71, 768–781. doi:10.2166/aqua.2022.025
Jin-Yan, L., Lan-Bo, C., Miao, D., and Ali, A. (2021). Water resources allocation model based on ecological priority in the arid region. Environ. Res. 199, 111201. doi:10.1016/j.envres.2021.111201
Joe, S., and Kuo, F. Y. (2003). Remark on algorithm 659: Implementing Sobol’s quasirandom sequence generator. ACM Trans. Math. Softw. 29, 49–57. doi:10.1145/641876.641879
Khalil, A., Rittima, A., and Phankamolsil, Y. (2018). The projected changes in water status of the Mae Klong Basin, Thailand, using WEAP model. Paddy and Water Environment 16, 439–455.
Kennedy, J., and Eberhart, R. (1995). Particle swarm optimization. Proc. ICNN’95 - Int. Conf. Neural Netw. 4, 1942–1948. doi:10.1109/ICNN.1995.488968
Lee, C.-S. (2012). Multi-objective game-theory models for conflict analysis in reservoir watershed management. Chemosphere 87, 608–613. doi:10.1016/j.chemosphere.2012.01.014
Li, M., Yang, X., Wu, F., and Babuna, P. (2022). Spatial equilibrium-based multi-objective optimal allocation of regional water resources. J. Hydrology Regional Stud. 44, 101219. doi:10.1016/j.ejrh.2022.101219
Li, X., Wang, X., Guo, H., and Ma, W. (2020). Multi-water resources optimal allocation based on multi-objective uncertain chance-constrained programming model. Water Resour. Manag. 34, 4881–4899. doi:10.1007/s11269-020-02697-z
Liu, D., Guo, S., Liu, P., Zou, H., and Hong, X. (2019). Rational function method for allocating water resources in the coupled natural-human systems. Water Resources Management 33, 57–73.
Loucks, D. P., and Van Beek, E. (2017). Water resource systems planning and management: An introduction to methods, models, and applications. Springer.
Lyu, J., Jiang, Y., Xu, C., Liu, Y., Su, Z., and Liu, J. (2022). Multi-objective winter wheat irrigation strategies optimization based on coupling AquaCrop-OSPy and NSGA-III: A case study in Yangling, China. Science of The Total Environment 843 (4), 157104
Ma, J., Liu, H., Wu, W., Zhang, Y., and Dong, S. (2022). Research on optimal allocation of water resources in handan city based on the refined water resource allocation model. Water 15, 154. doi:10.3390/w15010154
Mirjalili, S., and Gandomi, A. H. (2017). Chaotic gravitational constants for the gravitational search algorithm. Appl. Soft Comput. 53, 407–419. doi:10.1016/j.asoc.2017.01.008
Mirjalili, S., and Lewis, A. (2016). The whale optimization algorithm. Adv. Eng. Softw. 95, 51–67. doi:10.1016/j.advengsoft.2016.01.008
Moradi, S., and Limaei, S. M. (2018). Multi-objective game theory model and fuzzy programing approach for sustainable watershed management. Land Use Policy 71, 363–371. doi:10.1016/j.landusepol.2017.12.008
Sohrabi, M., Ahani Amineh, Z. B., Niksokhan, M. H., and Zanjanian, H. (2022). A framework for optimal water allocation considering water value, strategic management and conflict resolution. Environ. Dev. Sustain., 1–32.
Sone, J. S., Araujo, T. F., Gesualdo, G. C., Ballarin, A. S., Carvalho, G. A., Oliveira, P. T. S., et al. (2022). Water security in an uncertain future: Contrasting realities from an availability-demand perspective. Water Resour. Manage 36, 2571–2587. doi:10.1007/s11269-022-03160-x
Wang, T., Jian, S., Wang, J., and Yan, D. (2022). Dynamic interaction of water–economic–social–ecological environment complex system under the framework of water resources carrying capacity. J. Clean. Prod. 368, 133132. doi:10.1016/j.jclepro.2022.133132
Wei, C. J., and Wang, H. (2007). Generalization of regional water resources deployment network chart. J. Hydraul. Eng. 9, 1103–1108.
Yan, B., Jiang, H., Zou, Y., Liu, Y., Mu, R., and Wang, H. (2022). An integrated model for optimal water resources allocation under “3 Redlines” water policy of the upper Hanjiang river basin. J. Hydrology Regional Stud. 42, 101167. doi:10.1016/j.ejrh.2022.101167
Yan, Z., Baetz, B., and Li, Z. (2021). A cloud-based dual-objective nonlinear programming model for irrigation water allocation in Northwest China. J. Clean. Prod. 308, 127330. doi:10.1016/j.jclepro.2021.127330
Yan, Z., Sha, J., Liu, B., Tian, W., and Lu, J. (2018). An ameliorative whale optimization algorithm for multi-objective optimal allocation of water resources in Handan, China. Water 10, 87. doi:10.3390/w10010087
Yan, Z., Zhou, Z., Liu, J., Wen, T., Sang, X., and Zhang, F. (2020). Multiobjective optimal operation of reservoirs based on water supply, power generation, and river ecosystem with a new water resource allocation model. Journal of Water Resources Planning and Management 146 (12), 05020024
Yang, W., Xia, K., Fan, S., Wang, L., Li, T., Zhang, J., et al. (2022). A multi-strategy Whale optimization algorithm and its application. Eng. Appl. Artif. Intell. 108, 104558. doi:10.1016/j.engappai.2021.104558
Yao, L., Xu, Z., and Chen, X. (2019). Sustainable water allocation strategies under various climate scenarios: A case study in China. J. Hydrology 574, 529–543. doi:10.1016/j.jhydrol.2019.04.055
Yao, X., Liu, Y., and Lin, G. (1999). Evolutionary programming made faster. IEEE Transactions on Evolutionary computation 3 (2), 82–102.
Yin, X., Cheng, L., Wang, X., Lu, J., and Qin, H. (2019). Optimization for hydro-photovoltaic-wind power generation system based on modified version of multi-objective whale optimization algorithm. Energy Procedia 158, 6208–6216. doi:10.1016/j.egypro.2019.01.480
Yousefi, H., and Moridi, A. (2022). Multiobjective optimization of agricultural planning considering climate change impacts: Minab reservoir upstream watershed in Iran. J. Irrigation Drainage Eng. 148, 04022007. doi:10.1061/(ASCE)IR.1943-4774.0001675
Yu, Y., Zhao, R., Zhang, J., Yang, D., and Zhou, T. (2021). Multi-objective game theory optimization for balancing economic, social and ecological benefits in the Three Gorges Reservoir operation. Environ. Res. Lett. 16, 085007. doi:10.1088/1748-9326/ac0b69
Yuan, M., Chen, X., Liu, G., and Ren, H. (2022). Coordinated allocation of water resources and wastewater emission permits based on multi-objective optimization model: From the perspective of conflict between equity and economic benefits. J. Clean. Prod. 372, 133733. doi:10.1016/j.jclepro.2022.133733
Yue, W., Yu, S., Xu, M., Rong, Q., Xu, C., and Su, M. (2022). A Copula-based interval linear programming model for water resources allocation under uncertainty. J. Environ. Manag. 317, 115318. doi:10.1016/j.jenvman.2022.115318
Zeng, X., Li, T., Chen, C., Si, Z., Huang, G., Guo, P., et al. (2018). A hybrid land-water-environment model for identification of ecological effect and risk under uncertain meteorological precipitation in an agroforestry ecosystem. Sci. Total Environ. 633, 1613–1628. doi:10.1016/j.scitotenv.2018.03.224
Zeng, X. T., Li, Y. P., Huang, G. H., and Liu, J. (2015a). A two-stage interval-stochastic water trading model for allocating water resources of Kaidu-Kongque River in northwestern China. J. Hydroinformatics 17, 551–569. doi:10.2166/hydro.2015.090
Zeng, X., Yang, X., Yu, L., and Chen, H. (2015b). A mix inexact-quadratic fuzzy water resources management model of floodplain (IQT-WMMF) for regional sustainable development of dahuangbaowa, China. Water 7, 2771–2795. doi:10.3390/w7062771
Zhuang, X. W., Li, Y. P., Huang, G. H., and Zeng, X. T. (2015). An inexact joint-probabilistic programming method for risk assessment in water resources allocation. Stoch. Environ. Res. Risk Assess. 29, 1287–1301. doi:10.1007/s00477-014-1008-y
Nomenclature
l The number of sub-basins in the region
k The number of water allocation calculation units in the region (a calculation unit is the smallest area involved in the optimal allocation of water resources)
j The water users
i The water supply source
Keywords: optimal allocation of water resources, game theory, multi-level water resources managers, whale optimization algorithm (WOA), fallback bargaining
Citation: Zhang S, Fang G, Zhang D, Ju M and Zhong H (2023) Water resources optimal allocation model for coordinating regional multi-level water resources managers’ interests. Front. Environ. Sci. 11:1152296. doi: 10.3389/fenvs.2023.1152296
Received: 27 January 2023; Accepted: 22 February 2023;
Published: 08 March 2023.
Edited by:
Yuankun Wang, North China Electric Power University, ChinaReviewed by:
Ali Moridi, Shahid Beheshti University, IranXueting Zeng, Capital University of Economics and Business, China
Copyright © 2023 Zhang, Fang, Zhang, Ju and Zhong. This is an open-access article distributed under the terms of the Creative Commons Attribution License (CC BY). The use, distribution or reproduction in other forums is permitted, provided the original author(s) and the copyright owner(s) are credited and that the original publication in this journal is cited, in accordance with accepted academic practice. No use, distribution or reproduction is permitted which does not comply with these terms.
*Correspondence: Guohua Fang, aGh1ZmdoQDE2My5jb20=; Dasheng Zhang, MTg1MDEzMTc0NDNAMTYzLmNvbQ==
 Shiwei Zhang
 Guohua Fang
 Dasheng Zhang2*