 Yuzhuo Peng
 Anmin Duan
 Chao Zhang1
 Xuejie Zhao
94% of researchers rate our articles as excellent or good
Learn more about the work of our research integrity team to safeguard the quality of each article we publish.
Find out more
ORIGINAL RESEARCH article
Front. Environ. Sci., 07 March 2023
Sec. Atmosphere and Climate
Volume 11 - 2023 | https://doi.org/10.3389/fenvs.2023.1152129
This article is part of the Research TopicImpact of Climate Change on the Human Living EnvironmentView all 24 articles
The surface air temperature (SAT) over the Tibetan Plateau (TP) not only affects the physical processes such as local evaporation, snow melting, and glacier ablation, but also has a great impact on the downstream regions and even the global climate change. The development of reanalysis data has gradually overcome the problem of sparse stations over the TP, but there are still some deficiencies. Therefore, the distance between indices of simulation and observation (DISO) method is used to calculate the distance between five reanalysis datasets (ERA5, JRA-55, ERA-Interim, MERRA2, NCEP2) and the CMFD to evaluate the abilities of different reanalysis datasets to capture the SAT over the TP in different seasons. The results indicate that ERA-Interim has a higher ability to reproduce the SAT over the TP in spring and summer, while it is ERA5 in autumn and winter. It should be noted that although the optimal reanalysis has a better performance in capturing the SAT of the TP, there are still a certain degree of deviations in their spatial fields. We further show the spatial deviation fields of SAT over the TP corresponding to the optimal reanalysis data in different seasons, and analyze the possible reasons. The result implies that the SAT deviation field is mainly related to the snow in winter and spring, while the summer SAT deviation field is mainly related to the water vapor, and the autumn is related to both the snow and the water vapor fields. Overall, the quality of reanalysis data needs to be further improved in the future.
The Tibetan Plateau (TP) with an average elevation of more than 4,000 m is close to the middle of the troposphere (Qiu, 2008; Yao et al., 2012; Kuang and Jiao, 2016), which locates the first level of terrain in China and also called as “Asian Water Tower” (Xu et al., 2008; Xu et al., 2019; Xue et al., 2021). Covering an area of about 2.5 million square kilometers, the TP is crisscrossed by mountains and dotted with lakes and known as a typical region of the multi-sphere interactions in the Earth’s climate system (Lei et al., 2013; Lei et al., 2017; Yao et al., 2015; Chen et al., 2021). Due to its special geographical location and topographic distribution, small environmental disturbances and changes can result in the “butterfly effect” of the climate system and ecological environment in this region, thus the TP is also the sensitive and the amplifying area of the global climate change (Yang et al., 2013; You et al., 2020; Tang et al., 2022; Wang et al., 2022).
In the context of global warming, the surface air temperature (SAT) over the TP has increased substantially (Duan and Xiao, 2015; Duan et al., 2020; You et al., 2021; Zhou and Zhang, 2021), and the resultant thermal forcing changes have a significant impact on regional and global climate. For example, the increase of the spring SAT over the TP will influence the surface sensible heat flux (SSHX), and the change of the SSHX will further affect the downstream East Asian summer monsoon precipitation and North Pacific sea surface temperature (Duan et al., 2011; Wang et al., 2014; Sun et al., 2019; Liu et al., 2020); meanwhile, the warming of the TP can enhance the intensity and frequency of the warmest day and night over it (You et al., 2008; 2021); on the other hand, drastic changes have also occurred in its cryosphere, such as the accelerated melting of snow and glaciers, which reduces the surface albedo and forms a positive feedback to promote the TP warming (Li et al., 2016; Li et al., 2017; Dai et al., 2017; Xu et al., 2017; Zhang et al., 2021). All these changes may accelerate the pace of the TP to become a global tipping point (Liu et al., 2023)
However, due to the complex terrain characteristic of the TP, most conventional meteorological observation stations are located in the valleys and relatively low-altitude areas in the central and eastern plateau, and there are few stations in its western region (Duan et al., 2018; Duan et al., 2022a), where there exist a large number of glaciers and permafrost (Yang et al., 2019; Wang et al., 2020). Therefore, the sparse and uneven distribution of observational stations is the primary difficulty in accurately understanding the climate change on the TP.
The gridded reanalysis datasets are generated by assimilating the observational data obtained by ground stations, satellite remote sensing, aircraft and ships into the numerical model, which has the advantages of long time and wide coverage area (Dee et al., 2011; Rienecker et al., 2011; Kobayashi et al., 2015; Hersbach et al., 2020), providing us important database for understanding atmospheric circulation and global and regional climate change (Simmons et al., 2004; Yi et al., 2011; Lei et al., 2017; Liu et al., 2021; Tang et al., 2022). The development of reanalysis data overcomes the problem of sparse stations and has been widely used in the study of climate change on the TP (Chen et al., 2019; 2020; Chen et al., 2021; Sheng et al., 2021; 2022). Nonetheless, due to differences of the observational data, numericalmodels and assimilation methods used in the different reanalysis datasets, the results obtained from different reanalysis datasets may be different particularly in mountain areas (Wang et al., 2020; Liu et al., 2021; Peng et al., 2021; Yang et al., 2021). Therefore, the purpose of this paper is to use the DISO (distance between indices of simulation and observation) method (Hu et al., 2019; 2022; Zhou et al., 2021) to evaluate the ability of capturing the SAT over the TP among different reanalysis datasets in different seasons, so as to lay a foundation for better research on the temperature change of the TP.
The observational data used in this paper are monthly average surface air temperature named as China Meteorological Forcing Dataset (CMFD) and daily average snow depth in China provided by A Big Earth Data Platform for Three Poles. The spatial resolution of CMFD data is 0.1° × 0.1° and the period covers from 1979 to 2018. This dataset is merged into remote sensing products, reanalysis datasets, and meteorological station data (He et al., 2020), and has a good performance over the TP (Lun et al., 2021; Peng et al., 2022), which can be regarded as observational data. In addition, the daily average snow depth in China, with the spatial resolution of 0.25 ° × 0.25 ° and a time range of 1979–2019 (Che et al., 2008; Dai et al., 2015), is widely used over the TP (Duan and Xiao, 2015; Bao and You, 2019). The domain of the TP is defined as the region above 2500 m within the range of 25°–40°N and 70°–105°E.
The atmospheric reanalysis datasets include ERA-Interim (Dee et al., 2011) and ERA5 (Hersbach et al., 2020) provided by the European Center for Medium-Range Weather Forecast (ECWMF). The ERA5 dataset is the fifth-generation reanalysis product developed by ECMWF. Compared with ERA-Interim data, the ERA5 data has the advantages of higher spatial-temporal resolution and longer covered time. The variables including the monthly average surface air temperature, snow depth and three-dimensional specific humidity from 1979–2019 provided by ERA-Interim and ERA5, with the spatial resolution is 1° × 1° and 0.25° × 0.25°, respectively. Furthermore, we also use the monthly mean surface air temperature datasets from JRA-55 (Kobayashi et al., 2015), MERRA2 (Rienecker et al., 2011; Gelaro et al., 2017) and NCEP2 (Kalnay et al., 1996), which are provided by the Japan Meteorological Agency (JMA), National Aeronautics and Space Administration (NASA) and National Centers for Environmental Prediction (NCEP), respectively. The coverage time of the JRA-55 and NCEP2 datasets are 1979–2019, while MERRA2 is 1980–2019 and the spatial resolutions are 1.25° × 1.25°, 2.5° × 2.5°, and 0.5° × 0.625°, respectively. The detailed information about the reanalysis datasets is listed in Table 1.
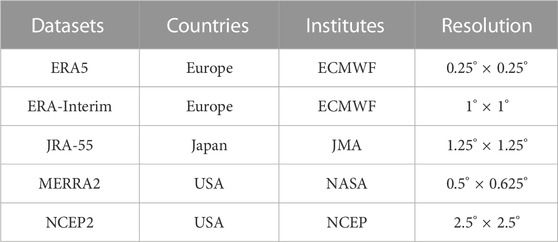
TABLE 1. The reanalysis datasets used the study.
Considering the consistency of data coverage time, the comparison period between the SAT of the reanalysis datasets and the CMFD is 1980–2018. All the observational and reanalysis data are uniformly interpolated to the spatial resolution of 0.5° × 0.5°.
The DISO (distance between indices of simulation and observation) method is a means of evaluating data quality. Its essence is to calculate the distance between the simulated and observed data. The smaller the distance, the higher the quality of simulated data (Hu et al., 2019; Hu et al., 2022; Zhou et al., 2021). The advantage of this method is that it is simple, convenient and flexible, reflecting the idea of Da Dao Zhi Jian (Hu et al., 2022). Researchers can choose the corresponding evaluation index according to their own needs, and the calculation of DISO value can be extended to multi-dimensional space. Therefore, the method is able to evaluate the data comprehensively and can be applied to many disciplines, such as meteorological and disease studies (Cui et al., 2020; Hu et al., 2020; Deng et al., 2021; Wang et al., 2021; Xu et al., 2022; Yin et al., 2022).
In this paper, three metrics (trend, climatology, and interannual variability) are selected to calculate the deviations between the reanalysis datasets and the CMFD by the DISO method. Given that the different magnitudes of the deviations, the deviation of each metric should be normalized before calculating the DISO value. The equation for calculating the DISO value is as follows:
where
Taking the year 1980 as an example, the spring mean value is defined as the average of March, April, and May, the summer mean value is defined as the average of June, July, and August, the autumn mean value is defined as the average of September, October, and November and the winter mean value is defined as the average of December 1980, January and February 1981.
Figure 1A implies that the TP has the most intense warming of 0.7°C/decade in winter, followed by 0.55°C/decade in autumn, and about 0.3°C/decade in spring and summer. Although the reanalysis datasets capture the characteristics of severe warming over the TP in winter, the amplitude of the warming trend is underestimated relative to the observation. The winter warming trend of 0.5°C per decade in ERA5 is the closest to the observation, and the deviation is the largest for the MERRA2 data, which is only 0.27°C/decade. In autumn, the warming trends displayed by the five sets of reanalysis datasets are still weak. The result of ERA5 is the closest to the CMFD, while the NCEP2 has the strongest bias. In spring and summer, except for NCEP2, the deviation of the warming trends presented by other reanalysis data have weakened compared with the counterpart in autumn and winter, and are closer to the observation (Figure 1A). In terms of climatology (Figure 1B), the CMFD shows that the winter temperature over the TP is about −13°C, and the ERA5 and NCEP2 have cold biases, while other reanalysis data have warm biases. Compared with the results of the trend, the reanalysis datasets present a smaller deviation of the winter temperature climatology. In summer, except for JRA-55, the climatology presented by the other reanalysis data are almost consistent with the observed values. In spring and autumn, the ERA5 and NCEP2 have weaker cold biases, and the ERA-Interim and MERRA2 have weaker warm biases, while the JRA-55 has stronger warm biases. For the interannual variability, the CMFD data displays the strongest interannual variability in winter, and all the reanalysis datasets reproduce this feature, among which the ERA5 and NCEP2 are the closest to observation, while the MERRA2 is the worst. In other seasons, the results of the ERA5 exhibit stronger interannual variability relative to the observations, and the JRA-55, MERRA2, and ERA-Interim exhibit weaker interannual variability, while the interannual variability given by the NCEP data is stronger in spring and weaker in summer and autumn (Figure 1C).
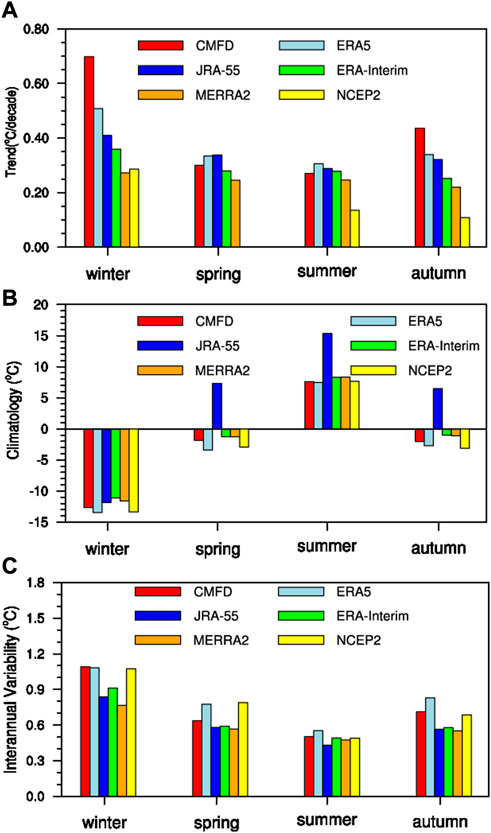
FIGURE 1. (A) Trends (°C/decade), (B) climatology (°C), and (C) interannual variability (°C) of surface air temperature (SAT) over the Tibetan Plateau (TP) among the different datasets for four seasons. The color of red, light blue, blue, green, orange, and yellow represents the observational data CMFD, ERA5, JRA-55, ERA-Interim, MERRA2, and NCEP2 data, respectively.
Clearly, the five sets of reanalysis data have different ability in reproducing the trend, climatology and interannual variability of SAT over the TP in different seasons. Therefore, we select three factors to comprehensively evaluate the ability of the reanalysis datasets to capture the SAT over the TP in different seasons by the DISO method. According to the DISO values, the ability of the reanalysis data to reproduce the winter temperature over the TP from strong to weak is: ERA5, NCEP2, JRA-55, ERA-Interim, MERRA2 (Figure 2A). The ranking is ERA-Interim, MERRA2, ERA5, JRA-55, NCEP2 in spring (Figure 2B), while it is ERA-Interim, MERRA2, ERA5, NCEP2, JRA-55 in summer (Figure 2C) and ERA5, ERA-Interim, NCEP2, MERRA2, JRA-55 in autumn (Figure 2D).
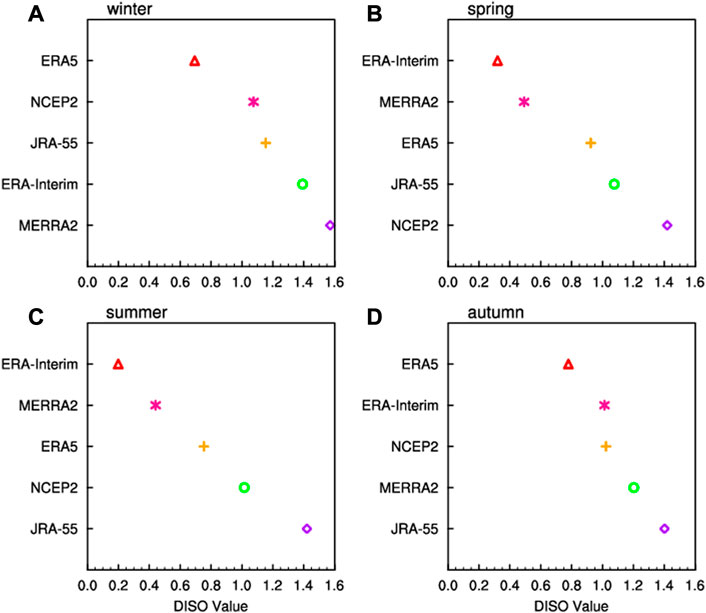
FIGURE 2. The ability of different reanalysis datasets to capture the SAT over the TP in winter (A), spring (B), summer (C) and autumn (D). The smaller the DISO value, the better quality of the data.
Generally, the ERA-Interim has the highest quality among these reanalysis data in spring and summer, while it is ERA5 in autumn and winter. It is worth noting that although the capturing ability of the ERA-Interim in spring and summer and the ERA5 in autumn and winter is better than other reanalysis data, the DISO values are about 0.3 and 0.8 respectively, indicating that there still exist some deviations with the observation even for the optimal reanalysis data. Figure 3 shows the spatial distribution of spring surface air temperature over the TP from the CMFD and ERA-Interim. The ERA-Interim shows that the spring warming is weaker over the most parts of the TP (Figure 3B) relative to the observation (Figure 3A), and the bias field also reflects this feature (Figure 3C). For the climatology, the SAT fields of the ERA-Interim and the observation are generally consistent (Figure 3D; Figure 3E), while the deviation field implies that the ERA-Interim has a warm bias in most areas of the TP (Figure 3F). Figure 3I demonstrates that the interannual variability given by ERA-Interim on the TP is weaker compared with the observation (Figure 3G). Considering the ERA5 is the improved version of the ERA-Interim, we also further analyzed the SAT bias field of the ERA5 dataset. Supplementary Figure S1C reveals that the spring SAT trend deviation field in ERA5 is similar to that in Figure 3C, and there is a cold bias over the most parts of the TP. The difference is that the ERA5 data has a cold bias for climatology (Supplementary Figure S1F) and the strong interannual variability (Supplementary Figure S1I) over the most areas of the TP. The previous study pointed out that the temperature change over the TP in spring was mainly related to the surface albedo (Gao et al., 2019). Figure 4 and Supplementary Figure S2 present the variation of snow depth for the observations, ERA-Interim and ERA5. It can be found that compared with observations, the snow depth decline trends captured by the ERA-interim and ERA5 are weaker (Figure 4C and Supplementary Figure S2C). However, the ERA-Interim has less snow (Figure 4F) and the ERA5 has more snow (Supplementary Figure S2F) than the observation (Figure 4D) in terms of climatology. Therefore, the deviation of the spring snow depth could explain the deviation field of the spring SAT to a certain extent.
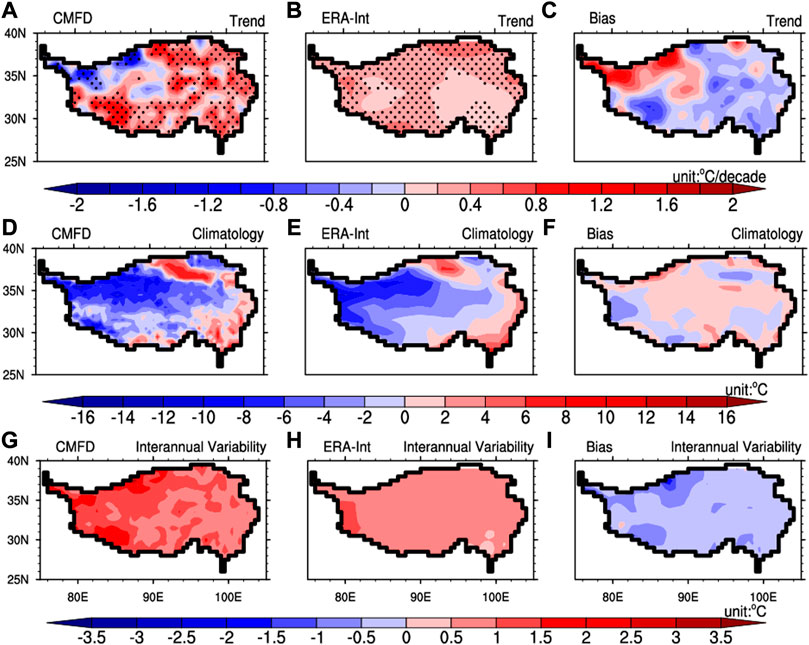
FIGURE 3. The spring SAT spatial distribution in CMFD and ERA-Interim. (A–C) represent the CMFD temperature trend field, the ERA-Interim temperature trend field, and the difference field (°C/decade) between the ERA-Interim and CMFD, respectively; (D–F) are similar to (A–C) but represent the climatology fields (°C); (G–I) are similar to (A–C) but represent interannual variability fields (°C). The TP domain is outlined by the black curve with height above 2,500 m.
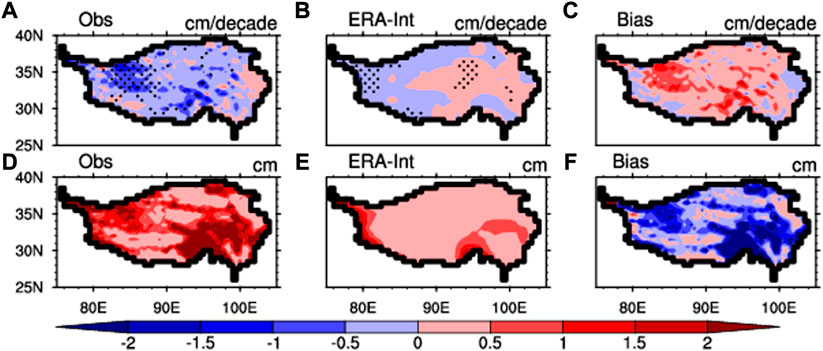
FIGURE 4. Spatial distribution of the spring snow depth over the TP in observational and ERA-Interim data. (A) the observational trend (cm/decade) of spring snow depth; (B) is similar to (A) but for the ERA-Interim data (cm/decade); (C) the difference of snow depth trend field (cm/decade) between ERA-Interim and observation data; (D–F) are similar to (A–C) but represent the climatology fields (cm). The TP domain is outlined by the black curve with height above 2,500 m.
Figure 5 is the spatial distribution of summer SAT over the TP from the observations and ERA-Interim. The ERA-Interim shows a weaker warming over the TP relative to the CMFD in summer, and the deviation field also reflects this feature (Figures 5A–C). For the climatology of summer SAT, the ERA-Interim and observation are relatively consistent, while the bias field indicates that ERA-Interim has a warm bias over the eastern region of the TP and a cold bias over the western region of the TP (Figures 5D–F). Moreover, Figure 5I demonstrates that the summer SAT presented by the ERA-Interim displays weaker interannual variability over the TP. Supplementary Figure S3 implies that the results of ERA5 are basically consistent with the ERA-Interim, but the summer DISO value of ERA5 is about 0.7. This is because the bias of the ERA5 summer SAT is stronger than that of the ERA-interim in terms of the trend and interannual variability. The previous studies concluded that the SAT changes are mainly related to water vapor over the TP in summer (Gao et al., 2019; 2021). Therefore, we calculate the ERA-Interim and ERA5 summer water vapor trend fields. Both the ERA-Interim and ERA5 show a significant increase of water vapor in summer, which corresponds to the warming of the TP (Figures 6A,B). This result also reflects that the temperature deviation over the TP in summer may be mainly related to water vapor that induces atmospheric downward long-wave radiation.
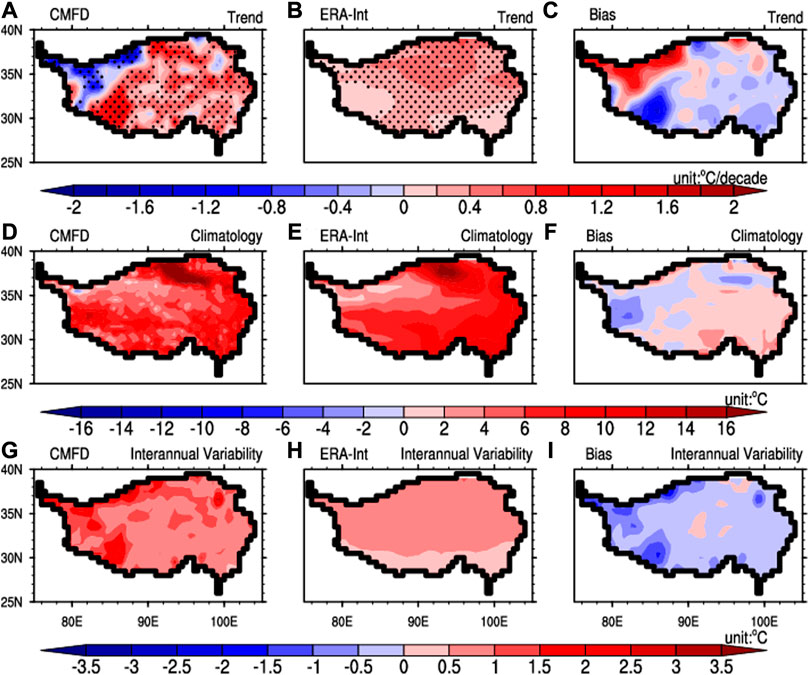
FIGURE 5. The summer SAT spatial distribution in CMFD and ERA-Interim. (A–C) represent the CMFD temperature trend field, the ERA-Interim temperature trend field, and the difference field (°C/decade) between the ERA-Interim and CMFD, respectively; (D–F) are similar to (A–C) but represent the climatology fields (°C); (G–I) are similar to (A–C) but represent interannual variability fields (°C). The TP domain is outlined by the black curve with height above 2,500 m.
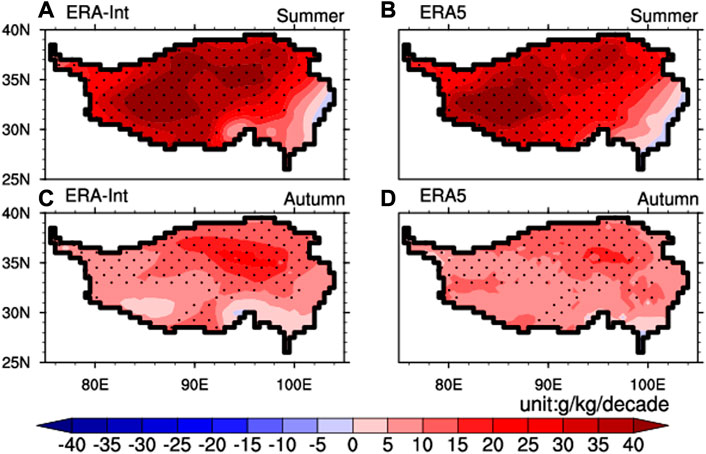
FIGURE 6. The summer water vapor fields (g/kg/decade) integrated from 600 hPa to 200 hPa over the TP in ERA-Interim (A) and ERA5 (B), respectively; (C,D) are similar to (A,B) but represent the autumn water vapor fields. The TP domain is outlined by the black curve with height above 2,500 m. Stippled areas indicate regions exceeding the 90% statistical confidence level.
In autumn, we present the spatial distribution of SAT over the TP from the observations and ERA5. Figure 7B shows that the plateau warming in autumn given by ERA5 is weaker than the observation (Figure 7A), and the deviation field also displays this feature (Figure 7C). As for the climatology, the spatial distribution of ERA5 and observation is relatively consistent (Figures 7D,E), while the bias field reveals that the ERA5 data overall presents a cold bias (Figure 7F). Moreover, the interannual variability of ERA5 over the TP is stronger than the observation for the autumn SAT (Figures 7G,I). Previous study indicated that the temperature changes over the TP are mainly related to water vapor and snow in autumn (Gao et al., 2019). Figure 6D reveals that the water vapor of ERA5 shows a significant increase in autumn, which indicates that it has a certain contribution to the autumn warming of the TP. However, Figures 8A–D imply that the ERA5 reproduces a weaker snow decline trend and has more snow than the observation. The above analysis demonstrates that the autumn SAT deviation field in ERA5 may be mainly related to its snow deviation and water vapor field.
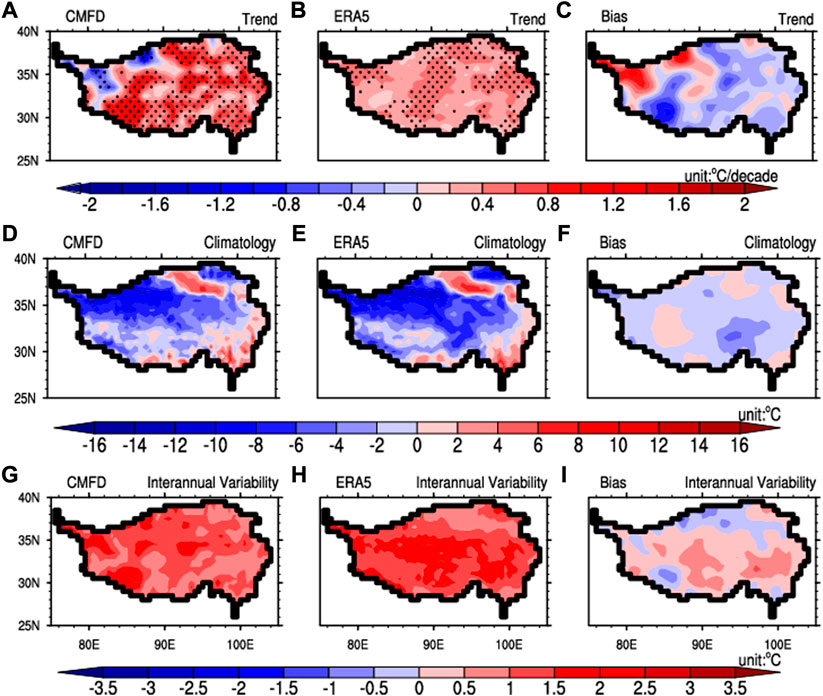
FIGURE 7. The autumn SAT spatial distribution in CMFD and ERA5. (A–C) represent the CMFD temperature trend field, the ERA5 temperature trend field, and the difference field (°C/decade) between the ERA5 and CMFD, respectively; (D–F) are similar to (A–C) but represent the climatology fields (°C); (G–I) are similar to (A–C) but represent interannual variability fields (°C). The TP domain is outlined by the black curve with height above 2,500 m.
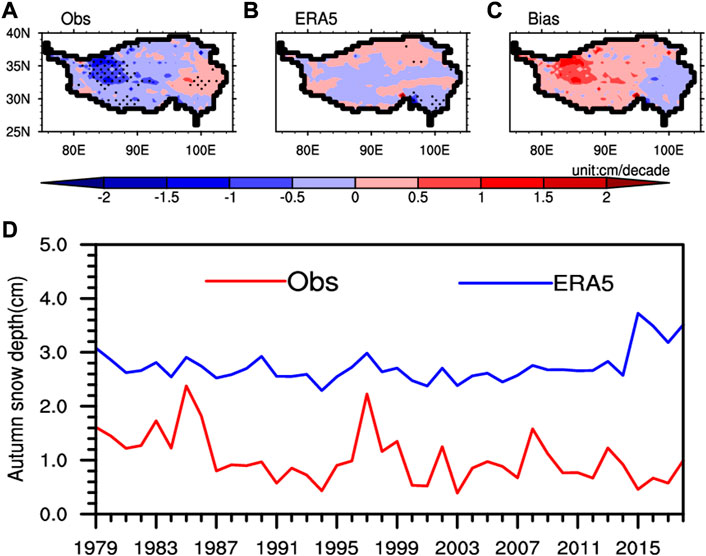
FIGURE 8. Spatial trends and time series of autumn snow depth over the TP from the observational and ERA5 data. (A) The observational trend (cm/decade) of autumn snow depth over the TP; (B) is similar to (A) but for the ERA5 data (cm/decade); (C) difference in snow depth trend field (cm/decade) between ERA5 and observation data; (D) time series of autumn snow depth changes (cm) in the observation and ERA5 data. The TP domain is outlined by the black curve with height above 2,500 m.
Although the ERA5 presents the characteristics of the winter warming over the TP, the overall trend is weak (Figures 9A–C). As for the climatology of winter SAT, the spatial distribution of the ERA5 and observation are relatively consistent (Figures 9D,E), while the deviation field shows that ERA5 has a cold bias in the southeast of the plateau and a warm bias in the northwest region (Figure 9F), and the overall is the cold bias (Figure 2B). The interannual variability captured by the ERA5 is stronger in the southeastern plateau and weaker in the northwest region relative to the observation (Figures 9G–I). The previous study demonstrated that the winter temperature change over the TP is mainly related to the surface albedo (Gao et al., 2019). Figures 10A–D reveal that the ERA5 reproduces a weaker snow trend and exhibits more snow than the observation. Hence the bias of winter snow in ERA5 data contributes to its temperature bias field to a certain extent.
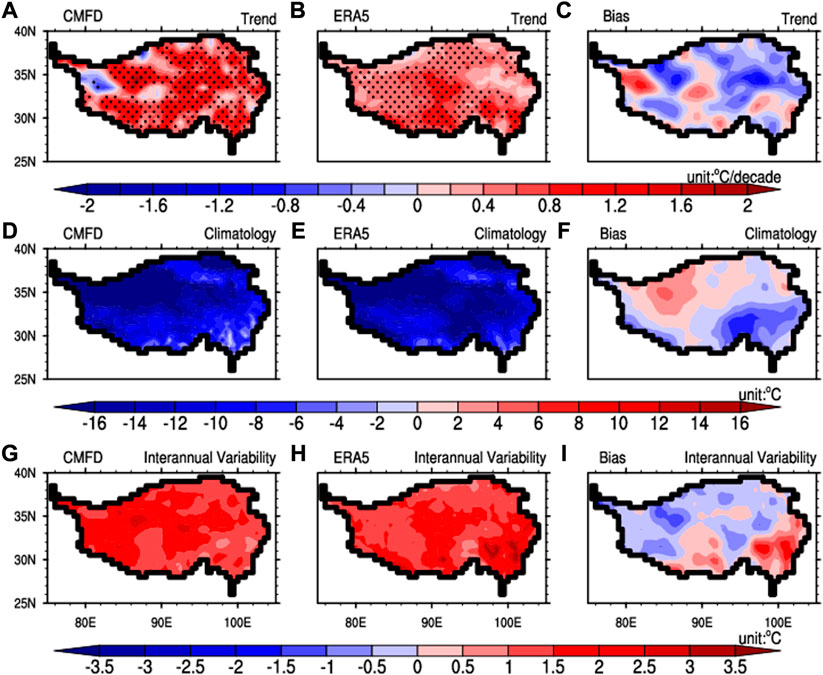
FIGURE 9. The winter SAT spatial distribution in CMFD and ERA5. (A–C) represent the CMFD temperature trend field, the ERA5 temperature trend field, and the difference field (°C/decade) between the ERA5 and CMFD, respectively; (D–F) are similar to (A–C) but represent the climatology fields (°C); (G–I) are similar to (A–C) but represent interannual variability fields (°C). The TP domain is outlined by the black curve with height above 2,500 m.
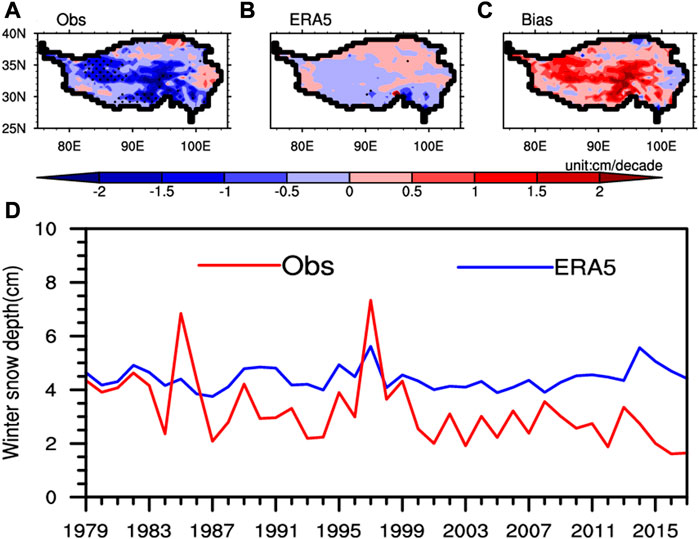
FIGURE 10. Spatial trends and time series of winter snow depth over the TP in observational and ERA5 data. (A) The observational trend (cm/decade) of winter snow depth over the TP; (B) is similar to (A) but for the ERA5 data (cm/decade); (C) difference in snow depth trend field (cm/decade) between ERA5 and observation data; (D) time series of winter snow depth changes (cm) in the observation and ERA5 data. The TP domain is outlined by the black curve with height above 2,500 m.
This paper selects three indicators including the trend, climatology, and interannual variability to comprehensively assess the ability of the five sets of reanalysis data to capture the SAT over the TP in different seasons by the DISO method. Results indicate that in spring and summer, the DISO values of ERA-interim are the smallest, which are 0.3 and 0.2, respectively. However, the DISO values of ERA5 are the smallest in autumn and winter, which are 0.8 and 0.7, respectively. Although the ERA-Interim and ERA5 are better than other reanalysis data in the corresponding seasons, there are still some deviations from the observed data. Therefore, we further analyze the spatial differences in the SAT field between the optimal and observed data in different seasons. The results show that the spring warming trend of the TP captured by the ERA-Interim is weaker than the CMFD, and there is a warm deviation in most regions in terms of climatology, which may be mainly related to the snow deviation existed in the ERA-Interim. In summer, the warming trend presented by the ERA-Interim over the TP is weak, and there is a warm deviation in the eastern part of the plateau and a cold deviation in the western part of the plateau for the climatology, which may be mainly related to the water vapor field in this data. Compared with the CMFD, both the warming trend and climatology captured by the ERA5 in autumn are cold deviations, which may be mainly related to the water vapor field and the larger snow bias existed in the data. The winter warming trend displayed by the ERA5 is weaker than the CMFD, while the climatological bias field indicates that the ERA5 has a cold bias in the southeast of the plateau and a warm bias in the northwest region. The results show that the deviation of winter snow depth has a certain contribution to the deviation of the surface air temperature in ERA5.
In addition, the deviations of the SAT exist in the different reanalysis datasets over the TP are essentially due to the differences in the numerical models used by the development institution, assimilated observational data, assimilation methods, and parameterization schemes. Therefore, it is necessary to conduct a more detailed analysis for the deviation reasons existing in these reanalysis datasets to promote the improvement of the data in the future.
Besides the drastic warming and the strongest interannual variability over the TP in winter as shown in Figure 1, we also find that the winter SAT of the TP has an interdecadal transition from a negative phase to a positive phase in 1999 (Figures 11A–C). The further analysis demonstrates that the winter sea ice concentration (SIC) over the Barents-Kara Sea also has an interdecadal transition from a positive phase to a negative phase in 1999 (Figures 11B,C). The recent studies have concluded that the sea ice loss over the Barents-Kara Sea can aggravate the warming of the TP in winter (Duan et al., 2022b) and explaining 61.4% of the winter cooling over China in the past 2 decades (Li et al., 2019). Furthermore, it shows that the interdecadal variability of the winter SIC over the Barents-Kara Sea is an important factor affecting the interdecadal transition of the cold surge path over East Asia (Yang et al., 2020). The previous studies also reveal that the interannual variability of the winter SIC over the Barents-Kara Sea has a great impact on the Asian climate system (Wu et al., 2016; Mori et al., 2019; Li et al., 2020; Chen et al., 2021; Sun et al., 2022). Therefore, will the winter Barents-Kara SIC loss also have an impact on the SAT of the TP on the interdecadal and interannual time scale? Further exploration of this interesting scientific question is needed in the future.
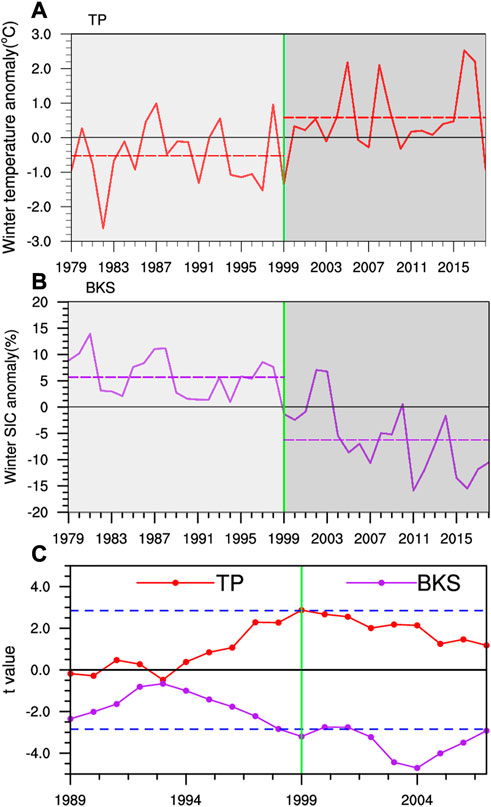
FIGURE 11. (A) Time series of winter temperature anomalies (°C) over the TP during 1979–2019 in the ERA5 data. The green vertical line corresponds to the year 1999, which represents the decadal abrupt point of winter temperature over the TP (passing the 99% confidence level). The red dashed lines represent the averaged temperature anomalies of the two periods, respectively; (B) is similar to (A) but for the winter Barents-Kara sea ice concentration anomalies (%) during 1979–2019 from the National Snow and Ice Data Center (NSIDC). (C) The 11 years moving t-test values for the winter temperature anomalies over the TP (red solid line) and Barents-Kara sea ice concentration anomalies (purple solid line), and the blue dashed line represents the 99% confidence level.
The datasets presented in this study can be found in online repositories. The surface air temperature observational data of the China Meteorological Forcing Dataset (CMFD) on 0.1° × 0.1° spatial resolution used in this study are openly available at http://poles.tpdc.ac.cn/en/data/8028b944-daaa-4511-8769-965612652c49/. The monthly mean atmospheric variables are from ECMWF-ERA5 on 0.25° × 0.25° spatial resolution (https://www.ecmwf.int/en/forecasts/datasets/reanalysis-datasets/era5). We also use the monthly mean surface air temperature from the JRA55 on the TL319 version with a Gaussian grid (320 latitudes multiplied by 640 longitudes) (http://search.diasjp.net/en/dataset/JRA55), ERA-Interim on 1° × 1° spatial resolution (https://www.ecmwf.int/en/forecasts/datasets/reanalysis-datasets/era-interim), NCEP2 on 2.5° × 2.5° spatial resolution (https://www.cpc.ncep.noaa.gov/products/wesley/reanalysis2/) and MERRA2 on 0.5° × 0.625° spatial resolution (https://gmao.gsfc.nasa.gov/reanalysis/MERRA-2/).
YP wrote the initial paper and carried out most of the data analysis. AD revised the paper. CZ helped in the analysis of the data. BT and XZ checked the paper and proposed amendments. All authors contributed to the paper and approved the submitted version.
This work was supported by the National Natural Science Foundation of China (Grant No. 42030602) and the Strategic Priority Research Program of the Chinese Academy of Sciences (Grant No. XDA19070404).
The authors declare that the research was conducted in the absence of any commercial or financial relationships that could be construed as a potential conflict of interest.
All claims expressed in this article are solely those of the authors and do not necessarily represent those of their affiliated organizations, or those of the publisher, the editors and the reviewers. Any product that may be evaluated in this article, or claim that may be made by its manufacturer, is not guaranteed or endorsed by the publisher.
The Supplementary Material for this article can be found online at: https://www.frontiersin.org/articles/10.3389/fenvs.2023.1152129/full#supplementary-material
Bao, Y., and You, Q. (2019). How do westerly jet streams regulate the winter snow depth over the Tibetan Plateau? Clim. Dyn. 53, 353–370. doi:10.1007/s00382-018-4589-1
Che, T., Li, X., Jin, R., Armstrong, R., and Zhang, T. (2008). Snow depth derived from passive microwave remote-sensing data in China. Ann. Glaciol. 49, 145–154. doi:10.3189/172756408787814690
Chen, L., Jiang, L., Jing, X., Wang, J., Shi, Y., Chu, H., et al. (2021a). Above- and belowground biodiversity jointly drive ecosystem stability in natural alpine grasslands on the Tibetan Plateau. Glob. Ecol. Biogeogr. 30, 1418–1429. doi:10.1111/geb.13307
Chen, L., Pryor, S. C., Wang, H., and Zhang, R. (2019). Distribution and variation of the surface sensible heat flux over the central and eastern Tibetan plateau: Comparison of station observations and multireanalysis products. J. Geophys. Res. Atmos. 124, 6191–6206. doi:10.1029/2018JD030069
Chen, Y., Duan, A., and Li, D. (2020). Atmospheric bridge connecting the Barents sea ice and snow depth in the mid-west Tibetan plateau. Front. Earth Sci. 8, 265. doi:10.3389/feart.2020.00265
Chen, Y., Duan, A., and Li, D. (2021b). Connection between winter Arctic sea ice and west Tibetan Plateau snow depth through the NAO. Int. J. Climatol. 41, 846–861. doi:10.1002/joc.6676
Cui, Q., Hu, Z., Li, Y., Han, J., Teng, Z., and Qian, J. (2020). Dynamic variations of the COVID-19 disease at different quarantine strategies in Wuhan and mainland China. J. Infect. Public Health 13, 849–855. doi:10.1016/j.jiph.2020.05.014
Dai, L., Che, T., Ding, Y., and Hao, X. (2017). Evaluation of snow cover and snow depth on the Qinghai-Tibetan Plateau derived from passive microwave remote sensing. Cryosphere 11, 1933–1948. doi:10.5194/tc-11-1933-2017
Dai, L., Che, T., and Ding, Y. (2015). Inter-calibrating SMMR, SSM/I and SSMI/S data to improve the consistency of snow-depth products in China. Remote Sens. 7, 7212–7230. doi:10.3390/rs70607212
Dee, D. P., Uppala, S. M., Simmons, A. J., Berrisford, P., Poli, P., Kobayashi, S., et al. (2011). The ERA-Interim reanalysis: Configuration and performance of the data assimilation system. Q. J. R. Meteorol. Soc. 137, 553–597. doi:10.1002/qj.828
Deng, M., Meng, X., Lu, Y., Li, Z., Zhao, L., Hu, Z., et al. (2021). Impact and sensitivity analysis of soil water and heat transfer parameterizations in community land surface model on the Tibetan plateau. J. Adv. Model. Earth Syst. 13, e2021MS002670. doi:10.1029/2021MS002670
Duan, A., Li, F., Wang, M., and Wu, G. (2011). Persistent weakening trend in the spring sensible heat source over the Tibetan Plateau and its impact on the Asian summer monsoon. J. Clim. 24, 5671–5682. doi:10.1175/JCLI-D-11-00052.1
Duan, A., Liu, S., Hu, W., Hu, D., and Peng, Y. (2022a). Long-term daily dataset of surface sensible heat flux and latent heat release over the Tibetan Plateau based on routine meteorological observations. Big Earth Data 6, 480–491. doi:10.1080/20964471.2022.2037203
Duan, A., Liu, S., Zhao, Y., Gao, K., and Hu, W. (2018). Atmospheric heat source/sink dataset over the Tibetan Plateau based on satellite and routine meteorological observations. Big Earth Data 2, 179–189. doi:10.1080/20964471.2018.1514143
Duan, A., Peng, Y., Liu, J., Chen, Y., Wu, G., Holland, D. M., et al. (2022b). Sea ice loss of the Barents-Kara Sea enhances the winter warming over the Tibetan Plateau. npj Clim. Atmos. Sci. 5, 26–28. doi:10.1038/s41612-022-00245-7
Duan, A., and Xiao, Z. (2015). Does the climate warming hiatus exist over the Tibetan Plateau? Sci. Rep. 5, 13711. doi:10.1038/srep13711
Duan, J., Li, L., Chen, L., and Zhang, H. (2020). Time-dependent warming amplification over the Tibetan Plateau during the past few decades. Atmos. Sci. Lett. 21, e998. doi:10.1002/asl.998
Gao, K., Duan, A., and Chen, D. (2021). Interdecadal summer warming of the Tibetan Plateau potentially regulated by a sea surface temperature anomaly in the Labrador Sea. Int. J. Climatol. 41, E2633–E2643. doi:10.1002/joc.6871
Gao, K., Duan, A., Chen, D., and Wu, G. (2019). Surface energy budget diagnosis reveals possible mechanism for the different warming rate among Earth’s three poles in recent decades. Sci. Bull. 64, 1140–1143. doi:10.1016/j.scib.2019.06.023
Gelaro, R., McCarty, W., Suárez, M. J., Todling, R., Molod, A., Takacs, L., et al. (2017). The modern-era retrospective analysis for research and applications, version 2 (MERRA-2). J. Clim. 30, 5419–5454. doi:10.1175/JCLI-D-16-0758.1
He, J., Yang, K., Tang, W., Lu, H., Qin, J., Chen, Y., et al. (2020). The first high-resolution meteorological forcing dataset for land process studies over China. Sci. Data 7, 25. doi:10.1038/s41597-020-0369-y
Hersbach, H., Bell, B., Berrisford, P., Hirahara, S., Horányi, A., Muñoz-Sabater, J., et al. (2020). The ERA5 global reanalysis. Q. J. R. Meteorol. Soc. 146, 1999–2049. doi:10.1002/qj.3803
Hu, Z., Chen, D., Chen, X., Zhou, Q., Peng, Y., Li, J., et al. (2022). CCHZ-DISO: A timely new assessment system for data quality or model performance from da Dao Zhi jian. Geophys. Res. Lett. 49, 1–9. doi:10.1029/2022GL100681
Hu, Z., Chen, X., Zhou, Q., Chen, D., and Li, J. (2019). Diso: A rethink of taylor diagram. Int. J. Climatol. 39, 2825–2832. doi:10.1002/joc.5972
Hu, Z., Cui, Q., Han, J., Wang, X., Sha, W. E. I., and Teng, Z. (2020). Evaluation and prediction of the COVID-19 variations at different input population and quarantine strategies, a case study in Guangdong province, China. Int. J. Infect. Dis. 95, 231–240. doi:10.1016/j.ijid.2020.04.010
Kalnay, E., Kanamitsu, M., Kistler, R., Collins, W., Deaven, D., Gandin, L., et al. (1996). The NCEP/NCAR 40-year reanalysis project. Bull. Am. Meteorol. Soc. 77, 437–471. doi:10.1175/1520-0477(1996)077<0437:TNYRP>2.0.CO;2
Kobayashi, S., Ota, Y., Harada, Y., Ebita, A., Moriya, M., Onoda, H., et al. (2015). The JRA-55 reanalysis: General specifications and basic characteristics. J. Meteorol. Soc. Jpn. 93, 5–48. doi:10.2151/jmsj.2015-001
Kuang, X., and Jiao, J. J. (2016). Review on climate change on the Tibetan plateau during the last half century. J. Geophys. Res. 121, 3979–4007. doi:10.1002/2015JD024728
Lei, Y., Yao, T., Bird, B. W., Yang, K., Zhai, J., and Sheng, Y. (2013). Coherent lake growth on the central Tibetan Plateau since the 1970s: Characterization and attribution. J. Hydrol. 483, 61–67. doi:10.1016/j.jhydrol.2013.01.003
Lei, Y., Yao, T., Yang, K., Sheng, Y., Kleinherenbrink, M., Yi, S., et al. (2017). Lake seasonality across the Tibetan Plateau and their varying relationship with regional mass changes and local hydrology. Geophys. Res. Lett. 44, 892–900. doi:10.1002/2016GL072062
Li, C., Bosch, C., Kang, S., Andersson, A., Chen, P., Zhang, Q., et al. (2016). Sources of black carbon to the Himalayan-Tibetan Plateau glaciers. Nat. Commun. 7, 12574. doi:10.1038/ncomms12574
Li, F., Wan, X., Wang, H., Orsolini, Y. J., Cong, Z., Gao, Y., et al. (2020). Arctic sea-ice loss intensifies aerosol transport to the Tibetan Plateau. Nat. Clim. Chang. 10, 1037–1044. doi:10.1038/s41558-020-0881-2
Li, X., Kang, S., He, X., Qu, B., Tripathee, L., Jing, Z., et al. (2017). Light-absorbing impurities accelerate glacier melt in the Central Tibetan Plateau. Sci. Total Environ. 587–588, 482–490. doi:10.1016/j.scitotenv.2017.02.169
Li, X., Wu, Z., and Li, Y. (2019). A link of China warming hiatus with the winter sea ice loss in Barents–Kara Seas. Clim. Dyn. 53, 2625–2642. doi:10.1007/s00382-019-04645-z
Liu, C., Sun, J., Yang, X., Jin, S., and Fu, S. (2021a). Evaluation of ecmwf precipitation predictions in China during 2015–18. Weather Forecast 36, 1043–1060. doi:10.1175/WAF-D-20-0143.1
Liu, L., Gu, H., Xie, J., and Xu, Y. P. (2021b). How well do the ERA-Interim, ERA-5, GLDAS-2.1 and NCEP-R2 reanalysis datasets represent daily air temperature over the Tibetan Plateau? Int. J. Climatol. 41, 1484–1505. doi:10.1002/joc.6867
Liu, T., Chen, D., Yang, L., Meng, J., Wang, Z., Ludescher, J., et al. (2023). Teleconnections among tipping elements in the earth system. Nat. Clim. Chang. 13, 67–74. doi:10.1038/s41558-022-01558-4
Liu, Y., Lu, M., Yang, H., Duan, A., He, B., Yang, S., et al. (2020). Land-atmosphere-ocean coupling associated with the Tibetan Plateau and its climate impacts. Natl. Sci. Rev. 7, 534–552. doi:10.1093/nsr/nwaa011
Lun, Y., Liu, L., Cheng, L., Li, X., Li, H., and Xu, Z. (2021). Assessment of GCMs simulation performance for precipitation and temperature from CMIP5 to CMIP6 over the Tibetan Plateau. Int. J. Climatol. 41, 3994–4018. doi:10.1002/joc.7055
Mori, M., Kosaka, Y., Watanabe, M., Nakamura, H., and Kimoto, M. (2019). A reconciled estimate of the influence of Arctic sea-ice loss on recent Eurasian cooling. Nat. Clim. Chang. 9, 123–129. doi:10.1038/s41558-018-0379-3
Peng, X., Frauenfeld, O. W., Jin, H., Du, R., Qiao, L., Zhao, Y., et al. (2021). Assessment of temperature changes on the Tibetan plateau during 1980–2018. Earth Sp. Sci. 8, e2020EA001609. doi:10.1029/2020EA001609
Peng, Y., Duan, A., Hu, W., Tang, B., Li, X., and Yang, X. (2022). Observational constraint on the future projection of temperature in winter over the Tibetan Plateau in CMIP6 models. Environ. Res. Lett. 17, 034023. doi:10.1088/1748-9326/ac541c
Rienecker, M. M., Suarez, M. J., Gelaro, R., Todling, R., Bacmeister, J., Liu, E., et al. (2011). Merra: NASA’s modern-era retrospective analysis for research and applications. J. Clim. 24, 3624–3648. doi:10.1175/JCLI-D-11-00015.1
Sheng, C., He, B., Wu, G., Liu, Y., and Zhang, S. (2022). Interannual influences of the surface potential vorticity forcing over the Tibetan plateau on east Asian summer rainfall. Adv. Atmos. Sci. 39, 1050–1061. doi:10.1007/s00376-021-1218-4
Sheng, C., Wu, G., Tang, Y., He, B., Xie, Y., Ma, T., et al. (2021). Characteristics of the potential vorticity and its budget in the surface layer over the Tibetan plateau. Int. J. Climatol. 41, 439–455. doi:10.1002/joc.6629
Simmons, A. J., Jones, P. D., da Costa Bechtold, V., Beljaars, A. C. M., Kållberg, P. W., Saarinen, S., et al. (2004). Comparison of trends and low-frequency variability in CRU, ERA-40, and NCEP/NCAR analyses of surface air temperature. J. Geophys. Res. D. Atmos. 109, D24115–D24118. doi:10.1029/2004JD005306
Sun, J., Liu, S., Cohen, J., and Yu, S. (2022). Influence and prediction value of Arctic sea ice for spring Eurasian extreme heat events. Commun. Earth Environ. 3, 172. doi:10.1038/s43247-022-00503-9
Sun, R., Duan, A., Chen, L., Li, Y., Xie, Z., and Zhao, Y. (2019). Interannual variability of the north Pacific mixed layer associated with the spring Tibetan plateau thermal forcing. J. Clim. 32, 3109–3130. doi:10.1175/JCLI-D-18-0577.1
Tang, B., Hu, W., Duan, A., Gao, K., and Peng, Y. (2022). Reduced risks of temperature extremes from 0.5°C less global warming in the earth’s three Poles. Earth’s Futur 10, e2021EF002525. doi:10.1029/2021EF002525
Wang, Q., Fan, X., and Wang, M. (2022). Warming amplification with both altitude and latitude in the Tibetan Plateau. Int. J. Climatol. 42, 3323–3340. doi:10.1002/joc.7418
Wang, T., Yang, D., Yang, Y., Piao, S., Li, X., Cheng, G., et al. (2020a). Permafrost thawing puts the frozen carbon at risk over the Tibetan Plateau. Sci. Adv. 6, eaaz3513. doi:10.1126/sciadv.aaz3513
Wang, X., Chen, D., Pang, G., Ou, T., Yang, M., and Wang, M. (2020b). A climatology of surface–air temperature difference over the Tibetan Plateau: Results from multi-source reanalyses. Int. J. Climatol. 40, 6080–6094. doi:10.1002/joc.6568
Wang, X., Yin, G., Hu, Z., He, D., Cui, Q., Feng, X., et al. (2021). Dynamical variations of the global COVID-19 pandemic based on a seicr disease model: A new approach of Yi hua jie mu. GeoHealth 5, e2021GH000455. doi:10.1029/2021GH000455
Wang, Z., Duan, A., and Wu, G. (2014). Time-lagged impact of spring sensible heat over the Tibetan Plateau on the summer rainfall anomaly in East China: Case studies using the WRF model. Clim. Dyn. 42, 2885–2898. doi:10.1007/s00382-013-1800-2
Wu, Z., Li, X., Li, Y., and Li, Y. (2016). Potential influence of arctic sea ice to the interannual variations of East Asian spring precipitation. J. Clim. 29, 2797–2813. doi:10.1175/JCLI-D-15-0128.1
Xu, W., Lei, X., Chen, S., Yu, T., Hu, Z., Zhang, M., et al. (2022). How well does the ERA5 reanalysis capture the extreme climate events over China? Part II: Extreme temperature. Front. Environ. Sci. 10, 1–15. doi:10.3389/fenvs.2022.921659
Xu, W., Ma, L., Ma, M., Zhang, H., and Yuan, W. (2017). Spatial-temporal variability of snow cover and depth in the Qinghai-Tibetan plateau. J. Clim. 30, 1521–1533. doi:10.1175/JCLI-D-15-0732.1
Xu, X., Dong, L., Zhao, Y., and Wang, Y. (2019). Effect of the asian water tower over the qinghai-tibet plateau and the characteristics of atmospheric water circulation. Kexue Tongbao/Chinese Sci. Bull. 64, 2830–2841. doi:10.1360/TB-2019-0203
Xu, X., Lu, C., Shi, X., and Gao, S. (2008). World water tower: An atmospheric perspective. Geophys. Res. Lett. 35, L20815. doi:10.1029/2008GL035867
Xue, B., Helman, D., Wang, G., Xu, C. Y., Xiao, J., Liu, T., et al. (2021). The low hydrologic resilience of Asian Water Tower basins to adverse climatic changes. Adv. Water Resour. 155, 103996. doi:10.1016/j.advwatres.2021.103996
Yang, J., Huang, M., and Zhai, P. (2021). Performance of the CRA-40/land, CMFD, and ERA-interim datasets in reflecting changes in surface air temperature over the Tibetan plateau. J. Meteorol. Res. 35, 663–672. doi:10.1007/s13351-021-0196-x
Yang, M., Wang, X., Pang, G., Wan, G., and Liu, Z. (2019). The Tibetan Plateau cryosphere: Observations and model simulations for current status and recent changes. Earth-Science Rev. 190, 353–369. doi:10.1016/j.earscirev.2018.12.018
Yang, W., Yao, T., Guo, X., Zhu, M., Li, S., and Kattel, D. B. (2013). Mass balance of a maritime glacier on the southeast Tibetan Plateau and its climatic sensitivity. J. Geophys. Res. Atmos. 118, 9579–9594. doi:10.1002/jgrd.50760
Yang, X., Zeng, G., Zhang, G., and Li, Z. (2020). Interdecadal variation of winter cold surge path in East Asia and its relationship with arctic sea ice. J. Clim. 33, 4907–4925. doi:10.1175/JCLI-D-19-0751.1
Yao, T., Thompson, L., Yang, W., Yu, W., Gao, Y., Guo, X., et al. (2012). Different glacier status with atmospheric circulations in Tibetan Plateau and surroundings. Nat. Clim. Chang. 2, 663–667. doi:10.1038/nclimate1580
Yao, T., Wu, F., Ding, L., Sun, J., Zhu, L., Piao, S., et al. (2015). Multispherical interactions and their effects on the Tibetan plateau’s Earth system: A review of the recent researches. Natl. Sci. Rev. 2, 468–488. doi:10.1093/nsr/nwv070
Yi, Y., Kimball, J. S., Jones, L. A., Reichle, R. H., and Mcdonald, K. C. (2011). Evaluation of MERRA land surface estimates in preparation for the soil moisture active passive mission. J. Clim. 24, 3797–3816. doi:10.1175/2011JCLI4034.1
Yin, G., Zhang, Z., Zhu, B., Li, Q., Mao, M., Xing, W., et al. (2022). Characteristics and physical mechanisms of a rainstorm in Hotan, Xinjiang, China. Front. Environ. Sci. 10, 1–17. doi:10.3389/fenvs.2022.1046882
You, Q., Cai, Z., Pepin, N., Chen, D., Ahrens, B., Jiang, Z., et al. (2021). Warming amplification over the arctic Pole and third Pole: Trends, mechanisms and consequences. Earth-Science Rev. 217, 103625. doi:10.1016/j.earscirev.2021.103625
You, Q., Kang, S., Aguilar, E., and Yan, Y. (2008). Changes in daily climate extremes in the eastern and central Tibetan Plateau during 1961-2005. J. Geophys. Res. Atmos. 113, D07101. doi:10.1029/2007JD009389
You, Q., Wu, F., Shen, L., Pepin, N., Jiang, Z., and Kang, S. (2020). Tibetan Plateau amplification of climate extremes under global warming of 1.5 °C, 2 °C and 3 °C. Glob. Planet. Change 192, 103261. doi:10.1016/j.gloplacha.2020.103261
Zhang, Y., Gao, T., Kang, S., Shangguan, D., and Luo, X. (2021). Albedo reduction as an important driver for glacier melting in Tibetan Plateau and its surrounding areas. Earth-Science Rev. 220, 103735. doi:10.1016/j.earscirev.2021.103735
Zhou, Q., Chen, D., Hu, Z., and Chen, X. (2021). Decompositions of Taylor diagram and DISO performance criteria. Int. J. Climatol. 41, 5726–5732. doi:10.1002/joc.7149
Keywords: surface air temperature, DISO, reanalysis, CMFD, Tibetan Plateau
Citation: Peng Y, Duan A, Zhang C, Tang B and Zhao X (2023) Evaluation of the surface air temperature over the Tibetan Plateau among different reanalysis datasets. Front. Environ. Sci. 11:1152129. doi: 10.3389/fenvs.2023.1152129
Received: 27 January 2023; Accepted: 24 February 2023;
Published: 07 March 2023.
Edited by:
Zengyun Hu, Xinjiang Institute of Ecology and Geography (CAS),ChinaReviewed by:
Junqiang Yao, China Meteorological Administration, ChinaCopyright © 2023 Peng, Duan, Zhang, Tang and Zhao. This is an open-access article distributed under the terms of the Creative Commons Attribution License (CC BY). The use, distribution or reproduction in other forums is permitted, provided the original author(s) and the copyright owner(s) are credited and that the original publication in this journal is cited, in accordance with accepted academic practice. No use, distribution or reproduction is permitted which does not comply with these terms.
*Correspondence: Anmin Duan, YW1kdWFuQGxhc2cuaWFwLmFjLmNu
Disclaimer: All claims expressed in this article are solely those of the authors and do not necessarily represent those of their affiliated organizations, or those of the publisher, the editors and the reviewers. Any product that may be evaluated in this article or claim that may be made by its manufacturer is not guaranteed or endorsed by the publisher.
Research integrity at Frontiers
Learn more about the work of our research integrity team to safeguard the quality of each article we publish.