 Ehsan Ali1*
 Muhammad Farooq Azhar1
 Edris Alam2,3
 Zainab Rehman1
 Sami Ullah4
 Aqeel Ahmad5
 Abu Reza Md. Towfiqul Islam6Wajid Zaman7
 Muhammad Javed8Praveen Mittal9
- 1Department of Forestry and Range Management, Bahauddin Zakariya University, Multan, Pakistan
- 2Faculty of Resilience, Rabdan Academy, Abu Dhabi, United Arab Emirates
- 3Department of Geography and Environmental Studies, University of Chittagong, Chittagong, Bangladesh
- 4Department of Forestry, College of Agriculture, University of Sargodha, Sargodha, Pakistan
- 5University of Chinese Academy of Sciences (UCAS), Beijing, China
- 6Department of Disaster Management, Begum Rokeya University, Rangpur, Bangladesh
- 7Department of Life Sciences, Yeungnam University, Gyeongsan, Republic of Korea
- 8Department of Botany, Division of Science and Technology, University of Education, Lahore, Pakistan
- 9Department of Coumputer Engineering and Applications, GLA University, Mathura, India
Deforestation is the accelerating factor of climate change in developing countries. The German Watch Report 2020 had rated Pakistan number seventh most affected country due to adverse impacts of climate change. The problem of deforestation poses an existential danger to the forest-depleted country. It is of utmost importance to predict the main drivers to control deforestation. This study was conducted from October 2021 to August 2022 in dry temperate forests of the Chilas to investigate the current condition, causes of deforestation, and predicted the main drivers by using a binary regression model. Stratified random sampling techniques and fixed area plot method were used and taken ground measurements during field inventory to access current situation of deforestation. While a non-probability quota sampling technique and semi-structured questionnaire were utilized for the determination of main drivers of deforestation through respondent’s survey. The forest inventory result showed that most trees fall in immature and sub-mature (mainly in 10–20 and 20–30 cm) diameter classes while the binary logistic regression model predicted dominating four primary drivers (unsustainable fuel wood extraction, unsustainable timber extraction and urban crawling and rural expansion/habituation, and free and uncontrolled livestock grazing) and one secondary driver (wood for energy needs). To address the underlying causes of deforestation, the government must supply alternate energy sources, as well as other economic possibilities to reduce dependency on forests.
1 Introduction
Forest ecosystems have an essential role in protecting water supplies, providing economic goods, maintaining biodiversity, and mitigating climate change, in addition to providing money, food, and medicine to many of the world’s poorest people (Shehzad et al., 2015). Forests are a valuable natural resource for any country. Forests are significant in Pakistan for two reasons: first, they play a vital part in keeping the environment clean, and second, they directly assist the rural economy of the country. In Pakistan, deforestation has become a social issue as well as a policy one. Despite ranking 135th on the Global Greenhouse Gases (GHS) index, Pakistan is recognized as the seventh most impacted country by climate change (Aslam et al., 2021).
Time-series decadal forest cover change maps for 3 decades (1990, 2000, and 2010) employed by (Qamer et al., 2016) highlighted severe deforestation in Gilgit Baltistan province with 1,707 km2 of forest area lost over 20 years or 0.38 percent per year. Despite efforts to develop plans and policies to maintain the remaining forests in the north, notably in Gilgit-Baltistan, these forests continue to be managed in an unsustainable way, with deforestation being a significant concern (Yusuf, 2009). In light of this, a thorough evaluation of the Gilgit Baltistan government policy response is necessary because the issue of deforestation no longer just affects the local area but also has global consequences. The country is on a knife-edge due to its susceptibility to climate change risks.
Forest Inventory for the forests of Skardu district was done by the Gilgit Baltistan Forest and Wildlife Department under the project of Reducing Emission through Deforestation and Forest Degradation (REDD+) which indicate that approximately 85% of forests were young (Anwar et al., 2015). Similarly, the forest inventory report for Gilgit Baltistan 2017 under the project of REDD + also indicated that 63% of forests were young in the whole region of Gilgit Baltistan (Ismail et al., 2018). Land cover changes in Gilgit-Baltistan are extremely dynamic, according to research. Between 2000 and 2010, the Chilas subdivision had the highest rate of deforestation, totaling almost 3,500 ha. Between 2000 and 2010, Darel/Tangir had the second greatest rate of deforestation, with almost 2,000 ha lost. Astore had the third greatest rate of deforestation, which was much lower than Chilas and Darel/Tangir (Qamer et al., 2016).
The Ten-Billion Tsunami Afforestation Project (10-BTAP), a component of the Green Growth Initiative of the Government of Pakistan, has captured the interest of both the general public and academics. It is hailed as a revolutionary step toward a sustainable environment and forest management in all of the provinces including Gilgit Baltistan. Few people have seriously questioned the success of 10-BTAP’s plantation, its socioeconomic impact, the species it chose, or its overall effectiveness as the driver of the green revolution, even though the project’s progress in restoring the forests has been duly acknowledged by independent sources. However, because the root causes of deforestation have rarely been addressed, it fell far short of igniting a green revolution.
There are several primary and secondary drivers which increase the rate of deforestation. It is of utmost importance to predict the main drivers to control deforestation. The factors of deforestation in Gilgit-Baltistan, as well as the dominant notion of Himalayan environmental degradation, have been the subject of several pieces of research. Unsustainable commercial harvesting and mismanagement were the primary causes of deforestation across 3 decades in the Basho valley of Gilgit-Baltistan (Ali and Benjaminsen, 2004). In the Darel/Tangir and Chilas valleys, sectarian conflicts and increasing access to forest resources have been highlighted as further indirect drivers of deforestation (Gohar, 2002). Forest resources had been overexploited since forest-dependent populations regularly practice cutting trees to get timber and fuelwood in the Dayan Valley Astore district of Gilgit-Baltistan (Ali et al., 2014). Quantitative research was conducted on forest vegetation in the three districts of Gilgit-Baltistan and found illegal cutting as the main cause in Rama and Skardu districts (Akbar et al., 2011). Anthropogenic disturbances including grazing, cutting, sliding, and burning have had an impact on the quality of the forest stand structure of Gilgit-Baltistan (Akbar et al., 2013). Deforestation was further accelerated by the development of the Karakorum Highway (KKH), which connects Pakistan and China. The KKH made it easier and less expensive to move timber to other places, as well as opening up formerly closed forested areas (Ali et al., 2005). The dry temperate forest of Ganji Valley in Skardu district Gilgit-Baltistan contains few seedlings, or young trees, or shows no evidence of seedling establishment, and is vulnerable to anthropogenic disturbances (Akbar et al., 2015). Chilghoza forest in Goharabad District Diamer division of Gilgit-Baltistan has few seedlings and young trees or shows no indication of seedling establishment. The poor recovery was attributed to both human (nut harvesting, cutting, grazing, burning, etc.,) and natural (land sliding, floods) causes (Khan et al., 2015).
Therefore, this research study was conducted to investigate the causes of deforestation and predicted the main drivers by using a binary regression model in Gilgit Baltistan, especially in the dry temperate forests of Diamer district (High Forest area percentage as compared to other nine districts). This paper also provided possible strategies to tackle the phenomena of deforestation in the province.
2 Materials and methods
2.1 Location of study area
Gilgit-Baltistan is a region in Pakistan’s far northwestern corner with ten districts (administrative units). This area in the north has a total area of 72,971 km2. The region’s importance may be seen in its physical location, as it sits at the crossroads of Central Asia, China, and South Asia. When compared to the other nine districts of Gilgit-Baltistan, the Diamer district’s dry temperate forests have a higher forest area proportion. Diamer district has been separated into two subdivisions in terms of forest management: Chilas and Darel-Tangir. The research was carried out in the Chilas subdivision’s dry temperate forests. The elevation of the Chilas subdivision ranges from 1829 to 3,506 m. The area’s coordinates are 35′23′07″N and 74′34′07″E, with a total forest area of 0.1 million hectares. The vegetation of the area is classified as dry temperate coniferous forest dominated by Cedrus deodara (Roxb. ex D. Don) G. Don (Diar/Deodar), Pinus wallichiana (Kail) A.B. Jacks., Abies pindrow (Royle ex D. Don) Royle (Fir), Picea simithiana (Wall.) Boiss (Spruce), Pinus gerardiana Wall. ex D. Don (Chilgoza) and broadleaved species are Betula utilis D. Don (Birch), Quercus incana Roxb. (Oak) and Taxas baccata L. (Yew).
2.2 Ground measurement
The Chilas Forest Division has divided into four forest ranges. From each forest range, 09 plots were selected using stratified random sampling as dense mix, dense pure, sparse pure, and sparse mix forest areas. With the Vertex Hypsometer, a circular plot having a radius 17.84 m was marked on the ground. This device works well for laying out plots in steep terrain without the need for slope adjustment variables. In each sample plot, the diameter at breast height (DBH) of all trees was measured at 1.37 m. On the uphill side, DBH was measured at 1.37 m above the ground. Those trees which had a minimum diameter at breast height (DBH) of 5 cm and a minimum height of 2 m were measured.
2.3 Determination of diameter size classes
The DBH tap was used to measure the diameters at breast height (DBH) of each tree species in a sample plot, which was then divided into 13 size classes (10 cm DBH) and tree size structures were computed using the MS Excel 2007 Package. Following the investigations, size classes were split into four categories: immature (less than 25 cm), sub-mature (26–50 cm), mature (51–75 cm), and over-mature (more than 75 cm) (Wahab, 2011; Ahmed et al., 2012; Akbar et al., 2014).
2.4 Survey based data collection
A semi-structured questionnaire served as the data-gathering tool. The respondents were given the questionnaire along with an interview guide. To boost the respondents’ trust and data quality, interviews were conducted by locally educated six forestry graduates (three males and three females forestry graduates) to address local language bearers and filled the questionnaire by the interviewers after interview of the respondents. For a respondent’s survey of the Chilas forest region, a non-probability quota sampling approach was utilized as an appropriate sample technique. All four forest ranges of Chilas were chosen for a present sampling frame of 200 respondents (50 respondents for each forest range). The study area included all 200 accessible households. Interviews were taken from the main male or female head of each household. Both local males and females equally participated in the interview but the size of household vary in size.
The demographic features of the local respondents are shown in Table 1. An equal number of male (n = 100) and female (n = 100) respondents were selected for interviewed and age was also categorized into two categories (i.e., young age (≤40 years) and old age (≥40 years). The majority of the respondents (60%) were uneducated as compared to educate (a person who could read and write). Most of the respondents (56%) were farmers.
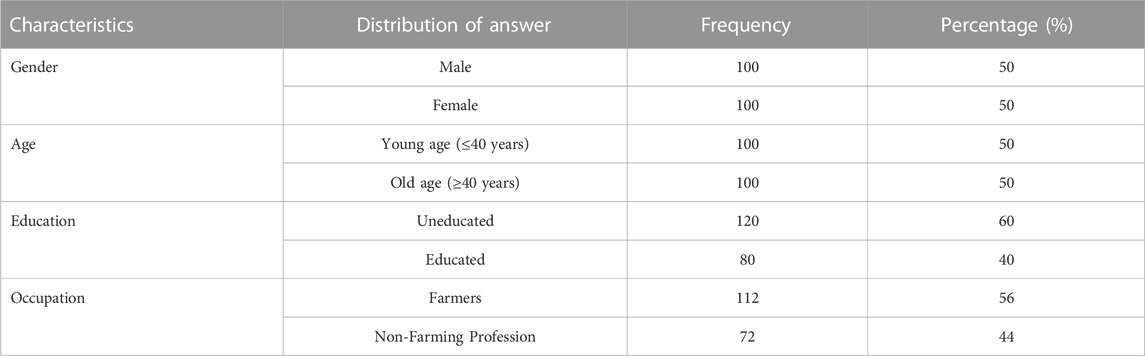
TABLE 1. Demographic features of the local participants.
2.5 Statistical analysis
To arrange and code the data for quantitative data analysis, a statistical tool (SPSS version 21.0) and Microsoft Excel 2007 were utilized. Both forest inventory and respondents survey data were entered into the excel sheet to organize the raw data and then shift into the SPSS software for descriptive and inferential statistical test. to examine the quantitative data. Descriptive statistics such as frequency and percentage counts were applied on the forest inventory data to describe and highlight the current situation of deforestation in the study area. While the logit regression model was applied on the respondents survey data to predict main primary and secondary drivers of deforestation.
The logistic regression model, as employed by (Hishe et al., 2015; Ullah et al., 2020) was used to examine the main primary and secondary drivers of deforestation. The binary dependent variable in this study was “deforestation in the Chilas forest,” which was assigned a value of “1” if deforestation occurred in the forest and “0” if it did not (scale: yes “1” or No “0”). The independent variables in the case of primary drivers are Unsustainable fuelwood extraction, Unsustainable timber extraction, Forest Fires (Intentional), Forest Fires (natural), Infrastructure Development, Free and uncontrolled livestock grazing, Urban and rural expansion, Agricultural expansion for subsistence, Floods, Landslides, heavy Snowfall, Pests, Weak governance while in case of secondary drivers independent variables are Wood energy needs, Food security, Lack of alternate livelihoods in rural areas, poor extension services, No demarcation of boundaries, Unsustainable forest management, Poor implementation of laws and Political pressure on forest officers for relaxing the laws which discourage full enforcement of the law. These are the independent variables (socio-economic factors) influencing deforestation in the study area. The logistic regression model equation is presented below:
In case of Primary Drivers:
Where, SE = socio-economic factors; β1x1 = Unsustainable fuel wood extraction; β2x2 = Unsustainable timber extraction; β3x3 = Forest Fires (Intentional); β4x4 = Forest Fires (natural); β5x5 = Infrastructure Development; β6x6 = Free and uncontrolled livestock grazing; β7x7 = Urban and rural expansion; β8x8 = Agricultural expansion for subsistence; β9x9 = Floods, Landslides, heavy Snowfall; β10x10 = Pests; β11x11 = Weak governance.
In case of Secondary Drivers:
Where, SE = socio-economic factors; β1x1 = Wood energy needs; β2x2 = Food security; β3x3 = Lack of alternate livelihoods in rural areas; β4x4 = Poor extension services; β5x5 = No demarcation of boundaries; β6x6 = Unsustainable Forest management; β7x7 = Poor implementation of laws; β8x8 = Political pressure on forest officers.
3 Results and discussion
3.1 Occurrence of tree species
The tree species sampled during inventory consisted of six conifers Deodar (C. deodara), Kail (P. wallichiana), Fir (A. pindrow), Spruce (P. smithiana), Juniper (Juniperus excelsa M. Bieb.), Chilgoza (P. gerardiana), and three broadleaved species Birch (B. utilis), Oak (Q. incana) and Yew (Taxus baccata) as given in (Figure 1). Spruce is the dominant species (35.4%) followed by Kail (21.5%) and deodar (19.4%). Oak, Chilgoza, Juniper, Yew, Fir, and Birch are also present in the area but in a very small proportion.
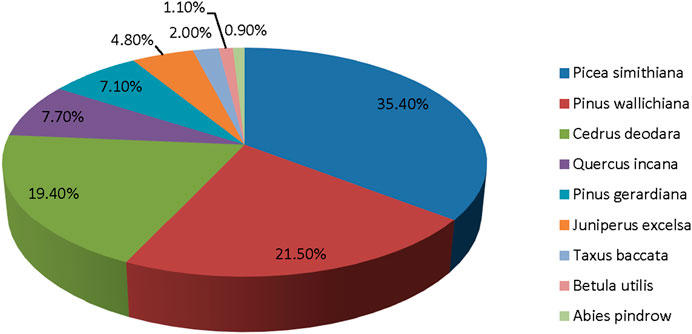
FIGURE 1. Percentage of tree species.
3.2 Strata-wise occurrence of trees
A total of 855 trees were tallied in all 36 plots. Thus, the average number of trees was estimated as 237 per ha. The highest number of trees (70.2%) was found in the sparse pure coniferous forest which indicated that deforestation has happened in the past years at a high rate. In Dense mixed forest, sparse mix, and dense pure forest 16.3%, 6.9%, and 6.7% of trees were found. The detail is given in Table 2.
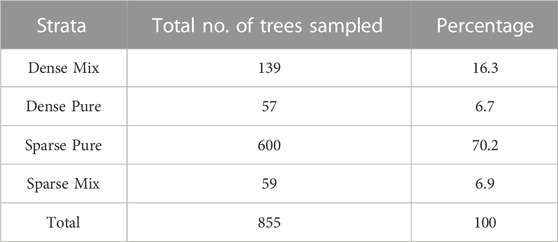
TABLE 2. Strata-wise occurrence of trees.
3.3 Diameter class distribution
The distribution of DBH size classes in different species reveals the current state and future trajectory of these forests. (Figure 2). depicts the diameter class distribution of the trees sampled during the inventory. Almost all diameter classes are well represented. However, there are more trees in the 11–20 cm, 21–30 cm, and 30–40 cm diameter groups. The proportion of trees in the next higher classifications is decreasing, indicating a positive trend. For regular and sustainable forest stands, more trees should exist in the younger classes and fewer in the older classes, as seen in the study area. However, the number of trees with a diameter of 10 cm is rather low, indicating some gaps in regeneration.

FIGURE 2. Diameter class distribution pf sample trees.
3.4 Stand structure
The inventory findings demonstrate that all developmental phases are well represented in the target area. The stand structure is nearly young, with the majority of trees in immature (46.1%) and sub-mature (35.7%t) growth stages. In contrast, 12.4% of the trees are mature, and 5.8% are above mature, for a total of 18.2 percent. As a result, about one-fifth of the total trees are ready to be harvested as shown in Table 3. Leaving these mature trees in the forests without harvesting may undermine the economic value that might be reaped from harvesting them. These older trees also restrict regeneration, which is severely inadequate in the majority of mature stands.
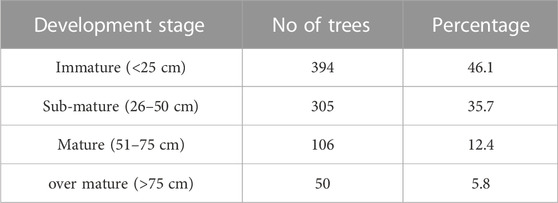
TABLE 3. Stand structure.
3.5 Development stages of different species
The development stages of different tree species are given in (Figure 3). 23.1%, 21.3%, 21.7%, and 10% of Kail fall in an immature, sub-mature, mature, and over-mature stage. Similarly, 36%, 35.1%, 31.1%, and 42% of Spruce fall in an immature, sub-mature, mature, and over-mature stage. While in the case of Deodar 8.1%, 21%, 43.4%, and 48% fall in an immature, sub-mature, mature, and over-mature stage. In Birch almost equal proportions of trees, i.e., 1.3% and 1.3% are in immature and sub-mature stages respectively. On the other hand, Birch, Juniper, Chilgoza pine, Oak, and Yew are totally in immature and sub-mature stages and no trees are found in mature and over-mature stages.
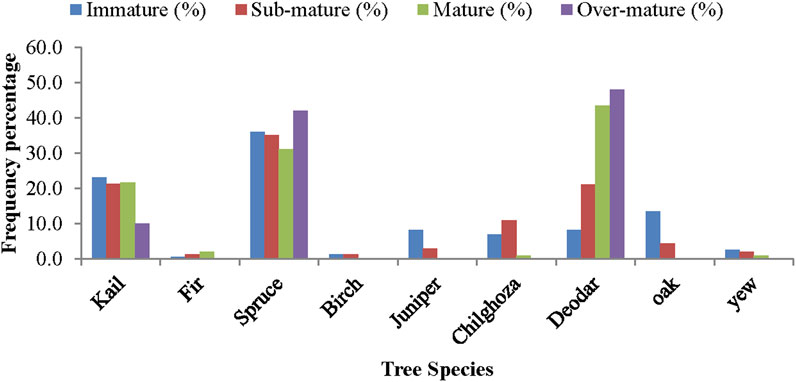
FIGURE 3. Graphical representation of developmental stages of species.
3.6 Factual data based on binary logistic model
The Binary Logistic Regression (BLR) model was employed in this research work. The BLR model evaluated the association between the demographic features of the local participant’s and deforestation, which is a driving force behind climate change. Table 4 displays the outcomes. In this BLR model, a total of four main variables were employed, i.e., age, occupation, education, and gender because these are the main demographic characteristics of the respondents. Out of the four variables, three significantly contributed to the model. Significant factors were occupation, education, and gender. There is a significantly positive relationship observed between gender (B = .637, Wald = 1.145, p < 0.05) and the dependent variable (i.e., deforestation is the accelerating factor of climate change) followed by education (B = .542, Wald = 1.145, p < 0.05) and occupation (B = .467, Wald = .966, p < 0.05). Females are more worry about deforestation and climate change as compared to males. Educated people are more concerned about the negative consequences of deforestation and climate change as compared to the uneducated people. Local farmers and educated peoples working in different professions perceived that deforestation and climate change have adverse effects on the local and world climatic conditions.
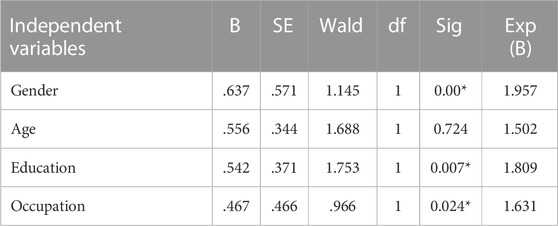
TABLE 4. Respondents’ characteristics and factual data based on model.
3.7 Main drivers of deforestation
The number of reasons that contribute to deforestation is very significant, and these factors are similar to the global deforestation trend. Primary and secondary drivers causing deforestation in the dry temperate forest of the Chilas sub-division are given in (Figure 4).
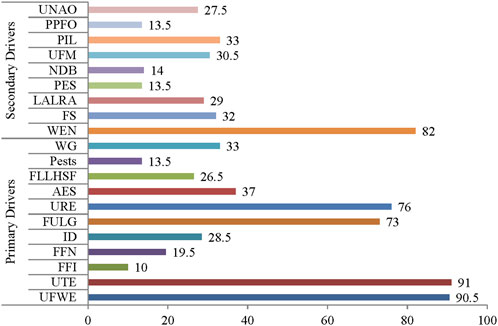
FIGURE 4. Percentage of primary and secondary drivers of deforestation. Where (UFWE = Unsustainable fuel wood extraction; UTE = Unsustainable timber extraction; FFI = Forest Fires (Intentional); FFN = Forest Fires (natural); ID = Infrastructure Development; FULG = Free and uncontrolled livestock grazing; URE = Urban and rural expansion; AES = Agricultural expansion for subsistence; FLLHS = Floods, Landslides, heavy Snowfall; WG = Weak governance; WEN = Wood energy needs; FS = Food security; LALRA = Lack of alternate livelihoods in rural areas; PES = Poor extension services; NDB = No demarcation of boundaries; UFM = Unsustainable forest management; PIL = Poor implementation of laws; PPFO = Political pressure on forest officers).
3.7.1 Primary drivers and secondary drivers
The BLR model was also employed to assess the main predicting primary and secondary drivers of deforestation. The outcomes of the model are displayed in Tables 5, 6.
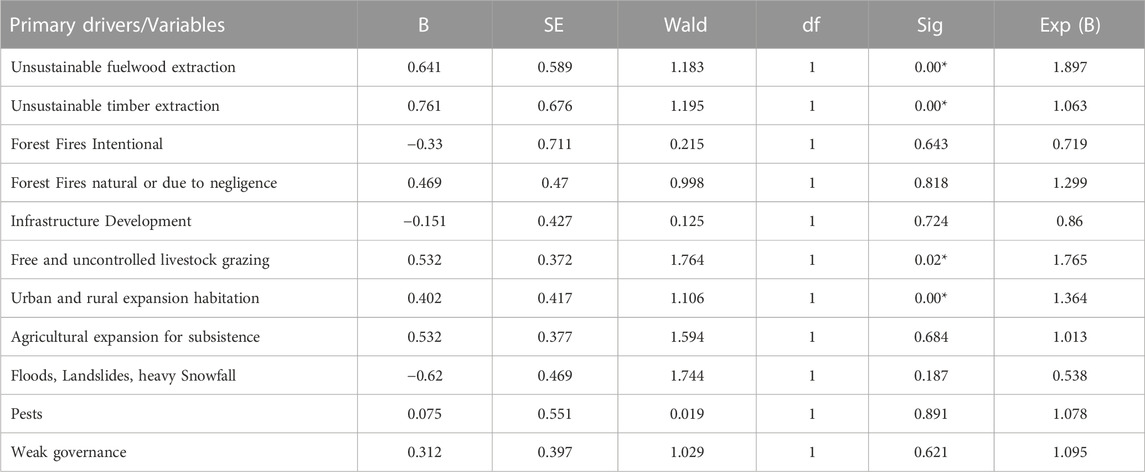
TABLE 5. Factual data based on model and primary drivers.
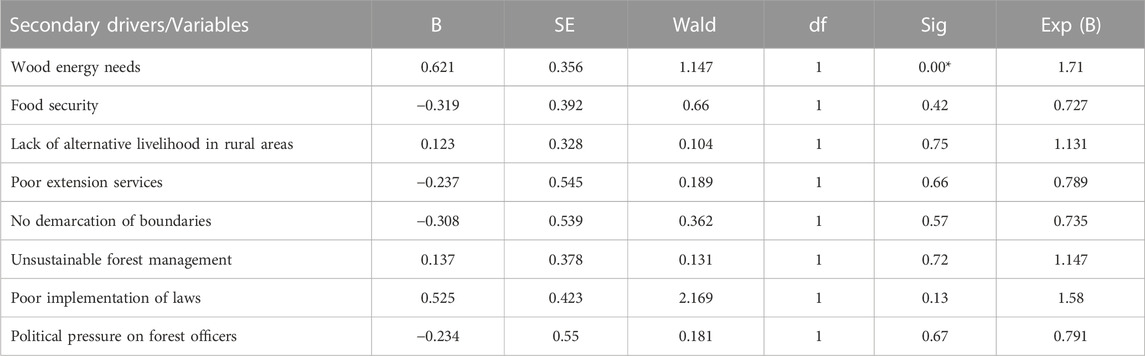
TABLE 6. Factual data based on model and secondary drivers.
3.7.2 Primary drivers
Eleven primary drivers were used in this BLR model. Four primary drivers showed significant contributions to the model out of eleven drivers. Unsustainable fuel wood extraction, Unsustainable timber extraction, Urban and rural expansion/habituation, and free and uncontrolled livestock grazing were significant predictors. Unsustainable timber extraction has showed significant positive relation (B = .761, Wald = 1.195, p < 0.05) followed by Unsustainable fuelwood extraction (B = .641, Wald = 1.183, p < 0.05), free and uncontrolled livestock (B = .532, Wald = 1.764, p < 0.05), and Urban and rural expansion/habituation (B = .402, Wald = 1.106, p < 0.05).
3.7.3 Secondary drivers
A total of eight secondary drivers were used in this BLR model. Out of eight drivers, only one secondary driver showed a significant contribution to the model. Wood energy needs had shown significant positive relation (B = .621, Wald = 1.147, p < 0.05) with the dependent variable (i.e., Deforestation).
The non-zero Wald statistical results demonstrate the link between the dependent and explanatory variables. As a result of the findings of this analysis, it is concluded that primary and secondary drivers are a substantial source of deforestation in the study area with a 95 percent confidence interval (p = 0.05).
4 Discussion
The tree species sampled during inventory consisted of six conifers Deodar (C. deodara), Kail (P. wallichiana), Fir (A. pindrow), Spruce (P. smithiana), Juniper (J. excelsa), Chilgoza (P. gerardiana), and three broadleaved species Birch (B. utilis), Oak (Q. incana) and Yew (T. baccata). Spruce is the dominant species (35.4%) followed by Kail (21.5%) and deodar (19.4%). Oak, Chilgoza, Juniper, Yew, Fir, and Birch are also present in the area but in a very small proportion. A similar result was also documented by other research studies conducted in the Gilgit Baltistan province (Raqeeb et al., 2014; Anwar et al., 2015; Ismail et al., 2018).
A total of 855 trees were tallied in all 36 plots. Thus, the average number of trees was estimated as 237 per ha. The highest number of trees (70.2%) was found in the sparse pure coniferous forest which indicated that deforestation has happened in the past years at a high rate. A research study (Raqeeb et al., 2021) findings are also similar to our results. He found that the forest area of diamer division has continuously declined since 1979. Figures 5–7 showed the land use changes for 3 decades, i.e., 1979–1990, 1990–1999 and 1999–2012 (Raqeeb et al., 2021). Anthropogenic activities may be responsible for changes in the distribution pattern of size classes and density (Akbar et al., 2014).
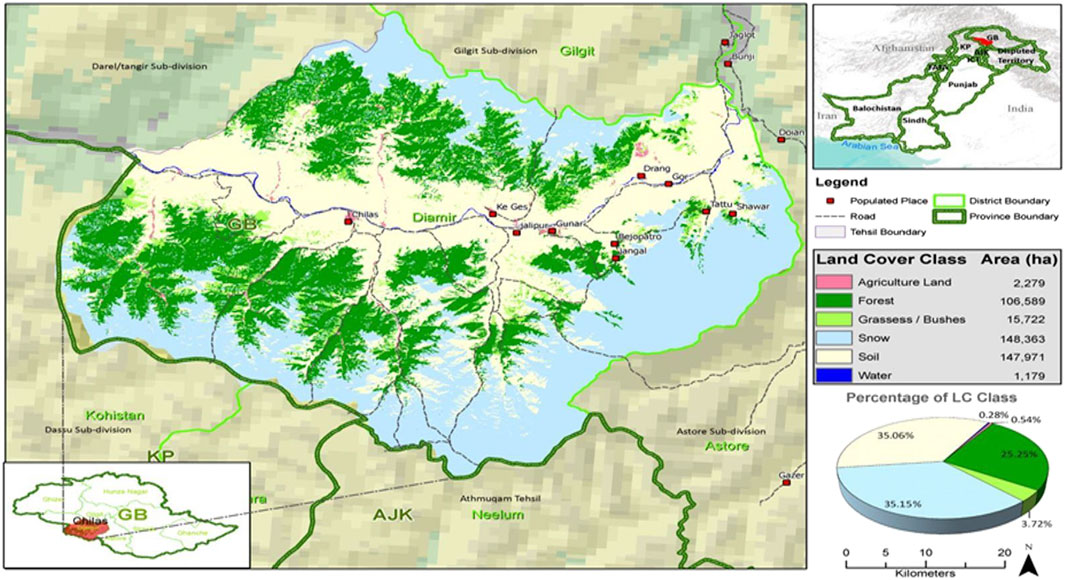
FIGURE 5. Land use changes from 1979–1990 in Daimer division especially in Chilas district. Source (Radeeb et al., 2021).
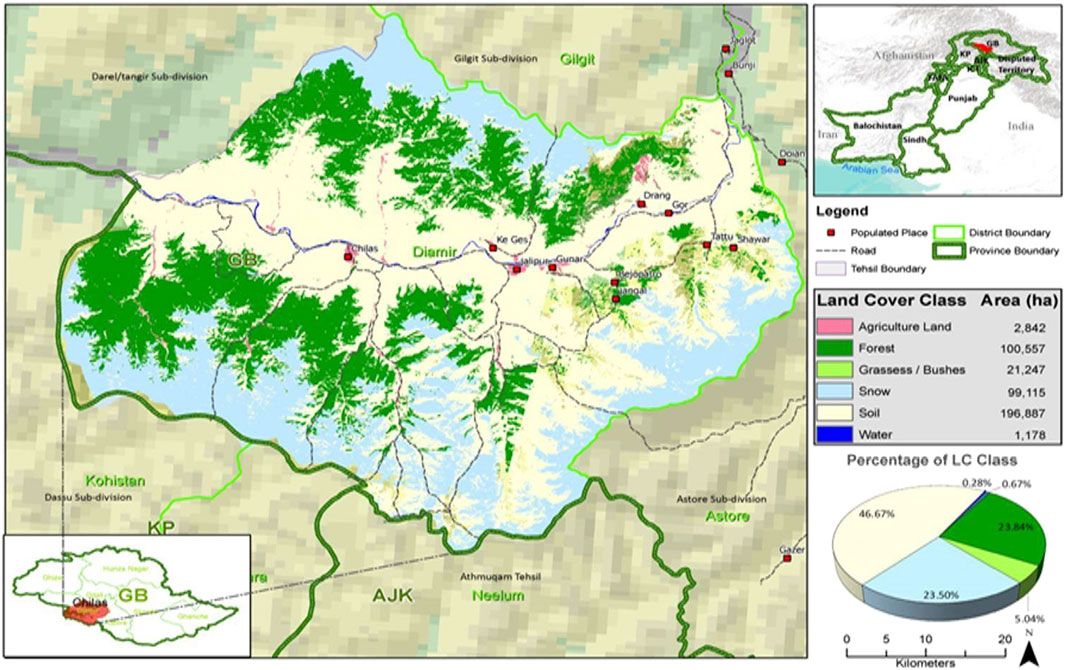
FIGURE 6. Land use changes from 1990–1999 in Daimer division especially in Chilas district. Source (Radeeb et al., 2021).
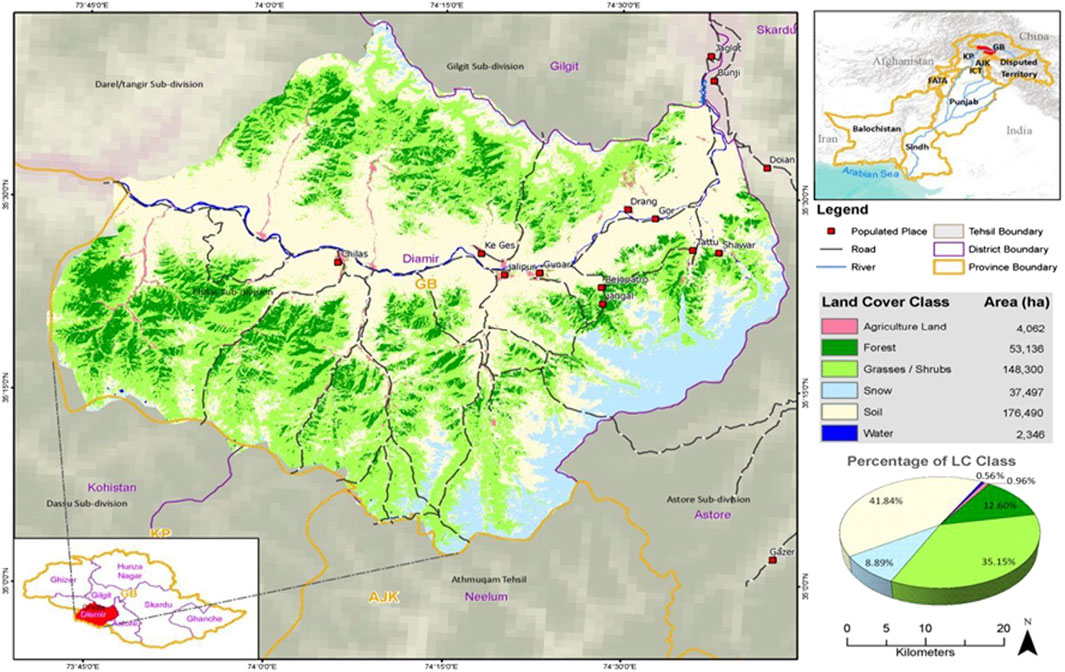
FIGURE 7. Land use changes from 1999–2012 in Daimer division especially in Chilas district. Source (Radeeb et al., 2021).
The BLR model evaluated the association between the demographic features of the local participant’s and deforestation. In this BLR model, a total of four variables were employed. Out of the four variables, three significantly contributed to the model. Significant factors were occupation, education, and gender. There is a significantly positive relationship observed between gender (B = .637, Wald = 1.145, p < 0.05) and the dependent variable (i.e., deforestation is the accelerating factor of climate change) followed by education (B = .542, Wald = 1.145, p < 0.05) and occupation (B = .467, Wald = .966, p < 0.05).
The number of reasons that contribute to deforestation is very significant, and these factors are similar to the global deforestation trend. Primary and secondary drivers causing deforestation in the dry temperate forest of the Chilas sub-division are given in (Figure 4). Four primary drivers showed significant contributions to the model out of eleven drivers. Unsustainable fuel wood extraction, Unsustainable timber extraction, Urban and rural expansion/habituation, and free and uncontrolled livestock grazing were significant predictors. Unsustainable timber extraction has showed significant positive relation (B = .761, Wald = 1.195, p < 0.05) followed by Unsustainable fuelwood extraction (B = .641, Wald = 1.183, p < 0.05), free and uncontrolled livestock (B = .532, Wald = 1.764, p < 0.05), and Urban and rural expansion/habituation (B = .402, Wald = 1.106, p < 0.05). A total of eight secondary drivers were used in this BLR model. Out of eight drivers, only one secondary driver showed a significant contribution to the model. Wood energy needs had shown significant positive relation (B = .621, Wald = 1.147, p < 0.05) with the dependent variable (i.e., Deforestation). These reasons were previously listed by various researchers for other forested areas of Pakistan (Akbar et al., 2011; Akbar et al., 2013; Akbar et al., 2014; Raqeeb et al., 2014; Anwar et al., 2015; Ismail et al., 2018; Ullah et al., 2020). According to the findings of this study, the dry temperate forest of Chilas is unstable with a wide size distribution. The majority of the forests had few seedlings, young trees, or no evidence of seedling recruitment. Another researcher found (Akbar et al., 2014) a similar result in the Chilgoza forest in the Goharabad district of Diamer, Gilgit Baltistan. The divide between the middle and upper classes is attributable to human perturbations. The existing practices are both dangerous and concerning for the future of these forests.
5 Recommendations and directions of future research
The findings of the both inventory and survey highlighted that deforestation in the study area occurred at a high rate. The responses of the local respondents were assessed through a regression model which indicated that there are four main primary drivers and one main secondary driver of deforestation in the study area. Therefore, following possible strategies were drawn based on the results to overcome deforestation in the study area.
• The first dominating primary driver is the cutting of trees by local people to collect fuel wood/firewood for cooking and heating purpose. Government should provide alternate energy sources for local inhabitants.
• The second dominating primary driver is the illegal cutting of trees for timber extraction. Green felling completely bans in the study area therefore the government should impose laws strictly and punish the offenders who are involved in illegal timber extraction.
• The third dominating primary driver is urban and rural expansion. Population growth is the root cause of urban and rural expansion. Government should control the population. Planned urbanization is also a proven method to reduce the attenuation of population growth. The fourth dominating primary driver is free and uncontrolled livestock grazing in the forest area due to which natural regeneration is almost none. Government should involve local people in the decision-making process and must be taken them in a confidant before making a management plan. It is also necessary to clarify the rights of the local inhabitants related to livestock grazing in the forest area.
• The only dominating secondary driver among others highlighted in this study is wood energy needs. The local peoples of the study area are fully dependent on the forest trees to fulfill their energy needs due to non-availability of alternate options. The government departments did not have a more active and clear policy. Unfortunately, even many forest areas of the country are managed without any proper management plan. Most laws and policies are outdated and must be revised. Government should provide electricity and gas facilities to the local inhabitants to reduce the burden from the forest area. A biogas plant scheme at the household level is one of the best options for the government to address the problem of wood energy needs.
6 Limitations of the research study
The findings of this study have to be seen in light of some limitations. The present study highlights the main drivers of deforestation by using respondents’ survey-based data and the current situation of deforestation by using forest inventory-based data in the study area. It provides a base for future sustainable forest management. However, due to limited financial and technical resources and time constraints were not able to conduct both forest inventory and respondents survey at the provincial and national level which will give more insight into the problem at a large scale. Future research should be conducted at the provincial or national level by involving international organizations especially Reducing Emissions from Deforestation and Forest Degradation in developing countries (REDD+), the Ministry of climate change at the national level, and provincial forest departments to address the problem at large scale and make a change in a current forest policy to reduce deforestation and its impact on human beings.
7 Conclusion
This research study concluded that the dry temperate forest of the Chilas subdivision has a high rate of deforestation. Most trees of the forest fall in immature and sub-mature (mainly in 10–20 and 20–30 cm) diameter classes and a little number of trees fall in mature and over-mature diameter classes which indicated deforestation occurred in the past. Results also depicted that the young seedlings of less than 10 cm in diameter are low in percentage due to slow natural regeneration because different anthropogenic factors influence it. After analyzing the perception of the local community participants by using the binary regression model (scale: yes “1” or No “0”) it is concluded that four primary drivers (unsustainable fuel wood extraction, unsustainable timber extraction and Urban and rural expansion/habituation, and free and uncontrolled livestock grazing) and one secondary driver wood for energy needs are the dominating drivers of deforestation as compared to other drivers. Government provision of alternative energy sources to the domestic population is advised to combat deforestation in the research area. Government officials should enforce laws and regulations aggressively and penalize anyone who participates in illicit timber extraction. Before creating a management plan, the government should consult the locals and engage them in the decision-making process. The rights of the locals regarding grazing livestock in the forest area must also be made clear. The local population should have access to electricity and gas services from the government to lessen the pressure on the forest area. One of the finest solutions for the government to deal with the issue of wood energy demands is a bio-gas plant program at the home level.
Data availability statement
The original contributions presented in the study are included in the article/Supplementary Material, further inquiries can be directed to the corresponding author.
Ethics statement
Ethical review and approval was not required for the study on human participants in accordance with the local legislation and institutional requirements. Written informed consent from the participants was not required to participate in this study in accordance with the national legislation and the institutional requirements.
Author contributions
Conceptualization, EA and MFA; Data curation, EA and EdA; Formal analysis, EA; Data and Funding acquisition, ARMTI, EdA, WZ and AA; Investigation, EA, MFA and ZR; Methodology, EA; Data Analysis through Software, SU and PM; Supervision, MFA; Writing-original draft, EA; Writing-review and editing, AA, WZ, PM and MJ. All authors contributed to the article and approved the submitted version.
Acknowledgments
Authors thanks to the Ministry of Climate Change, REDD + office, Islamabad, Pakistan for support during the study under the National internship program on REDD+ 2021.
Conflict of interest
The authors declare that the research was conducted in the absence of any commercial or financial relationships that could be construed as a potential conflict of interest.
Publisher’s note
All claims expressed in this article are solely those of the authors and do not necessarily represent those of their affiliated organizations, or those of the publisher, the editors and the reviewers. Any product that may be evaluated in this article, or claim that may be made by its manufacturer, is not guaranteed or endorsed by the publisher.
Supplementary material
The Supplementary Material for this article can be found online at: https://www.frontiersin.org/articles/10.3389/fenvs.2023.1151320/full#supplementary-material
References
Ahmad, S. S., Abbasi, Q., Jabeen, R., and Shah, M. T. (2012). Decline of conifer forest cover in Pakistan: A GIS approach. Pak. J. Bot. 44 (2), 511–514.
Akbar, M., Ahmed, M., Hussain, A., Zafar, M. U., and Khan, M. (2011). Quantitative forests description from Skardu, Gilgit and Astore districts of gilgit-baltistan, Pakistan. FUUAST J. Bio. 1 (2), 149.
Akbar, M., Ahmed, M., Shaukat, S. S., Hussain, A., Zafar, M. U., Sarangzai, A. M., et al. (2013). Size class structure of some forests from Himalayan range of Gilgit Baltistan. Sci., Tech. Dev. 32 (1), 56–73.
Akbar, M., Ali, S., Hyder, S., Ali, M., Begum, F., and Raza, G. (2015). Seedling age and growth rate of a gymnospermic tree species (Pinus wallichiana) from Ganji valley District Skardu Gilgit-Baltistan, Pakistan. Int. J. Adv. Res. 3 (4), 1057–1061. doi:10.21474/IJAR01
Akbar, M., Shaukat, S. S., Ahmed, M., Hussain, A., Hyder, S., Ali, S., et al. (2014). Characterization of diameter distribution of some tree species from Gilgit-Baltistan using weibull distribution. J. Bio. Env. Sci. 5 (4), 2220.
Ali, J., and Benjaminsen, T. A. (2004). Fuelwood, timber and deforestation in the himalayas: The case of Basho valley, baltistan region, Pakistan. Mt. Res. Dev. 24 (4), 312–318. doi:10.1659/0276-4741(2004)024[0312:ftadit]2.0.co;2
Ali, J., Benjaminsen, T. A., Hammad, A. A., and Øystein, B. D. (2005). The road to deforestation: An assessment of forest loss and its causes in Basho Valley, Northern Pakistan. Glob. Environ. Change Part A 15 (4), 370–380. doi:10.1016/j.gloenvcha.2005.06.004
Ali, R., Ali, B. K., Khan, M. Z., Khan, G., Abbas, S., and Ali, E. H. (2014). Baseline study of vegetation in doyan valley district Astore, gilgit-baltistan, Pakistan. Int. J. Emerg. Trends Sci. Techno. 1 (01), 7–19.
Anwar, A. S., Muhammad, Z., Hussain, K., Abbas, M., and Kiramat, H. (2015). Estimation of growing stock in dry temperate forests of Skardu, baltistan. Pak. J. For. 65 (1), 9–16.
Aslam, B., Gul, S., and Asghar, M. F. (2021). Evaluation of environmental degradation as an unprecedented threat to human security in Pakistan. Lib. Ar. Soc. Sci. Int. J. 5 (1), 197–211. doi:10.47264/idea.lassij/5.1.14
Gohar, A. (2002). “Competing interests and institutional ambiguities: Problems of sustainable forest management in the Northern Areas of Pakistan,” (England: University of Bath). PhD Diss.
Hishe, H., Giday, K., Haile, M., and Raj, A. (2015). The influence of socioeconomic factors on deforestation: A case study of the dry A fromontane forest of desa’a in tigra y region, northern Ethiopia. Int. J. Agri. Sci. Res. 5 (3), 339–348.
Ismail, I., Sohail, M., Gilani, H., Ali, A., Hussain, K., Hussain, K., et al. (2018). Forest inventory and analysis in gilgit-baltistan: A contribution towards developing a forest inventory for all Pakistan. Int. J. Clim. Chang. Strateg. Manag. 10 (4), 616–631. doi:10.1108/IJCCSM-05-2017-0100
Khan, H., Akbar, M., Zaman, M., Hayder, S., Khan, M., Nafees, M. A., et al. (2015). Diameter size class distributions of Pinus gerardiana Wall. Ex D. Don from gohar abad valley district diamer, gilgit-baltistan. Pak. J. Biodivers. Environ. Sci. 6 (2), 50–56.
Qamer, F. M., Shehzad, K., Abbas, S., Murthy, M. S. R., XI, C., Gilani, H., et al. (2016). Mapping deforestation and forest degradation patterns in western Himalaya, Pakistan. Remote Sens. 8 (5), 385. doi:10.3390/rs8050385
Raqeeb, A., Nizami, S. M., Saleem, A., and Hanif, M. (2014). Characteristics and growing stocks volume of forest stand in dry temperate forest of Chilas Gilgit-Baltistan. Open J. For. 4 (3), 231–238. doi:10.4236/ojf.2014.43030
Raqeeb, A., Saleem, A., Ansari, L., Nazami, S. M., Muhammad, M. W., Malik, M., et al. (2021). Assessment of land use cover changes, carbon sequestration and carbon stock in dry temperate forests of Chilas watershed, Gilgit-Baltistan. Braz. J. Biol. 84. doi:10.1590/1519-6984.253821
Shahzad, N., Saeed, U., Gilani, H., Ahmad, S. R., Ashraf, I., and Irteza, S. M. (2015). Evaluation of state and community/private forests in Punjab, Pakistan using geospatial data and related techniques. For. Ecosyst. 2 (1), 7–13. doi:10.1186/s40663-015-0032-9
Ullah, S., Gang, T., Rauf, T., Sikandar, F., Liu, J. Q., and Noor, R. S. (2020). Identifying the socio-economic factors of deforestation and degradation: A case study in Gilgit baltistan, Pakistan. Geo J. 87, 1657–1670. doi:10.1007/s10708-020-10332-y
Wahab, M. (2011). Population dynamics and dendro chronological potential of pine tree species from district Dir (Doctoral dissertation. Pakistan: Federal Urdu University of arts, science and technology, gulshan-e-iqbal campus Karachi-75300.
Keywords: deforestation, climate change, causes of deforestation, binary logistic regression model, dry temperate forest, Gilgit Baltistan
Citation: Ali E, Azhar MF, Alam E, Rehman Z, Ullah S, Ahmad A, Towfiqul Islam ARM, Zaman W, Javed M and Mittal P (2023) Deforestation perspectives of dry temperate forests: main drivers and possible strategies. Front. Environ. Sci. 11:1151320. doi: 10.3389/fenvs.2023.1151320
Received: 25 January 2023; Accepted: 24 July 2023;
Published: 17 August 2023.
Edited by:
Zengyun Hu, Chinese Academy of Sciences (CAS), ChinaReviewed by:
Dastan Bamwesigye, Mendel University in Brno, CzechiaKhandaker Jafor Ahmed, Georgetown University, United States
Copyright © 2023 Ali, Azhar, Alam, Rehman, Ullah, Ahmad, Towfiqul Islam, Zaman, Javed and Mittal. This is an open-access article distributed under the terms of the Creative Commons Attribution License (CC BY). The use, distribution or reproduction in other forums is permitted, provided the original author(s) and the copyright owner(s) are credited and that the original publication in this journal is cited, in accordance with accepted academic practice. No use, distribution or reproduction is permitted which does not comply with these terms.
*Correspondence: Ehsan Ali, RWhzYW5hZ3JpOTdAZ21haWwuY29t