 Wan Zhou
 Dedi Liu
 Jiayu Zhang
 Sainan Jiang1
- 1State Key Laboratory of Water Resources and Hydropower Engineering Science, Wuhan University, Wuhan, China
- 2Gansu Research Institute for Water Conservancy, Lanzhou, China
Drought–flood abrupt alternation (DFAA), which is defined as the rapid transition between drought and flood in a short period, amplifies the negative impacts of individual drought or flood. DFAA is divided into drought to flood (DTF) and flood to drought (FTD) according to the sequences of drought and flood. Previous studies of identifying DFAA events have mostly been conducted over a long timescale (e.g., over a month), leading to inaccurate identification or omissions of DFAA events. In addition, frequency analysis of DTF and FTD events, which is vital for the design of hydraulic structures and water supply systems, has rarely been studied. This study establishes an identification method for DFAA events based on a daily-scale standardized weighted average of the precipitation index (SWAP) and conducts frequency analysis of DTF and FTD events based on copula theory. The Han River Basin (HRB), China, a crucial area for water resource management, was selected as the study area. Our findings disclose that DFAA events occurred less frequently with larger intensities and durations between 1961 and 2020. The temporal trends of DTF and FTD events varied similarly, while the number of DTF events were less than that of FTD events, indicating that FTD is the main performance of DFAA in HRB. In addition, the identification processes of DFAA events at the Wuhan station were analyzed in detail and proved that SWAP is an effective index for capturing the change of precipitation and accurately depicting the occurrences of droughts and floods. Furthermore, drought intensity (DI) and flood intensity (FI) were selected for bivariate frequency analysis. An OR case was defined as DI ≥ di or FI ≥ fi, while an AND case was defined as DI ≥ di and FI ≥ fi. The results of frequency analysis showed that joint return periods (JRPs) of DFAA events under the OR case are basically equal in three sub-basins, meaning a similar occurrence of probability of drought–flood disaster. JRPs under the AND case increased from the upper and middle basins to the lower basin as a whole, indicating the decreasing risk of abrupt drought–flood transitions. Overall, this study may have potential value in the early warning and mitigation of DFAA disaster.
1 Introduction
Global warming, accompanied by the acceleration of urbanization and continuous development of industry, has intensified the global water cycle and reduced system stability (Milly et al., 2002), leading to a considerable increase in the frequency and magnitude of extreme climatic events (Milly et al., 2002; Yin et al., 2018a; Bian et al., 2021; Chiang et al., 2021; Naumann et al., 2021). For example, the temporal-spatial heterogeneity of precipitation has amplified continuously (Madakumbura et al., 2019; Chen et al., 2020a) and resulted in frequent and widespread occurrences of droughts and floods (Dai et al., 1998; Annamalai and Slingo, 2001; Giorgi et al., 2011). Thus, droughts and floods have been the most common and harmful natural disasters (Bruce, 1994; Zhou et al., 2002). Though there is no general concept on drought (Mishra and Singh, 2010), it is widely recognized as a multi-scalar natural disaster and determined by regionally available water resources in terms of soil moisture, ground water, snowpack, streamflow, and reservoir storages over a certain time period (McKee et al., 1993). According to the sources of water demand, droughts have been categorized into meteorological, hydrological, agricultural, and socio-economic droughts (Wilhite and Glantz, 1985). However, flood is the natural disaster in which excessive water cannot be drained in time due to continuous precipitation or extremely heavy rain and usually causes submergence of low-lying areas (Zhou et al., 2020). Owing to the amplification of spatiotemporal heterogeneity of precipitation, droughts and floods have been found to alternate rapidly, namely, drought–flood abrupt alternation (DFAA) events.
DFAA refers to the consecutive occurrence of drought and flood in a short time period (Wu et al., 2006b; Shan et al., 2018b; Chen et al., 2020a; Shi et al., 2021) and thus is a compound event generally caused by complex interrelationships between drought and heavy rainfall (Chen et al., 2020a). Although slight precipitation can occasionally alleviate drought conditions (Chen et al., 2020b), an abrupt alternation between drought and flood can cause substantial damage, which is even worse than a single disaster (Wu et al., 2006b; Handwerger et al., 2019; Chen et al., 2020b; He and Sheffield, 2020; Qiao et al., 2022). In addition, as DFAA usually coincides with the growth period of crops (Fan et al., 2019), it can bring enormous negative effects on agricultural production, ecosystems, and economic development (Clark et al., 2012; Huang et al., 2014; De Silva and Kawasaki, 2018; Fan et al., 2019). Owing to the abrupt alternation between drought and flood and their different characteristics, the disaster response to DFAA is often a mess as there is usually only one type of disaster (drought or flood) to be concerned about. Thus, it is important to effectively identify DFAA events in advance and explore the law of occurrence for DFAA disaster prevention and mitigation. There are two types of DFAA according to the sequences of drought and flood (Wu et al., 2006a; Shi et al., 2021; Qiao et al., 2022). One is from drought to flood (DTF), and the other is from flood to drought (FTD) (Qiao et al., 2022). Specifically, DTF is a process in which flood occurs due to heavy rainstorms after prolonged drought; however, excessive rain is still insufficient to break the drought (Zhang et al., 2021). FTD refers to a process that alternates from extreme flood to drought due to a lack of precipitation and continuous evapotranspiration (Xiong, 2017). As the alternation time of DTF is shorter and more rapid than that of FTD (Xiong, 2017), DTF and FTD events should be identified separately with different methods.
Many scholars have explored the identification of DFAA events based on various drought–flood indexes. For example, Wu et al. (2006b) proposed a drought–flood coexistence index on a seasonal timescale to investigate the co-occurrence of droughts and floods during the normal summer monsoons. Shan et al. (2018a) developed a daily-scale index, a dry–wet abrupt alternation index with a fixed transition time of dry and wet stages, and analyzed the spatial-temporal characteristics of the transition between dry and wet spells in the summer. Chen et al. (2020b) and Qiao et al. (2022) explored the future changes of DFAA events in China using a monthly-scale index (i.e., the standardized precipitation evapotranspiration index). These previous studies have focused on distinguishing DFAA events over a long timescale (e.g., over a month) or a fixed transition time. In this way, DFAA events are sometimes difficult to identify when drought and flood processes are neutralized (Shan et al., 2018a; Fan et al., 2019; Yang et al., 2019; Zhang et al., 2021), and this leads to a large underestimation of the possible risks of compound drought–flood hazard (Zhang et al., 2021). Furthermore, the details of DFAA events (e.g., the specific information on drought, flood events, and change point) are hard to figure out (Fan et al., 2019). The process of drought is commonly slow and cumulative, while the process of flood is fast and episodic (Sun et al., 2016; Zhang et al., 2021), so a method for identifying and analyzing them should be flexible with timescale. To accommodate the timescale problem, Lu (2009) proposed the weighted average of precipitation (WAP) index for measuring the relative daily flood and drought extent and further developed the non-dimensional standardized WAP (SWAP) index to obtain reliable information on drought (flood) over each specific area (Lu et al., 2014). Several studies have investigated the DTF events based on the SWAP index in the Yangtze River Basin and the Han River Basin (Yang et al., 2019; Zhao et al., 2019). However, few studies have been performed on FTD events that can lead to disaster.
Frequency analysis of extreme hydrological events (e.g., droughts and floods) is commonly used in the design of hydraulic structures and water supply systems (Shiau, 2003). As DFAA presents more challenges to water resource management (Fang et al., 2019; Zhang et al., 2021), frequency analysis of DFAA events needs further exploration (Huang et al., 2014). As DFAA events are multivariate random events that are characterized by a few correlated random variables (Huang et al., 2014), multivariate distribution is required for the frequency analysis of DFAA (Shiau, 2003). As copulas are functions that join univariate distribution functions to form multivariate distribution functions, they can model the dependence structure among random variables independently (Shiau, 2006). In addition, copulas are widely applied in hydro-meteorological extreme events because of their flexibility and fewer limitations on the types of marginal distributions that need to be connected (Sklar, 1959; Shiau, 2003; 2006; Huang et al., 2014). Studies have constructed bivariate or multivariate copula functions for DFAA events to investigate the probabilistic characterization of the compound drought–flood disaster (Huang et al., 2014; Wu et al., 2017; Xiong, 2017; Fang et al., 2019). Thus, frequency analysis of DTF and FTD events can be carried out using the copula function.
Identification of drought or flood with a flexible timescale index can not only obtain more precise results but also capture more precise details of the compound disaster, which helps in drought–flood prevention and mitigation (Fan et al., 2019; Zhang et al., 2021). Therefore, the main goals of our study are as follows: (1) quantitatively identify DFAA events based on the daily-scale SWAP index and 2) carry out frequency analysis of DFAA events through bivariate distribution based on the copula function. The remainder is organized as follows: the methods used are introduced in the next section (Methodology), followed by the Study Area and Data section. The Results and Discussion section features the results of the case study, which are then discussed. The final section draws the main conclusions.
2 Methodology
There are three parts for the identification and frequency analysis of DFAA events (Figure 1). The first part is SWAP series formation based on daily precipitation. The second part is the identification of DFAA events, including the identification of drought, flood, DTF, and FTD events. The last part is frequency analysis of DFAA events based on the bivariate joint distribution.
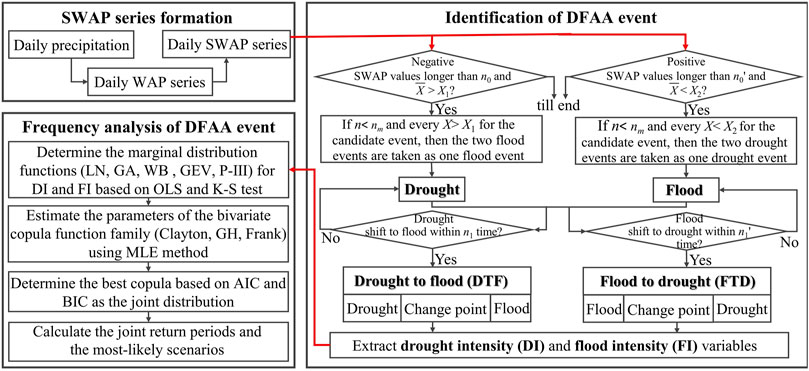
FIGURE 1. Flowchart of the identification and frequency analysis of the DFAA event.
2.1 Standardized weighted average of precipitation
Lu (2009) proposed a weighted average of precipitation (WAP) index to characterize the daily drought and flood extent, which can monitor drought (or flood) on multiple timescales, from daily, weekly, monthly, to longer scales. WAP is defined by the current precipitation, the cumulative contribution, and the decay effects of the antecedent precipitation as:
where Pn denotes the daily precipitation that happens n days prior to the present day, and n = 0 represents the present day. N is the maximum number of the earlier days for calculating the daily WAP and can be determined by the parameter a. a
However, WAP can only reflect the relative drought and flood conditions at a specific location or area (Lu, 2009). Thus, Lu et al. (2014) further developed the non-dimensional SWAP index to compare the severities of drought or flood in different areas. The WAP had been standardized into SWAP through transforming the gamma distribution of WAP into a standard normal distribution as shown in Eq. 2 (Lu et al., 2014):
where β and γ are the scale and shape parameters of the Γ function, respectively. As SWAP is normally distributed, the negative value of SWAP means the arid state, while the positive value of SWAP means the humid state. The greater value of SWAP indicates a more humid state, while the lower value of SWAP indicates a more arid state. However, only the value of SWAP lower or greater than a threshold can be defined as drought or flood.
2.2 Identification of drought, flood and DFAA events
There are two types of DFAA events (i.e., DTF and FTD events). However, irrespective of the DTF event or the FTD event, drought and flood events should be identified first.
2.2.1 Identification of drought and flood events
A drought or flood event can be identified using the theory of runs. The theory of runs was proposed by Herbst et al. (1966) and has been widely applied in the screening of drought or flood events to extract their characteristics, including start, end, and severity (Yang et al., 2019; Zhao et al., 2020). The identification procedure for drought or flood events is illustrated in Figure 2.
1) If there are n time steps in sequence with every X < 0 or X ≥ 0, the whole n states are defined as a candidate of drought event or flood event. The start time is Ts, while the end time is Te. For example, there are four candidates of drought event (i.e., I, II, III, and IV) and five candidates of flood event (i.e., I’, II’, III’, IV’, and V’), as shown in Figure 2.
2) If n > n0 (n0 is the threshold of a drought or flood event period) for a candidate event, the intensity of the candidate event
3) If there are two drought or flood events in sequence, there might be one or more losing candidate events between them. If n < nm (nm ≤ n0) and every X < X2 (or X > X1) for the losing candidate event, the two drought or flood events can be merged as one drought or flood event. The duration of the merged event N is the sum of the durations of the two drought or flood events and the losing candidate event, while its magnitude of the merged event M is only the sum of the two drought or flood events. The intensity of the merged event I is the quotient of magnitude and duration (I = M/N). For example, there is a merged drought event (i.e., II and III) in Figure 2, and its duration, magnitude, and intensity are N = n2+n3'+n3, M = m2+m3, and I=(m2+m3)/N, respectively.
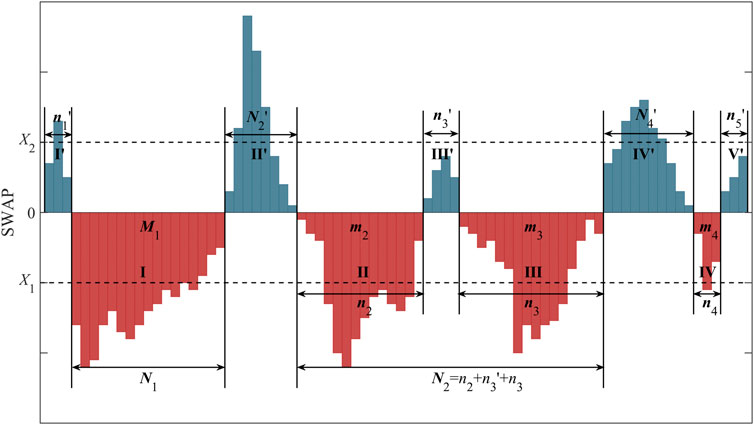
FIGURE 2. Illustration outlining the identification of drought or flood events based on the SWAP index and the theory of runs.
2.2.2 Identification of DFAA events
If a drought event with duration Dd and a flood event with duration Df are adjacent, the time interval Da between the end time of the former event Te1 and the start time of the latter event Ts2 is Ts2−Te1−1. If Da ≤ n1, a DTF (the former is a drought event) or FTD (the former is a flood event) event can be defined. Thus, the duration D of the DFAA event (i.e., DTF or FTD) is Dd + Da + Df. Drought intensity of DFAA DI is assumed to be the intensity of the drought event. Additionally, the flood intensity of DFAA FI is assumed to be the intensity of the flood event. DI of DTF and FTD are denoted by subscripts 1 and 2, respectively.
As the measures of preventing the drought and flood disasters are quite different, a change point between drought and flood within DFAA should be identified. The change point of the DFAA event is defined as the time with the maximum drought–flood abrupt alternation intensity Kmax shown in Eq. 3 (Yang et al., 2019):
where Kmax of DTF and FTD are denoted by subscripts 1 and 2 respectively.
2.2.3 Dry–wet abrupt alternation index
To verify the detected DFAA events, the dry–wet abrupt alternation index (DWAAI) is selected to conduct cross verification on DTF events. DWAAI was improved by Shan et al. (2018a) on the basis of the long-cycle drought–flood abrupt alternation index (Wu et al., 2006a). Additionally, it is a daily-scale indicator that takes into account both the urgency and magnitude difference of meteorological condition between the former drought period and the latter flood period in a DTF event, as shown in Eq. 4 (Shan et al., 2018a)
where SPA denotes the standardized precipitation anomalies (Maheras et al., 1999); SPAformer and SPAlatter denote SPA in the former and the latter periods, respectively; SAPIi denotes the standardized antecedent precipitation index (SAPI) (McQuigg, 1954) at the ith time in the latter period, while SAPI0 denotes SAPI at the last time in the former period; n is the number of time steps in the latter period; and a = 1.3 is a weight coefficient, as suggested by Shan et al. (2018a).
For DTF events, the former drought period is assumed to be 44 days, taking the precise truncation of 1‰ as the influence of antecedent daily precipitation on current drought and flood degree is attenuated (Lu, 2009), while the latter flood period is assumed to be 10 days (Shan et al., 2018a). In addition, the time with the largest DWAAI value during flood season (May to August) is taken as the change point of DFAA events (Shan et al., 2018a).
2.3 Frequency analysis of DFAA events
As there are two sub-events in a DFAA event, at least two variables should be considered for the frequency analysis of DFAA events. Copula function can construct a joint distribution function through modeling the dependence structure among random variables independently (Shiau et al., 2006); hence, it is used to conduct frequency analysis of DFAA events. As the intensity of the DFAA event represents the degree of drought (or flood) and is most concerning, both drought intensity DI and flood intensity FI are taken as variables for the intensity frequency analysis of DFAA events to explore their correlations. Specifically, the marginal distributions of DI and FI are determined individually to obtain their joint distribution function through copula function.
2.3.1 Marginal distribution function
As the distributions of DI and FI are often described by log-normal (LN), gamma (GA), two-parameters Weibull (WB), generalized extremum value (GEV) and Pearson type Ⅲ (P-Ⅲ) distributions, all of them are taken as candidates to fit the marginal distributions of DI and FI. The best marginal distributions of DI and FI will be obtained by the smallest values of the ordinary least squares (OLS) and Kolmogorov–Smirnov (K-S) test (Benjamin and Cornell, 1970).
2.3.2 Copula functions
According to Sklar’s theorem (Sklar, 1959), a bivariate probability distribution F(di, fi) of DI and FI can be expressed by their marginal distributions and the associated dependence function:
where C denotes a copula function; C(FDI(di), FFI(fi)) represents the combined cumulative distribution function based on the copula function; FDI(di) and FFI(fi) denote the cumulative distribution functions (CDF) of DI and FI, respectively.
As three Archimedean copulas (i.e., Clayton, Gumbel, and Frank) are widely used in hydrologic frequency analysis, all of them are selected as candidates for bivariate distribution functions of DI and FI (Frees and Valdez, 1998; Nelsen, 1999):
where θ is a parameter of copula and measures the degree of correlation between FDI and FFI.
The parameter θ is estimated by the maximum likelihood estimate (MLE) method. The Akaike information criterion (AIC) (Bozdogan, 1987), Bayesian information criterion (BIC) (Schwarz, 1978), and K-S test (Benjamin and Cornell, 1970) are used to evaluate the goodness-of-fit of every candidate copula function. The smaller the AIC and BIC values, the better goodness-of-fit of the copula function.
2.3.3 Univariate and joint return period
The univariate return periods of DI and FI are calculated as Eq. 10 and Eq. 11 (Shiau and Shen, 2001; Shiau, 2006)
where μ denotes the expected inter-arrival time of DFAA events and TDI and TFI denote the univariate return periods of DI and FI, respectively.
Both the OR({DI ≥ di}
2.3.4 The most-likely scenario
Given a TOR or TAND, there are infinite combinations of DI ≥ di and FI ≥ fi that can constitute a contour as a design curve. Owing to the different likelihoods of every combination, the most-likely combination (MLC) (di*, fi*) can be identified by the most-likely design realization method proposed by Salvadori et al. (2011).
where f(di, fi) represents the joint probability density function of DI and FI; c[FDI(di), FFI(fi)]dC[FDI(di), and FFI(fi)]/d(FDI(di) FFI(fi)) represent their copula probability density function; and fDI(di) and fFI(fi) are the marginal probability density functions of DI and FI, respectively.
3 Study area and data
3.1 Study area
The Han River, the longest tributary of the Yangtze River in China, stretches 1,577 km from Shaanxi to Hubei provinces, merging into the Yangtze River in Wuhan City. The Han River basin (HRB) is in the north subtropical monsoon zone where there is a large heterogeneity in the spatial and temporal distributions of precipitation. The average annual precipitation in the HRB is approximately 700–1,400 mm, which gradually increases from the upper to the lower basin and decreases from south to north in the upper basin.
The HRB experiences drought and flood disasters frequently due to its geographical location and topographic characteristics (Chen et al., 2007). Additionally, the HRB is the water source for the middle route of the South-to-North Water Diversion Project (SNWDP) and plays a highly significant strategic role with regard to water resources. Hence, it is crucial to understand the spatio-temporal distribution and evolution mechanism of DFAA events in the HRB for the water resource management in China. According to water system and channel characteristics in the HRB, three sub-basins are divided to understand the spatial distribution of DFAA events (Figure 3). They are the upper sub-basin (UB), the middle sub-basin (MB), and the lower sub-basin (LB).
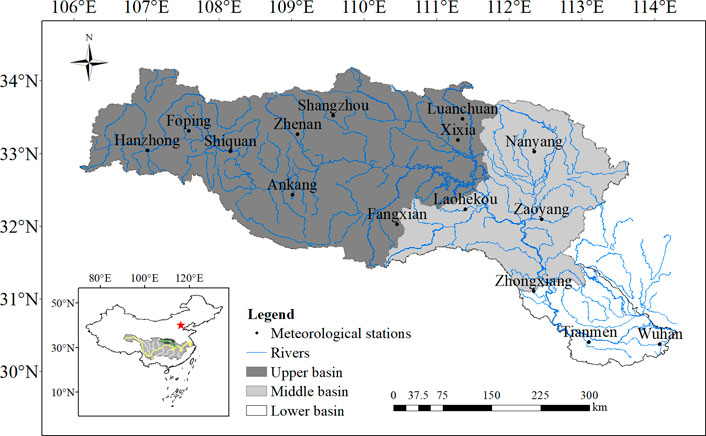
FIGURE 3. Locations of meteorological stations used in the HRB.
3.2 Data
Daily precipitation data between 1961 and 2020 were obtained from the China National Surface Weather Stations Basic Meteorological Observation Dataset (V3.0) released by the National Meteorological Information Center (NMIC) of China. Thus, the location and number of these weather stations in the HRB were selected by the NMIC after considering their representativeness. There are 15 meteorological stations, including nine stations in the UB (Luanchuan, Hanzhong, Foping, Shangzhou, Zhenan, Xixia, Shiquan, Ankang, and Fangxian), three stations in the MB (Nanyang, Laohekou, and Zaoyang), and three stations in the LB (Zhongxiang, Tianmen, and Wuhan) (Figure 3).
4 Results and discussion
As DFAA events are better detected on a flexible timescale, the identification of DFAA events is conducted on a daily timescale here. n0 for drought events is set as 15 days, while n0’ for flood events is set as five days; X1 is set as 0.5 (the lower limit of mild flood), while X2 is set as −0.5 (the upper limit of mild drought); nm is set as 5 days; n1 for identifying DTF events is set as 5 days, while n1’ for identifying FTD events is set as 15 days (Xiong et al., 2017; Yang et al., 2019; Zhao et al., 2020).
4.1 Identification of DFAA events
4.1.1 Spatio-temporal distribution of DFAA events
According to the procedure for identifying DFAA events, annual occurrence, intensity, and duration of DTF and FTD events from all 15 stations were obtained and are shown in Figure 4. The linear fitting lines of DFAA events show that the occurrence of DFAA illustrates a decreasing tendency (Figure 4A), while intensity and duration exhibit an upward trend (Figures 4B, C). The result that the DFAA events have emerged less frequently is in agreement with previous studies (Zhao et al., 2019; Zhao et al., 2020). In Figure 4A, the numbers of DTF and FTD events show significant variability not only on the interannual timescale but also on the decadal timescale. Specifically, the decadal average numbers of DTF and FTD events varied with similar trends between 1961 and 2020, i.e., low in the 1960s, high in the 1970s, and relatively stable after the 1970s. The maximum number of DTF events was found in 1986, while the maximum number of FTD events occurred in 1994. The minimum number of DTF events occurred in 1964, while the minimum number of FTD events occurred in 1983. These results indicate that DTF and FTD events do not occur synchronously on the annual scale. There were only 1,977 DTF events, while there were 2,216 FTD events between 1961 and 2020. In other words, there were four DFAA events annually in the HRB. It can be speculated that there are successive DTF and FTD events as more than one DTF and FTD event occurred in some years, and this is more complex and can bring about more damage (Qiao et al., 2022). The numbers of the DFAA event here are greater than the results of previous studies (Zeng, 2000; Cheng et al., 2012; Zhao et al., 2020). One of the reasons is that DTF or FTD events occurred in both flood or non-flood seasons. While the previous studies only consider DFAA events in the flood season (Cheng et al., 2012; Shan et al., 2018a; Yang et al., 2019; Shi et al., 2021), taking the non-flood season into account can help determine the start, end times, and the intensity of the DFAA event, which are valuable for the decision maker to prevent or mitigate disaster.
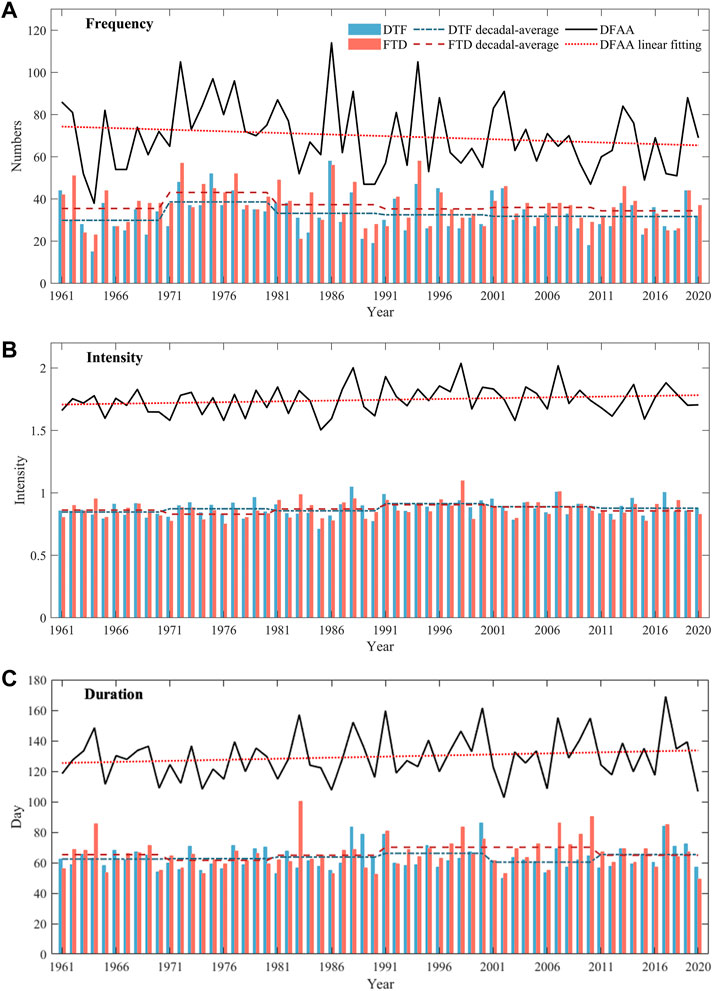
FIGURE 4. Characteristics of DTF, FTD, and DFAA events in the HRB between 1961 and 2020: (A) numbers, (B) intensity, and (C) duration.
The spatial distributions of numbers and drought–flood abrupt alternation intensity Kmax of the DFAA event were obtained using the inverse distance weighted method shown in Figure 5. In terms of DTF events, their numbers and Kmax1 in the lower UB and MB are greater than those in the LB. This pattern has also been observed in previous studies (Zhao et al., 2020). As for FTD events, their numbers and Kmax2 in the lower UB and LB are greater than those in the MB. These results indicate that most DFAA events occurred in the lower UB, which has a direct impact on the middle route of SNWDP. In addition, numbers of DTF events were slightly less than those of FTD events, while Kmax1 was greater than Kmax2. As DTF events are mainly induced by heavy rain after long-term drought, their transition time is shorter and more rapid; thus, the abrupt alternation intensity of a DTF event is greater than that of FTD.
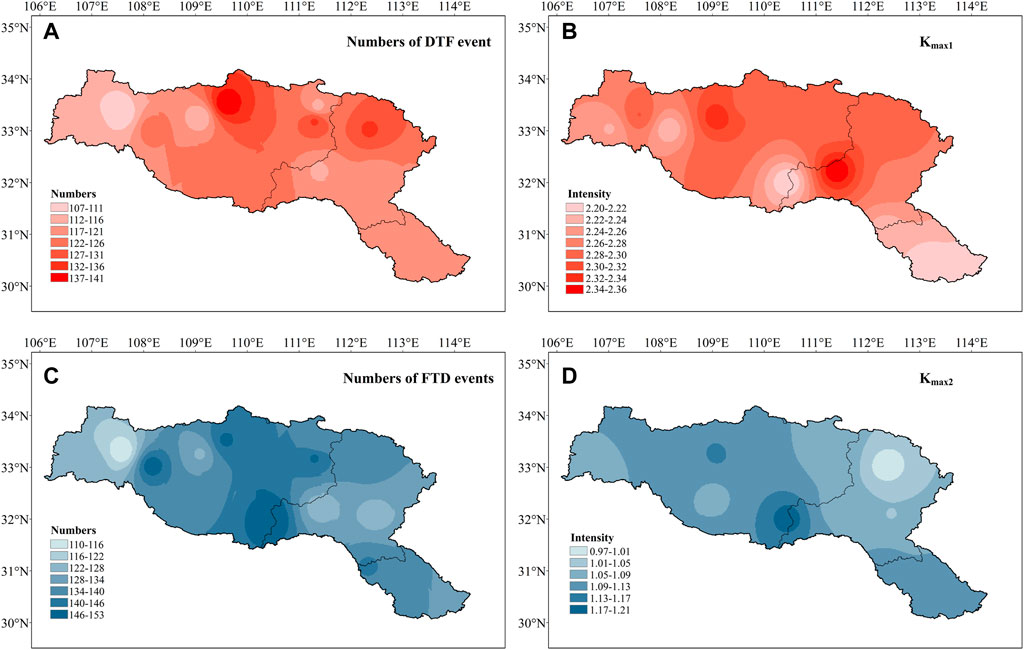
FIGURE 5. Spatial interpolations of DFAA characteristics in the HRB between 1961 and 2020: (A) number of DTF events, (B) Kmax1, (C) number of FTD events, and (D) Kmax2.
The summary description of DTF and FTD events are listed in Supplementary Table S1, and the numbers of DTF and FTD events in each sub-basin were similar. However, DTF events in the MB were the highest, with the highest average Kmax1, while FTD events in the LB were the highest, with the highest Kmax2. The maximum DI, Kmax, and FI of both the DTF and FTD events were all highest in the UB, which indicates that DFAA events in the UB are more disastrous. Kmax1 was much larger than Kmax2, which is consistent with previous results. In addition, the numbers of FTD events were more than those of the DTF events in all three sub-basins. The evolution of DFAA events in the middle-lower reaches of the Yangtze River basin has also been shown by Shan et al. (2015) that FTD events are the main performance of DFAA events. Particularly, typical FTD events in the HRB are primarily caused by a negative precipitation anomaly following multiple heavy precipitation processes or continuous rainfall in summer. Thus, attention should be paid to reservoir impounding in flood season to cope with the subsequent long-lasting drought.
4.1.2 Discussions on identification processes of DFAA events
As there are long-observed data at the Wuhan station, it has been selected as an example to illustrate the detailed identification processes of DFAA events. After the drought and flood events are identified and also examined with historical records (Qiao, 1989; Xiang, 2002; Jiang et al., 2007; Office of state Flood Control and Drought Relief Headquaters, 2012; Ministry of Water Resources of the People’s Republic of China, 2019), DFAA events are determined and then their characteristics (e.g., change points) are compared with the results from the DWAAI.
Based on the drought identification illustrated in the Identification of Drought and Flood Events section, the ten drought events with the largest magnitudes were obtained and compared with historical disaster records (Table 1). The start and end times of all the ten drought events agreed with the timespan of corresponding historical records. As an illustration, the drought event in 2011 occurred from January 4th to June 6th, which is in accordance with the historical record ‘continuous drought in spring and summer’. The durations of the historical drought record are just fuzzy, while the start and end times of the drought event detected here have been precisely detected. The monthly distributions of these ten drought events show that drought can occur in each month and occur more frequently during July to November. Even if the magnitudes of diverse drought events are slightly different, their disasters can be quite different due to their varying durations. Thus, a drought event should be represented by multiple variables to indicate its multiple features. Taking two drought events (③ and ⑦ in Table 1) in 1973 and 2019 as examples, their magnitudes are not significantly different while the duration of the event in 2019 is 52 days longer. The intensity of the drought event in 1973 was −1.72, while the event in 2019 was −1.03, which reveals that the evolution of the drought event in 1973 is more rapid.
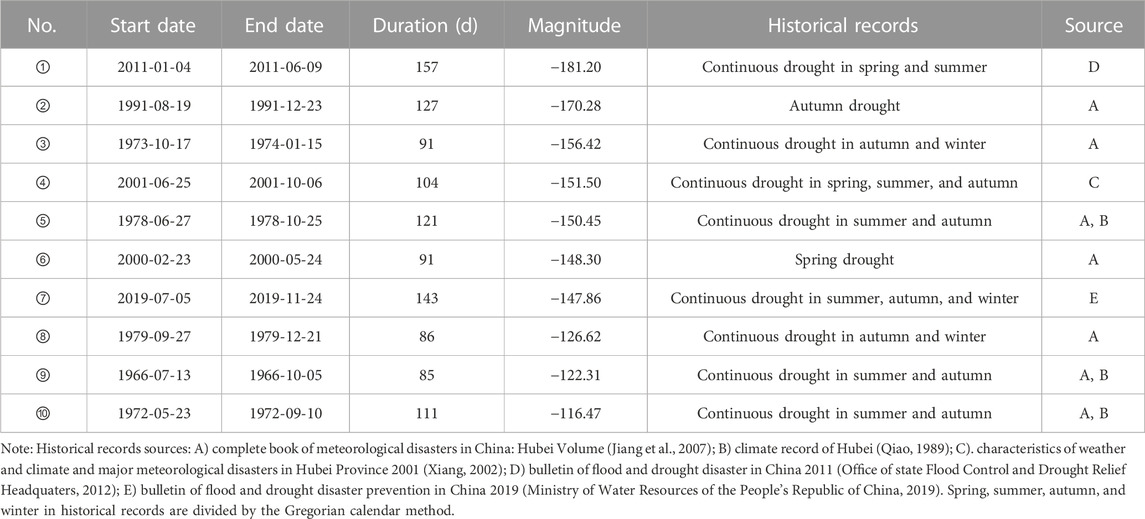
TABLE 1. Drought events with the ten largest magnitudes at the Wuhan station.
The rainstorm flood events corresponding to the top ten maximum daily precipitations are shown in Table 2. The date with the top ten daily precipitations is defined as rainstorm date. All the ten rainstorm dates occurred in the summer. Three rainstorm dates coincided with the start dates of corresponding rainstorm flood events (i.e., ①, ⑤ and ⑩), while the other seven rainstorm dates fell within the flood events. A special rainstorm flood event in 2016 involved two rainstorm dates. Flood frequently occured from June to October according to the distribution of the ten rainstorm flood events. Additionally, the durations of the events ranges from 15 to 82 days, while their average duration was 43 days.
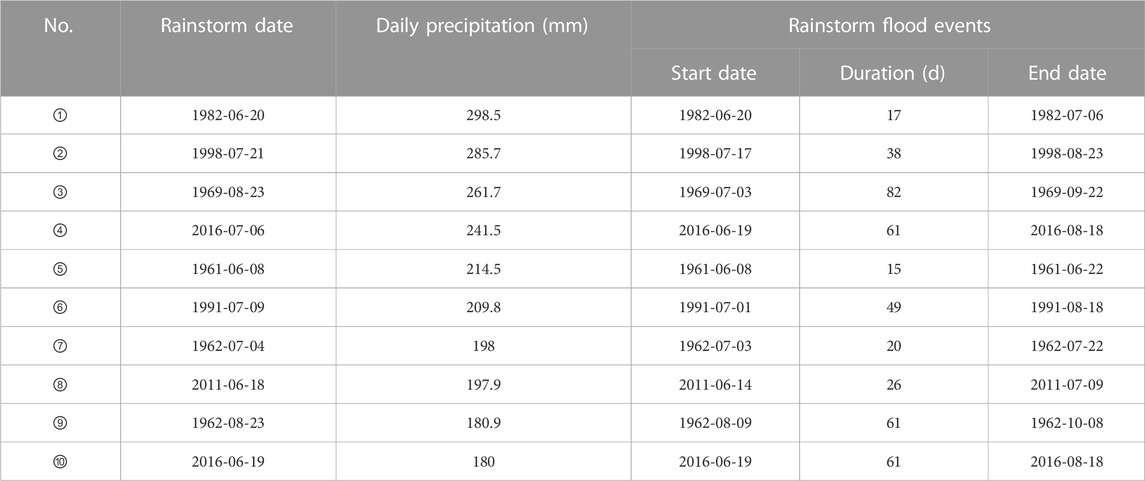
TABLE 2. Rainstorm flood events corresponding to the top ten daily precipitations at the Wuhan station.
In terms of rainstorm flood events corresponding to the top two daily precipitations in 1982 and 1998, their relationships between precipitation and SWAP are shown in Figure 6. The precipitation exceeded 298.5 mm on 20 June 1982 (Figure 6A) and its corresponding SWAP value increased sharply. The SWAP values continued to decrease subsequently due the low or zero precipitation. The precipitation was 285.7 mm and its SWAP value increased on 21 July 1998, as shown in Figure 6B. The SWAP value remained high due to the continuing precipitation during the period.
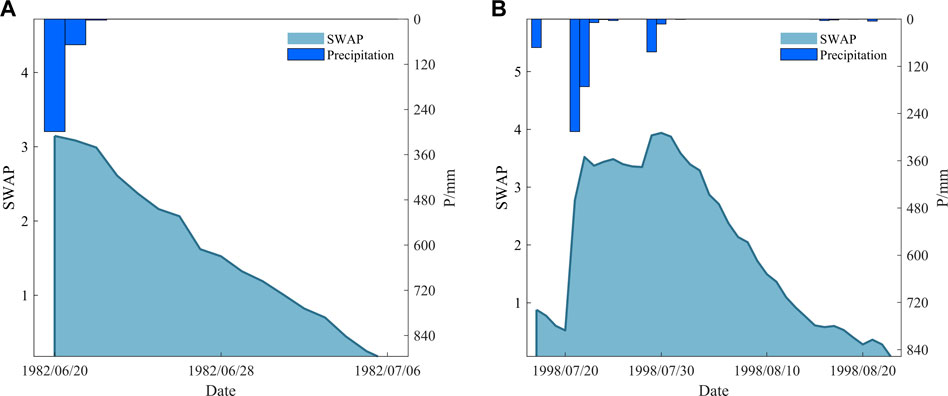
FIGURE 6. Relationships between SWAP and precipitation during rainstorm flood events: (A) 1982 and (B) 1998.
According to the results of drought and flood events, DTF events are identified by both the proposed procedure and the DWAAI. Ten DTF events with the largest DWAAI values were obtained, and the first eight events could find corresponding events identified using SWAP, while the other two could not (Table 3). The change points of the first eight pair events were close together with a maximum interval of 5 days (i.e., ③). One change point (i.e., ⑦) was the same, while four change points (i.e., ②, ④, ⑤ and ⑧) differed by 1 day and two change points (i.e., ① and ⑥) differed by 2 days. According to our proposed method, more details (e.g., the start and end times and intensity of the event) could be determined. For instance, the drought event of the DTF event in 2011 took place from January 4th to June 9th, while the flood event started on June 14th, with precipitation of 77.3 mm. The durations of drought events ranged from 21 to 157 days, while the durations of flood events ranged from 15 to 49 days, indicating that drought tends to last longer than flood.
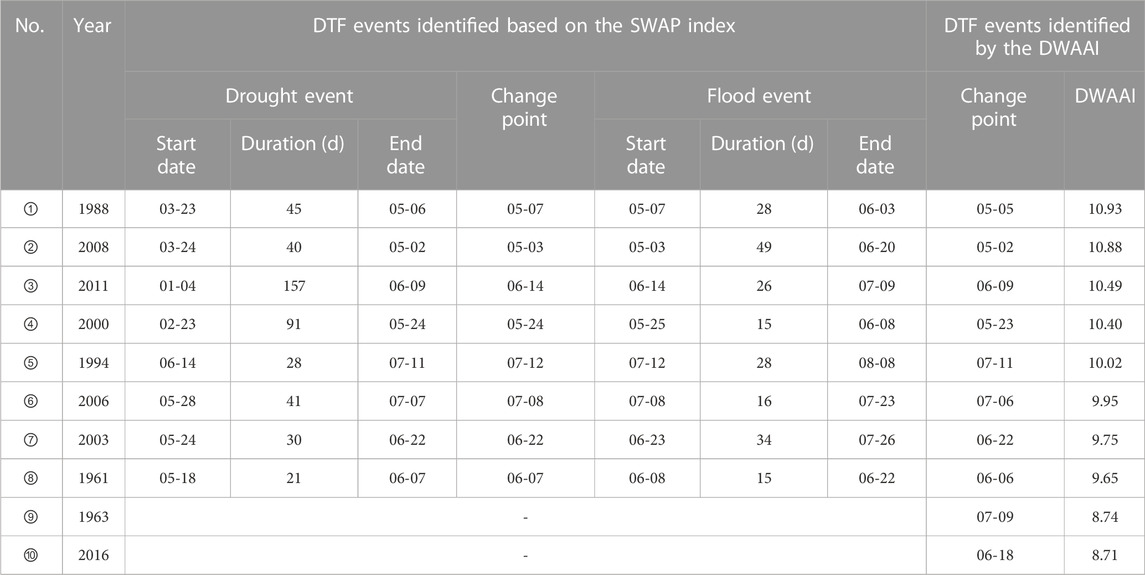
TABLE 3. Top ten DTF events identified by the DWAAI and their corresponding events identified based on the SWAP index at the Wuhan station.
As the last two events (i.e., ⑨ and ⑩) were identified as DTF events by the DWAAI rather than the SWAP index, they are taken as examples to illustrate the differences between the two methods. Figure 7 shows the relationships between SWAP and precipitation during these two DTF events. There was persistently below-normal precipitation, while SWAP value continued to decline and remained in the dry state in June 1963 (Figure 7A). Then, there were a few light rains in July that mitigated the drought condition. Additionally, several heavy precipitation processes in August led to the flood condition. This process was similar to the event in 2016 (Figure 7B). Overall, though the aforementioned two events in 1963 and 2016 both transited from drought to flood, their transition processes took more than a fortnight, contravening the feature of DFAA events that droughts and floods alternate rapidly (Shan et al., 2018b; Zhao et al., 2020). Furthermore, there were fixed periods of drought and flood when calculating the DWAAI. As the former drought period was set as 44 days and the latter flood period was set as 10 days (Shan et al., 2018a), the misidentification of a persistent drought (e.g., the event in 1963) or flood event as a DFAA event is likely. Alhough the DWAAI can reflect the ‘abrupt’ and ‘alternation’ of DFAA, the fixed periods of drought and flood not only make it impossible to accurately capture the detailed information (e.g., the start and end times) of a DFAA event but also cannot capture the occurrence of the concerned event.
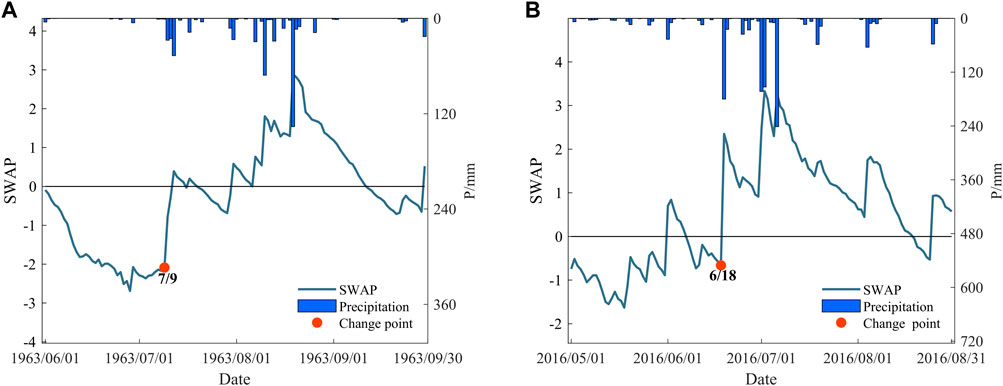
FIGURE 7. Relationships between SWAP and precipitation during the last two events: (A) 1963 and (B) 2016. Change points are identified by the DWAAI.
To illustrate the formation mechanism of DFAA events, a serious and widely studied DTF event in 2011 was analyzed in detail. The relationship between SWAP and precipitation, as shown in Figure 8, suggests that the change of daily SWAP was closely related to rainfall. As there was less rain than normal from January to the end of May, the SWAP values were consistently negative and could be taken as a drought event. This drought event was caused by La Niña, which maintains the eastward shift of the western North Pacific subtropical high, and the southwesterly moisture flux failed to reach the HRB (Li, 2013). However, four heavy rains occurred subsequently and their SWAP values increased rapidly; thus, the drought event abruptly alternated into a flood event.
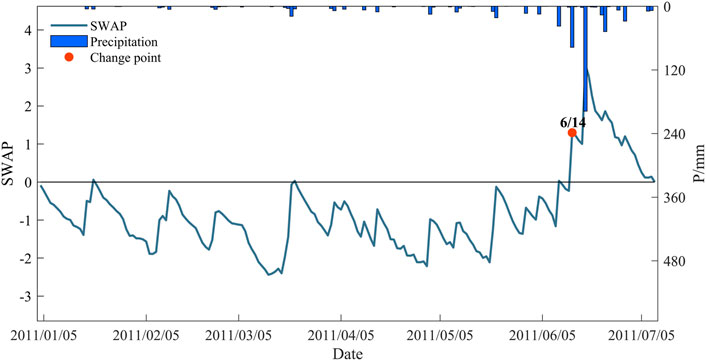
FIGURE 8. Relationship between SWAP and precipitation during the DTF event in 2011 at the Wuhan station.
As drought and flood are two extreme states of the water cycle, which is affected by climate change and human activities (Milly et al., 2002), the abrupt alternation between drought and flood is associated with large-scale atmospheric conditions, climate change, underlying surface conditions, and anthropogenic activities (Wu et al., 2006a; Zhang et al., 2021). The underlying reason for DFAA is a precipitation anomaly, which is closely linked with large-scale atmospheric conditions (Zhang et al., 2021). In terms of DTF, the former long-lived drought is the prerequisite of DTF events, and heavy rainstorms lead the occurrence of DTF events (Fan et al., 2019). When high convective available potential energy (CAPE) and high convective inhibition (CIN) arise during drought demise, intense rainstorms are likely to happen as the high CAPE suggests a high potential of moisture convection and the high CIN inhibits the weak-moderate convection (Zhang et al., 2021). In terms of FTD, the former rainstorm is the premise of FTD, while the latter long-lasting dry spell with little or zero rain results in FTD. The atmospheric condition of FTD is generally reversed to DTF (Wu et al., 2006a).
4.2 Frequency analysis of DFAA events
As the most concerning drought intensity DI and flood intensity FI in a DFAA event represents the degrees of drought and flood, respectively, DI and FI are taken as variables for the frequency analysis of DFAA events and determined through the theory of runs (Figure 2). After determining the marginal distributions of DI and FI, the best copula function was calculated to construct their bivariate joint distribution. The return periods and most-likely scenarios of DTF and FTD events were further explored.
4.2.1 Frequency analysis of DTF events
LN, GA, WB, GEV, and P-Ⅲ distributions were selected as candidates to construct the marginal distributions of DI1 and FI1. The best-fitted marginal distributions of three sub-basins were selected using the OLS test and K-S test at the 95% confidence level. Thus, the marginal distribution functions of DI1 and FI1 in the DTF events were constructed, and the parameters were also estimated (Supplementary Table S2).
Figure 9 shows the fitted distribution curves of DI1 and FI1 in three sub-basins. The gray bars are the frequency distributions of DI1 and FI1 of the identified DTF events. All the bar distributions are unimodal. The expectation values of DI1 were slightly higher than those of FI1 in the UB and MB but smaller than those of FI1 in the LB. In addition, the expectation values of DI1 decreased from the UB to the MB to the LB due to the increasing pattern of precipitation distribution from the UB to the MB to the LB.
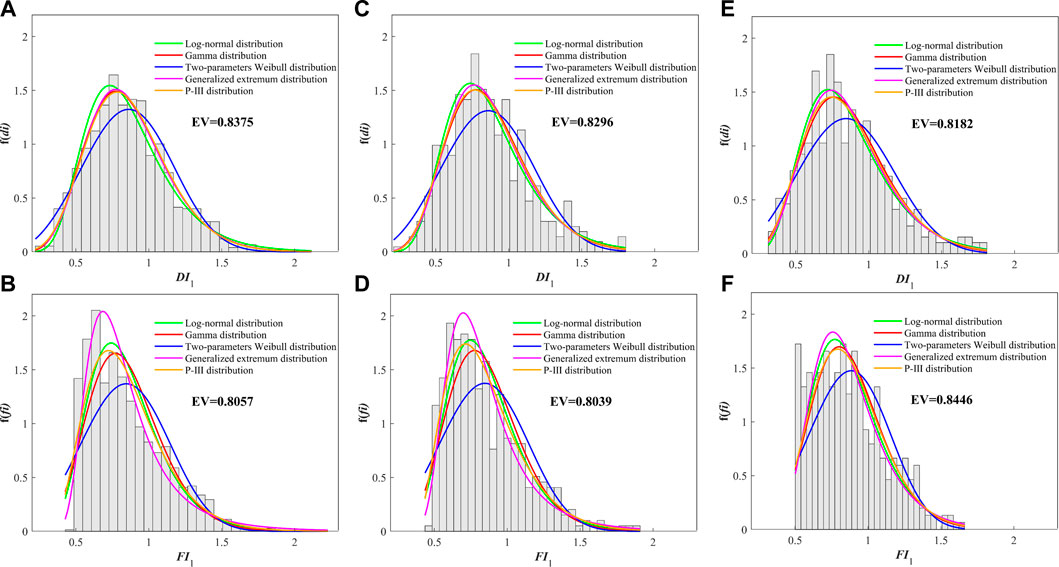
FIGURE 9. Frequency distributions of DI1 and FI1 for three sub-basins in the HRB. The various distribution curves are the fitted frequency distribution. EV is the expectation value of the best-fitted distribution function. (A) DI1 in UB; (B) FI1 in UB; (C) DI1 in MB; (D) FI1 in MB; (E) DI1 in LB; (F) FI1 in LB.
Three widely used copula functions were taken as candidates to construct the joint distributions. A GH copula was established as the best copula for the three sub-basins through the AIC, BIC, and K-S test. Additionally, the joint return periods (JRPs) and associated most-likely scenarios were determined and are shown in Figure 10. The red dotted line denotes DI1 = FI1, while the black dots represent the identified DTF events. If the black dots are plotted to the left of the 1:1 line then DI1 is greater than FI1, whereas if they are plotted to the right of the 1:1 line then DI1 is smaller than FI1. If there is a JRP, the combinations of DI1 and FI1 for the resulting JRP can form as a contour with seven different JRPs (i.e., 2, 5, 10, 20, 30, 50, and 100 years) (Figure 10). With the increase of DI1 or FI1, the JRPs under AND and OR cases are larger. If the joint distribution of DI1 and FI1 is maximized with a JRP, the most-likely scenario can be found as the MLC (fi*, di*) on the contour. fi* is larger than di* as JRP = 2, while fi* is smaller than di* under other JRPs in the UB under the AND case (Figure 10A). However, all fi* is larger than di* under an OR case in the UB (Figure 10B). The relationships between fi* and di* in the UB and MB are similar and are much different from results in the LB. Fi* is larger than di* under the AND case, while fi* is smaller than di* under the OR case in the LB.
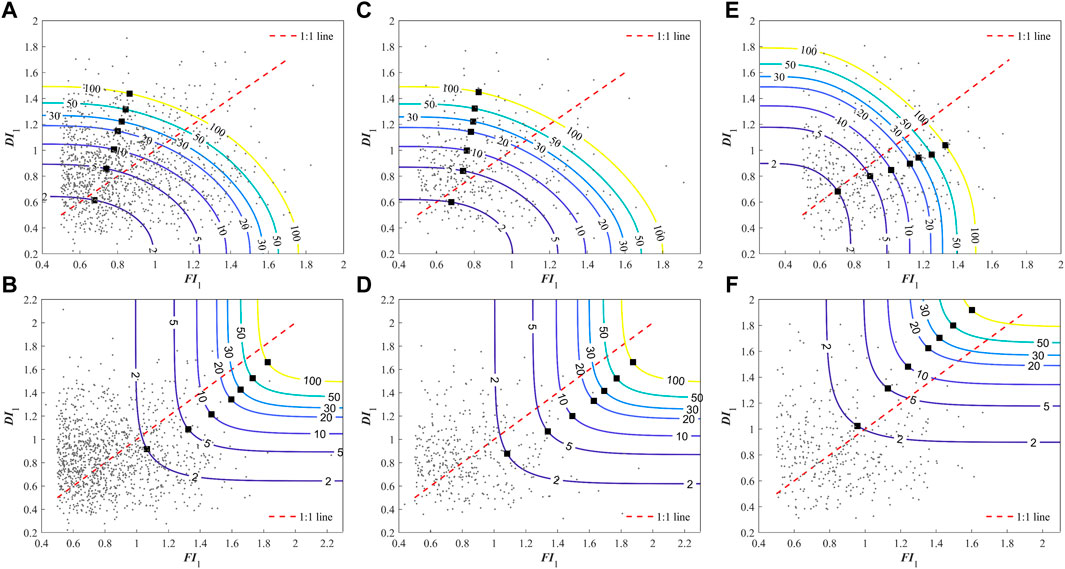
FIGURE 10. Isolines and MLCs of DI1 and FI1 for three sub-basins in the HRB. The squares denote MLC ((fi*,di*) while the small black dots are the identified DTF events: (A) The AND case in UB; (B) The OR case in UB; (C) The AND case in MB; (D) The OR case in MB; (E) The AND case in LB; (F) The OR case in LB.
The univariate and bivariate return periods for possible pairs in each sub-basin are listed in Supplementary Table S3. Most DI1 are greater than FI1 under the same univariate return period (URP), indicating that the drought events tend to be more severe than the flood events in DTF events. TOR and TAND under different URPs of DI1 and FI1 differ substantially. Specifically, TOR is smaller than the URP, while TAND is greater, which is in accordance with the definitions of TOR and TAND. The growth rates of TOR in the three sub-basins were basically equal, while the growth rate of TAND increased from the UB to the MB to the LB. That is, when there is a combination of both DI1 and FI1 with the same URPs, the occurrence probability of DTF events decreases from the UB to the MB to the LB as a whole.
It is worth finding the relationship between the JRPs for DI1 and FI1 and the URPs defined solely by the DI1 or FI1. In Figure 10A, B, the values of the horizontal part of the specific return period are the same and equal to DI1, while the values of the vertical part of the specific return period are equal to the return period solely defined by FI1. For example, a DTF event is defined by the DI1 solely with a 10-year return period and its value of DI1 is 1.23, while a DTF event is defined by the FI1 solely and its value of FI1 is 1.20. These two intensities are also the lower limit under an AND case and the upper limit under an OR case for a DTF event.
4.2.2 Frequency analysis of FTD events
The procedure for frequency analysis of FTD events is similar to that described in the previous section. The best-fitted marginal distributions of DI2 and FI2 in three sub-basins are constructed through OLS and a K-S test, and the parameters are also estimated (Supplementary Table S4).
Figure 11 shows the fitted distribution curves of DI2 and FI2 in three sub-basins. The gray bars are the frequency distributions of DI2 and FI2 of the identified FTD events. All the bar distributions are unimodal. The expectation values of FI2 were slightly smaller than that of DI2 in the UB and the MB, while the expectation values of DI2 and FI2 in the LB were basically equal. The expectation value of FI2 in the LB was the largest, while the expectation value of DI2 in the UB was the largest among these three sub-basins.
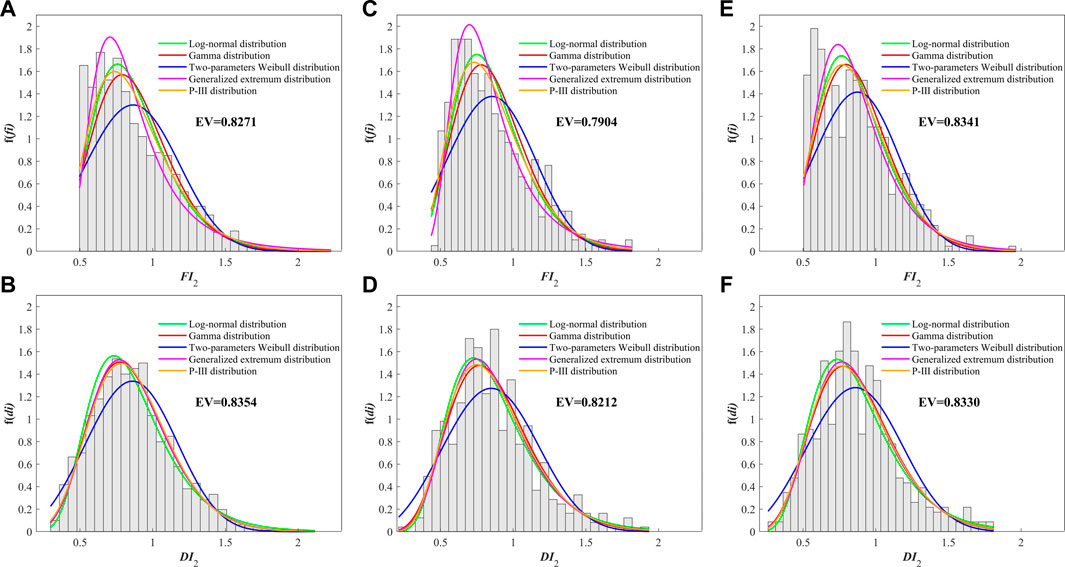
FIGURE 11. Frequency distributions of DI2 and FI2 for three sub-basins in the HRB. The various distribution curves are the fitted frequency distribution. EV is the expectation value of the best-fitted distribution function: (A) FI2 in UB; (B) DI2 in UB; (C) FI2 in MB; (D) DI2 in MB; (E) FI2 in LB; (F) DI2 in LB.
On the basis of the AIC, BIC, and K-S test, Frank, Clayton, and Frank copula were found to be the best copulas for the UB, MB, and LB, respectively. Additionally, JRPs (2, 5, 10, 20, 30, 50, and 100 years) and associated most-likely scenarios for each sub-basin were determined (Figure 12). fi* was larger than di* as JRP = 2, while fi* was smaller than di* under other JRPs in the UB under the AND case (Figure 12A). However, all fi* are larger than corresponding di* under the OR case (Figure 12B). The relationship between fi* and di* in the three sub-basins was similar. However, with the increase of JRPs, the difference between fi* and di* was larger in the UB and MB but smaller in the LB. It is also worth noting that the contour lines for various specific JRPs under the AND case are bounded by the horizontal and vertical axes, while the contour lines for various specific JRPs under the OR case have no bounds.
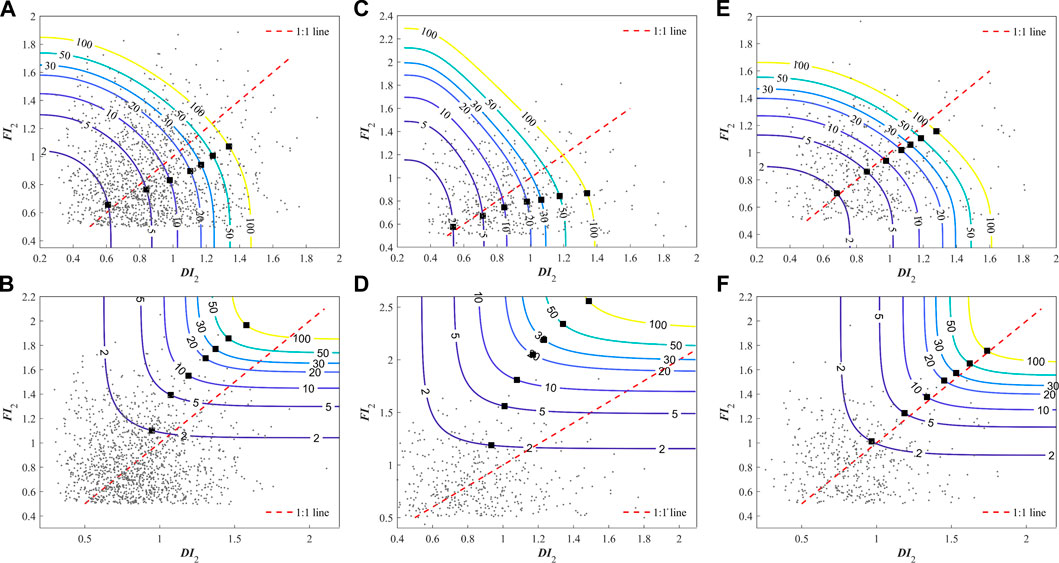
FIGURE 12. Isolines and MLCs of DI2 and FI2 for three sub-basins in the HRB. The squares denote MLC (di*,fi*) while the small black dots are the identified DTF events: (A) The AND case in UB; (B) The OR case in UB; (C) The AND case in MB; (D) The OR case in MB; (E) The AND case in LB; (F) The OR case in LB.
The univariate and bivariate return periods for possible pairs in each sub-basin are listed in Supplementary Table S5. FI2 was smaller than DI2 under small URPs (e.g., 2 years), while FI2 was larger than DI2 under larger URPs in the UB and MB. However, FI2 was smaller than DI2 in the LB under the same URPs. The growth rates of TOR in the three sub-basins were basically equal, while the growth rate of TAND increased from the UB to the MB to the LB. That is, when there is a combination of DI2 and FI2 with the same URPs, the occurrence probability of FTD events decreases from the UB to the MB to the LB.
4.2.3 Discussion on frequency analysis
High-frequency drought–flood disasters are likely to cause considerable damage and even affect the sustainable development of society and the economy (Huang et al., 2014). When DFAA occurs, the focus of disaster prevention shifts from drought mitigation toward flood drainage. Thus, the temporal and spatial characteristics of DFAA need further investigation to guide water-related disaster prevention. Temporally, DFAA usually occurs in the main-flood season and coincides with the growth period of crops (Fan et al., 2019). Spatially, drought is prone to occur in high-terrain areas, while flood generally occurs in low-lying areas (Zhou et al., 2020). Therefore, the relevant department should take some effective measures in advance to prevent and mitigate water-related disasters (Huang et al., 2014).
The direct cause of different JRPs at the three sub-basins is the spatio-temporal distribution of precipitation, while the underlying causes are their different climate conditions, geomorphic types and terrains, and the intensity of human activities (Huang et al., 2014; Qiao et al., 2022). As the HRB is located in the north subtropical monsoon zone, its local climate (e.g., precipitation) is easily affected by the changing global climate. Topographically, the HRB is high in the northwest and low in the southeast. The west of the HRB is the mid-low mountainous area, while the east is dominated by plains and hills (Chen et al., 2007). Furthermore, anthropological activities, such as urban sprawl, industrial development, and increasing population, are related to the change of climate (e.g., precipitation and temperature) (Qiao et al., 2022). For example, Chen and Sun (2021) found that human activities have increased the chance of drought–flood extremes in China. Overall, the underlying causes of the frequency of DFAA events in the HRB need further investigation.
Amplified fluctuations between droughts and floods will undoubtedly bring greater challenges to the rational allocation of water resources, which is a challenge for the adaptation of water infrastructure (Zhang et al., 2021). For example, reservoirs redistribute water resources spatio-temporally and are an effective way to prevent flood and alleviate water shortages. However, there is a contradiction between flood control and benefit promotion in reservoir operation for comprehensive utilization. Specifically, storage capacity for flood control is required to be set aside before flood season, while storage capacity for benefit promotion is hard to fill up during flood season for water supply in non-flood seasons. Abrupt alternation between droughts and floods will exacerbate this dilemma. For instance, inadequate water storage before flood season will contribute to lower regulation capacity and a higher risk of droughts later. Thus, the regulation capacity of reservoirs should be appropriately designed to deal with DFAA events.
5 Conclusion
Droughts and floods are often studied separately. However, the abrupt alternation between droughts and floods is a greater hazard than a single disaster. This study establishes a method to identify DFAA events (i.e., DTF and FTD events) based on a daily-scale SWAP index and analyzes the dependence structure of flood intensity and drought intensity of DFAA events based on bivariate copula functions. The main conclusions are summarized as follows:
1) Temporal and spatial distributions of DFAA events between 1961 and2020 in the HRB were analyzed. The results showed that DFAA events have emerged less frequently with larger intensities and durations. The decadal average numbers of DTF and FTD events varied with similar trends, while the numbers of DTF events were less than those of FTD events, indicating that FTD events are the most prevalent DFAA events in the HRB. DTF events occurred more frequently and rapidly in the lower UB and MB, while FTD events occurred more frequently and rapidly in the lower UB and LB.
2) To discuss the rationality and superiority of the identification method in a DFAA event, the identification processes of DFAA events at the Wuhan station were analyzed in detail. The results showed that the proposed method based on the daily-scale SWAP index is effective for identifying DFAA events and providing detailed information (e.g., the start and end times of drought and flood events).
3) The interrelations of drought intensity and flood intensity of DTF and FTD events were analyzed based on copula theory. For DI and FI under the same URPs, the occurrence probabilities of DFAA events were basically equal in the three sub-basins under the OR case but decreased from the UB to the MB to the LB under the AND case. Moreover, appropriate regulations of reservoirs are required to alleviate the difficulties caused by fluctuations of droughts and floods.
After clarifying the spatio-temporal distribution and frequency characteristics of DFAA events, optimization of the layout of the social economy and scientific management of water conservancy projects is helpful for preventing and mitigating DFAA disasters and water resource management.
Data availability statement
The original contributions presented in the study are included in the article/Supplementary Material; further inquiries can be directed to the corresponding author.
Author contributions
WZ: investigation, methodology, data curation, software, formal analysis, and writing—original draft preparation. DL: supervision, conceptualization, writing—review and editing, project administration, and funding acquisition. JZ and JW: supervision and review. SJ, YC, and NC: supervision. SX: investigation and review.
Funding
Funding for this work was provided by the National Key Research and Development Project of China (2022YFC3202803) and the National Natural Science Foundation of China (51879194, 91647106 and 51579183).
Conflict of interest
The authors declare that the research was conducted in the absence of any commercial or financial relationships that could be construed as a potential conflict of interest.
Publisher’s note
All claims expressed in this article are solely those of the authors and do not necessarily represent those of their affiliated organizations, or those of the publisher, the editors, and the reviewers. Any product that may be evaluated in this article, or claim that may be made by its manufacturer, is not guaranteed or endorsed by the publisher.
Supplementary material
The Supplementary Material for this article can be found online at: https://www.frontiersin.org/articles/10.3389/fenvs.2023.1142259/full#supplementary-material
References
Annamalai, H., and Slingo, J. (2001). Active/break cycles: Diagnosis of the intraseasonal variability of the asian summer monsoon. Clim. Dyn. 18 (1-2), 85–102. doi:10.1007/s003820100161
Benjamin, J. R., and Cornell, C. A. (1970). Probability,statistics,and decision for civil engineers. New York: McGraw-Hill.
Bian, G., Zhang, J., Chen, J., Song, M., He, R., Liu, C., et al. (2021). Projecting hydrological responses to climate change using CMIP6 climate scenarios for the upper huai River Basin, China. Front. Environ. Sci. 9. doi:10.3389/fenvs.2021.759547
Bozdogan, H. (1987). Model selection and Akaike's Information Criterion (AIC): The general theory and its analytical extensions. Psychometrika 52 (3), 345–370. doi:10.1007/bf02294361
Bruce, J. P. (1994). Natural disaster reduction and global change. Bull. Am. Meteorological Soc. 7510 (10), 1831–1835. doi:10.1175/1520-0477(1994)075<1831:ndragc>2.0.co;2
Chen, H., Guo, S., Xu, C-Y., and Singh, V. P. (2007). Historical temporal trends of hydro-climatic variables and runoff response to climate variability and their relevance in water resource management in the Hanjiang basin. J. Hydrology 344 (3-4), 171–184. doi:10.1016/j.jhydrol.2007.06.034
Chen, H., and Sun, J. (2021). Anthropogenic influence has increased climate extreme occurrence over China. Sci. Bull. 66 (8), 749–752. doi:10.1016/j.scib.2020.12.001
Chen, H., Wang, S., and Wang, Y. (2020a). Exploring abrupt alternations between wet and dry conditions on the basis of historical observations and convection-permitting climate model simulations. J. Geophys. Res. Atmos. 125 (9). doi:10.1029/2019jd031982
Chen, H., Wang, S., Zhu, J., and Zhang, B. (2020b). Projected changes in abrupt shifts between dry and wet extremes over China through an ensemble of regional climate model simulations. J. Geophys. Res. Atmos. 125 (23). doi:10.1029/2020jd033894
Cheng, Z., Xu, M., Luo, L., and Ding, X. (2012). Climate characteristics of drought-flood abrupt change events in huaihe River Basin. Hydrology 32 (1), 73–79.
Chiang, F., Mazdiyasni, O., and Aghakouchak, A. (2021). Evidence of anthropogenic impacts on global drought frequency, duration, and intensity. Nat. Commun. 12 (1), 2754. doi:10.1038/s41467-021-22314-w
Clark, J. M., Heinemeyer, A., Martin, P., and Bottrell, S. H. (2012). Processes controlling DOC in pore water during simulated drought cycles in six different UK peats. Biogeochemistry 109 (1/3), 253–270. doi:10.1007/s10533-011-9624-9
Dai, A., Trenberth, K. E., and Karl, T. R. (1998). Global variations in droughts and wet spells: 1900-1995. Geophys. Res. Lett. 25 (17), 3367–3370. doi:10.1029/98gl52511
De Silva, M. M. G. T., and Kawasaki, A. (2018). Socioeconomic vulnerability to disaster risk: A case study of flood and drought impact in a rural Sri Lankan community. Ecol. Econ. 152, 131–140. doi:10.1016/j.ecolecon.2018.05.010
Fan, H., Zhang, Z. Z., Wu, F., Xu, J. X., Shen, D. F., and Yuan, Y. J. (2019). Spatial and temporal evolution characteristics of drought-flood abrupt alternation in guizhou Province in recent 50 Years based on dwaai index. Appl. Ecol. Environ. Res. 17 (5), 12227–12244. doi:10.15666/aeer/1705_1222712244
Fang, W., Huang, S., Huang, G., Huang, Q., Wang, H., Wang, L., et al. (2019). Copulas-based risk analysis for inter-seasonal combinations of wet and dry conditions under a changing climate. Int. J. Climatol. 39 (4), 2005–2021. doi:10.1002/joc.5929
Frees, E. W., and Valdez, E. A. (1998). Understanding relationships using copulas. North Am. Actuar. J. 2 (1), 1–25. doi:10.1080/10920277.1998.10595667
Giorgi, F., Im, E. S., Coppola, E., Diffenbaugh, N. S., Gao, X. J., Mariotti, L., et al. (2011). Higher hydroclimatic intensity with global warming. J. Clim. 24 (20), 5309–5324. doi:10.1175/2011jcli3979.1
Handwerger, A. L., Huang, M-H., Fielding, E. J., Booth, A. M., and Bürgmann, R. (2019). A shift from drought to extreme rainfall drives a stable landslide to catastrophic failure. Sci. Rep. 9 (1-12), 1569. doi:10.1038/s41598-018-38300-0
He, X., and Sheffield, J. (2020). Lagged compound occurrence of droughts and pluvials globally over the past seven decades. Geophys. Res. Lett. 47 (14). doi:10.1029/2020gl087924
Herbst, P. H., Bredenkamp, D. B., and Barker, H. (1966). A technique for the evaluation of drought from rainfall data. J. Hydrology 4, 264–272. doi:10.1016/0022-1694(66)90084-9
Huang, S., Hou, B., Chang, J., Huang, Q., and Chen, Y. (2014). Copulas-based probabilistic characterization of the combination of dry and wet conditions in the Guanzhong Plain, China. J. Hydrology 519, 3204–3213. doi:10.1016/j.jhydrol.2014.10.039
Jiang, H., Yang, B., and Wu, S. (2007). Complete book of meterological disasters in China: Hubei Volume. Beijing: China Meterological Press.
Li, M. (2013). The causes of abruptly drought-flooding turn in the mid-lower reaches of Yangtze River during spring to summer in 2011. Beijing: Chinese Academy of Meterological Sciences.
Lu, E., Cai, W., Jiang, Z., Zhang, Q., Zhang, C., Higgins, R. W., et al. (2014). The day-to-day monitoring of the 2011 severe drought in China. Clim. Dyn. 43 (1-2), 1–9. doi:10.1007/s00382-013-1987-2
Lu, E. (2009). Determining the start, duration, and strength of flood and drought with daily precipitation: Rationale. Geophys. Res. Lett. 36, L12707. doi:10.1029/2009gl038817
Madakumbura, G. D., Kim, H., Utsumi, N., Shiogama, H., Fischer, E. M., Seland, O., et al. (2019). Event-to-event intensification of the hydrologic cycle from 1.5 °C to a 2 °C warmer world. Sci. Rep. 9 (1), 3483. doi:10.1038/s41598-019-39936-2
Maheras, P., Xoplaki, E., and Kutiel, H. (1999). Wet and dry monthly anomalies across the mediterranean Basin and their relationship with circulation, 1860–1990. Theor. Appl. Climatol. 64 (3-4), 189–199. doi:10.1007/s007040050122
Mckee, T. B., Doesken, N. J., and Kleist, J. (1993). The relationship of drought frequency and duration to time scales. Eighth Coference Appl. Climatol., 17–22.
Mcquigg, J. (1954). A simple index of drought conditions. Weatherwise 7 (3), 64–67. doi:10.1080/00431672.1954.9930323
Milly, P., Wetherald, R., Dunne, K., and Delworth, T. (2002). Increasing risk of great floods in a changing climate. Nature 415, 514–517. doi:10.1038/415514a
Ministry of Water Resources of the People's Republic of China (2019). Bulletin of flood and drought disaster prevention in China 2019. Beijing: China Water&Power Press.
Mishra, A. K., and Singh, V. P. (2010). A review of drought concepts. J. Hydrology 391 (1-2), 202–216. doi:10.1016/j.jhydrol.2010.07.012
Naumann, G., Cammalleri, C., Mentaschi, L., and Feyen, L. (2021). Increased economic drought impacts in Europe with anthropogenic warming. Nat. Clim. Change 11 (6), 485–491. doi:10.1038/s41558-021-01044-3
Office of State Flood Control and Drought Relief Headquaters (2012). Bulletin of flood and drought disaster in China 2011. Beijing: China Water and Power Press.
Qiao, Y., Xu, W., Meng, C., Liao, X., and Qin, L. (2022). Increasingly dry/wet abrupt alternation events in a warmer world: Observed evidence from China during 1980–2019. Int. J. Climatol. 42 (12), 6429–6440. doi:10.1002/joc.7598
Salvadori, G. (2004). Bivariate return periods via 2-Copulas. Stat. Methodol. 1 (1-2), 129–144. doi:10.1016/j.stamet.2004.07.002
Salvadori, G., De Michele, C., and Durante, F. (2011). On the return period and design in a multivariate framework. Hydrology Earth Syst. Sci. 15 (11), 3293–3305. doi:10.5194/hess-15-3293-2011
Schwarz, G. (1978). Estimating the dimension of a model. Ann. Statistics 6 (2), 461–464. doi:10.1214/aos/1176344136
Shan, L., Zhang, L., Chen, X., and Yang, W. (2015). Spatio-temporal evolution characteristics od droughtflood abrupt alternation in the middle and lower reaches of the Yangtze River basin. Resour. Environ. Yangtze Basin 24 (12), 2100–2107.
Shan, L., Zhang, L., Song, J., Zhang, Y., She, D., and Xia, J. (2018a). Characteristics of dry-wet abrupt alternation events in the middle and lower reaches of the Yangtze River Basin and the relationship with ENSO. Acta Geogr. Sin. 28 (8), 1039–1058. doi:10.1007/s11442-018-1540-7
Shan, L., Zhang, L., Xiong, Z., Chen, X., Chen, S., and Yang, W. (2018b). Spatio-temporal evolution characteristics and prediction of dry–wet abrupt alternation during the summer monsoon in the middle and lower reaches of the Yangtze River Basin. Meteorology Atmos. Phys. 130 (4), 427–440. doi:10.1007/s00703-017-0528-7
Shi, W., Huang, S., Liu, D., Huang, Q., Han, Z., Leng, G., et al. (2021). Drought-flood abrupt alternation dynamics and their potential driving forces in a changing environment. J. Hydrology 597, 126179. doi:10.1016/j.jhydrol.2021.126179
Shiau, J-T. (2006). Fitting drought duration and severity with two-dimensional copulas. Water Resour. Manag. 20 (5), 795–815. doi:10.1007/s11269-005-9008-9
Shiau, J-T. (2003). Return period of bivariate distributed extreme hydrological events. Stoch. Environ. Res. Risk Assess. (SERRA) 17 (1-2), 42–57. doi:10.1007/s00477-003-0125-9
Shiau, J-T., and Shen, H. W. (2001). Recurrence analysis of hydrologic droughts of differing severity. J. Water Resour. Plan. Manag. 127 (1), 30–40. doi:10.1061/(asce)0733-9496(2001)127:1(30)
Shiau, J-T., Wang, H-Y., and Tsai, C-T. (2006). Bivariate frequency analysis of floods using copulas. J. Am. Water Resour. Assoc. 42 (6), 1549–1564. doi:10.1111/j.1752-1688.2006.tb06020.x
Sun, Q., Miao, C., Aghakouchak, A., and Duan, Q. (2016). Century-scale causal relationships between global dry/wet conditions and the state of the Pacific and Atlantic Oceans. Geophys. Res. Lett. 43 (12), 6528–6537. doi:10.1002/2016gl069628
Wilhite, D. A., and Glantz, M. H. (1985). Understanding the drought phenomenon: The role of definitions. Water Inst. 10 (3), 111–120. doi:10.1080/02508068508686328
Wu, S., Zhang, X., and She, D. (2017). Joint pattern of seasonal hydrological droughts and floods alternation in China’s Huai River Basin using the multivariate L-moments. J. Earth Syst. Sci. 126 (4), 48. doi:10.1007/s12040-017-0824-0
Wu, Z., Li, J., He, J., and Jiang, Z. (2006a). Large-scale atmospheric singularities and summer long-cycle droughts-floods abrupt alternation in the middle and lower reaches of the Yangtze River. Chin. Sci. Bull. 51 (16), 2027–2034. doi:10.1007/s11434-006-2060-x
Wu, Z., Li, J., He, J., and Jiang, Z. (2006b). Occurrence of droughts and floods during the normal summer monsoons in the mid- and lower reaches of the Yangtze River. Geophys. Res. Lett. 33 (5), L05813. doi:10.1029/2005gl024487
Xiang, H. (2002). Characteristics of weather and climate and major meteorological disasters in Hubei Province 2001. Rainstorm Disasters 21 (1), 42–44.
Xiong, W. (2017). Analysis on characteristics of drought and flood alternating events in sihu lake basin based on palmer drought model. Master. Wuhan: Wuhan University.
Xiong, W., Hu, T-S., Zhang, B. T., and Cheng, X. F. (2017). Research on the characteristics of drought and flood alternating events in sihu watershed. China Rural. Water Hydropower (05), 155–160.
Yang, J., Chen, H., Hou, Y., Zhao, Y., Chen, Q., Xu, C., et al. (2019). A method to identify the drought-flood transition based on the meteorological drought index. Acta Geogr. Sin. 74 (11), 2358–2370.
Yin, J., Gentine, P., Zhou, S., Sullivan, S. C., Wang, R., Zhang, Y., et al. (2018a). Large increase in global storm runoff extremes driven by climate and anthropogenic changes. Nat. Commun. 9 (1), 4389. doi:10.1038/s41467-018-06765-2
Yin, J., Guo, S., Liu, Z., Yang, G., Zhong, Y., and Liu, D. (2018b). Uncertainty analysis of bivariate design flood estimation and its impacts on reservoir routing. Water Resour. Manag. 32 (5), 1795–1809. doi:10.1007/s11269-018-1904-x
Zhang, B., Wang, S., and Zscheischler, J. (2021). Higher probability of abrupt shift from drought to heavy rainfall in a warmer world.
Zhao, Y., Chen, H., Yang, J., and Xu, C. (2019). Study of temporal-spatial evolution of the drought-flood abrupt alternation events based on SWAP index in hanjiang River Basin. Water Resour. Res. 08 (1), 13–23. doi:10.12677/jwrr.2019.81002
Zhao, Y., Weng, Z., Chen, H., and Yang, J. (2020). Analysis of the evolution of drought, flood, and drought-flood abrupt alternation events under climate change using the daily SWAP index. Water 12 (7), 1969. doi:10.3390/w12071969
Zhou, W., Chen, F., Meng, Y., Chandrasekaran, U., Luo, X., Yang, W., et al. (2020). Plant waterlogging/flooding stress responses: From seed germination to maturation. Plant Physiol. Biochem. 148, 228–236. doi:10.1016/j.plaphy.2020.01.020
Keywords: drought–flood abrupt alternation, SWAP, identification, frequency analysis, copula theory, Han River Basin
Citation: Zhou W, Liu D, Zhang J, Jiang S, Xing S, Wang J, Cheng Y and Chen N (2023) Identification and frequency analysis of drought–flood abrupt alternation events using a daily-scale standardized weighted average of the precipitation index. Front. Environ. Sci. 11:1142259. doi: 10.3389/fenvs.2023.1142259
Received: 11 January 2023; Accepted: 07 February 2023;
Published: 01 March 2023.
Edited by:
Jiefeng Wu, Nanjing University of Information Science and Technology, ChinaReviewed by:
Lu Gao, Fujian Normal University, ChinaBaisha Weng, China Institute of Water Resources and Hydropower Research, China
Zhaoli Wang, South China University of Technology, China
Copyright © 2023 Zhou, Liu, Zhang, Jiang, Xing, Wang, Cheng and Chen. This is an open-access article distributed under the terms of the Creative Commons Attribution License (CC BY). The use, distribution or reproduction in other forums is permitted, provided the original author(s) and the copyright owner(s) are credited and that the original publication in this journal is cited, in accordance with accepted academic practice. No use, distribution or reproduction is permitted which does not comply with these terms.
*Correspondence: Dedi Liu, ZGVkaWxpdUB3aHUuZWR1LmNu