 Radu Ioan Mogoș1*
 Irina Petrescu2Radu Alexandru Chiotan3*Romeo Cătălin Crețu4Victor Adrian Troacă2Paula Liliana Mogoș1
- 1Department of Economic Informatics and Cybernetics, The Faculty of Economic Cybernetics, Statistics and Informatics, The Bucharest University of Economic Studies, Bucharest, Romania
- 2Department of Agro-Food Economy and Environment, The Faculty of Agrifood and Environmental Economics, The Bucharest University of Economic Studies, Bucharest, Romania
- 3University of Medicine and Pharmacy “Carol Davila”, Bucharest, Romania
- 4University of Agronomic Sciences and Veterinary Medicine of Buchares, Bucharest, Romania
Greenhouse gas emissions (GE) represent an element that influences the lives of all people on the planet. This action must be controlled and prevented because the negative effects are starting to appear more and more in everyday life, sometimes with devastating consequences from a climate point of view and not only for the inhabitants of certain regions. At the European level, one of the main measures taken was the implementation of the Green Deal as a response to the fight against GE. The purpose of this article is to offer a description of the main elements that are influencing the GE, as well as the role of the Green Deal. It also aims to identify the characteristics of the EU countries from the GE point of view before and after the Green Deal was proposed. In this regard two more cluster analyses are also carried out regarding GE at the European level. One analysis concerns the identification and evolution of the main groups of countries from this point of view for years 2018 and 2020. The second analysis concerns the main fields in the industry for year 2020. The used methodology was DM-CRISP. In the final part of the article the obtained results are analyzed, a discussion is added based on them and also a conclusion section.
1 Introduction
One of the most important elements that influence the environment and affect life on the entire planet is represented by greenhouse gas emissions (GE). These represent the cumulative effect of all the gases emitted into the atmosphere and which have the property of absorbing infrared radiation emitted from the surface of Earth and reradiating it back to the Earth’s surface (Mann, 2022). According to the same source, the most representative gases that contribute to the creation of GE are carbon dioxide (CO2), water vapors, and methane (CH4). Among the greenhouse gas emissions, the carbon dioxide is the most significant element regarding the impact that it has over the environment. It is emitted into the atmosphere both due to natural causes (egg. Volcanic eruptions, decomposition of organic matter, respiration of living organisms, etc.) but also due to human activity (burn the fossil fuels, food processing, raise animals, transport, setting a comfortable temperature in buildings, obtaining electricity, burn the forests to create agricultural land and for homes, etc.). According to the same source, the carbon dioxide accumulated in the atmosphere with an average rate of 1.4 part per million (ppm) by volume between 1959 and 2006 and with 2.0 ppm between 2006 and 2018.
Methane is the second most important gas that is emitted, being stronger than the carbon dioxide. The main human activities that emit methane are oil production and transportation, natural gas and coal, agriculture activities, as well as the decomposition of organic matter. Several papers have analyzed this gas and its cycle in nature in order to reduce Methane emissions in the atmosphere (Etminan et al., 2016; Rosentreter et al., 2021; Cadieux et al., 2022).
Some other greenhouse gases that also absorb infrared radiation are nitrous oxides (N2O) and fluorinated gases (F-gases). In papers like Nisbet et al. (2022) and Zenone et al. (2021) is analyzed the behavior of these gases. Throughout the earth’s existence, GHs concentrations have varied greatly, leading to significant climate variations over long periods of time. Based on studies conducted over the time like Nyserda-1 (2021), Nyserda-2 (2021), Nyserda-3 (2019) and IPCC (2014), which were based on data sets that covered long periods of time, it was found that the level of GE concentrations becomes higher in warm periods, having at the same time a tendency to decrease in periods when the temperature is lower.
In the European Union for the year 2019, the distribution of greenhouse gas emissions was (EU-P1, 2021): 80% carbon dioxide, 11% methane, 6% nitrous oxide (N2O) and 2% hydro-fluorocarbons (HFCs) and around 1% was represented by fluorocarbons (PFCs), mix of PFCs and HFCs, sulphur hexafluoride (SF6) and nitrogen tri-fluoride (NF3). The greenhouse gas emissions in the EU for year 2019 based on economic sectors was as follows (EU-P1, 2021): 77.01% energy, 9.1% industrial processes and product use, 10.55% agriculture, 3.32% waste management. Based on these data, it can be seen that the energy sector is by far the most important source in relation to the others.
Negative effects of the greenhouse gas emissions continue to appear and to influence the lives of people from all over the world. One of the main effects is the climate that is changing inducing not only a rise of the average temperatures (global warming) but also creating extreme weather events, rising seas, shifting wildlife habitats and populations, affecting forests and coastal areas, etc. (Mogos et al., 2021; Nunez, 2022). Countries from all over the world acknowledged these facts and tried to accomplish an agreement through the Paris Climate Agreement in 2015. Because of these negative effects that must be reduced, the economies must change, especially for the biggest emitters like China, United States of America, India, and Russia.
In order to combat the negative effects of the greenhouse gas emissions, governments of many countries from all over the world have tried to take several measures through their strategies, policies and by implementing specific programs. For example, in the European Union, among other actions, one big step was the initiative called Green Deal (EU-P2, 2022). In the next section it is analyzed the Green Deal and its role in the European Union fight against the greenhouse gas emissions.
In the United States of America, for example, Environmental Protection Agency had several initiatives regarding strategies and programs regarding the energy efficiency, supply chain, increasing fuel efficiency in logistics and transportation, reducing methane emissions, waste reduction, identifying renewable energy sources and additional resources (EPA-USA, 2022). Papers like Kayakus (2022), Acheampong and Boateng (2019), Kadam and Vijayumar (2018) and Liang et al. (2021) propose the use of artificial intelligence in order to improve certain processes and methods for decreasing the greenhouse gas emissions.
The objectives of the paper are to describe the Green Deal Strategy and to find the answers to four research questions, namely: 1) which are the main groups (clusters) of countries in the European Union for the years 2018 and 2020 in terms of total greenhouse gas emissions, Carbon dioxide, Methane, Fluorinated gases (F-gases), Nitrous oxides? 2) which is the dynamics of the groups (clusters) identified in the previous question (point a) for the years 2018 and 2020? In this regard, the analysis identifies the countries that were in a certain group before the initiation of Green Deal strategy and managed to move to another group with different characteristics after 1 year in which there were applied measures proposed by the Green Deal; 3) which are the characteristics of the profiles for the identified groups for the year 2020 from the point of view of the types of gas emissions ? 4) which are the most similar sectors of the economy in terms of carbon emissions (CO2) in 2020 and what are the correlations between them?
The innovative aspect of the paper is the use of the data mining algorithms in identifying groups of EU countries with similar behavior regarding the GE before and after applying the Green Deal recommendations. Also an analysis for the economy sectors based on GE was carried out using also data mining technics.
2 Green Deal and the European Union
The climate is changing especially due to the greenhouse gas emissions and their negative effects that they have on the environment. GEs are affecting both the population and the environment in Europe and in the whole world. Considering this aspect and trying to face the challenges that appear more and more often, the European Commission has proposed the Green Deal strategy in December 2019.
This strategy has the general purpose of improving the wellbeing of people by achieving a climate-neutral and by protecting the natural habitat. Within this strategy, the main objectives consist of: protecting and improving the lives of people and animals by reducing the degree of pollution, obtaining a climate-neutral until the year 2050, offering support to companies to become leaders in obtaining clean products and technology, and also to ensure a transition as fair as possible in which all aspects and all actors involved are taken into account (EC1, 2019). The same document also mentions the following statistical data regarding the perception of Europeans regarding climate change: 93% of them see climate change as a serious problem that must be combated as quickly and efficiently as possible, 93% have taken at least one action to combat climate change and 79% believe that by combating climate change the degree of innovation in many fields will improve.
Considering the proposed objectives, the actions undertaken must take place in almost all areas of the economy within each country in the European Union. Within the strategy, the following actions are recommended (EC1-European Commission, 2019).
• Decarbonize the energy sector because the production and use of energy produce more than 75% of the EU’s greenhouse gas emissions. Papers such as Chioran and Valean (2021) and Ma et al. (2018) propose solutions for this action.
• Construction of energy-wise intelligent buildings as well as the renovation of existing buildings. This measure is indicated to reduce heat losses and, implicitly, to reduce energy bills and the amount of energy used. It is known that 40% of the energy consumed is used for buildings. Papers like Ligardo-Herrera et al. (2022) and Bilardo et al. (2021) propose solutions for this action.
• Offering support to the industry so that an increasing number of companies become leaders in the green economy. According to the statistics, European Industry uses only 12% of recyclable materials.
• Mobility and the need for transport to be satisfied as much as possible using cheaper, cleaner and healthier ways both from the point of view of private transport and public transport. In terms of emissions, transport activities represent 25%. Papers like Bao et al. (2022) and Cui et al. (2020) support this action.
Other important actions that are taken into account to offer European citizens an improved wellbeing are (EC2-European Commission, 2019; Ponce, 2022; McDougall, 2021; Borbujo et al., 2021): cleaning the air, water and soil; packaging reusing and recycling; reducing food waste; creating premises for the use of green energy; renovation and rehabilitation of buildings of major interest and not only such as residential buildings, schools, hospitals, state institutions, etc.,; increasing the number of eco-friendly products sold in traditional and online stores; creating the premises for maintaining and improving the health of citizens as well as for the following generations; improving public transport and creating alternatives that use electricity; building an infrastructure for easier charging of electric means of transport; healthier food, obtained by using a smaller amount of pesticides and fertilisers.
In EC3-European Commission (2020) there are facts that are showing that some measures taken in the past during the last couple of years are producing positive effects. For example, between 1990 and 2018, greenhouse gas emissions have decreased by 23%. Meanwhile, the EU economy (EU GDP) has increased by 61%. In this regard, an example of action that was done was the introduction of the energy label for the electrical products, action that has encouraged the consumers to buy products which are more energy efficient.
Some notable values regarding the total greenhouse gas emissions (CO2e) for EU countries, during the year 2019 are (values are expressed in CO2 kilotons equivalent (CO2e (ktn)), meaning the equivalent of emitted gases in CO2 expressed in kilotones) (EU-P1, 2021): Germany–809,799 CO2 ktn, France–442,985 CO2 ktn, Italy–418,281 CO2 ktn, Poland–390,745 CO2 ktn, Spain–314,529 CO2 ktn. Taking into account all the countries from EU, during the year 2019, it was a total amount of greenhouse gas emissions equal to 4,065,462 CO2 ktn. In comparison with year 2015, in the EU, the total amount of greenhouse gas emitters was equal to 4,499,851 CO2 kilotons. In the world, also in 2015, some other important greenhouse gas emitters (in CO2e (ktn)) were (EU-P1, 2021): China–1,306,769 CO2 ktn, United States–6,444,394 CO2 ktn, India–3,346,954 CO2 ktn, Russia–2,233,876 CO2 ktn, Japan–1,359,553 CO2 ktn.
Until year 2030, several target aim to be accomplished. Some of these targets are mentioned in Table 1 (EC3, 2020) and are about greenhouse gas emissions, renewable energies, energy efficiency, cut the CO2 emissions. The last three lines in this table represent the percent that must be achieved in order to reduce the CO2 emissions in EU until 2030 according to the Paris Agreement regarding the cars, vans, lorries and heavy and long vehicles.

TABLE 1. Targets to fulfill EU’s commitments under the Paris Agreement. Data source (EC3, 2020).
In order to sustain the process needed to accomplish the targets, a transition mechanism is required. According to EC4 (2020), this mechanism will primarily involve helping the sectors of the economy that suffer the most following the transition to the green economy. Elements such as disadvantaged regions, industrial areas and employees who will face the greatest challenges following this transition, will receive special support. In total, at least 100 Billion Euros will be allocated for this transition. They will consist of.
• Financial support: at least 30–50 billion Euros for investment, InvestEU “Just Transition” scheme, allocating 45 billion Euros of investments, a new public sector loan facility allocating around 25–30 Billion Euros, the implementation of transition plans for the regions that will need more in order to direct investments, create attractive conditions and risk sharing for public and private investors, create a platform through which ensures technical assistance for the implementation of the transition mechanism;
• Helping the people who are most vulnerable to the transition: create new opportunities for employment, the unemployment being a very important problem for EU (Daugeliene and Junevicius, 2021; Mogos et al., 2022). It will offer also the opportunity to the citizens to re-skill themself in different new required work areas, investments will be made in order to increase the energetic efficiency of the buildings, facilities will be created in order to access easier the green energy, the health of the citizens remains one of the most important issues that will be treated with maximum responsibility (Trajkova et al., 2021; Belostecinic, 2022);
• Helping companies and sectors of the economy that work in areas where the amount of carbon emissions is very high: support will be provided for the transition to the use of low-carbon technologies and economic diversification based on climate-resilient investments and jobs; making investments regarding research and innovation activities, the creation of companies and SMEs; facilitating loans and financial support; creating attractive conditions for public and private investors;
• Providing additional aid to member states of the European Union and regions that have a high degree of dependence on fossil fuel and carbon. For these, additional support will be provided for the transition to low-carbon and climate-resilient, the creation of new jobs within the green economy, the provision of technical assistance, the improvement of energy infrastructure and transportation networks, the provision of affordable loans to local public authorities, the realization of investments in renewable energy sources, increasing the degree of digitization and interconnection between the systems and platforms used.
Environmental degradation and climate change undoubtedly affect all people on earth. For this reason, the fight to save the environment through the proposed measures must be carried out at a global level. In this regard, the European Union wants to set an example by implementing the Green Deal strategy, thus becoming a leader to follow. Also, through diplomacy and the development of cooperation, the EU wants to help implement the proposed and implemented measures on a larger scale, helping in this way the other Unions and countries around the world. Actions in this sense are (EC5, 2019): close collaboration with countries on the African continent; the establishment of the Green Agenda following the summit in Poznan (2019), which has the role of being a strategy similar to the Green Deal from the European Union (EC6, 2019); creating partnerships with the Southern and Eastern Neighborhood; establishing collaborative relationships of the Green Alliance type with partners from areas such as Latin America, Asia, the Pacific and the Caribbean; achieving a close collaboration within the G20 with countries that are responsible for 80% of global greenhouse gas emissions.
Regarding the G20, these represent a strategic multilateral platform that has the role of connecting the world’s most developed economies. One of its strategic roles is to ensure in securing future global economic growth and prosperity. G20 member countries globally represent more than 80% of world GDP, 75% of international trade and around 60% of the world population (G20, 2021). The G20 members are: Argentina, Australia, Brazil, Canada, China, France, Germany, India, Indonesia, Italy, Japan, Republic of Korea, Mexico, Russia, Saudi Arabia, South Africa, Turkey, the United Kingdom, the United States, and the European Union. Spain is considered a permanent invited guest.
From a financial point of view, on a global level, it could be mentioned that the European Union, through the Green Deal strategy, aims to support around 25% of the expenses of the EU neighbors in terms of implementing development and cooperation tool in order to combat climate change. It should also be mentioned that more than 40% of the global expenses used to combat climate change are provided by the European Union.
3 Research methodology and data
In this section, an analysis of greenhouse gas emissions at the European Union level is carried out. The data used were sent by the European Union countries to the United Nations Framework Convention on Climate Change (UNFCCC) and to the EU Greenhouse Gas Monitoring Mechanism (EU Member States) (EEA, 2022). The platform from which the data were extracted offers the possibility to analyze greenhouse gas emissions at a general level, at the level of economic sectors, at the level of countries, at the level of gas types (Carbon dioxide - CO2, Methane - CH4, Fluorinated gases - F-gases (hydro-fluorocarbons (HFCs)), Nitrous oxides - N2O). The values are expressed in CO2e (ktn). Within the platform, the time interval for which values are entered is between 1990 and 2020. This long period allows various types of analyses.
In Table 2, the data for the total greenhouse gas emissions at the European Union level were extracted to highlight the differences that appeared 1 year after the start of the proposal of the Green Deal strategy in Europe. The year 2018 (before the initiation of the Green Deal strategy) and 2020 (1 year after the initiation of the Green Deal strategy) were selected. It must to be mentioned that in 2020 only a small part of the initial proposals within the strategy were adopted and their implementation began. However, many countries tried to take into account the guidance offered by the Green Deal strategy.
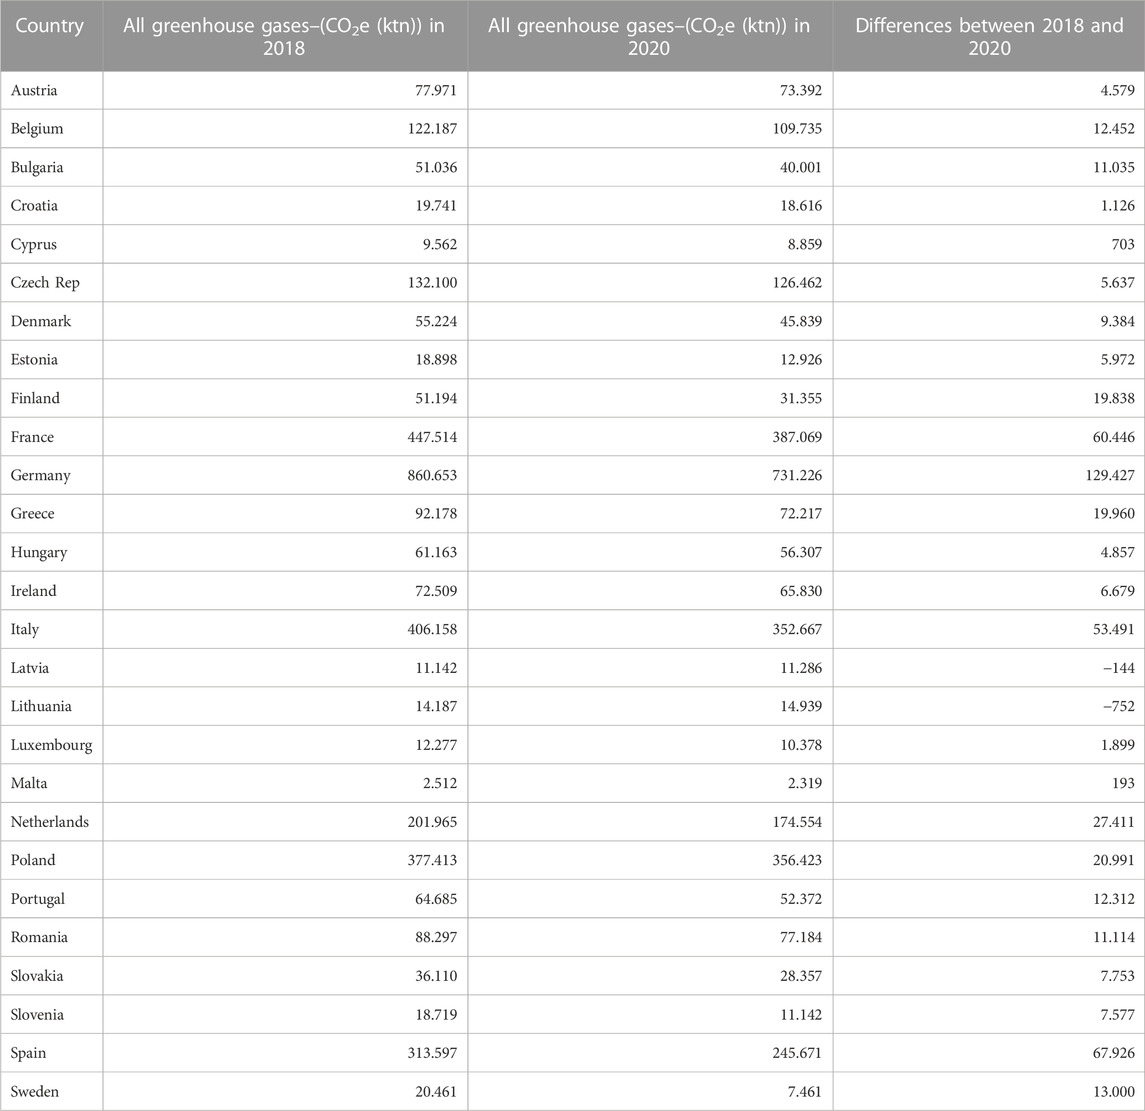
TABLE 2. EU27 - All greenhouse gases - (CO2e (ktn)) in 2018 and 2020. Data source: (EEA, 2022).
Based on the comparison between the 2 years, it can be observed that 25 countries out of 27 had a total of lower greenhouse gas emissions in 2020 compared to 2018, a fact that confirms the effectiveness of the measures taken within the Green Deal strategy even after only 1 year. Only two countries, namely, Latvia and Lithuania, have had an increase between 2018 and 2020 in greenhouse gas emissions (the result in the third column of Table 2 being negative). In Figure 1 it can be seen the differences between the countries of the European Union as well as the total level of greenhouse gas emissions in 2018 and 2020. From this point of view, the most important countries are Germany, France, Italy, Poland and Spain.
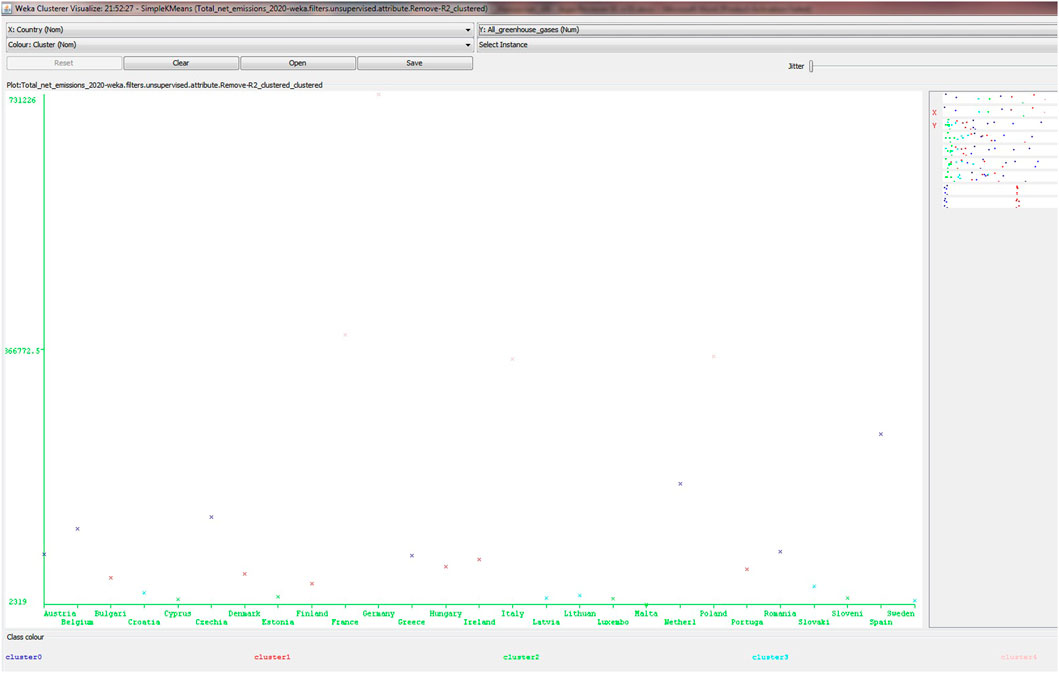
FIGURE 1. EU27 - CO2e (ktn) in 2018 and 2020. Data source: (EEA, 2022).
In order to have an overview regarding the CO2e (ktn) on a long time period, data were selected between 2010 and 2020. Based on these data, it can be observed that during this 12 years, there were only few years (like 2013 and 2017) when the CO2e (ktn) had a pronounced decreased.
In general, regarding this time period, the CO2e (ktn) remained the same. A major decrease it could be seen starting with 2019 (Figure 2).
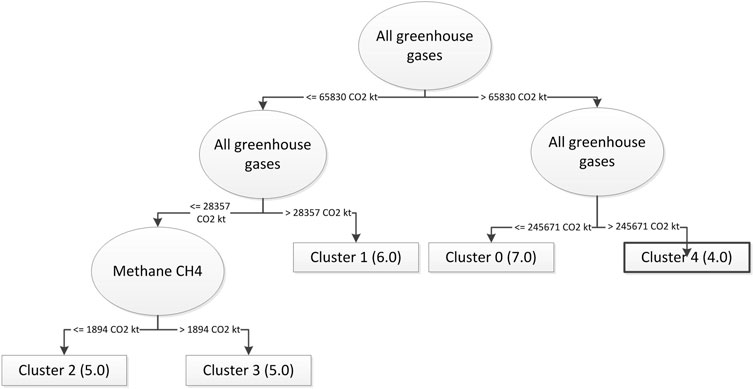
FIGURE 2. Eu countries–CO2e (ktn) between 2010 and 2020.
Next, a clustering type data mining analysis is carried out, which aims to answer to the research questions, namely,
a) For the first question to identify the main groups (clusters) of countries from the EU for years 2018 and 2020 in terms of total greenhouse gas emissions, Carbon dioxide, Methane, Fluorinated gases (F-gases), Nitrous oxides;
b) For the second question to identify the dynamics of the groups (clusters) identified in the previous question (point a) for the years 2018 and 2020? For this case, the analysis took into account the Green Deal Strategy and identifies the countries that were in a certain group before the initiation of it and then moved into another group with different characteristics after 1 year in which there were applied measures proposed by it;
c) For the third question to find out the characteristics of the profiles for the identified groups for the year 2020 from the point of view of the types of gas emissions?
d) For the fourth question to identify the most similar sectors of the economy in terms of carbon emissions (CO2) for year 2020 and which are the correlations between them?
In the data analysis, the CRoss Industry Standard Process for Data Mining (DM-CRISP) methodology was used, a specific methodology for data mining analysis (CRISP-DM, 2022; RRID:SCR_019811). This methodology consists of the following stages, each stage with specific question(s) (Hotz, 2023): requirements understanding (What does the activity/business/project need?), data understanding (What data do we have/need? They are clean enough?), data preparation (In order to model the data, how do we organize it first?), data modeling (Should I apply some specific modeling techniques?), evaluation (According to the activity/business/project objectives and goals, which model fits better?), and deployment (How the results and their interpretations could be accessed by the beneficiaries?).
A cluster analysis type is about grouping a set of instances (or objects) in a certain way in which the instances distributed in the same group (called a cluster) are more similar (based on the analyzed attributes) to each other than to those in other groups (clusters).
The software that was used to process the data and to run the algorithm is Weka (2022). The algorithm used for cluster identification is Simple K-Means and for rule identification the Nearest-neighbor-like algorithm (NNge) (RRID:SCR_016719).
The Simple K-Means algorithm has several steps as follows: 1) the number of clusters K if selected (it may be identified using algorithms like EM), 2) then select random K centroids (or points), 3) after this assign each data point to their closest centroid based on a computed distance (distances like Euclidian distance, Manhattan distance, Chebyshev distance, etc.) which will form the predefined K clusters, 4) then the variance is computed and place a new centroid of each cluster. The steps 1), 2) and 3) repeat, this means to reassign each data point into a new closest centroid of each cluster. In the situation in which reassignments occur then the step 4) is done again. Otherwise the algorithm stops.
4 Results
In the current section, data analyses are carried out in order to find the answer to the research questions mentioned above. In the first part (4.1) the authors try to find out the answer to the first three questions and in the second part (4.2) the answer for the last question.
4.1 Cluster analysis based on greenhouse gas emissions for the countries from European Union
This section aims to answer to the first three research questions from those mentioned above. The cluster analysis for EU27 countries regarding the greenhouse gas emissions is carried out for the years 2018 and 2020, values being expressed in CO2e (ktn). The time period selected was the year 2018 being the moment before the initiation of the Greed Deal and the year 2020 being the moment when the first Green Deal initiative began to be adopted and has offered recommendations for different aspects of the economy.
The algorithm used to carry out the clustering process is Simple K-Means, and the values for the parameters used were: Euclidean distance (the computed distance that is used to see how different or similar are two instances), the maximum number of iteration was set to 500 (how many times the algorithm to be applied based on the new obtained data), the cluster number after several tries was set to 5 (the number of groups which is an input parameter for the used algorithm), the number of seed (the random number seed to be used) was set to 10, the option to preserve the instance order was set to false.
For the cluster analyses for the years 2018 and 2020, the groups (clusters) of countries that are similar in terms of greenhouse gas emissions were obtained, taking into account their total values as well as each type of gas separately, respectively methane, carbon dioxide, fluorinated gases and nitrous oxides. The values mentioned for each group represent the most representative values for the group, so that the countries assigned to that group have values close to those values. In computing these values, according to the Simple K-Means algorithm, all values, from all types of gas and total values, were taken into account.
For the year 2018, according to the clustering process, the following results were obtained (the values are expressed in CO2e (ktn)):
Cluster 0: all greenhouse gas emissions are around 90,026.1667 CO2 ktn, Methane (CH4) is around 8,548.3333 CO2 ktn, Carbon dioxide (CO2) is around 72,324.8333 CO2 ktn, Fluorinated gases are around 4,400.3333 CO2 ktn, Nitrous oxides (N2O) is around 4,752.6667 CO2 ktn. Six countries were distributed in this cluster, namely: Austria, Belgium, Bulgaria, Czech Republic, Greece, and Portugal. The most representative country for this cluster is Austria.
Cluster 1: all greenhouse gas emissions are around 104,498.75 CO2 ktn, Methane (CH4) is around 15,909.5 CO2 ktn, Carbon dioxide (CO2) is around 15,909.5 CO2 ktn, Fluorinated gases are around 1,263.25 CO2 ktn, Nitrous oxides (N2O) is around 8,429.25 CO2 ktn. Four countries were distributed in this cluster, namely: Denmark, Ireland, Netherlands, and Romania. The most representative country for this cluster is Denmark.
Cluster 2: all greenhouse gas emissions are around 12,185 CO2 ktn, Methane (CH4) is around 1,220.1667 CO2 ktn, Carbon dioxide (CO2) is around 9,941.8333 CO2 ktn, Fluorinated gases is around 255 CO2 ktn, Nitrous oxides (N2O) is around 768.3333 CO2 ktn. Six countries were distributed in this cluster, namely: Cyprus, Estonia, Latvia, Luxembourg, Malta, and Slovenia. The most representative country for this cluster is Cyprus.
Cluster 3: all greenhouse gas emissions are around 33,809.3333 CO2 ktn, Methane (CH4) is around 4739 CO2 ktn, Carbon dioxide (CO2) is around 23,838.5 CO2 ktn, Fluorinated gases are around 1,182.3333 CO2 ktn, Nitrous oxides (N2O) is around 4,049.8333 CO2 ktn. Six countries were distributed in this cluster, namely: Croatia, Finland, Hungary, Lithuania, Slovakia, and Sweden. The most representative country for this cluster is Croatia.
Cluster 4: all greenhouse gas emissions are around 481,067 CO2 ktn, Methane (CH4) is around 48,008.4 CO2 ktn, Carbon dioxide (CO2) is around 393,534.8 CO2 ktn, Fluorinated gases are around 12,287.8 CO2 ktn, Nitrous oxides (N2O) is around 27,236.2 CO2 ktn. Five countries were distributed in this cluster, namely: France, Germany, Italy, Poland, and Spain. The most representative country for this cluster is France.
These results are summarized in Table 3. In this table, the values are expressed in CO2e (ktn).
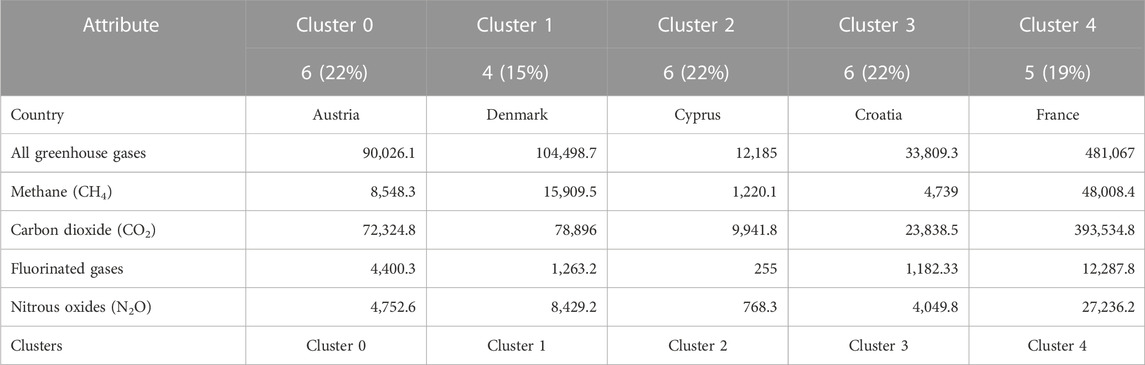
TABLE 3. Cluster analysis results for year 2018 for EU27 (values in CO2e (ktn)).
For the year 2020, following the clustering process, the following results were obtained (the values are expressed in CO2e (ktn)); Cluster 0: all greenhouse gas emissions is around 125,602.1429 CO2 ktn, Methane (CH4) is around 15,972.4286 CO2 ktn, Carbon dioxide (CO2) is around 98,161 CO2 ktn, Fluorinated gases are around 3,433.5714 CO2 ktn, Nitrous oxides (N2O) is around 8,035.2857 CO2 ktn. Seven countries were distributed in this cluster, namely: Austria, Belgium, Czech Republic, Greece, Netherlands, Romania, and Spain. The most representative country for this cluster is Austria.
Cluster 1: all greenhouse gas emissions is around 48,617.3333 CO2 ktn, Methane (CH4) is around 8,517.6667 CO2 ktn, Carbon dioxide (CO2) is around 32,903.3333 CO2 ktn, Fluorinated gases are around 1,594.3333 CO2 ktn, Nitrous oxides (N2O) is around 5,602.3333 CO2 ktn. Six countries were distributed in this cluster, namely: Bulgaria, Denmark, Finland, Hungary, Ireland, and Portugal. The most representative country for this cluster is Bulgaria.
Cluster 2: all greenhouse gas emissions is around 9,124.8 CO2 ktn, Methane (CH4) is around 960 CO2 ktn, Carbon dioxide (CO2) is around 7,380.6 CO2 ktn, Fluorinated gases are around 244.8 CO2 ktn, Nitrous oxides (N2O) is around 539.8 CO2 ktn. Six countries were distributed in this cluster, namely: Cyprus, Estonia, Luxembourg, Malta, and Slovenia. The most representative country for this cluster is Cyprus.
Cluster 3: all greenhouse gas emissions is around 16,131.8 CO2 ktn, Methane (CH4) is around 3,354.4 CO2 ktn, Carbon dioxide (CO2) is around 8,911.4 CO2 ktn, Fluorinated gases are around 842.6 CO2 ktn, Nitrous oxides (N2O) is around 3,023.6 CO2 ktn. Five countries were distributed in this cluster, namely: Croatia, Latvia, Lithuania, Slovakia, and Sweden. The most representative country for this cluster is Croatia.
Cluster 4: all greenhouse gas emissions is around 456,846.25 CO2 ktn, Methane (CH4) is around 48,514 CO2 ktn, Carbon dioxide (CO2) is around 368,183.25 CO2 ktn, Fluorinated gases are around 11,708 CO2 ktn, Nitrous oxides (N2O) is around 28,440.75 CO2 ktn. Four countries were distributed in this cluster, namely: France, Germany, Italy, and Poland. The most representative country for this cluster is France.
These results are summarized in Table 4. In this table, the values are expressed in CO2e (ktn).
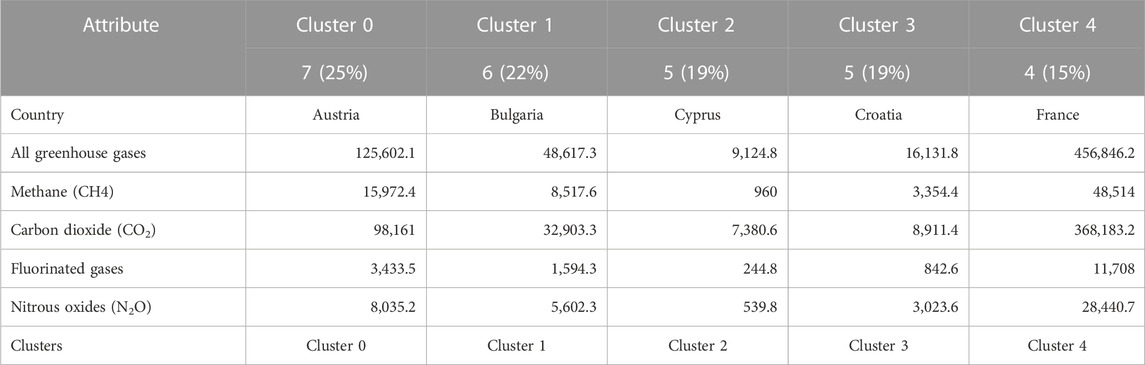
TABLE 4. Cluster analysis results for year 2020 for EU27 (values in CO2e (ktn)).
In Figures 3, 4 there are presented maps for years 2018 and 2020 regarding the countries, the CO2e (ktn) and the cluster assignment.
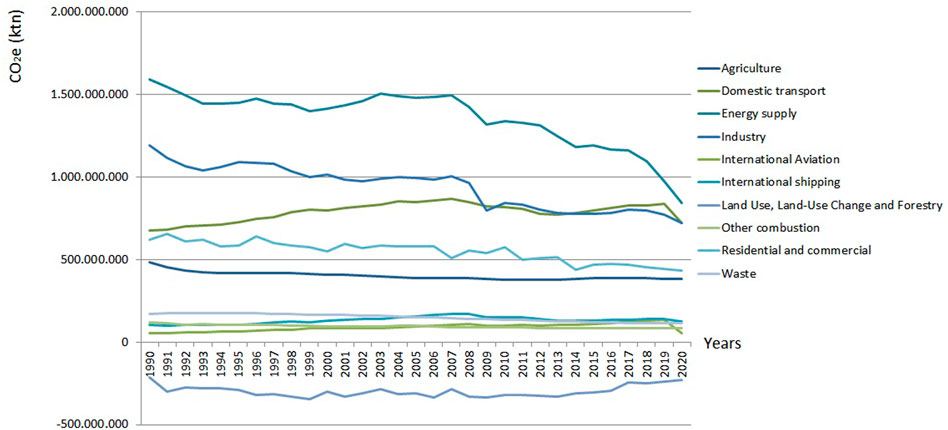
FIGURE 3. Cluster map for 2018 based on CO2e (ktn).
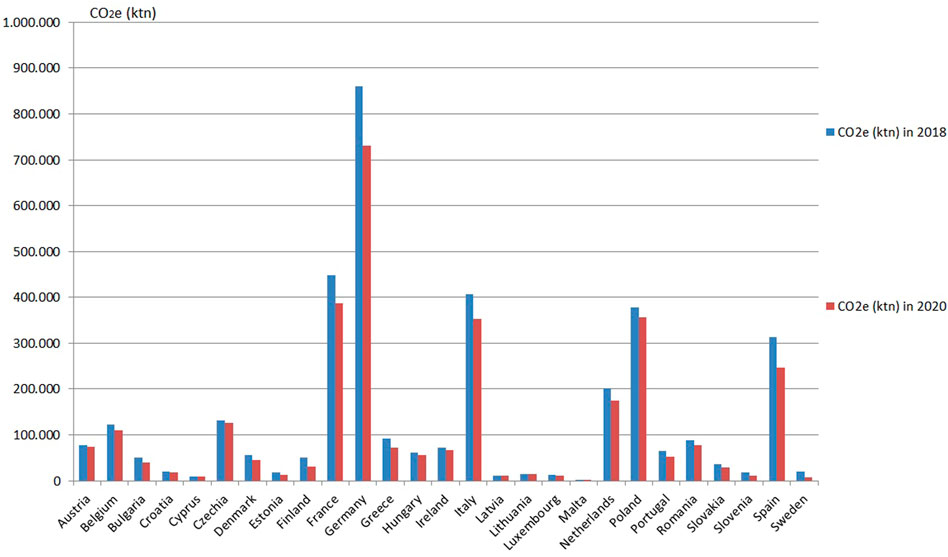
FIGURE 4. Cluster map for 2020 based on CO2e (ktn).
Analyzing values from 2018 in relation to those from 2020, it can be observed that for the most countries the values are lower. An important factor, in addition to the initiatives taken within the Green Deal strategy, was also the emergence of the COVID-19 pandemic, which blocked the countries’ economies to a large extent and has decreased the greenhouse gas emissions (Le Quere et al., 2020; Kumar et al., 2022). However, based on the mining analysis carried out, some countries were distributed in 2018 in certain clusters and in 2020 in other clusters; this means that, in relation to the general trend, they presented significant differences. Based on the clusters results of the years 2018 and 2020 it can be observed that several countries have made sustained efforts to reduce their level of greenhouse gas emissions, but others have not managed to reduce as much as they wanted total greenhouse gas emissions. The countries that have presented big differences compared to the majority are (Table 5): Bulgaria (in 2018 it was in Cluster 0 with an average of approx. 90,026 CO2 ktn per total emissions and for 2020 it moved to Cluster 1 which has an average of 48,617 CO2 ktn), Finland (in 2018 it was in Cluster 3 with an average of approx. 33,809 CO2 ktn per total emissions and for 2020 it moved to Cluster 1 which has an average of 48,617 CO2 ktn), Hungary (in 2018 it was in Cluster 3 with an average of approx. 33,809 CO2 ktn per total emissions and for 2020 it passed into Cluster 1 which has an average of 48,617 CO2 ktn), Latvia (in 2018 it was in Cluster 2 with an average of approx. 12,185 CO2 ktn per total emissions and for 2020 it passed into Cluster 3 which has an average of 16,131 CO2 ktn), the Netherlands (in 2018 it was in Cluster 1 with an average of approx. 104,498 CO2 ktn per total emissions and for 2020 it moved to Cluster 0 which has an average of 125,602 CO2 ktn), Portugal (in 2018 it was in Cluster 0 with an average of approx. 90,026 CO2 ktn per total emissions and for 2020 moved to Cluster 1 which has an average of 48,617 CO2 ktn), Romania (was in 2018 in clusters 1 with an average of approx. 104,498 CO2 ktn per total emissions and for 2020 it passed into Cluster 0 which has an average of 125,602 CO2 ktn), Spain (in 2018 it was in Cluster 4 with an average of approx. 481,067 CO2 ktn per total emissions and for 2020 it passed into Cluster 0 which has a mean of 125,602 CO2 ktn).
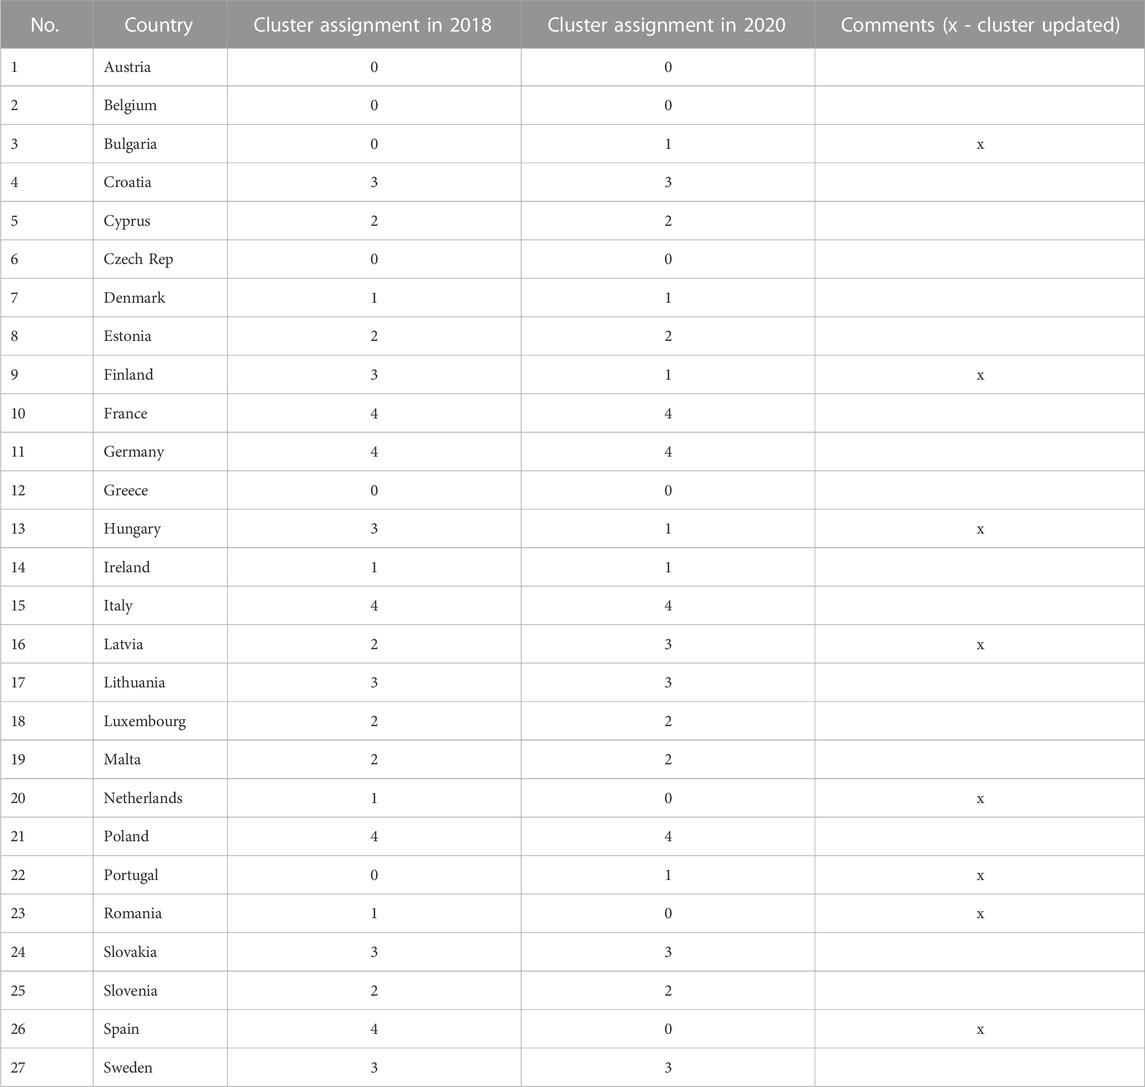
TABLE 5. Cluster dynamics for EU27 countries regarding the CO2e for years 2018 and 2020.
Applying an algorithm for classification process for the year 2020, respectively J48 algorithm, the correlation between the attributes used in the analysis can be determined (RRID:SCR_004363). Below is the pruned tree (decisional tree) that is obtained after running this algorithm.
J48 pruned tree
------------------
All_greenhouse_gases <= 65830
| All_greenhouse_gases <= 28357
| | Methane_CH4 <= 1894: cluster2 (5.0)
| | Methane_CH4 > 1894: cluster3 (5.0)
| All_greenhouse_gases > 28357: cluster1 (6.0)
All_greenhouse_gases > 65830
| All_greenhouse_gases <= 245671: cluster0 (7.0)
| All_greenhouse_gases > 245671: cluster4 (4.0)
Based on the decision tree, the main attributes based on which the countries are classified into clusters are total greenhouse gas emissions and based on Methane emissions. Based on this tree, the five rules for classifying the instances can be deduced, depending on the clusters. These rules are mentioned in Table 6.
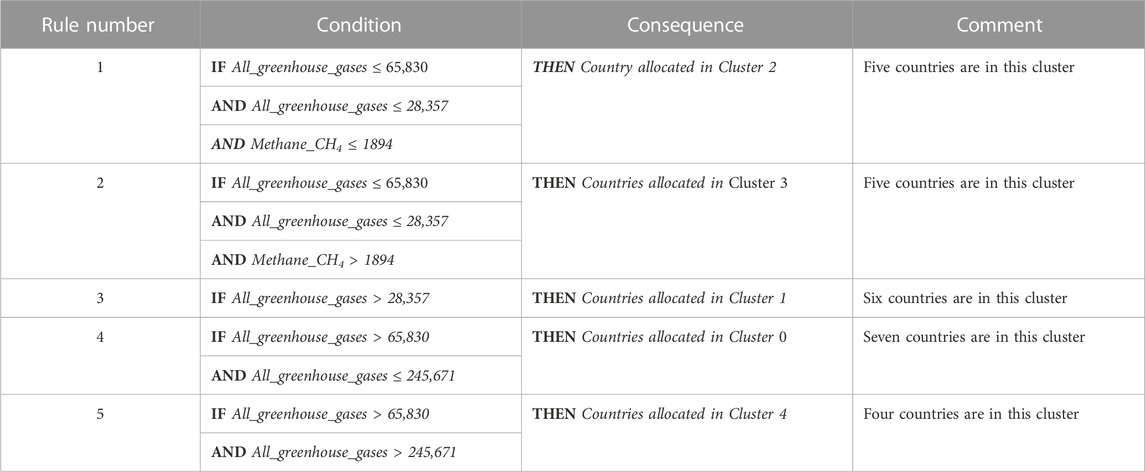
TABLE 6. Tree based rules for classifying the instances.
The results obtained after running the algorithm and using the stratified cross-validation are mentioned in Table 7.
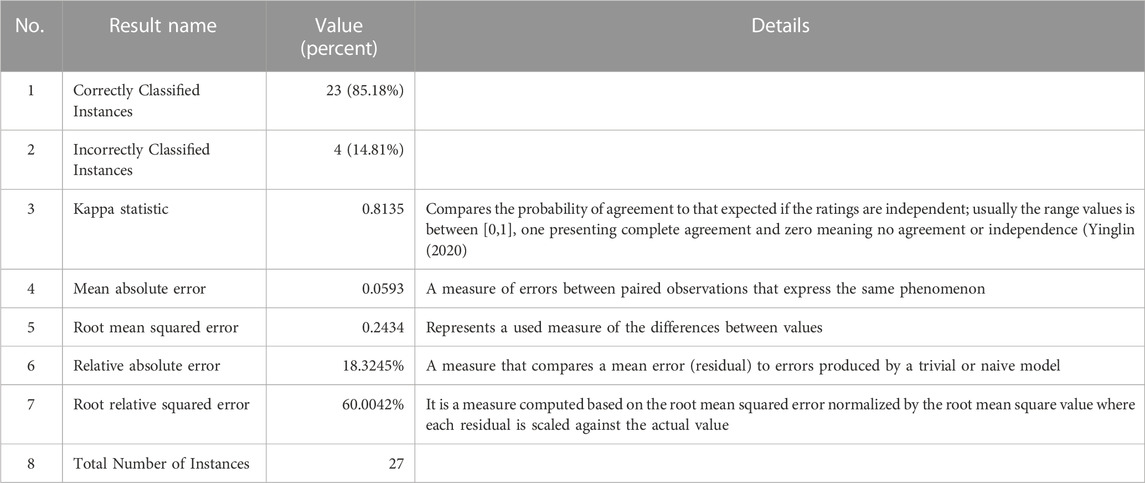
TABLE 7. Results of the stratified cross-validation.
The detailed accuracy by Class Cluster with values Cluster 0, Cluster 1, Cluster 2, Cluster 3, Cluster 4 offered by the algorithm is the following (Table 8).
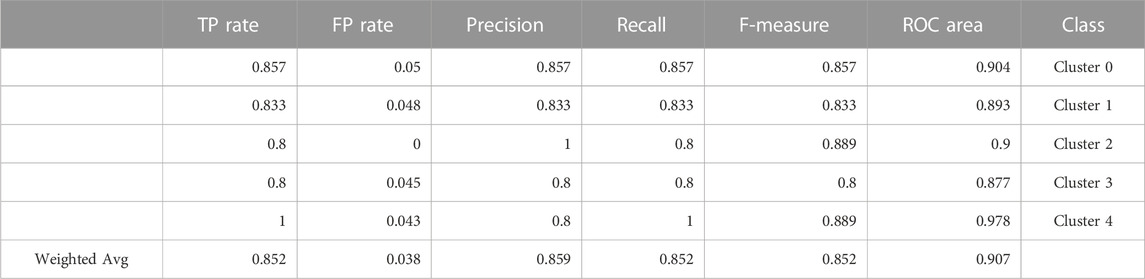
TABLE 8. Detailed accuracy by Class Cluster.
In Table 8 the used terms are (Ian et al., 2011): TP Rate and FP Rate (the true positives (TP) and true negatives (TN) are correct classifications; Precision (also named positive predictive value, is the fraction of relevant instances (or objects) among the retrieved instances (or objects)); Recall (also called as sensitivity, is the fraction of relevant instances (or objects) that were retrieved); F-Measure (defined as the harmonic mean of precision (P) and recall (R)); ROC Area (it is a graph that is indicating the performance of a classification model at all classification thresholds).
The confusion matrix offered by the J48 algorithm is represented in Table 9. In this matrix, most of the values are on the main diagonal, meaning that the most of the instances were correctly classified (23 out of 27).
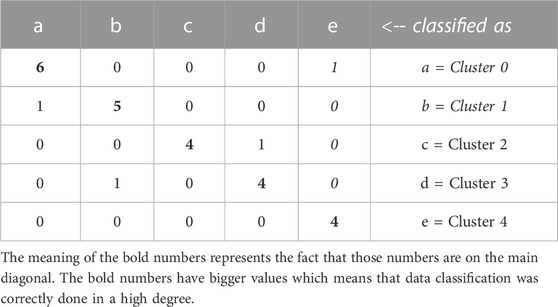
TABLE 9. Confusion matrix for clusters (year 2020).
Figure 5 shows the pruned tree, tree that has as the root the most significant element on the basis of which the classification of courts (countries) is made. The second most important attribute is the amount of Methane emitted into the atmosphere. The conditions described in the rules can be identified in the tree, starting from the root to the leaves (the elements on the last level). The figures in parentheses represent the number of courts classified taking into account the above conditions in the tree.
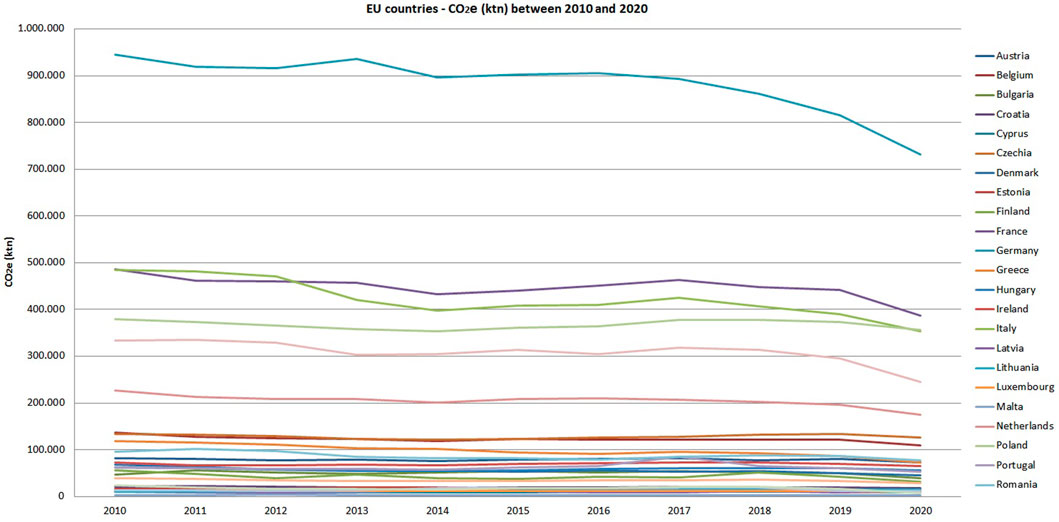
FIGURE 5. Pruned tree for the greenhouse gas emissions for 2020.
4.2 Cluster analysis based on greenhouse gas emissions for the industry areas for the countries from European Union
In this section, following the mining analysis, the authors want to find out the answer to the fourth research question, respectively, which are the most similar sectors of the economy in terms of carbon emissions (CO2) in 2020 and what are the correlations between them?
For this analysis, data were taken from the European Environment Agency website (EEA, 2022). Figure 6 shows the evolution from 1990 to 2020 of total greenhouse gas emissions for several sectors of the economy, respectively: agriculture, domestic transport (the movement of goods or people, either by air or land, within the national borders of a country.), energy supply, industry, international aviation, international shipping, land use and forestry, residential and commercial, waste and other combustion sources. It can be seen that starting with year 2019, almost every analyzed source tends to decrease in value which means that the measures recommended by the European Union through Green Deal are embraced by the countries despite the fact that many of them for the moment are only proposals.
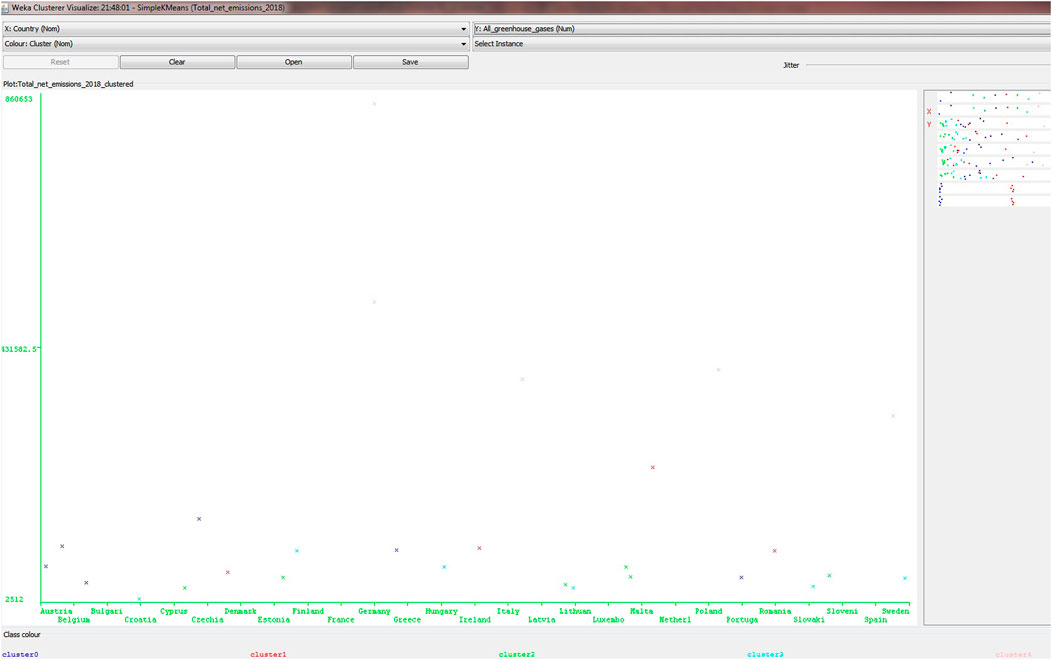
FIGURE 6. EU27–Economy sectors - CO2e (ktn) in 2018 and 2020. Data source (EEA, 2022).
Taking into account the fourth research question, the Simple K-Means algorithm was applied for the following sectors: agriculture, domestic transport, energy supply, industry, international aviation, international shipping, residential and commercial, waste and other combustion sources. The results for year 2020 are as follows:
Cluster 0–the most representative sector is Agriculture with the value around 408,685,497 CO2 ktn. The sectors from this cluster are Agriculture and Residential and commercial.
Cluster 1–the most representative sector is Domestic transport with the value around 720,441,152.5 CO2 ktn. The sectors from this cluster are Domestic transport and Industry.
Cluster 2–the most representative sector is Energy supply with the value around 842,906,717 CO2 ktn. The sector from this cluster is Energy supply.
Cluster 3–the most representative sector is International aviation with the value around 93,870,858 CO2 ktn. The sectors from this cluster are International aviation, International shipping, Waste, and Other combustion.
In order to obtain a set of rules for the mentioned economy sectors, a data set with values between year 1990 and 2020 (31 years) was analyzed regarding the total greenhouse gas emissions. The Nearest-neighbor-like algorithm (NNge) was used. The generated rules are mentioned in Table 10. The numbers between brackets at the end of each rule represent the number of instances that are following that rule. Based on these rule, correlations between the values of the emissions may highlighted.
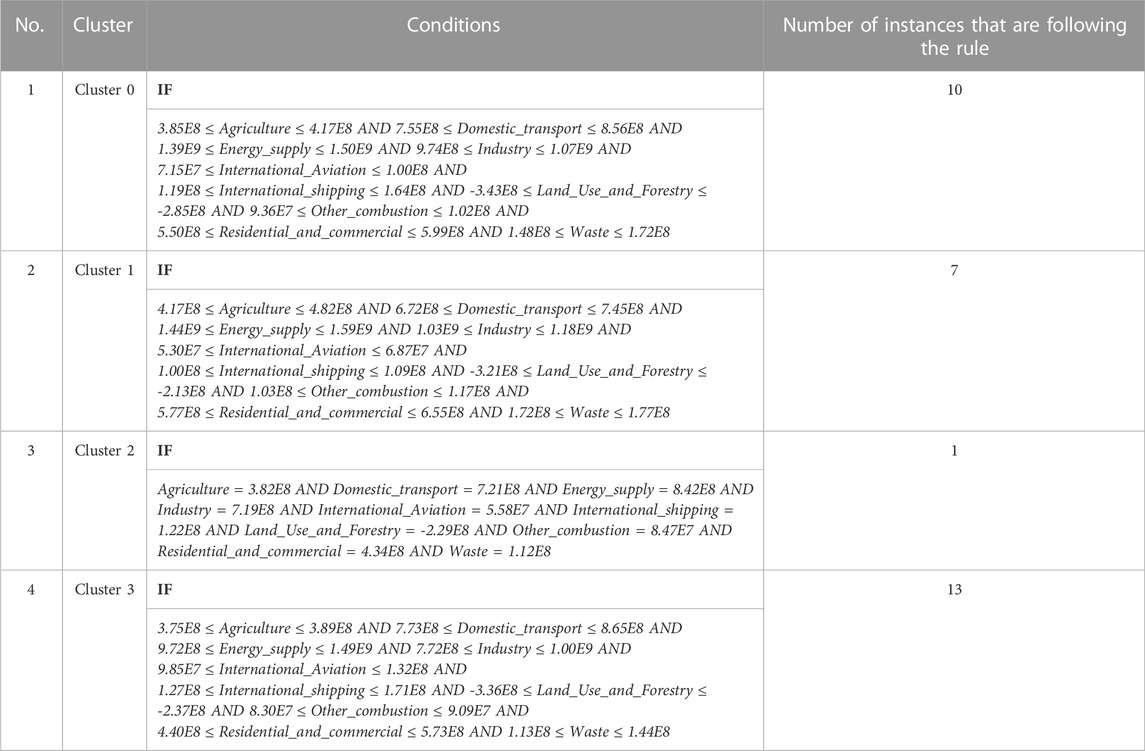
TABLE 10. Rules for economy sectors.
Analyzing the rules obtained above after running the Nearest-neighbor-like algorithm, we can observe for the 31 years considered for the analysis, the correlations between the economic sectors taken into account. Based on the number in the brackets at the end of each rule, it can be seen that the rule related to Cluster 0 applies for 10 years of the analysis, the rule related to Cluster 1 for 7 years, the rule related to Cluster 2 for 1 year and the rule related to Cluster 3 for 13 years.
5 Discussion
Based on the data analysis, the answers to the research questions are commented below.
Therefore, to the first question, namely, “What are the main groups (clusters) of countries in the European Union for the years 2018 and 2020 in terms of total greenhouse gas emissions, Carbon dioxide, Methane, Fluorinated gases (F-gases), Nitrous oxides?” it can be stated that for the 27 countries considered in the analysis, 5 groups (clusters) were identified, the representativeness within them being relatively uniform. The cluster data mining analysis was done for 2018 and 2020 in order to highlight whether the recommendations made under the Green Deal strategy had positive effects or not. It can be seen that for the countries in Cluster 0 in 2018, the values tend to become higher in 2020 (also in Cluster 0). However, the other clusters and countries tend to have lower values in general. It should also be taken into account that during this period the COVID-19 pandemic has reduced the dynamics of economies both at the European and international level. The most representative country for each group was in 2018: Cluster 0 - Austria, Cluster 1 - Denmark, Cluster 2 - Cyprus, Cluster 3 - Croatia and Cluster 4 - France. It can be seen that in Cluster 4, the values for greenhouse gas emissions are the highest, where the countries with the most developed economies are also distributed. At the opposite pole, there are the countries from Cluster 2, where the lowest values are recorded. For 2020, the most representative were: Cluster 0–Austria, Cluster 1–Bulgaria, Cluster 2–Cyprus, Cluster 3–Croatia and Cluster 4–France. The cluster with the lowest values is Cluster 2 and with the highest values Cluster 4. Also for the year 2020, the relative balanced distribution in the identified clusters can be observed. From the point of view of the representative countries for each cluster, the difference between 2018 and 2020 is that for Cluster 1, it is not Denmark (218) but Bulgaria (2020).
The utility of such an analysis lies in the fact that knowing and understanding better the similarities between the countries and identifying the group to which each country belongs, political and environmental strategies can be easily adopted to target and apply to several similar countries. The analysis carried out takes into account only the total greenhouse gas emissions, Methane (CH4), Carbon dioxide (CO2), Fluorinated gases and Nitrous oxides (N2O). These elements are the subject of this analysis.
For the second question, namely, “What is the dynamics of the groups identified in the first question from the point of view of the years achieved, 2018 and 2020″, it can be stated that 8 countries out of 27 had a different behavior compared to the others, changing their group in which they were initially allocated in 2018. Therefore, we may speak about a 30% of the countries which have had a different behavior regarding these two periods of time. The countries that behaved differently were Bulgaria, Finland, Hungary, Latvia, Netherlands, Portugal, Romania and Spain. For some countries, it can be stated that they recorded higher values in 2020 compared to 2018, such as those in Cluster 0. Other clusters recorded decreases in greenhouse gas emissions. The countries that were allocated differently for 2018 and 2020 were mentioned in the breakdown of the clusters for each year.
Such an analysis is useful to highlight the way in which some countries manage to face the challenges imposed by the necessity to reduce greenhouse gas emissions as well as the one imposed by unexpected situations, such as the COVID-19 pandemic.
The third research question that was addressed is “What are the characteristics of the profiles of the identified groups for the year 2020 in terms of the types of gases emissions?”, it can be stated that the total greenhouse gas emissions and the Methane gas emissions are the most significant attributes in order to obtain the classification for the EU countries. Based on these two elements, a set of five rules were deduced regarding conditions based on which countries could be assigned into a group based on their values. The rules are obtained based on the J48 algorithm and express the conditions that a country must fulfill for the values regarding the CO2e (ktn) and Methane gas emissions. The correctness of the classification process, namely, 23 countries out of 27 (over 85%) is also showed by the confusion matrix which has the highest values on the main diagonal.
The fourth research question is “Which are the economic sectors most similar in terms of carbon emissions (CO2) in 2020 and what are the correlations between them?”. In order to answer to this question, information was collected on sectors such as agriculture, domestic transport, energy supply, industry, international aviation, international shipping, land use and forestry, residential and commercial, waste and other combustion sources. In order to group these sectors a cluster algorithm was used. There were identify four groups, namely, the first one (cluster 0) consisting of Agriculture and Residential and commercial, the second (Cluster 1) consisting of Domestic transport and Industry, the third (Cluster 2) made up of Energy_supply and the fourth (Cluster 3) made up of International aviation, International shipping, Waste, and Other_combustion. In order to be able to identify certain correlations between these sectors, a period of 31 years was considered, respectively between 1990 and 2020. From the point of view of values, 4 rules were identified, three of them applying to several years, (respectively 10, 7 and 13 years) and one for a single year. Within each rule, the minimum and maximum values are mentioned for each sector considered in the analysis and the conditions must be fulfilled simultaneously.
The European Union is a pioneer in terms of developing and implementing a strategy to target the most important areas that directly affect life, making them priorities. Through the European Commission, the Green Deal strategy was proposed, which aims to take immediate and concrete actions that will lead to a sustainable development and increased quality of life in Europe and not only. Among these actions are the reduction of greenhouse gas emissions as much as possible, the increase of water quality, the number of renewable energy sources and low carbon fuels, the modernization of industries to become sustainable, the creation of a legal framework for the creation, use and storage of substances and chemical products, collection by product type of household waste, etc.
The reduction of greenhouse gas emissions is one of the main objectives of the Green Deal strategy because it has a direct impact on climate change. In recent years, due to climate change, there have been more and more extreme phenomena that have increased in intensity and frequency throughout the world, causing billions of euros worth of damage. For the most effective implementation of the solutions to combat greenhouse gas emissions, the quantification of the effects of the implemented solutions must be taken into account, as well as the effect these solutions have on the citizens. The application and monitoring of the solutions implies an allocation of resources that each country must assume, a large part of the material and financial support coming from the European Parliament. The good news in this regard is that the technologies that can be used to reduce greenhouse gas emissions exist and can be used successfully. These aim at solutions regarding: changing fossil fuels with renewable sources, increasing the efficiency of the energy used, and discouraging carbon emissions by creating a legal framework in which the price on them to be very high.
6 Conclusion
Greenhouse gas emissions represent one of the most important factors in terms of climate change. All over the world there are initiatives to combat and reduce these emissions. As far as the European Union is concerned, the strategy proposed by it is the Green Deal strategy which has a series of objectives with a direct impact on the environment, its sustainable development as well as the quality of life. This article describes the main aspects of the Green Deal strategy from the point of view of the general purpose and the proposed objectives. Also, taking into account the important role of greenhouse gas emissions, a cluster-type data mining analysis was carried out to identify, in a first stage, the groups of countries with similar behavior in relation to the amount of CO2 emitted into the atmosphere (the total quantity emitted as well as the quantities of Carbon dioxide, Methane, Fluorinated gases and Nitrous oxides) for the years 2018 and 2020 were taken into account. Next, the dynamics of the created groups were identified, in order to identify the countries that were different from the point of view of the group in which they were initially included. Based on the groups of countries created, the profiles of these groups were identified for the year 2020. In order to identify a correlation between the main sectors of the economy that contribute to greenhouse gas emissions, a data analysis was carried out for a period of 31 years (the period between the 1990 and 2020) to identify the correlations between these sectors and the degree of greenhouse gas emissions. A set of rules was obtained that can be applied for the 31 years, taking into account the total greenhouse gas emissions from each sector.
Summarizing the main findings of the research, it may conclude that.
• At the EU level, it was identified a group of 5 clusters based on the CO2e (ktn).
• Analyzing these clusters for years 2018 (before Greed Deal) and 2020 (after 1 year of Green Deal) it can be mentioned that the CO2e (ktn) was reduced. An important role in this period had also the COVID-19 pandemic;
• Having the comparison between the 5 clusters for the 2018 and 2020, it can be said that only one cluster had higher values for the CO2e (ktn) in 2020 than it has had in 2018. The rest of the four clusters have lower values in 2020 than they had in 2018.
• Regarding the dynamics of the clusters, it can be mentioned that from 27 countries, 8 countries have had a different behavior compared to the others regarding the CO2e (ktn);
• In order to identify profiles characteristics for the cluster groups for 2020 in terms of types for gases emissions, it can be mentioned that the total greenhouse gas emissions and the Methane gas emissions are the most significant. Based on them, a set of five rules was identity to classify the EU countries;
• For the main economy sectors, based on a cluster analysis, four clusters were identified based on the CO2 (ktn). In order to establish correlations between these sectors, a time period of 31 years was analyzed. As a result, a set of four rules were identify, three of them could be apply to several years and one for a single year.
A future research work may consist of a more detailed approach, in order to identify groups of countries with similar characteristics. In the data mining cluster analysis may be introduced information about other elements that may influence the solutions proposed within the Green Deal strategy, such as, for example: how open are people to apply the recommended measures at the individual/family level, the openness of managers of small and medium enterprises to implement new technologies and to rethink the activity of the companies, the solutions proposed by the mayors to use energy in the most efficient way to heat the buildings.
Data availability statement
Publicly available datasets were analyzed in this study. This data can be found here: https://www.eea.europa.eu/data-and-maps/data/data-viewers/greenhouse-gases-viewer.
Author contributions
All authors listed have made a substantial, direct, and intellectual contribution to the work and approved it for publication.
Conflict of interest
The authors declare that the research was conducted in the absence of any commercial or financial relationships that could be construed as a potential conflict of interest.
Publisher’s note
All claims expressed in this article are solely those of the authors and do not necessarily represent those of their affiliated organizations, or those of the publisher, the editors and the reviewers. Any product that may be evaluated in this article, or claim that may be made by its manufacturer, is not guaranteed or endorsed by the publisher.
References
Acheampong, A. O., and Boateng, E. B. (2019). Modelling carbon emission intensity: Application of artificial neural network. J. Clean. Prod. Vol. 225, 833–856. doi:10.1016/j.jclepro.2019.03.352
Bao, Y., Chang, F., Shi, J., Yin, P., Zhang, W., and Gao, D. W. (2022). An approach for pricing of charging service fees in an electric vehicle public charging station based on prospect theory. Energies 2022 (15), 5308. doi:10.3390/en15145308
Belostecinic, G., Mogoș, R. I., Popescu, M. L., Burlacu, S., Rădulescu, C. V., Bodislav, D. A., et al. (2022). Teleworking—an economic and social impact during COVID-19 pandemic: A data mining analysis. Int. J. Environ. Res. Public Health 2022 (19), 298. doi:10.3390/ijerph19010298
Bilardo, M., Sandrone, F., Zanzottera, G., and Fabrizio, E. (2021). Modelling a fifth-generation bidirectional low temperature district heating and cooling (5GDHC) network for nearly Zero Energy District (nZED). Energy Rep. J. Vol. 7, 8390–8405. doi:10.1016/j.egyr.2021.04.054
Borbujo, I. C., Pereirinha, P. G., Vega, M. G., del Valle, J. A., and Anton, J. C. A., (2021), IEEE vehicle power and propulsion conference (VPPC), Book SeriesIEEE Vehicle Power and Propulsion Conference, Apr 24, 2022, Merced, California, IEEE, doi:10.1109/VPPC53923.2021.9699373
Cadieux, S. B. B., Schuette, U. M. E., Hemmerich, C., Powers, S., and White, J. R. (2022). Exploring methane cycling in an arctic lake in Kangerlussuaq Greenland using stable isotopes and 16S rRNA gene sequencing. Front. Environ. Sci. J. Vol. 10, 884133. doi:10.3389/fenvs.2022.884133
Chioran, D., and Valean, H. (2021). 25 international conference on system theory, control and computing (ICSTCC), book SeriesInternational conference on system theory control and computing. Standby Power Manag. a Greenh. Eff. Reduct. 2021, 154. doi:10.1109/ICSTCC52150.2021.9607233
CRISP-DM (2022). Accessed November 2. Available at: https://www.datascience-pm.com/crisp-dm-2/.
Cui, S., Yao, B., Chen, G., Zhu, C., and Yu, B. (2020). The multi-mode mobile charging service based on electric vehicle spatiotemporal distribution. Energy 2020 (198), 117302. doi:10.1016/j.energy.2020.117302
Daugeliene, R., and Junevicius, A. (2021). Problematic issues of youth unemployment in central and eastern European countries, eurasian economic perspectives. Book Ser. Eurasian Stud. Bus. Econ. Vol. 16, 401–417. doi:10.1007/978-3-030-63149-9
EC1-European Commission (2019). What is the European green deal? Available at: https://ec.europa.eu/info/publications/factsheets-european-green-deal_en (accessed November 2, 2022).,
EC2-European Commission (2019). The Europe green deal, december 2019, the European green deal, what’s in it for me? Available at: https://ec.europa.eu/info/publications/factsheets-european-green-deal_en (accessed November 2, 2019).
EC3-European Commission (2020). The EU’s track record on climate action, the European Green Deal. Available at: https://ec.europa.eu/info/publications/factsheets-european-green-deal_en (accessed November 2, 2020).
EC4-European Commission (2020). The just transition mechanism: Making sure No one is left behind, the European green deal. Available at: https://ec.europa.eu/info/publications/factsheets-european-green-deal_en (accessed November 2, 2022).
EC5-European Commission (2019). EU as a global leader. Available at: https://ec.europa.eu/info/publications/factsheets-european-green-deal_en November 2, 2022).
EC6-European Commission (2019). Western balkans summit in poznań: Strengthening links within the region and with the EU, (2019). Available at: https://ec.europa.eu/commission/presscorner/detail/en/IP_19_3669 (accessed November 3, 2022).
EEA - European Environment Agency (EEA), (2022), EEA greenhouse gases - data viewer, Available at: https://www.eea.europa.eu/data-and-maps/data/data-viewers/greenhouse-gases-viewer, accessed October 15, 2022
EPA-USA - GHG reduction programs and strategies, Available at: https://www.epa.gov/climateleadership/ghg-reduction-programs-strategies, accessed November 8, 2022.
Etminan, M., Myhre, G., Highwood, E. J., and Shine, K. P. (2016). Radiative forcing of carbon dioxide, methane, and nitrous oxide: A significant revision of the methane radiative forcing. Geophys. Res. Lett. J. Vol. 43, 12614–12623. doi:10.1002/2016gl07193024
EU-P1-European Parliament (2021). Greenhouse gas emissions by country and sector (infographic). Available at: https://www.europarl.europa.eu/news/en/headlines/society/20180301STO98928/greenhouse-gas-emissions-by-country-and-sector-infographic.
EU-P2 (2022). EU parliament. Available at: https://www.europarl.europa.eu/legislative-train/theme-a-european-green-deal/file-european-green-deal (accessed November 8, 2022).
G20-Indonesia (2021). G20-Indonesia. Available at: https://www.g20.org/about-the-g20/(accessed November 2, 2022).
Hotz, N. (2023). What is CRISP DM? Available at: https://www.datascience-pm.com/crisp-dm-2/(accessed February 20, 2023).
Ian, W., Eibe, F., and Mark, H. (2011). Data mining - practical machine learning, tools and techniques. Netherlands: Elsevier.
Kadam, P., and Vijayumar, S. (2018). in 3rd International Conference for Convergence in Technology (I2CT), Pune, India, 06-08 April 2018 (IEEE), 1–3.2018
Kayakus, M. (2022). Forecasting carbon dioxide emissions in Turkey using machine learning methods, International Journal of Global Warming. ISSN 1758-2083 Vol. 28, 199–210. doi:10.1504/IJGW3
Kumar, A., Singh, P., Raizada, P., and Hussain, C. M. (2022). Impact of COVID-19 on greenhouse gases emissions: A critical review. Sci. Total Environ. 806 (1), 150349. doi:10.1016/j.scitotenv.2021.150349
Le Quéré, C., Jackson, R. B., Jones, M. W., Smith, A. J., Abernethy, S., and Andrew, R. M. (2020). Temporary reduction in daily global CO 2 emissions during the COVID-19 forced confinement. Nat. Clim. Change, 1–7. Available at: https://www.oecd.org/regional/Creutzig-Presentation-ZeroCarbonTransition.pdf.
Liang, Z., Liu, Y. P., Hu, H. C., Li, H., Ma, Y. Q., and Khan, M. Y. A., (2021), Combined wavelet transform with long short-term memory neural network for water table depth prediction in baoding city, north China plainIn Environ. Sci. J., Vol. 9, 1, doi:10.3389/fenvs.2021.780434
Ma, M., Huang, B., Wang, B., Chen, J., and Liao, L. D. (2018). Development of an energy-efficient smart socket based on STM32F103. Appl. Sciences-Basel J. Vol. 8, 2276. doi:10.3390/app8112276
Mann, Michael E. Encyclopedia britannica. Available at: https://www.britannica.com/science/greenhouse-gas (Accessed November 7, 2022).
McDougall, P. (2021). The place of labor rights in the European union's environmental policies. Ger. Law J. Vol. 22, 1–30. doi:10.1017/glj.2020.103
Mogoș, R. I., Dinu, M., Constantinescu, V. G., and Istrate, B. (2022). “Unemployment in European union during the COVID-19 pandemic. A cluster analysis,” in 8th BASIQ international conference on new trends in sustainable business and consumption. Editors R. Pamfilie, V. Dinu, L. Tachiciu, D. Plesea, and C. Vasiliu, 117–124.
Mogos, R. I., Negescu–Oancea, M. D., Burlacu, S., and Troaca, V. A. (2021). Climate change and health protection in European union. Eur. J. Sustain. Dev. (2021) 10 (3), 97–108. doi:10.14207/ejsd.2021.v10n3p97
Nisbet, E. G., Dlugokencky, E. J., Fisher, R. E., France, J. L., Lowry, D., Manning, M. R., et al. (2022). Atmospheric methane and nitrous oxide: Challenges alongthe path to net zero. Philosophical Trans. R. Soc. A-Mathematical Phys. Eng. Sci. J. Vol. 379, 20200457. doi:10.1098/rsta.2020.0457
Nunez, C. (2019). Carbon dioxide levels are at a record high. Here's what you need to know, National Geographic. Available at: https://www.nationalgeographic.com/environment/article/greenhouse-gases (accessed November 2, 2022).
Nyserda-1 (2021). New York state oil and gas, methane emissions inventory: 2018–2020 update, final report, report number 21-31. Available at: https://www.nyserda.ny.gov/-/media/Project/Nyserda/Files/Publications/Energy-Analysis/NYS-oil-gas-sector-methane-inventory-2018-2020.pdf.
Nyserda-2 (2021). Hydrofluorocarbon emissions, inventory in New York state, final report. Available at: https://www.nyserda.ny.gov/-/media/Project/Nyserda/Files/EDPPP/Energy-Prices/Energy-Statistics/21-24–HFC-Emissions-Inventory-in-NYS.pdf.
Nyserda-3 (2019). New York state greenhouse, gas inventory: 1990–2016, final report. Available at: https://www.nyserda.ny.gov/About/Publications/Energy-Analysis-Technical-Reports-and-Studies/Greenhouse-Gas-Emissions#other.
IPCC (2014). “Climate change 2014: Mitigation of climate change,” in Contribution of working group III to the fifth assessment report of the intergovernmental panel on climate change. Editors, R. Pichs-Madruga, Y. Sokona, E. Farahani, S. Kadner, K. Seybothet al. (United Kingdom and New York, NY: Cambridge University Press). Available at: https://www.ipcc.ch/site/assets/uploads/2018/02/ipcc_wg3_ar5_full.pdf.
Ponce, P. R. (2022). Degrowth vs green deal: Analysis from ethics and political theory. M+A-Revista Electron. Medio Ambiente Vol. 22, 60–78.
Rosentreter, J. A., Borges, A. V., Deemer, B. R., Holgerson, M. A., Liu, S. D., Song, C. L., et al. (2021). Half of global methane emissions come from highly variable aquatic ecosystem sources. Nat. Geoscience J. Vol. 14, 225–230. doi:10.1038/s41561-021-00715-2
Stascheit, C. W., and Gomez-Navarro, T. (2022). Make your home carbon-free. An open access planning tool to calculate energy-related carbon emissions in districts and dwellings. Energy Rep. J. Vol. 8, 11404–11415. doi:10.1016/j.egyr.2022.08.263
Trajkova, K., Andonov, M., Tomovska-Misoska, A., and Pesevska, D. J., (2021), Teleworking - just a legal opportunity or basis for redefining the concept of labor relations during covid-19 and in the post pandemic period, Post-Pandemic Sustain. Eur. (AICEI2021), 2021, 131. doi:10.5281/zenodo.7290870
WEKA (2022). Weka. Available at: https://www.cs.waikato.ac.nz/ml/weka/(accessed October 10, 2022).
Yinglin, X. (2020). “Correlation and association analyses in micro biome study integrating multiomics in health and disease,” in Progress in molecular biology and translational science. Editor J. Sun (Cambridge, Massachusetts: Academic Press), Vol. 171, 309–491. doi:10.1016/bs.pmbts.2020.04.003
Zenone, T., Ottaiano, L., Manco, A., Vitale, L., and Famulari, D., (2021), Process-oriented simulation and observations of N2O emission from intensively managed agricultural cropping system, 2021 Ieee International Workshop on Metrology for Agriculture and Forestry (IEEE Metroagrifor 2021), Trento-Bolzano, Italy, IEEE, 03-05 November 2021, 325–330. doi:10.1109/MetroAgriFor52389.2021.9628497
Keywords: greenhouse emissions, Green Deal, climate change, European Union, cluster analysis
Citation: Mogoș RI, Petrescu I, Chiotan RA, Crețu RC, Troacă VA and Mogoș PL (2023) Greenhouse gas emissions and Green Deal in the European Union. Front. Environ. Sci. 11:1141473. doi: 10.3389/fenvs.2023.1141473
Received: 10 January 2023; Accepted: 23 March 2023;
Published: 05 April 2023.
Edited by:
Nnaemeka Vincent Emodi, University of Queensland, AustraliaReviewed by:
Dimitrios Melas, Aristotle University of Thessaloniki, GreeceGulnihal Ozbay, Delaware State University, United States
Joanna Rosak-Szyrocka, Częstochowa University of Technology, Poland
Copyright © 2023 Mogoș, Petrescu, Chiotan, Crețu, Troacă and Mogoș. This is an open-access article distributed under the terms of the Creative Commons Attribution License (CC BY). The use, distribution or reproduction in other forums is permitted, provided the original author(s) and the copyright owner(s) are credited and that the original publication in this journal is cited, in accordance with accepted academic practice. No use, distribution or reproduction is permitted which does not comply with these terms.
*Correspondence: Radu Ioan Mogoș, bW9nb3MucmFkdUBnbWFpbC5jb20=; Radu Alexandru Chiotan, cmFkdWNoaW9AeWFob28uY29t