 Peiwen Zhang
 Rui Ding
 Yu Wang
 Qiaoyan Zhang
 Lianzheng Zhao
95% of researchers rate our articles as excellent or good
Learn more about the work of our research integrity team to safeguard the quality of each article we publish.
Find out more
ORIGINAL RESEARCH article
Front. Environ. Sci. , 05 May 2023
Sec. Environmental Economics and Management
Volume 11 - 2023 | https://doi.org/10.3389/fenvs.2023.1138931
This article is part of the Research Topic Environmental Risk and Corporate Behaviour View all 30 articles
With the rapid growth of the aviation industry, the issue of carbon emissions has become a substantial challenge for governments and airlines. This paper proposes a hybrid carbon emission reduction mechanism, including major airlines in the emission trading systems and implementing carbon tax for small and medium-sized airlines. First, a tripartite evolutionary game model is constructed to study strategic behaviors. Second, four scenarios of evolutionarily stable strategies (ESSs) are analyzed. Finally, the influencing parameters of players’ strategy choices are analyzed through simulations. The results show that: 1) the steady development scenarios (1, 1, 1) can be reached under the appropriate conditions; 2) the parameters such as carbon allowances and carbon tax prices significantly influence the evolutionary trend of stakeholders’ dynamic choices; 3) the implementation of a hybrid mechanism by the government could facilitate the choice of low carbon operation strategies for both types of airlines. Accordingly, a series of policy recommendations are proposed to promote carbon emission reduction in civil aviation. This study combines evolutionary game and scenario analysis methods in an attempt to provide a new perspective on carbon emission reduction governance, thereby promoting the effective development of carbon emission reduction in civil aviation in the future.
Three main contributions are made in this study. First, in terms of governance of reducing civil aviation’s carbon emissions, it offers a new perspective. In contrast to previous studies focusing on carbon tax or carbon trading, this paper proposes a hybrid mechanism including both a carbon tax and carbon trading system. The evolution of strategic behavior of the government, major airlines, and small and medium-sized airlines is discussed in relation to carbon emission reductions in civil aviation. Second, in contrast to a traditional evolutionary game, this paper also incorporates the scenario analysis method to classify the evolution of carbon emission reduction in civil aviation into four different scenarios. It studies the dynamic strategic choices of the three participants in different scenarios and the ESSs of the system. Third, this paper also attempts to analyze the key parameters influence game players’ strategy choices. and proposes effective measures and recommendations that can guide the development of a hybrid mechanism for carbon emission reduction.
Carbon emission reduction is a global concern (Davis et al., 2018). The transportation sector accounts for approximately 15% of total GHG emissions across all sectors (Hu et al., 2022). As an essential component of the transportation sector, air transport delivers easy access and generates considerable financial benefits but also generates significant carbon emissions (Zhang J.J et al., 2019). Carbon emissions from the aviation industry have been shown to have an increasingly negative impact on climate change in numerous studies, and one of the largest sources of emissions is the combustion of aviation fuel (Dessens et al., 2014). Currently, the world’s airlines burn more than 5 million drums of jet fuel per day, accounting for an estimated 3% of global carbon emissions (Liu et al., 2020). Boeing forecasts that global aviation carbon emissions are expected to increase to 1.23–1.49 billion tons by 2025 (Liu et al., 2022). After a long period of exploration and breakthroughs, it is becoming increasingly difficult to reduce aircraft emissions through many technologies (Torenbeek, 2013). In June 2022, the International Air Transport Association (IATA) called on governments to urgently develop large-scale reduction measures to rapidly expand the use of sustainable aviation fuel (SAF) so that the aviation industry can satisfy its pledge to achieve “zero” carbon emissions by 2050 (IATA, 2022). Therefore, in order to address these environmental threats, aviation carbon emission reduction must be undertaken rapidly.
To address the challenge of carbon emission reduction in civil aviation, market-based tools are the preferred available tools. Current incentive tools for reducing emissions, the Coase theorem (carbon trading) and Pigouvian taxation (carbon tax), are regarded as the most effective market tools for reducing carbon emissions (Stavins, 2008).
Many studies have used carbon tax mechanisms to address carbon emissions from civil aviation, and many European Union (EU) member states have already taken action to impose a carbon tax (Hu X et al., 2020). Fukui and Miyoshi demonstrate that an aviation carbon tax will reduce long-term fuel consumption and carbon emissions based on data from the United States airline industry (Fukui and Miyoshi, 2017). However, tax policy is devised by national legislatures, and legislation is a symbol of national sovereignty, so a uniform carbon tax on an international scale is not feasible (Mandell, 2008; Goulder and Schein, 2013; Snyder, 2015). Therefore, it is difficult for the carbon tax to regulate the international market (Zhang et al., 2017), i.e., the carbon emissions of international airlines cannot be effectively limited. Carbon emission trading systems are widely used around the world. During the 2008 presidential campaign, the United States developed a Regional Greenhouse Gas Initiative. Among Asian countries, Japan imposed a carbon tax in Saitama in 2012 and introduced an emission trading system in Tokyo in 2010 (Dong et al., 2010), and South Korea enacted a carbon trading system in January 2015. An important carbon trading market in the world has been expanded to include international airline operations, namely, the European Union Emission Trading Scheme (EUETS), as stated in Decree 2008/101/EC issued in November 2008. ETSs play an important role in aviation carbon reduction. However, there concerns remain in the implementation of carbon trading. For example, an emission trading system is costly to implement relative to a carbon tax (Stavins, 2022), and incorporating all Major airlines and small-sized and medium airlines into a carbon trading system will undoubtedly dramatically increase costs.
Therefore, a more viable mechanism is needed to mitigate aviation carbon emissions. By examining the impact of the aviation carbon tax on the United States travel carbon emissions, Hofer et al. suggest that carbon tax can be used as a complementary tool in conjunction with carbon trading (Hofer et al., 2010). Therefore, a new hybrid mechanism combining carbon trading and the carbon tax is established to explore a more suitable approach for overall civil aviation.
However, when it comes to carbon emission reduction in civil aviation, there is a conflict between the government and airlines, i.e., maximizing airline profits and implementing carbon reduction strategies cannot be achieved simultaneously. Therefore, an approach that successfully balances airline development and environmental protection is essential to resolving this conflict. In the face of a challenging civil aviation transport market and stringent conservation measures, airlines and governments need to discover a way to balance green and sustainable development. (Lu, 2009). The major airlines were included in the carbon trading, while small and medium-sized airlines were subject to the carbon tax (Xu et al., 2016). The government gives the major airlines initial free carbon allowance, giving them more economic benefits, while they can exchange carbon allowances in the carbon trading system. Small and medium-sized airlines must pay the government-mandated carbon tax, and since the excess is taxed at a substantially higher rate than their profits, implementing progressive taxation can effectively solve this problem (Oishi et al., 2012). In addition to government factors, public opinion in a competitive environment can also influence airlines’ emissions reduction behavior. Several studies have found that companies’ low-carbon decisions are driven by public opinion (Liu et al., 2012; Zhang et al., 2013). Based on the above discussion, the behavior exhibited by the government, major airlines, and small-sized and medium airlines represents an evolutionary game. Game theory can provide some interesting clues from the perspective of the interaction of players involved in civil aviation carbon emissions reduction. For example, Dixit et al. constructed a Bertrand duopoly game model between two airlines to explore the impact of the carbon tax on airlines’ green investment decisions (Dixit et al., 2022). However, the existing studies do not consider the emission reduction behavior of the government and airlines under the hybrid mechanism.
To fill the deficiencies in the literature highlighted above, we established a tripartite evolutionary game model consisting of the government, major airlines, and small and medium-sized airlines to study the problem of carbon emission abatement in civil aviation. The following reasons make this approach an attractive choice for our research question: first, it is obvious that the regulation of carbon emission reduction in civil aviation is a dynamic process, and the government and airlines will choose the appropriate strategy according to the changes in revenue and expenses. Unlike traditional game theory, evolutionary games reach equilibrium dynamically (Shao and Yuan, 2022). Second, the government and airlines are limited rational. Evolutionary game theory is more realistic in terms of limited rationality (Zhang S et al., 2019). Third, evolutionary games are widely used in policy decision analysis and perform well (Wang et al., 2021). Recently, research on environmental issues and policy decisions has been conducted using evolutionary games. Consequently, the evolutionary game can be used to systematically address the dilemma of carbon emission reduction in civil aviation.
The remainder of the paper is structured as follows. An overview of the relevant literature for this study is presented in Section 2. An evolutionary game model is constructed in Section 3. The strategic stability and stability points of the evolutionary game model are analyzed in Section 4. The evolutionary process and the key parameters affecting the model are introduced by numerical simulations in Section 5. Section 6 provides a discussion. Finally, Section 7 presents conclusions and policy insights.
Civil aviation carbon reduction is a thorny issue for the government, major airlines, and small and medium-sized airlines. Most studies on environmental regulations involve carbon tax or carbon trading mechanisms. the carbon tax is a price tool that is equivalent to setting a price for each unit of carbon emissions, according to which enterprises adjust their carbon emission behavior. Emission trading is a quantitative tool that first defines a total carbon allowance and then issues allowances to companies based on their historical emissions or other methods, and their allowances can be traded in the market. Each approach has advantages and disadvantages (Stavins, 2022).
Zhang et al. comparatively analyze carbon tax and carbon trading from the perspectives of system cost, political feasibility, emission reduction effect, social efficiency (Zhang et al., 2017), and international cooperation and find that carbon tax and carbon trading have advantages and disadvantages and that the implementation of a hybrid system consisting of both should achieve complementary advantages. Vollebergh et al. note that a hybrid carbon tax and carbon trading mechanism can overcome political resistance without affecting firms’ incentives to reduce emissions (Vollebergh et al., 1997). Zhao et al. find that carbon taxes and carbon trading form a policy mix that is comprehensive in terms of price flexibility and coverage (Zhao L et al., 2020). In addition, the cost of monitoring and enforcement will be substantially reduced due to the reduction in the number of participating companies. Lehmann et al. also highlight that having multiple factors under one emission reduction policy, for instance, the cost of abatement to firms and the consistency of policy implementation, may lead to increased transaction costs and that an appropriate hybrid of the two policies may yield a better result (Lehmann, 2012).
Academics have proposed several hybrid mechanisms. Pizer proposes a carbon trading with a carbon tax concept: when the price of carbon trading exceeds a pre-set level, manufacturers can purchase carbon allowances from the government at a constant level without restriction, thus ensuring that economic activities can still operate under the emission reduction policy (Pizer, 2002). Snyder proposes another hybrid system to control the cost of emissions, where carbon-emitting companies pay a fixed price for the carbon tax and the government make use of the carbon tax revenue to purchase allowances in the carbon market for enterprises to reduce emissions (Snyder, 2015). This hybrid mechanism is more conducive to incentivizing enterprises to adopt abatement strategies, and the government maintain firm control over the reduction targets. Mandell, (2008) extends Weitzman’s (Weitzman, 1974) study by examining a system in which one sector implements carbon trading while another sector implements a carbon tax. The division of sectors is the result of a tradeoff between abatement efficiency and quantity, suggesting that such hybrid mechanisms are often better than the isolated implementation of one mechanism. Chiu et al. (2015) designed a hybrid mechanism for estimating energy prices, and the results indicate that this mechanism is applicable to the gasoline market in Taiwan. Zhang et al., in a study of greenhouse gas emissions, show that hybrid mechanisms can help achieve peak carbon by 2030 and at a lower cost than a pure emission trading system (Zhang et al., 2022a). The advantages of hybrid mechanisms are increasingly being noted in studies. Cao et al. (2019), for instance, evaluate a hybrid mechanism and report that it achieved set targets while losing less carbon trading prices and GDP than the implementation of an emission trading system alone. Unlike Cao et al., Bi et al. contend that the effectiveness of the hybrid mechanism is not a straightforward mixture of a carbon tax and carbon trading but shows an alternative pathway to green development (Bi et al., 2019). All of the above studies on hybrid mechanisms have demonstrated their benefits in terms of emissions reduction, but few studies have applied hybrid mechanisms to the transport sector.
In contrast to traditional approaches, which usually ignore social interactions when studying the behavior of players, game theory sets the theoretical basis for determining the strategies used to formulate choices in an environment where rational participants collaborate with each other (Eissa et al., 2021; Jiang et al., 2022). However, traditional game theory has certain shortcomings (Ji et al., 2019). First, it assumes that all players are “perfectly rationality”, while this is rarely true in reality. Second, it supposes that all stakeholders have the same decision environment and level of rationality, which is not actually the case. Finally, traditional game theory is static and cannot dynamically describe changes in the strategic behavior of participants. Dixit et al. discuss the impact of carbon taxes on airlines’ greening investment decisions, however, the use of evolutionary games may better describe the dynamic decision-making process of airlines (Dixit et al., 2022).
Evolutionary games are a refinement and extension of traditional games, addressing the constraints of traditional game theory (Friedman, 1998). Evolutionary games combine game theory and dynamic evolutionary processes, emphasizing dynamic processes rather than focusing on statics, and explaining the reasons and ways that players reach a stable state.
Evolutionary game theory has an undeniable advantage in regulating carbon emissions (Jiang et al., 2019; Wang et al., 2021). Jiang et al. study the dynamics of players’ decisions to reconcile the conflicting interests between the governments and shipping companies to better the environment in coastline areas. This plays a crucial part in the emissions abatement behavior of governments and maritime enterprises, as well as in policy development (Jiang et al., 2020). Chong and Sun note that evolutionary game theory is a powerful tool that could help the central government solve the twin dilemmas of environmental protection and economic growth (Chong and Sun, 2020). Similarly, Meng et al. analyzed the evolutionary path of the choice of emissions abatement strategies of the governments, port companies and maritime companies, and investigate the mechanisms influencing the choices of players (Meng et al., 2022). Based on an evolutionary game, the above study analyzes only two or three parties’ dynamic game relationships. However, no evolutionary game studies have emerged to address a hybrid emission reduction mechanism. Thus, this paper systematically and comprehensively investigates the mechanism of low-carbon behavior between the government and airlines under a hybrid mechanism.
Existing studies mainly cover carbon trading, carbon tax and SAF. This study combines carbon trading and carbon tax to construct a hybrid emission reduction mechanism and considers the airlines’ implementation of emission reduction strategies combined with the introduction of SAF. Therefore, we have developed a tripartite evolutionary game model consisting of the government, major airlines, and small and medium-sized airlines to contribute to the current state of the civil aviation carbon reduction dilemma.
Civil aviation carbon emission reduction governance is a complicated system project for both international and national purposes, involving multiple interests, and its mechanism of action is complex and extensive. The government is the implementer of the policy, while the main target of the airlines is to control or minimize the emissions from the operation of the aircraft. The government allocates free carbon allowances to the major airlines, and if there are carbon allowances left in a cycle, the major airlines can sell the remaining carbon allowances; if the usage exceeds the carbon allowances, then major airlines need to purchase additional carbon allowances. The small and medium-sized airlines are subject to a carbon tax. The carbon tax is progressive, and a punitive carbon tax is payable when the threshold is exceeded (Qiu et al., 2020).
Based on the relevant theoretical and practical problems, the interaction between the government, major airlines, and small and medium-sized airlines is shown in Figure 1. Following the previous analysis, carbon emission reduction in civil aviation is a multistage and dynamic process. Therefore, this paper explores the dynamic evolutionary game of emission reduction in civil aviation from the perspective of a hybrid mechanism.
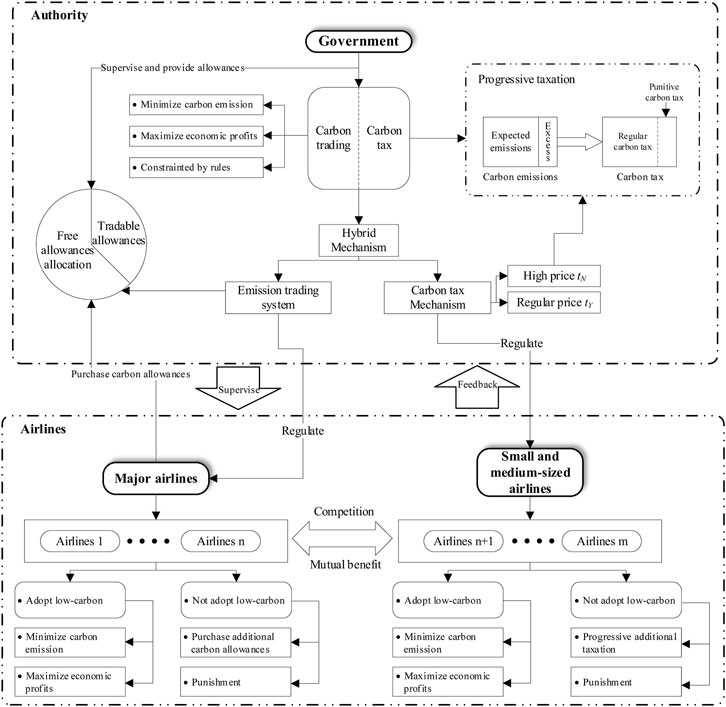
FIGURE 1. Interaction between multiple stakeholders.
Before the evolutionary game model is constructed, several hypotheses are stated.
(1) As shown in Table 1, all three players in the evolutionary game, the government, major airlines and small and medium-sized airlines, have two strategies. The results of their strategy choices evolve over time and stabilize at the optimal strategy. (Wang et al., 2022).
(2) The three players are subject to asymmetric information. All players attempt to reduce carbon emissions while maximizing their own benefits. (Friedman, 1991).
(3) One of the most effective options for significant reductions in carbon emissions in a relatively short time frame is to mix SAF with traditional aviation fuel (TAF) (Heyne et al., 2021). Therefore, we assume that the only cost of both the major airlines and small and medium-sized airlines is for aviation fuel. The airlines use only SAF in the NO strategy and a mix of SAF and TAF in the AO strategy.
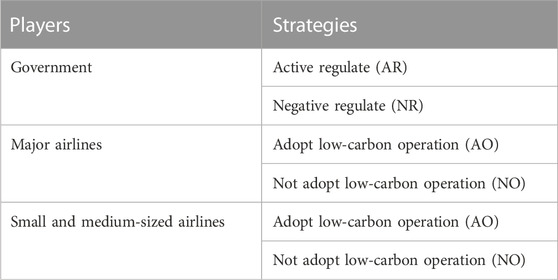
TABLE 1. Strategies for three players.
Major airlines parameter setting: The cost of the major airlines is CMY and CMN when the AO and NO strategies are adopted, respectively. Moreover, since a mixture of TAF and SAF (PSAF > PTAF) is required when adopting the AO strategy, CMY = SAFMYPSAF + TAFMYPTAF and CMN = SAFMNPSAF + TAFMNPTAF, CMY > CMN, where SAFMY and TAFMY and SAFMN and TAFMN are the usages of SAF and TAF when the major airlines adopt the AO and the NO strategies, respectively. The comprehensive revenue in these two cases is denoted CPMY and CPMN, respectively, while when the major airlines adopt the AO strategy, CPMY > CPMN because of the improved brand image, the government subsidies and the environmental benefits it brings (Zhang et al., 2022b). The carbon emissions are EMY and EMN, respectively. The government assigned cost-free carbon allowances for the major airlines representing QM, while the carbon emissions of the major airlines are EMY and EMN under different strategies (EMY < QM < EMN). In the emission trading system, carbon allowances are traded at price p. Therefore, the revenue from the sale of carbon allowances by the major airlines and the cost of purchasing carbon allowances are represented by PMO = p (QM − EMY) and PMI = p (EMN − QM), respectively. In addition, based on empirical observation, we assume that PMI > PMO.
Small and medium-sized airlines parameter setting: Similarly, the costs are CSY and CSN when the small and medium-sized airlines adopt the AO and NO strategies, respectively, where CSY = SAFSYPSAF + TAFSYPTAF, CSN = SAFSNPSAF + TAFSNPTAF, and CSY > CSN. The comprehensive revenue in these two cases is denoted CPSY and CPSN, respectively. When the small and medium-sized airlines adopt the AO strategy, CPSY > CPSN due to the improvement in brand image, the government subsidies and environmental benefits. The carbon emissions are ESY and ESN, respectively. The threshold for progressive taxation set by the government for the small and medium-sized airlines is ES, so ESY < ES < ESN(Oishi et al., 2012). The punitive carbon tax price when the threshold is exceeded is denoted by tN, and the regular carbon tax when the threshold is not exceeded is denoted by tY. Therefore, when the small and medium-sized airlines adopt the AO strategy, the carbon tax to be paid is tYESY, while the carbon tax to be paid when the NO strategy is adopted is tYES + tN (ESN − ES).
Government parameter setting: If the government adopts the AR strategy, the implementation of the emission trading system can yield carbon trading profits (trading fees, membership fees, etc.), θ is the trading factor (Fang et al., 2022), and θPMI and θPMO represent the government’s profit from the carbon trading of the major airlines. If the government adopts the NR strategy, it will not obtain benefits from carbon trading, and the major airlines does not need to engage in carbon trading. When both the major airlines and small and medium-sized airlines adopt the AO strategy, the government will receive additional benefits due to the significant governance effect, which is denoted UMSY. When the government adopts the AR strategy, its control is denoted by CS1, while the major airlines and small and medium-sized airlines will be constrained by the corresponding carbon emission reduction mechanism. The cost of the government when adopting the NR strategy is denoted by CS2, and CS2 < CS1 due to the reduction in human and material resources spent on the supervision of the major airlines and small and medium-sized airlines. The public opinion pressure (i.e., brand image) on the small and medium-sized airlines to adopt the NO strategy when the major airlines adopt the AO strategy is denoted by POMS, and the public opinion pressure on the major airlines to adopt the NO strategy when the small and medium-sized airlines adopt the AO strategy is denoted by POSM (Zhang et al., 2022a).
We used the “bottom-up” approach recommended by the International Civil Aviation Organization (ICAO) to calculate the emissions of small and medium-sized airlines and major airlines (ICAO, 2016). Fij is the amount of fuel (kg) consumed by a type i aircraft in phase j; j are five phases of aircraft operation, namely, takeoff, climb, approach, taxi (landing and takeoff (LTO) phase) and climb cruise descent (CCD) phase; Rij is the fuel consumption rate (kg⋅s-1) of one engine of a type i aircraft in phase j; Ni is the number of engines fitted to a type i aircraft; and Tij is the standard duration s) of a i aircraft in operation j. The ICAO gives the standard duration of each operational phase of the aircraft: Take-off, climb, approach and taxi times are 0.7 min, 2.2 min, 4 min and 26 min respectively (7 min for taxi-in and 19 min for taxi-out). Therefore, the equation for Fij is
The relevant parameters of the model used in this study are shown in Table 2.

TABLE 2. Description of parameters in the evolutionary game model.
The evolution of carbon emission abatement can be regarded as a dynamic game among the major airlines, small and medium-sized airlines, and the government. The strategies of the airlines are AO and NO and those of the government are AR and NR. Based on the above hypotheses and parameters, the strategy combinations for the three players are obtained as follows.
The payment matrix constructed is shown in Table 3.
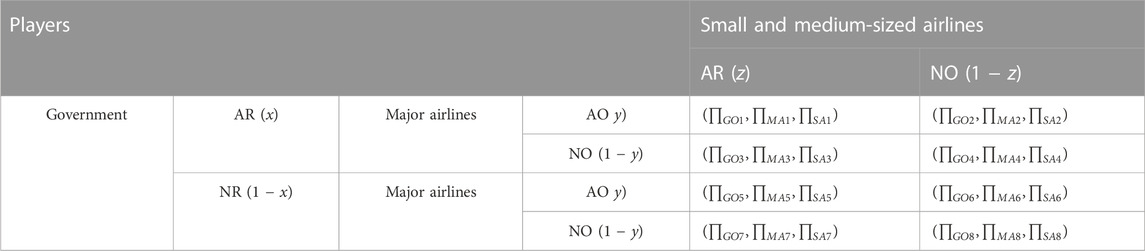
TABLE 3. The payoff matrix for three players.
Let U1 and U2 represent the expected benefit of the AR and NR strategies, respectively, for the government. According to Table 3, the government’s game strategy is as follows.
The average profit of the government is indicated as
The consequent replicated dynamics equation is as follows (Friedman, 1991).
According to the stability theorem for differential formulae (Jiang et al., 2019), F(x) must be greater than 0 when the value of x is less than x*. However, when x is greater than x*, F(x) is less than 0. Thus, to accomplish an ESS, F(x) = 0 and F′(x) < 0 are needed, as are F(y) and F(z). On the basis of this theory, the proposition is proposed as follow.
Proposition 1.
(1) When y = y* =
(2) When y ≠ y*, assuming that F(x) = 0, then x = 0 and x = 1 are two stable points of x.
Proof of Proposition 1.
The derivative of the replicated dynamics equation of x can be calculated as follows:
Subsequently, two cases can be treated independently using Eq. 5.
i) If
ii) If
① When y < y*,
② When y > y*,
Suppose that the expected benefit when the major airlines adopt the AO strategy is U3, the expected benefit when the major airlines adopt the NO strategy is U4, and the average expected benefit is
Thus, the replicated dynamics equation of y is:
Proposition 2.
① When
② When z ≠ z*, assuming that F(y) = 0, then y has two stable points at y = 0 and y = 1.
Proof of Proposition 2.
The derivative of F(y) is given as below:
Then, two cases can be treated independently using Eq. 10:
i) If
ii) If
① When z < z*,
② When z > z*,
Suppose that U5 and U6 are the benefits of the small and medium-sized airlines that select two strategies, i.e., the AO or NO strategy.
Therefore, the replicated dynamics equation of z is as follows:
Proposition 3.
① When
② When y ≠ y**, assuming that F(z) = 0, then z has two stable points at z = 0 and z = 1.
Proof of Proposition 3.
Similarly, the derivative of the replicated dynamics equation of z can be calculated as follows:
Then, two cases can be treated independently using to Eq. 15:
i) If
ii) If
① When y < y**,
② When y > y**,
The following steps were taken to simplify the calculation process:
Substituting Eq. 16 into Eqs 4 and 9, 14, we obtain:
The simplified system of replicated dynamic equations, as shown in Eq. 17. When they are equal to 0, i.e., F(x), F(y), and F(z) = 0, we can obtain eight equilibrium points of pure strategies: E1 (0, 0, 0), E2 (1, 0, 0), E3 (0, 1, 0), E4 (0, 0, 1), E5 (1, 1, 0), E6 (1, 0, 1), E7 (0, 1, 1), and E8 (1, 1, 1). Except for E1 to E8, there is also a hybrid-strategy equilibrium solution E9 (x°, y°, z°) that satisfies F (x°) = 0, F (y°) = 0 and F (z°) = 0.
After obtaining the equilibrium point of the model, it is essential to analyze their stability and conditions for their stabilization. Based on the obtained replicated dynamic equations, the Jacobian matrix was calculated as shown in Eq. 18. First, it is an ESS only if it is a pure strategy Nash equilibrium and a strict Nash equilibrium (Selten, 1988; Ritzberger and Weibull, 1995; Friedman, 1998), while E9, on the other hand, is a hybrid strategy equilibrium and therefore not be an ESS. Second, in this case, we can use the eigenvalue and the following criterion to determine if the equilibrium point is an ESS (Lyapunov, 1992): 1) When the real part of the three eigenvalues is negative, the equilibrium point is ESS; 2) When the real part of the three eigenvalues is positive, it is not ESS, i.e., the unstable point; 3) When the real part of one or two eigenvalues are positive, it is the saddle point.
Accordingly, by solving Eq. 18, Table 4, shows the eigenvalues of the Jacobian matrices associated with each equilibrium point. Based on the analysis of the sign of each eigenvalue, the four equilibria E1, E3, E4, and E7 must not be ESSs for the following reasons.
For an equilibrium point of E1, the sign of the eigenvalues of λ1 must be positive because a > 0. This point is not the ESS.
(2) For the three equilibrium points of E3, E4 and E7, the sign of λ1 is positive because a − b > 0, a − c > 0 and a − b − c > 0. These points are not the ESS.
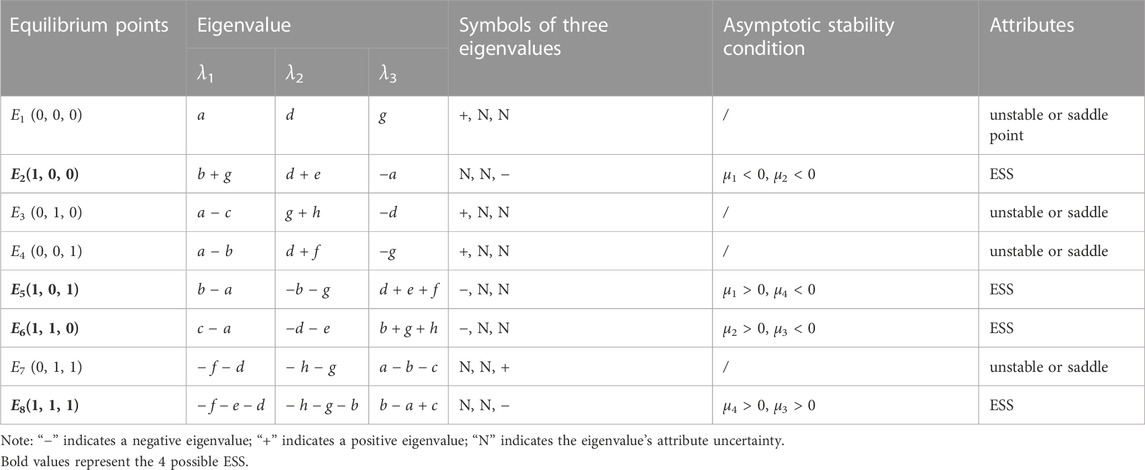
TABLE 4. Equilibrium point stability analysis.
Therefore, E2, E5, E6 and E8 have the potential to become the ESS. Suppose that:
It can be seen that μ3 > μ1 and μ4 > μ2. By analyzing the positives and negatives of the expressions, the asymptotic stability conditions are shown in Table 4.
In accordance with Section 5.1, the evolutionary game model is divided into the following four scenarios.
(1) Incubation: Given the conditions shown in Table 4; Eq. 19, the small and medium-sized airline’s net payoff when it chooses the AO strategy (i.e., CPSY − CSY − tYESY) is lower than its net payoff when it chooses the NO strategy (i.e., CPSN − CSN − tN (ESN − ES) − tYES). Moreover, the major airline’s net payoff when it chooses the AO strategy (i.e., CPMY + PMI − CMY) is lower than its net payoff when it chooses the NO strategy (i.e., CPMN − CMN − PMO). In this vein, the corresponding evolutionary strategy is (AR, NO, NO).
(2) Discovery: Given the conditions shown in Table 4; Eq. 19, for the small and medium airlines, the benefit of adopting the AO strategy (i.e., CPSY − CSY − tYESY) is greater than its benefit of adopting the NO strategy (i.e., CPSN − CSN − tN (ESN − ES) − tYES). Additionally, for the major airlines, the net payoff when adopting the AO strategy (CPMY + PMI − CMY) is smaller than its net payoff when choosing the NO strategy (i.e., CPMN − CMN − PMO − POSM). In this vein, the corresponding evolutionary strategy is (AR, NO, AO).
(3) Rapid development: Given the conditions shown in Table 4; Eq. 19, for the major airlines the benefit of adopting the AO strategy (i.e., CPMY + PMI − CMY) is greater than its benefit of adopting the NO strategy (i.e., CPMN − CMN − PMO). However, for the small and medium-sized airlines, the net payoff of choosing the AO strategy (i.e., CPSY − CSY − tYESY) is lower than its net payoff when it chooses the NO strategy (i.e., CPSN − CSN − tN (ESN − ES) − tYES − POMS). In this vein, the corresponding evolutionary strategy is (AR, AO, NO).
(4) Steady development: Given the conditions shown in Table 4; Eq. 19, for the small and medium-sized airlines, the net payoff of choosing the AO strategy (i.e., CPSY − CSY − tYESY) is greater than its net payoff when it chooses the NO strategy (i.e., CPSN − CSN − tN (ESN − ES) − tYES − POMS). However, for the major airlines, the net payoff when choosing the AO strategy (CPMY + PMI − CMY) is greater than its net payoff when choosing the NO strategy (i.e., CPMN − CMN − PMO − POSM). In this vein, the corresponding evolutionary strategy is (AR, AO, AO).
Table 5 shows four possible game scenario strategy choices.

TABLE 5. Strategy selection in game scenarios.
According to the above analysis, in this section, the stability of the mixed carbon tax and carbon trading is influenced by many parameters. We use numerical simulations to further investigate the evolution of the three players’ decisions.
In this paper, we conducted numerical simulations using MATLAB 2020a software. Numerical simulations can visualize the iterations of the players’ strategies, providing a quantitative analysis of the interactions. Thus, it is shown how their strategy evolves at each stage under different parameters. For the initial parameter setting of the model, we follow two principles: 1) refer to reality and 2) consider the logical relationship between the parameters. The following are the parameters for each scenario.
Airlines’ size was determined as follows: first, a list was made of all airlines in order of their historical carbon emissions, from largest to smallest. The top airlines were then identified as major airlines until the total carbon emissions of all major airlines accounted for half of the total airline carbon emissions (Zhang et al., 2017). Air China (CA) and Shanghai Airlines (FM) represent the major airlines and small and medium-sized airlines as case studies. Based on Air China and Shanghai Airlines’ flight schedules, fleet information, and flight execution rates for the summer/fall and winter/spring seasons, a “bottom-up” approach was used to calculate the airlines’ carbon emissions and fuel consumption for 2019. The calculated fuel consumption for CA and FM with the NO strategy (NO strategy using only TAF) is approximately 9 and 3 (×106 t), respectively. The ratios of SAFSY to TAFSY and SAFMY to TAFMY were both 6:4 when they adopted the AO strategy. Compared to TAF, SAF can reduce carbon emissions by up to 80% (Brueckner and Abreu, 2017). According to related studies, we set α and β as 3 (Hu R et al., 2020) and 1 (Moore et al., 2017; Heyne et al., 2021), respectively. In addition, PSAF is approximately three times more expensive than PTAF (Tanzil et al., 2021). Therefore, we can set PTAF and PSAF as 7 and 2, respectively.
Enterprises participating in carbon trading are required to pay entry fees, annual fees, etc., and the transaction fees for negotiated bargaining and pricing transfer transactions alone amount to 5% of the transaction value. In addition, the government can obtain more implicit benefits from an active financial market. Therefore, θ is set to 0.1(Fang et al., n. d.). The government tends to have lower inputs than firms using the AR strategy; thus, it can be assumed that the cost of the government using the AR strategy is lower than that of the major airlines and small and medium airlines using the AO strategy (Li et al., 2019). Therefore, we set parameter
In addition, some parameters were rounded to facilitate numerical simulation. Other parameter settings for different scenarios, based on actual conditions and recommendations from civil aviation practitioners, are shown in Table 6.
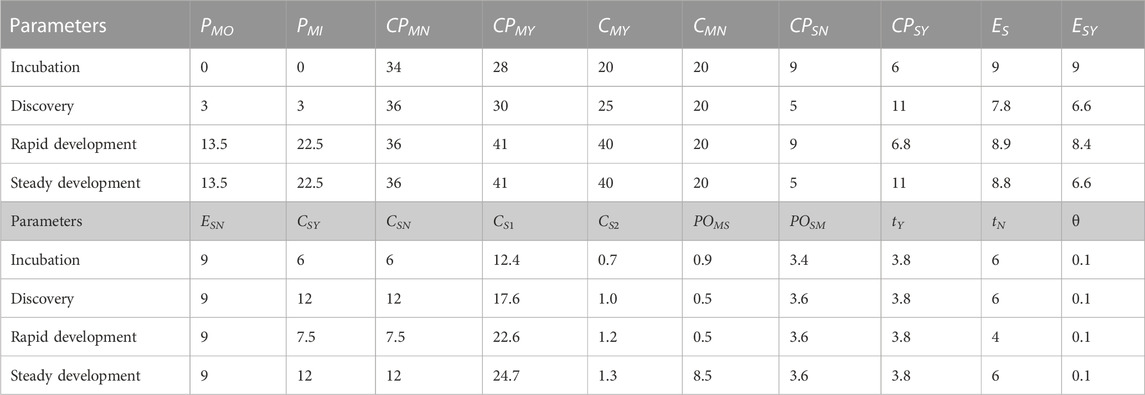
TABLE 6. Parameters for different scenarios.
Scenario analysis helps to explore the potential evolution of factors under different policy and economic scenarios on the differential impact of future carbon emission trends, and thus to quantify the path to achieve future carbon reduction targets. The following are the numerical simulations of the four scenarios of the evolutionary game.
Based on the stable conditions calculated above for the incubation scenario (i.e., μ1 < 0, μ2 < 0), the values corresponding to different parameters are simulated numerically. As shown in Figure 2A, with initial conditions of 0.2, 0.5 and 0.7, the possibility of the government adopting the AR strategy continuously increases, while the possibility of the major airlines and small and medium-sized airlines adopting the AO strategy continuously decreases. To verify that the equilibrium point E2 (1, 0, 0) in the evolutionary model is stable, using MATLAB 2020b software, the three players’ different initial strategies were simulated by looping through the generation of random x, y and z points. Figure 2B shows the decision-making trends in a tripartite evolutionary game with multiple colour lines, which eventually converge to E2 (1, 0, 0). Specifically, in this scenario, the government decides to initiate and induce the major airlines and small and medium-sized airlines to implement a carbon reduction strategy (i.e., the AO strategy) through a hybrid mechanism consisting of a carbon tax and carbon trading. However, the government allocates carbon allowances that are greater than or equal to the emissions of the major airlines using the NO strategy (Hu X et al., 2020), and the government sets a progressive tax threshold that is greater than the emissions of the small and medium-sized airlines using the NO strategy. Therefore, the government realizes that readjusting the carbon allowances and the progressive tax threshold is likely to achieve satisfactory results.
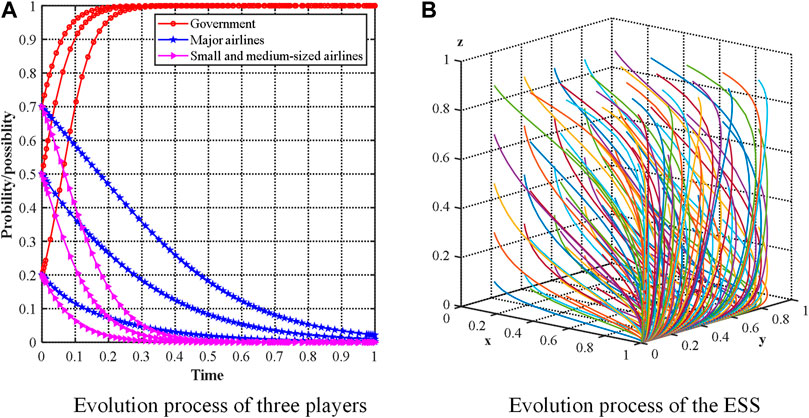
FIGURE 2. Evolutionary stable equilibrium in the incubation scenario. (A) Evolutionary paths of three participants in the incubation scenario under three initial conditions 0.2, 0.5 and 0.7. (B) ESS for the incubation scenarios.
Figure 3 shows the discovery scenario where each parameter corresponds to a stable condition involving μ1 > 0 and μ4 < 0. As shown in Figure 3A, with initial conditions of 0.2, 0.5 and 0.7, the possibility of the government adopting the AR strategy and the possibility of the small and medium-sized airlines choosing the AO strategy grow over time, while the possibility of the major airlines choosing the NO strategy continually decreases. MATLAB 2020b software generates random initial strategy points x, y and z to run numerical simulations. Figure 3B shows decision-making trends in a tripartite evolutionary game with multiple colour lines, which eventually converge to E5 (1, 0, 1). Specifically, in this scenario, the government recognizes the deficiencies in the incubation scenario and lowers the threshold of the progressive taxation system, thus prompting small and medium-sized airlines to choose the AO strategy. Although the carbon allowances allocated to the major airlines is increased, the major airlines still chooses to implement the NO strategy since its payoff with the AO strategy is still greater than that with the NO strategy (the reason may be due to the increased costs of the major airlines with less subsidy when using SAF), which echoes the findings of Santos and Delina (Santos and Delina, 2021) that driving carbon reductions requires strong multistakeholder partnerships between airlines and government.
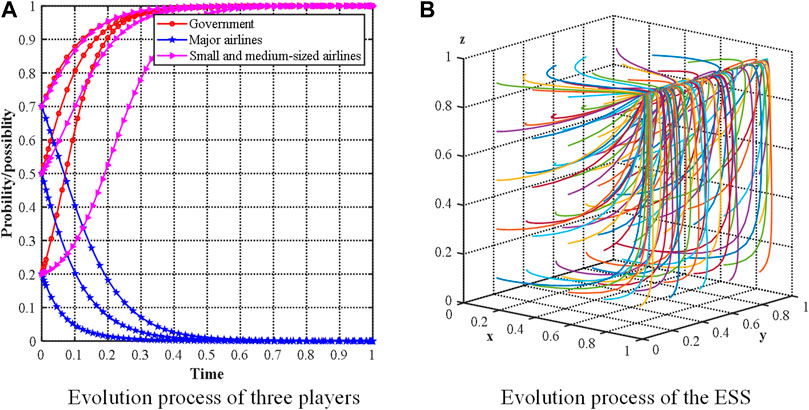
FIGURE 3. Evolutionary stable equilibrium in the discovery scenario. (A) Evolutionary paths of three participants in the discovery scenario under three initial conditions 0.2, 0.5 and 0.7. (B) ESS for the discovery scenarios.
As shown in Figure 4A, with initial conditions of 0.2, 0.5 and 0.7, the possibility of adopting the AR and NO strategies for the government and major airlines, respectively, increases with time. The evolutionary probability of the small and medium airlines, on the other hand, has a different trend. We simulated the evolutionary model using MATLAB 2020b by generating random initial strategy points x, y, and z. The lines of different colors in Figure 4B together show the evolution of the unfixed initial strategies of the three players. After several evolutions, these lines converge to the equilibrium point E6 (1, 1, 0). In this scenario, the government further reduces the carbon allowances allocated to the major airlines. To avoid purchasing additional carbon allowances, the major airlines uses a strategy that mixes SAF and TAF (i.e., the NO strategy) to reduce the carbon emissions it generates. However, the small and medium-sized airlines learned that the revenue from adopting the AO strategy could not cover the expenses of adopting the NO strategy. Therefore, the small and medium-sized airlines prefers to implement the NO strategy.
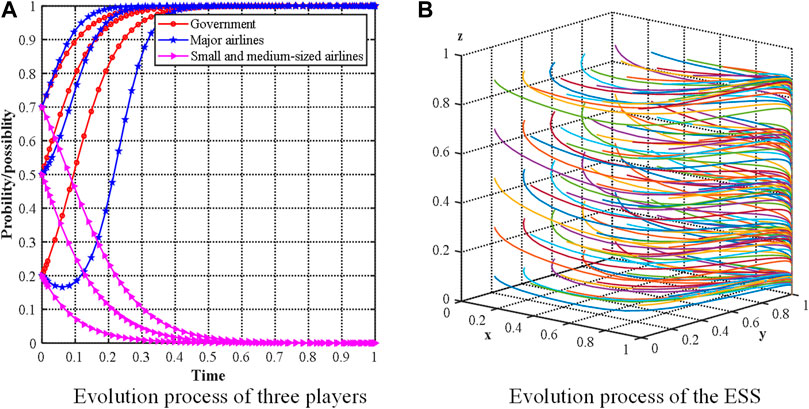
FIGURE 4. Evolutionary stable equilibrium in the rapid development scenario. (A) Evolutionary paths of three participants in the rapid development scenario under three initial conditions 0.2, 0.5 and 0.7. (B) ESS for the rapid development scenarios.
Based on the stable conditions calculated above for the steady development scenarios (i.e., μ4 > 0, μ3 > 0), the values corresponding to different parameters are simulated numerically. As shown in Figure 5A, with initial conditions of 0.2, 0.5 and 0.7, both the major airlines and small and medium-sized airlines are willing to adopt the AO strategy when the government adopts the AR strategy. Moreover, AO strategies tend to evolve faster when players have a greater initial willingness to adopt them. To verify that the equilibrium point E8 (1, 1, 1) in the evolutionary model is asymptotically stable, using MATLAB 2020b software, the three players’ different initial strategies were simulated by looping through the generation of random x, y and z points. Figure 5B shows the decision-making trends in a tripartite evolutionary game with multiple colour lines, which eventually converge to E2 (1, 1, 1). Specifically, in this scenario, the government realizes that reasonable coordination of carbon tax and carbon trading, building on their strengths and avoiding their weaknesses, will yield satisfactory results. Provided that the carbon tax and carbon trading without the AO strategy exceed the cost with the AO strategy (i.e., emission abatement cost, including PSAF), the major airlines and small and medium-sized airlines certainly prefer the AO strategy.
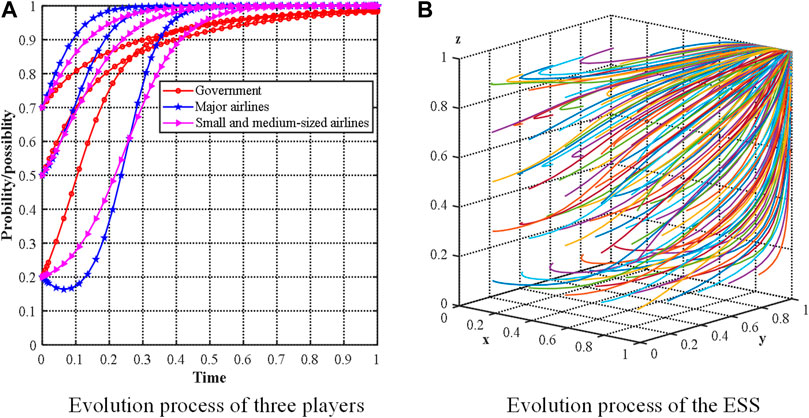
FIGURE 5. Evolutionary stable equilibrium in the steady development scenario. (A) Evolutionary paths of three participants in the steady development scenario under three initial conditions 0.2, 0.5 and 0.7. (B) ESS for the steady development scenarios.
Sensitivity analysis determines which parameters have a significant impact on the system and thus obtains the sensitivity of the system to changes in the parameters.
Assess the stability in the presence of regular carbon taxes, the parameter tY is set at 5.4, 4.6, 3.8, and 3. Figure 6A shows the evolutionary results. The MA and SA evolutionary paths tend to adopt the AO strategy when the regular carbon tax is relatively high, and both eventually reach a steady state. However, as the value of tY decreases, the GO tends to adopt the NR strategy, which provides some protection for itself to obtain economic benefits.
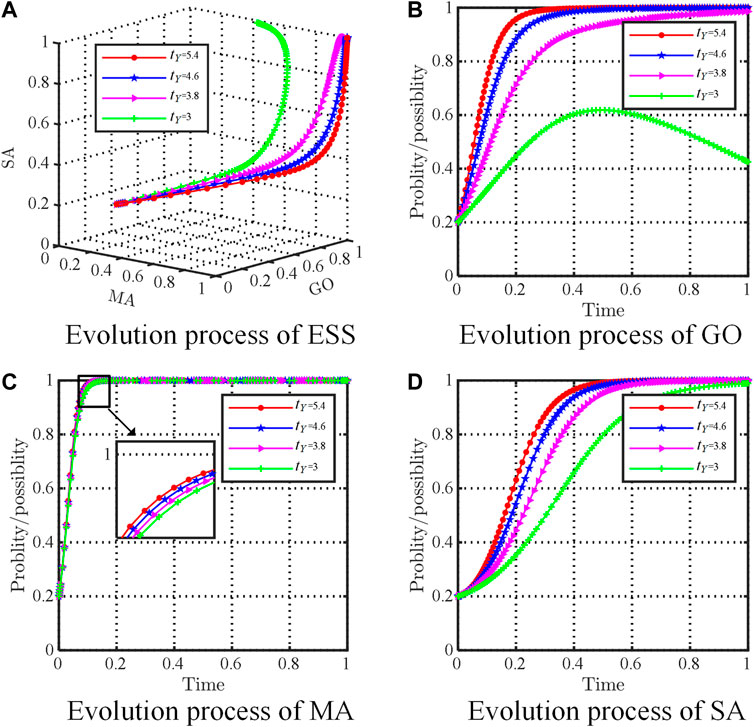
FIGURE 6. The impact of tY. (A) Evolution process of ESS. (B) Evolution of GO. (C) Evolution of MA. (D) Evolution of SA. (The GO denotes government, MA denotes major airlines, and SA denotes small and medium-sized airlines).
Figure 6B shows the effect of tY on the evolutionary path of the GO. When tY = 5.4, i.e., when the value of the punitive carbon tax is higher, the evolutionary time for the GO to reach asymptotic stability is shorter. When tY = 3.8, the GO reaches asymptotic stability for longer than tN = 5.4, which means that as the value of the regular carbon tax decreases, the evolution of the GO toward the AR strategy gradually slows. Put differently, the smaller the value of tY is, the more negative the GO is in regulating the airline’s carbon emissions. When tN = 3, the possibility of the GO adopting the AR strategy increases and then decreases, and it may even abandon the AR strategy. This is because when the GO attempts to reduce the regular carbon tax, the GO chooses the NR strategy to reduce the cost of regulation since the SA still chooses the OA strategy.
The evolutionary path of the MA’s abatement strategy is shown in Figure 6C. When the tY value gradually decreases, the time for the MA to evolve into the AO strategy gradually increases, but the speed of evolution does not change significantly. This is because, in addition to GO factors, public opinion also influences enterprises’ abatement behavior. For example, Zhang et al. found that public opinion drives firms’ low-carbon behavior (Zhang et al., 2013). Therefore, at the time of a gradual increase in the SA’s choice of the AO strategy, the MA relaxes its vigilance because public opinion is directed toward the SA while slightly increasing the evolutionary time for choosing the AO strategy.
Figure 6D illustrates the evolutionary process of the SA’s dynamic strategy. As the tY value decreases, the time for the SA to evolve into the AO strategy gradually increases. As the regular carbon tax decreases, the SA realizes that even if it does not reduce emissions, it will not incur excessive carbon tax costs and at the same time can avoid the high cost of SAF. Therefore, within a certain range, the higher the value of a regular carbon tax is, the greater the willingness of the SA to adopt the AO strategy.
When the threshold values of progressive taxation are taken as 9, 8.2, 7.4 and 6.6, the evolutionary path are shown in Figure 7A. When the threshold value is low, the GO tends to adopt the AR strategy and eventually tends to stabilize. As the ES value decreases in the evolutionary game process, the possibility of the SA adopting the AO strategy increases and finally reaches asymptotic stabilization (Figure 7A). This result indicates that the threshold value of progressive taxation has some influence on the SA’s strategy choice.
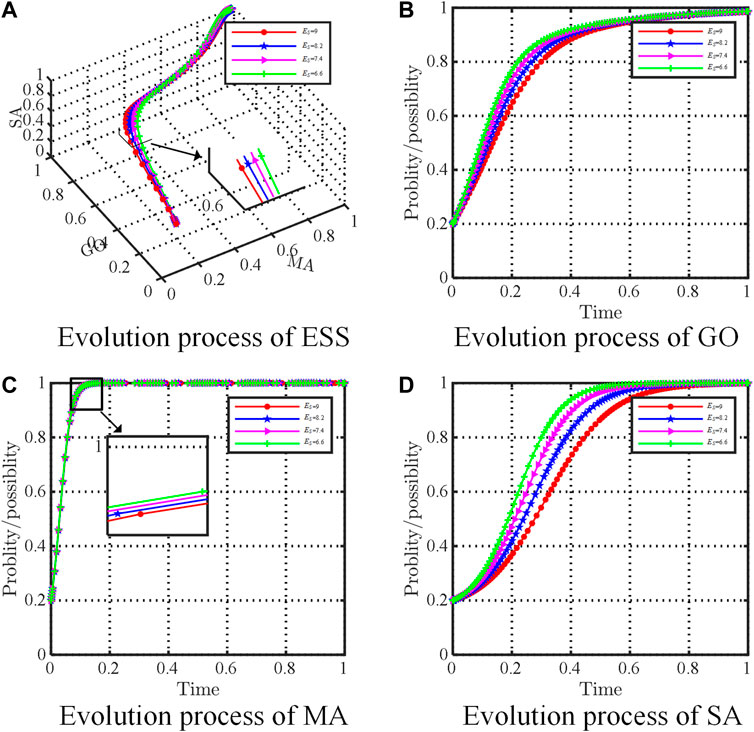
FIGURE 7. The impact of ES. (A) Evolution process of ESS. (B) Evolution of GO. (C) Evolution of MA. (D) Evolution of SA. (The GO denotes government, MA denotes major airlines, and SA denotes small and medium-sized airlines).
Figure 7C illustrate the evolutionary path of the MA’s strategy. The reduction in the threshold has almost no effect on the MA; however, it has a significant effect on the GO and SA (Figures 3B,D).
Figure 7B illustrate the evolutionary path of the GO’s strategy. As the threshold value of progressive taxation decreases, the GO has an increasing rate of evolution toward the AR strategy. The GO believes that a decrease in the ES value leads to an increase in the possibility of the SA adopting the NO strategy. The GO increases its rate of evolution toward the AR strategy to prevent the SA from adopting the NO strategy. Conversely, the threshold value should not be set too high; otherwise, it may increase policy resistance (Zhang X et al., 2019).
Figure 7D illustrate the SA’s strategy. When the threshold of progressive taxation is low, the SA converges more rapidly toward the AO strategy, but when the threshold of progressive tax is high, the SA converges more slowly toward the AO strategy. Therefore, the progressive tax has an obvious positive effect on the SA’s carbon reduction, but it should not be set too high or too low (Oishi et al., 2012).
To determine the influence of the carbon allowances on the evolutionary path of the system and its stability, the parameter QM is set at 30, 27, 24, and 22. The evolutionary paths are shown in Figure 8A. Under the influence of different carbon allowance values, the MA and SA tend to choose the AO strategy, which eventually tends to stabilize. Similarly, the GO’s strategy eventually tends toward the AR strategy. Clearly, carbon allowance values have a significant effect on the MA’s stable strategies.
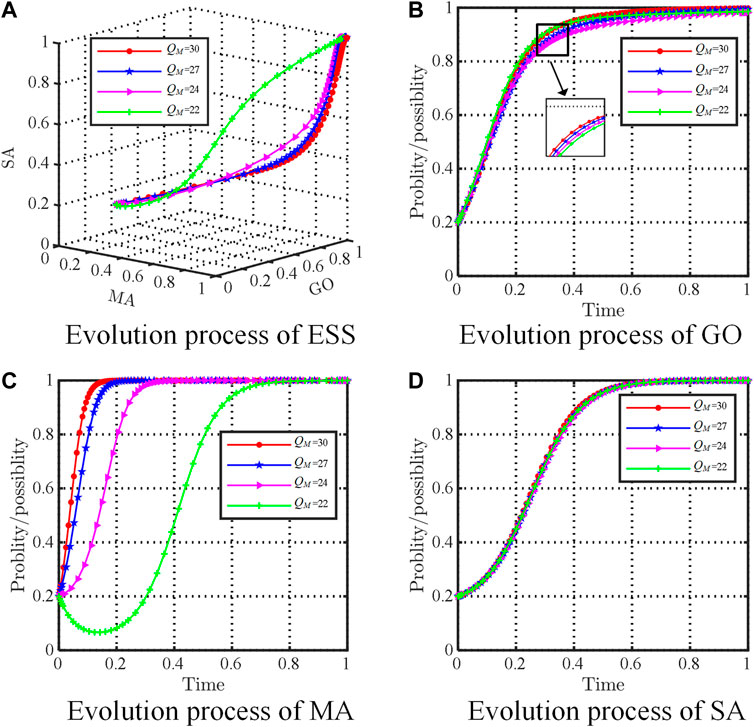
FIGURE 8. The impact of QM. (A) Evolution process of ESS. (B) Evolution of GO. (C) Evolution of MA. (D) Evolution of SA. (The GO denotes government, MA denotes major airlines, and SA denotes small and medium-sized airlines).
The evolutionary path of the GO’s strategy is demonstrated in Figure 8B. A change in carbon allowances has almost no effect on the GO. This is because the environmental cost, etc., from the MA not reducing emissions will have a considerable impact on the GO if it does not adopt the AR strategy. However, it has a significant effect on the MA (Figure 3C).
This is shown in Figure 8C, when QM = 22, i.e., when the value of the carbon quota allocated to the MA is low, and the MA takes longer to reach asymptotic stability and shows a tendency to choose the NO strategy at the beginning. However, due to aggressive GO regulation and high SAF costs, the MA must finally adopt the AO strategy to maximize its own benefits. As carbon allowances are increased, the time required for the MA to reach asymptotic stability decreases. An increase in carbon allowances yields more surplus carbon allowances for airlines actively reducing emissions, which improves the emission reduction revenue of this group of airlines (Fang et al., 2022).
In addition, Figure 8C illustrate the evolutionary path of the SA’s strategy. The evolutionary path of the SA is constantly inclined toward the AO strategy under the influence of the GO’s regulation and public opinion. However, since the SA is a small or medium-sized and not covered by the emission trading system, a change in carbon allowances hardly affects it.
We set p = 1, 2, 3, and 4.5, corresponding to the carbon trading price in the hybrid mechanisms system. The effect of p on the evolutionary paths of the three players is illustrated in Figure 9A. When the carbon trading price is relatively high, the evolutionary paths of the MA and SA tend toward the AO strategy, and both eventually reach stability. The GO tends toward the AR strategy and eventually reaches asymptotic stability.
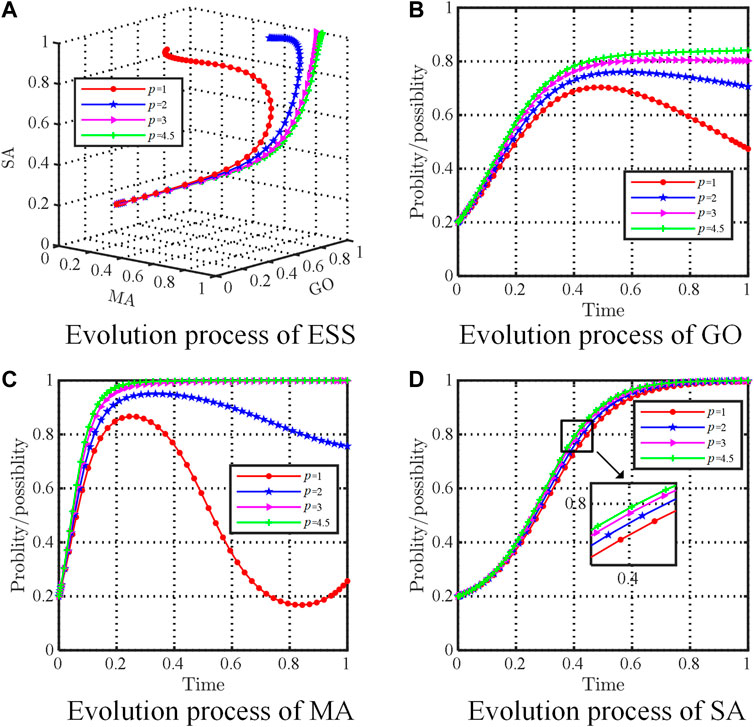
FIGURE 9. The impact of p. (A) Evolution process of ESS. (B) Evolution of GO. (C) Evolution of MA. (D) Evolution of SA. (The GO denotes government, MA denotes major airlines, and SA denotes small and medium-sized airlines).
Figure 9B illustrates the path of the GO’s dynamic strategy. When p = 4.5 and p = 3, that is, when the carbon trading price shows a medium or high value, the GO chooses to move toward the AR strategy. When p = 2, p = 1, that is, when the carbon trading price is low, the probability of the GO choosing the AR strategy increases and then decreases, and it may even abandon the AR strategy in favor of the NR strategy. The GO is the policy implementer, and the strength of its policy implementation is reflected in the carbon trading price. The GO sets an appropriate carbon trading price to help airlines reduce emissions (Xu et al., 2016).
Figure 9C illustrates the path of the MA’s dynamic strategy. When p = 4.5 and p = 3, the evolutionary path of the MA tends toward the AO strategy. When p = 3, the possibility of the MA choosing the AO strategy first increases and then decreases. When p further decreases to 1, the evolutionary path of the MA first tends toward the AO strategy and then tends toward the NO strategy, but finally, the MA does not choose the NO strategy. The lower carbon trading price reduces the MA’s willingness to have low-carbon operations, thus avoiding the purchase of high-priced SAF that leads to airline profit loss. The MA does not ultimately choose the NO strategy. A plausible reason is that passengers would like to pay additional fees for a green image (Hagmann et al., 2015), which leads to higher profits.
Figure 9D illustrates the path of the SA’s dynamic strategy. The effects of different levels of carbon trading prices on the SA’s evolutionary results are not significant. The change in the SA’s evolutionary path is mainly due to POMS (i.e., the public opinion pressure on the SA to adopt the NO strategy when the MA adopts the AO strategy).
The implementation of hybrid mechanisms is a multiparty coordination process involving multiple players. Essential to achieving carbon reductions in civil aviation is finding the right solutions to satisfy the benefits of each player. This means that the interests of many parties need to be reconciled in order to achieve carbon reduction targets. Moreover, airlines need to find the right way to minimize emissions in response to hybrid mechanisms to maximize profits.
However, to our knowledge, few studies have investigated the use of hybrid carbon reduction mechanisms in civil aviation. The government and airlines are explored in this paper using a tripartite evolutionary game under carbon tax and carbon trading constraints. In addition to discussing the conditions for airlines to adopt carbon reduction strategies under the hybrid mechanism constraint (including 4 scenarios, i.e., incubation, discovery, rapid development, and steady development), we also analyze the sensitivity of relevant parameters, for example, the regular carbon tax price, carbon allowances, carbon trading price and the threshold of progressive taxation. Based on the numerical simulation results, the government and airlines are only willing to adopt emission reduction strategies as long as their interests are maximized, which is consistent with previous studies. (Chen and Hu, 2018) (Dixit et al., 2022) (Zhang J.J et al., 2019) (Zhang and Zhang, 2022) (Zhao X et al., 2020). The difference is that we use different carbon reduction policies for different types of airlines.
The government should first have a better understanding of the cost and benefits of airline emissions reduction, which requires considerable research work such as obtaining statistics and conducting interviews. Then, based on the cost and benefit information obtained, it needs to determine which airlines should be included in the emission trading system and which airlines should only pay the carbon tax. Similar to Zhang and Zhang, (2022) in their study on air pollution reduction in steel enterprises, steel enterprises were divided into Large Iron manufacturers and small and medium-sized steel manufacturers. Similarly, Li and Gao, (2022) classified green technology innovation enterprises into two categories, A and B.
As analyzed in sections 5.2.1–5.2.4, hybrid policies serve as facilitators. In the incubation scenario, the hybrid policy is still in its infancy. In this case, the government should take a dominant position in the development of carbon reduction in civil aviation. From a carbon tax perspective, the setting of immature progressive taxation thresholds substantially hinders the small and medium-sized airlines’ carbon reduction behavior. From a carbon trading policy perspective, carbon allowances are not devised in a reasonable manner due to a lack of experience. This led to the major airlines making maximum profits without having to reduce emissions. In the discovery scenario and rapid development scenario, the government adjusts the relevant parameters in the mixed emission reduction policy to make the small and medium-sized airlines and major airlines adopt the AO strategy. Eventually, in the steady development scenario, the small and medium-sized airlines and major airlines adopt the AO strategy simultaneously under the premise that the government adopts the AR strategy.
This study uses an evolutionary game approach to solve the stakeholder decision making problem in carbon reduction. Evolutionary games assume that the participating agents are finitely rational. With the help of replicated dynamic equations, players constantly modify and improve their behavior during the evolutionary process and eventually make decisions. It has high efficiency in the study of policy decision making. Advanced optimization algorithms have been widely used to solve berth scheduling problem problems (Kavoosi et al., 2019a; Kavoosi et al., 2019b; Dulebenets, 2021), vehicle routing problems (Pasha et al., 2022; Rabbani et al., 2022) and other research. It greatly outperforms some well-known metaheuristic algorithms. Recently, some scholars have used optimization algorithms based on evolutionary game theory to solve the conflict and decision making problems among stakeholders (Wang et al., 2022). The advantage of advanced optimization algorithms over traditional evolutionary game models is that solutions can be designed for a real-world problem, leading to better results. For example, Xu et al. Designed a game-based fuzzy logic control genetic algorithm to study the carbon emission reduction problem under the carbon tax mechanism (Xu et al., 2018). In the future, advanced optimization algorithms can be designed for the carbon emission reduction problem of civil aviation under a hybrid mechanism.Implications
The policy and management recommendations are presented to facilitate the effective implementation of carbon reduction in civil aviation based on the findings of the study.
(1) Rationalize the carbon tax and carbon trading and construct a coordinated hybrid mechanism. Due to institutional design and other reasons, the application of the two carbon reduction mechanisms may bring about overlap in the scope of regulation and coordination problems in terms of the cost or burden of emission reduction. Accordingly, it is necessary to coordinate through reasonable policy design to avoid policy contradictions and conflicts and to synergize the regulatory role of hybrid mechanisms in carbon emission reduction.
(2) Coordinate different regulatory tools in terms of airline cost burden. Due to the uncertainty of the market price of carbon, there may be a large gap between this and the relatively transparent level of the carbon tax, which may lead to an inequitable burden between airlines subject to different mechanisms. To build a relatively fair environment for carbon abatement cost mechanisms, it is necessary to start with the design of the carbon trading and carbon tax mechanisms to achieve general consistency in terms of regulatory strength.
(3) In addition, the government must subsidize airlines that adopt the AO strategy when implementing the hybrid mechanism. In the study, it was found that part of the reason for airlines not to adopt the AO strategy could be the high price of SAF. Therefore, airlines that use SAF fuel should be subsidized to varying degrees depending on the amount of fuel used.
An evolutionary game model involving the government, major airlines, and small and medium-sized airlines is established in this study to address the carbon emission abatement problem in civil aviation. As a result, the following conclusions can be drawn.
(1) Although there are eight equilibrium points, only 4 have the potential to become the ESS. Depending on the conditions corresponding to the equilibrium point, four different scenarios can be classified. Each scenario represents a different stage of the government’s implementation policy: the incubation scenario shows the immature stage of the government in implementing the hybrid mechanism; the discovery and rapid development scenarios can be regarded as the groping stage of the government in implementing the hybrid mechanism; and the steady development scenario shows that the stable state of (1, 1, 1) can be achieved with the gradual and substantial improvement of relevant laws and provisions. If the carbon trading, which binds the major airlines, and the carbon tax, which binds the small and medium-sized airlines, are developed and mature and the carbon emissions of airlines are reasonably regulated, then the hybrid mechanism is efficient and feasible and the ideal way to address the carbon emission abatement problem in civil aviation in the long run.
(2) Several factors significantly influence the evolutionary trends of dynamic systems involving the three players. Carbon allowances and carbon trading prices have the most significant impact on the major airlines’ strategic choices. The government sets an appropriate carbon allowance and carbon trading prices to constrain the major airline’s carbon emission activities and further guide its behavioral strategies. The major airlines do not need to implement an AO strategy when the value of carbon allowances is too high; when it is too low, it will lead to increased pressure on the major airlines to reduce emissions. Similarly, the major airlines’ strategy choice is more sensitive to fluctuations in carbon trading prices.
(3) The small and medium-sized airlines’ strategic choice is significantly influenced by the carbon tax and threshold. The government sets an appropriate regular carbon tax and thresholds to constrain small and medium-sized airlines’ carbon emission activities and guide its behavioral strategies. Otherwise, insufficient or excessively high levels of the regular carbon tax and thresholds set by the government will be detrimental to the small and medium-sized airlines’ choice of the AO strategy. In addition, public opinion plays a role in promoting the adoption of the AO strategy by airlines.
Compared to a single mechanism, a hybrid mechanism can ensure the achievement of civil aviation emission reduction.
There are some limitations of this paper: 1) This study focused on mixed SAF fuel as the primary means for airlines to implement emission reduction strategies. Future research could combine methods such as optimizing fleet structure and aircraft green technology application, thus enhancing the emission reduction effect. 2) By considering more carbon emission management policies, such as SAF subsidies, government incentives and penalties, this study would have greater applicability. 3) To increase the feasibility of the model, the potential effect of uncertainty in some parameters is ignored. By considering more practical factors, more realistic conclusions can be drawn.
The original contributions presented in the study are included in the article/Supplementary Material, further inquiries can be directed to the corresponding author.
PZ: conceptualization, data curation, formal analysis, project administration, software, writing–original draft, and writing–review and editing. RD: data curation, formal analysis, methodology, supervision, validation, writing–original draft, and writing–review and editing. YW: funding acquisition, supervision, and writing–review and editing. QZ: Formal analysis, Validation, Writing–Review and Editing. LZ: Software, Writing–Review and Editing.
This work was supported by the National Natural Science Foundation of China (grant numbers U2033213, U1733127); the Fundamental Research Funds for center Universities of China (grant numbers J2022-049, J2023-040); the Science and Technology Innovation Fund for Graduate Students of Civil Aviation Flight Academy of China (X2023-24); and the Construction Plan of Scientific Research and Innovation Team for Civil Aviation Flight University of China (grant number JG2022-24).
The authors declare that the research was conducted in the absence of any commercial or financial relationships that could be construed as a potential conflict of interest.
All claims expressed in this article are solely those of the authors and do not necessarily represent those of their affiliated organizations, or those of the publisher, the editors and the reviewers. Any product that may be evaluated in this article, or claim that may be made by its manufacturer, is not guaranteed or endorsed by the publisher.
Bi, H., Xiao, H., and Sun, K. (2019). The impact of carbon market and carbon tax on green growth pathway in China: A dynamic cge model approach. Emerg. Mark. Finance Trade. 55 (6), 1312–1325. doi:10.1080/1540496X.2018.1505609
Brueckner, J. K., and Abreu, C. (2017). Airline fuel usage and carbon emissions: Determining factors. J. Air Transp. Manag. 62, 10–17. doi:10.1016/j.jairtraman.2017.01.004
Cao, J., Ho, M. S., Jorgenson, D. W., and Nielsen, C. P. (2019). China’s emissions trading system and an ETS-carbon tax hybrid. Energy Econ. 81, 741–753. doi:10.1016/j.eneco.2019.04.029
Chen, W., and Hu, Z. H. (2018). Using evolutionary game theory to study governments and manufacturers’ behavioral strategies under various carbon taxes and subsidies. J. Clean. Prod. 201, 123–141. doi:10.1016/j.jclepro.2018.08.007
Chiu, F. P., Kuo, H. I., Chen, C. C., and Hsu, C. S. (2015). The energy price equivalence of carbon taxes and emissions trading—theory and evidence. Appl. Energy. 160, 164–171. doi:10.1016/j.apenergy.2015.09.022
Chong, D., and Sun, N. (2020). Explore emission reduction strategy and evolutionary mechanism under central environmental protection inspection system for multi-agent based on evolutionary game theory. Comput. Commun. 156, 77–90. doi:10.1016/j.comcom.2020.02.086
Davis, S. J., Lewis, N. S., Shaner, M., Aggarwal, S., Arent, D., Azevedo, I. L., et al. (2018). Net-zero emissions energy systems. Science 360 (6396), eaas9793. doi:10.1126/science.aas9793
Dessens, O., Köhler, M. O., Rogers, H. L., Jones, R. L., and Pyle, J. A. (2014). Aviation and climate change. Transp. Policy. 34, 14–20. doi:10.1016/j.tranpol.2014.02.014
Dixit, A., Kumar, P., and Jakhar, S. K. (2022). Effectiveness of carbon tax and congestion cost in improving the airline industry greening level and welfare: A case of two competing airlines. J. Air Transp. Manag. 100, 102182. doi:10.1016/j.jairtraman.2022.102182
Dong, Y., Ishikawa, M., Liu, X., and Wang, C. (2010). An analysis of the driving forces of CO2 emissions embodied in Japan–China trade. Energy Policy 38 (11), 6784–6792. doi:10.1016/j.enpol.2010.06.050
Dulebenets, M. A. (2021). An Adaptive Polyploid Memetic Algorithm for scheduling trucks at a cross-docking terminal. Inf. Sci. 565, 390–421. doi:10.1016/j.ins.2021.02.039
Eissa, R., Eid, M. S., and Elbeltagi, E. (2021). Current applications of game theory in construction engineering and management research: A social network analysis approach. J. Constr. Eng. Manag. 147 (7), 04021066. doi:10.1061/(ASCE)CO.1943-7862.0002085
Fang, G., He, Y., and Tian, L. (2022). Evolutionary game analysis of government and enterprises carbon-reduction under the driven of carbon trading. Chin. J. Manag. Sci. 12, 1–12. doi:10.16381/j.cnki.issn1003-207x.2021.1401
Friedman, D. (1998). On economic applications of evolutionary game theory. J. Evol. Econ. 8 (1), 15–43. doi:10.1007/s001910050054
Fukui, H., and Miyoshi, C. (2017). The impact of aviation fuel tax on fuel consumption and carbon emissions: The case of the US airline industry. Transp. Res. Part Transp. Environ. 50, 234–253. doi:10.1016/j.trd.2016.10.015
Goulder, L. H., and Schein, A. R. (2013). Carbon taxes versus cap and trade: A critical review. Clim. Change Econ. 4 (03), 1350010. doi:10.1142/S2010007813500103
Hagmann, C., Semeijn, J., and Vellenga, D. B. (2015). Exploring the green image of airlines: Passenger perceptions and airline choice. J. Air Transp. Manag. 43, 37–45. doi:10.1016/j.jairtraman.2015.01.003
Heyne, J., Rauch, B., Le Clercq, P., and Colket, M. (2021). Sustainable aviation fuel prescreening tools and procedures. Fuel 290, 120004. doi:10.1016/j.fuel.2020.120004
Hofer, C., Dresner, M. E., and Windle, R. J. (2010). The environmental effects of airline carbon emissions taxation in the US. Transp. Res. Part Transp. Environ. 15 (1), 37–45. doi:10.1016/j.trd.2009.07.001
Hu, R., Zhu, J., Zhang, Y., Zhang, J., and Witlox, F. (2020). Spatial characteristics of aircraft CO2 emissions at different airports: Some evidence from China. Transp. Res. Part Transp. Environ. 85, 102435. doi:10.1016/j.trd.2020.102435
Hu, X., Yang, Z., Sun, J., and Zhang, Y. (2020). Carbon tax or cap-and-trade: Which is more viable for Chinese remanufacturing industry? J. Clean. Prod. 243, 118606. doi:10.1016/j.jclepro.2019.118606
Hu, Y. J., Yang, L., Cui, H., Wang, H., Li, C., and Tang, B. J. (2022). Strategies to mitigate carbon emissions for sustainable aviation: A critical review from a life-cycle perspective. Sustain. Prod. Consum. 33, 788–808. doi:10.1016/j.spc.2022.08.009
IATA (2022). IATA aviation energy forum. [WWW Document]. Available at: https://www.iata.org/en/events/iata-aviation-energy-forum/(Accessed 19 10, 22).
Icao, I. (2016). Environmental report 2013. Aviation and climate change. Montreal, Canada: International Civil Aviation Organization.
Ji, S. F., Zhao, D., and Luo, R. J. (2019). Evolutionary game analysis on local governments and manufacturers’ behavioral strategies: Impact of phasing out subsidies for new energy vehicles. Energy 189, 116064. doi:10.1016/j.energy.2019.116064
Jiang, B., Wang, X., Xue, H., Li, J., and Gong, Y. (2020). An evolutionary game model analysis on emission control areas in China. Mar. Policy. 118, 104010. doi:10.1016/j.marpol.2020.104010
Jiang, K., You, D., Merrill, R., and Li, Z. (2019). Implementation of a multi-agent environmental regulation strategy under Chinese fiscal decentralization: An evolutionary game theoretical approach. J. Clean. Prod. 214, 902–915. doi:10.1016/j.jclepro.2018.12.252
Jiang, S., Wei, X., Jia, J., and Ma, G. (2022). Toward sustaining the development of green residential buildings in China: A tripartite evolutionary game analysis. Build. Environ. 223, 109466. doi:10.1016/j.buildenv.2022.109466
Kavoosi, M., Dulebenets, M. A., Abioye, O. F., Pasha, J., Wang, H., and Chi, H. (2019b). An augmented self-adaptive parameter control in evolutionary computation: A case study for the berth scheduling problem. Eng. Inf. 42, 100972. doi:10.1016/j.aei.2019.100972
Kavoosi, M., Dulebenets, M. A., Abioye, O., Pasha, J., Theophilus, O., Wang, H., et al. (2019a). Berth scheduling at marine container terminals: A universal island-based metaheuristic approach. Marit. Bus. Rev. 5 (1), 30–66. doi:10.1108/MABR-08-2019-0032
Lehmann, P. (2012). Justifying a policy mix for pollution control: A review of economic literature. J. Econ. Surv. 26 (1), 71–97. doi:10.1111/j.1467-6419.2010.00628.x
Li, L., Xia, X. H., Chen, B., and Sun, L. (2018). Public participation in achieving sustainable development goals in China: Evidence from the practice of air pollution control. J. Clean. Prod. 201, 499–506. doi:10.1016/j.jclepro.2018.08.046
Li, M., and Gao, X. (2022). Implementation of enterprises’ green technology innovation under market-based environmental regulation: An evolutionary game approach. J. Environ. Manage. 308, 114570. doi:10.1016/j.jenvman.2022.114570
Li, S., Cai, J., Feng, Z., Xu, Y., and Cai, H. (2019). Government contracting with monopoly in infrastructure provision: Regulation or deregulation? Transp. Res. Part E Logist. Transp. Rev. 122, 506–523. doi:10.1016/j.tre.2019.01.002
Liu, X., Bao, Y., Zhang, Y., and Li, J. (2022). Decoupling analysis on China’s civil aviation carbon emissions from transportation revenue: A three-dimension decomposition framework. Sustain. Prod. Consum. 32, 718–730. doi:10.1016/j.spc.2022.05.023
Liu, X., Hang, Y., Wang, Q., and Zhou, D. (2020). Flying into the future: A scenario-based analysis of carbon emissions from China’s civil aviation. J. Air Transp. Manag. 85, 101793. doi:10.1016/j.jairtraman.2020.101793
Liu, X., Niu, D., Bao, C., Suk, S., and Shishime, T. (2012). A survey study of energy saving activities of industrial companies in Taicang, China. J. Clean. Prod. 26, 79–89. doi:10.1016/j.jclepro.2011.12.030
Lu, C. (2009). The implications of environmental costs on air passenger demand for different airline business models. J. Air Transp. Manag. 15, 158–165. doi:10.1016/j.jairtraman.2008.09.019
Lyapunov, A. M. (1992). The general problem of the stability of motion. Int. J. Control. 55, 531–534. doi:10.1080/00207179208934253
Mandell, S. (2008). Optimal mix of emissions taxes and cap-and-trade. J. Environ. Econ. Manag. 56 (2), 131–140. doi:10.1016/j.jeem.2007.12.004
Meng, L., Liu, K., He, J., Han, C., and Liu, P. (2022). Carbon emission reduction behavior strategies in the shipping industry under government regulation: A tripartite evolutionary game analysis. J. Clean. Prod. 378, 134556. doi:10.1016/j.jclepro.2022.134556
Moore, R. H., Thornhill, K. L., Weinzierl, B., Sauer, D., D’Ascoli, E., Kim, J., et al. (2017). Biofuel blending reduces particle emissions from aircraft engines at cruise conditions. Nature 543 (7645), 411–415. doi:10.1038/nature21420
Oishi, S., Schimmack, U., and Diener, E. (2012). Progressive taxation and the subjective well-being of nations. Psychol. Sci. 23 (1), 86–92. doi:10.1177/0956797611420882
Pasha, J., Nwodu, A. L., Fathollahi-Fard, A. M., Tian, G., Li, Z., Wang, H., et al. (2022). Exact and metaheuristic algorithms for the vehicle routing problem with a factory-in-a-box in multi-objective settings. Adv. Eng. Inf. 52, 101623. doi:10.1016/j.aei.2022.101623
Pizer, W. A. (2002). Combining price and quantity controls to mitigate global climate change. J. Public Econ. 85 (3), 409–434. doi:10.1016/S0047-2727(01)00118-9
Qiu, R., Xu, J., Xie, H., Zeng, Z., and Lv, C. (2020). Carbon tax incentive policy towards air passenger transport carbon emissions reduction. Transp. Res. Part Transp. Environ. 85, 102441. doi:10.1016/j.trd.2020.102441
Rabbani, M., Oladzad-Abbasabady, N., and Akbarian-Saravi, N. (2022). Ambulance routing in disaster response considering variable patient condition: NSGA-II and MOPSO algorithms. J. Ind. Manag. Optim. 18 (2), 1035–1062. doi:10.3934/jimo.2021007
Ritzberger, K., and Weibull, J. W. (1995). Evolutionary selection in normal-form games. Econometrica 63, 1371–1399. doi:10.2307/2171774
Santos, K., and Delina, L. (2021). Soaring sustainably: Promoting the uptake of sustainable aviation fuels during and post-pandemic. Energy Res. Soc. Sci. 77, 102074. doi:10.1016/j.erss.2021.102074
Selten, R. (1988). “A note on evolutionarily stable strategies in asymmetric animal conflicts,” in Models of strategic rationality (Dordrecht: Springer), 67–75. doi:10.1007/978-94-015-7774-8_3
Shao, Q., and Yuan, J. (2022). Study on the disposal strategy of civil aviation passenger collective events based on evolutionary game theory. Phys. Stat. Mech. Its Appl. 598, 127341. doi:10.1016/j.physa.2022.127341
Snyder, B. F. (2015). Tax and trade: A hybrid climate policy instrument to control carbon prices and emissions. Clim. Policy. 15 (6), 743–750. doi:10.1080/14693062.2014.965655
Stavins, R. N. (2008). “January. Cap-and-trade or a carbon tax,” in The environmental forum (Washington, D.C: Environmental Law Institute). Vol. 26, No. 5, p. 16.
Stavins, R. N. (2022). The relative merits of carbon pricing instruments: Taxes versus trading. Rev. Environ. Econ. Policy. 16 (1), 62–82. doi:10.1086/717773
Tanzil, A. H., Brandt, K., Wolcott, M., Zhang, X., and Garcia Perez, M. (2021). Strategic assessment of sustainable aviation fuel production technologies: Yield improvement and cost reduction opportunities. Biomass Bioenergy 145, 105942. doi:10.1016/j.biombioe.2020.105942
Torenbeek, E. (2013). Synthesis of Subsonic Airplane Design: An introduction to the preliminary design of subsonic general aviation and transport aircraft, with emphasis on layout, aerodynamic design, propulsion and performance. Berlin, Germany: Springer Science and Business Media.
Vollebergh, H. R. J., De Vries, J. L., and Koutstaal, P. R. (1997). Hybrid carbon incentive mechanisms and political acceptability. Environ. Resour. Econ. 9 (1), 43–63. doi:10.1023/A:1026451607522
Wang, G., Chao, Y., Cao, Y., Jiang, T., Han, W., and Chen, Z. (2022). A comprehensive review of research works based on evolutionary game theory for sustainable energy development. Energy Rep. 8, 114–136. doi:10.1016/j.egyr.2021.11.231
Wang, Y., Wang, D., and Shi, X. (2021). Exploring the dilemma of overcapacity governance in China’s coal industry: A tripartite evolutionary game model. Resour. Policy. 71, 102000. doi:10.1016/j.resourpol.2021.102000
Weitzman, M. L. (1974). Prices vs. Quantities. Rev. Econ. Stud. 41 (4), 477–491. doi:10.2307/2296698
Xu, J., Qiu, R., and Lv, C. (2016). Carbon emission allowance allocation with cap and trade mechanism in air passenger transport. J. Clean. Prod. 131, 308–320. doi:10.1016/j.jclepro.2016.05.029
Xu, J., Qiu, R., Tao, Z., and Xie, H. (2018). Tripartite equilibrium strategy for a carbon tax setting problem in air passenger transport. Environ. Sci. Pollut. Res. 25, 8512–8531. doi:10.1007/s11356-017-1163-z
Zhang, B., He, M., and Pan, H. (2017). A study on the design of a hybrid policy for carbon abatement. Popul. Resour. Environ. 15 (1), 50–57. doi:10.1080/10042857.2016.1258804
Zhang, C., and Zhang, X. (2022). Evolutionary game analysis of air pollution co-investment in emission reductions by steel enterprises under carbon quota trading mechanism. J. Environ. Manage. 317, 115376. doi:10.1016/j.jenvman.2022.115376
Zhang, J. J., Ding, L. L., and Sun, L. L. (2019). Research on enterprise carbon emission decision considering the substitution effect of stepped carbon tax and carbon trading. China Popul. Resour. Environ. 29, 41–48.
Zhang, S., Wang, C., and Yu, C. (2019). The evolutionary game analysis and simulation with system dynamics of manufacturer’s emissions abatement behavior under cap-and-trade regulation. Appl. Math. Comput. 355, 343–355. doi:10.1016/j.amc.2019.02.080
Zhang, X., Chen, X., and Wang, J. (2019). A number-based inventory of size-resolved black carbon particle emissions by global civil aviation. Nat. Commun. 10 (1), 534. doi:10.1038/s41467-019-08491-9
Zhang, Y., Zhou, W., and Liu, M. (2022b). Driving factors of enterprise energy-saving and emission reduction behaviors. Energy 256, 124685. doi:10.1016/j.energy.2022.124685
Zhang, Y., Qi, L., Lin, X., Pan, H., and Sharp, B. (2022a). Synergistic effect of carbon ets and carbon tax under China’s peak emission target: A dynamic cge analysis. Sci. Total Environ. 825, 154076. doi:10.1016/j.scitotenv.2022.154076
Zhang, Z., Jin, X., Yang, Q., and Zhang, Y. (2013). An empirical study on the institutional factors of energy conservation and emissions reduction: Evidence from listed companies in China. Energy Policy 57, 36–42. doi:10.1016/j.enpol.2012.07.011
Zhao, L., Yang, C., Su, B., and Zeng, S. (2020). Research on a single policy or policy mix in carbon emissions reduction. J. Clean. Prod. 267, 122030. doi:10.1016/j.jclepro.2020.122030
Keywords: carbon emission reduction, civil aviation, hybrid mechanisms, tripartite evolutionary game, scenario analysis
Citation: Zhang P, Ding R, Wang Y, Zhang Q and Zhao L (2023) Emission reduction with hybrid mechanisms in civil aviation: An evolutionary game approach. Front. Environ. Sci. 11:1138931. doi: 10.3389/fenvs.2023.1138931
Received: 06 January 2023; Accepted: 15 March 2023;
Published: 05 May 2023.
Edited by:
Haiyue Liu, Sichuan University, ChinaReviewed by:
Maxim A. Dulebenets, Florida Agricultural and Mechanical University, United StatesCopyright © 2023 Zhang, Ding, Wang, Zhang and Zhao. This is an open-access article distributed under the terms of the Creative Commons Attribution License (CC BY). The use, distribution or reproduction in other forums is permitted, provided the original author(s) and the copyright owner(s) are credited and that the original publication in this journal is cited, in accordance with accepted academic practice. No use, distribution or reproduction is permitted which does not comply with these terms.
*Correspondence: Yu Wang, d2FuZ3l1QGNhZnVjLmVkdS5jbg==
Disclaimer: All claims expressed in this article are solely those of the authors and do not necessarily represent those of their affiliated organizations, or those of the publisher, the editors and the reviewers. Any product that may be evaluated in this article or claim that may be made by its manufacturer is not guaranteed or endorsed by the publisher.
Research integrity at Frontiers
Learn more about the work of our research integrity team to safeguard the quality of each article we publish.