 Zehua Pang
 Xianchao Zhao
 Chengxiang Wang
94% of researchers rate our articles as excellent or good
Learn more about the work of our research integrity team to safeguard the quality of each article we publish.
Find out more
ORIGINAL RESEARCH article
Front. Environ. Sci., 04 April 2023
Sec. Environmental Economics and Management
Volume 11 - 2023 | https://doi.org/10.3389/fenvs.2023.1138213
In the context of China’s New Urbanization Strategy, a growing number of cities are beginning to experience significant changes in their intra-city structure and size distribution, but systematic research is still lacking. This paper investigated the intra city-size distribution of 214 cities in China’s Yangtze River Delta Region (YRDR) from 1990 to 2020. The study used the Pareto index to portray the equalization differences in intra city-size distribution, and investigated the heterogeneity of its influencing factors using multiscale geographically weighted regression (MGWR). The results showed that most of the cities in the YRDR had a city-size distribution consistent with a Pareto distribution but still tended to be polarized. Among them, the better-developed large cities and regions were more consistent with the Zipf distribution, as were the county-level cities and prefecture-level cities. In terms of spatio-temporal distribution, the intra city-size distribution showed a spatial agglomeration pattern of “polarization in the west and equalization in the east” and the scope and intensity of cold and hot spots reduced. Regarding driving factors, land, industry, and population were essential influences on the intra city-size distribution. Of these, the natural environment and location were important global influencing factors, and economic and social factors only had a more significant influence in 1990 and 2020. The impact of industry restructuring gradually increased, and the population was a significant influence only in the early years. By exploring the intra city-size distribution, this paper provides a scientific basis for the optimization of town structure and policy formulation in small and medium-sized cities, and some new concerns have been proposed.
Since the industrial revolution and rapid urbanization, the world’s cities have expanded rapidly and become more concentrated (Fang and Yu, 2017). In this context, complex polycentric urban structures and dynamic urban economic networks are formed within large cities (Liu X. J. et al., 2018), and their urban systems tend to be idealized and regularized. In recent years, it cannot ignore that many small and medium-sized cities have multiplied and played an essential role in helping to modernize and narrow the gap between urban-rural areas, especially in developing countries (Fahmi et al., 2014). Not only have these cities evolved as part of a larger urban system, but they have also evolved internally into a complex and diverse urban system from the monotony. However, under the constraints of both high-ranking cities and their development capacity, small and medium-sized cities are experiencing a polarization of urban expansion and shrinkage. A part of the towns, mainly in the central city, steadily expands, while another part of the towns turns to contraction or stagnation (Robertson, 1999; Batty, 2016); thus leading to an over-polarized or over-balanced urban system. Therefore, it is more critical to conduct microscopic intra city-size distribution studies, which are important for promoting high-quality and coordinated urban development and common prosperity.
City-size distribution is an important feature for portraying the structure of urban system. Since Auerbach (1913) discovered certain patterns in the distribution of the urban population and its order, a large number of scholars have found that city-size distribution in most countries conformed to one of Pareto’s distribution, or Zipf’s distribution (Zipf, 1949; Fluschnik et al., 2016; Shi et al., 2016; Chauvin et al., 2017). In other words, the structure of urban system in most countries or regions is stable and possesses regularity, which forms the consensus in the urban geography community. However, fewer studies address the small-scale city-size distribution, and most of them have been limited to one city (Takasaka, 1978; Zhang, T. L. et al., 2019). Actually, scholars have already found structural similarities in city-size distribution between small cities and urban agglomerations (Giesen and Sudekum, 2011), but systematic studies of regularity are still lacking. In any case, their findings provided a basis for further exploring the polarization or equalization patterns of intra city-size distribution for large samples.
Since the reform and opening-up in 1978, the center of gravity of China’s urbanization has gradually shifted downward from large cities, and the role of small and medium-sized cities has become increasingly prominent in the national strategy (Liu, Y. S. and Yang, 2012). In December 2012, China’s Central Economic Work Conference first proposed the New Urbanization Strategy, pointing out that the principles of ecology and civilization should be fully integrated into the whole urbanization process. In May 2022, China’s General Office of the Central Committee of the Communist Party and the General Office of the State Council issued the Opinions on Promoting Urbanization with Counties as Important Carriers, which again emphasizes the importance of small cities in the context of the New Urbanization Strategy. Nowadays, China’s large cities tend to stabilize, while distinctive small and medium-sized cities are in a period of profound urban transformation and reconstruction, and their urban-rural dichotomy is also obvious (Fang, 2022). At the same time, their city-size distribution is more complex and unstable, and the geographical differences are equally significant (Liu, Z. et al., 2018). It can be said that the intra city-size distribution is a research topic with Chinese characteristics under the current urbanization process, which can systematically explain the structural patterns of urban systems in cities of different grades.
The Yangtze River Delta Region (YRDR) has the highest level of urbanization in China (COSC, 2012). Whether it is Shanghai, Nanjing, or other cities, many small towns with good development levels within them support our overall study of intra-city structure in the YRDR. Meanwhile, it also has some relatively poor cities. In this paper, we argue that the study of YRDR contributes to a comprehensive two-track comparative study between cities from temporal and spatial perspectives. It can help draw heterogeneous conclusions and general laws of intra city-size distribution, and provide a reference for future urbanization paths in other regions of China.
On this basis, this paper attempts to analyze the evolution of intra city-size distribution and the influencing factors based on the theory of the human-land relationship, taking each of the 214 cities in the YRDR as the research objects. This paper aims to study the following issues: 1) The size distribution pattern within each city in the YRDR. 2) The differences in the evolution of the spatio-temporal patterns of different cities. And 3) The factors influencing the intra city-size distribution. To the best of our knowledge, the analysis of the size distribution within independent cities is the latest theoretical contribution of this study and the generalizability of Pareto’s law can be extended. At the same time, the lack of research on the evolutionary laws of urban systems in small and medium-sized cities has been compensated. Another contribution is the incorporation of human-land system theory into the study of city-size distribution, which can avoid the omission of influencing factors and consider non-economic elements. The remaining structure of the paper is as follows. The second part is a literature review. The third part presents the study area, data sources, and methodology. The fourth part presents the results of the empirical analysis. The fifth and sixth parts are the discussion and conclusions.
Scholars have first focused on the city-size distribution from the national perspective. Auerbach (1913) found that the product of urban population and rank order was a constant in European countries and the United States, which inaugurated the study of city-size distribution. Subsequently, Zipf (1949) further found that the distribution of U.S. city sizes obeyed a Pareto distribution with an exponent of 1 and defined this particular distribution as Zipf’s law. However, with the expansion of the study subjects, some scholars have found that not all urban assemblages conform to the law. A double Pareto-lognormal distribution, for example, was more appropriate in some countries (Reed and Jorgensen, 2004; Giesen et al., 2010). In addition, it should note that the threshold value of the city is also an essential factor affecting the fitting level (Cheshire, 1999; Li and Sui, 2013). The above studies show that although the level of city-size distribution varied from region to region, there is still an overall regularity.
Many important methods have been suggested and developed in the depth of research on the city-size distribution. In 1939, Jefferson (1939) first used the primacy index, which measured the degree of dominance of the top cities in a region (Das and Dutt, 1993). Another important approach is the fractal theory, which was proposed by Mandelbrot (1967) and first used to measure the complexity of shoreline geometry. In urban studies, the fractal dimension has been applied to quantitatively analyze the fractal characteristics of the urban system and the structure of the land price (Man and Chen, 2020; Liu, X. Y. and Xin, 2022). In addition, the spatial Gini coefficient, Markov chain, and rank clock (Grachev, 2022; Huang, Q. X. et al., 2015) have been widely adopted to characterize the degree of change in city-size distribution. Overall, studies have most widely applied the rank-size rule to assess the equalization or polarization of city-size distribution, due to its simplicity and generalizability.
Research indicators for the city-size distribution have been advanced. Initial studies have used population to measure city size (Auerbach, 1913; Zipf, 1949) because it is the most accessible and intuitive data. Further studies recently have also demonstrated the reliability of the population and its derived indicators (Rastvortseva and Manaeva, 2020). Land use data is another critical proxy for the city-size distribution (Fluschnik et al., 2016; Shi et al., 2016). As research progresses, especially with the development of satellite technology, remote sensing data, nighttime lighting data, and mobile phone signaling data were being widely used (Huang, Q. X. et al., 2015; Gao et al., 2017; Gariazzo and Pelliccioni, 2019), and they were considered to be more accurate and real-time. Finally, there were also studies exploring through indicators such as passenger flow (Liu, P. X. et al., 2021), land price (Liu, X. Y. and Xin, 2022), and functional city size (Guo et al., 2020). They enrich the research perspective on city-size distribution and can also demonstrate that there are specific patterns in various urban economic representations.
For some countries and regions with larger areas, the scope and scale of city-size distribution studies have been expanded, especially in China. Some scholars have explored urban assemblages on non-national scales, such as provinces (Jing et al., 2021) and metropolitan areas and economic zones (Gao et al., 2017; Li, J. G. et al., 2022), and found that the city-size distribution in these regions also fits well. Giesen and Sudekum (2011) also found that the significant hierarchy of Zipf’s law applies to both the national and individual regional city-size distribution in Germany. Furthermore, the applicability of the city-size distribution was further extended to rural areas (Sonis and Grossman, 1984) (Huang, W. Z. and Shi, 2021). However, only a few studies have focused on small cities, and usually only 1 city (Takasaka, 1978; Zhang, T. L. et al., 2019). Although some studies have evaluated the urban structure within large samples of prefecture-level cities in China (Li, W. et al., 2022), analysis of small cities (county-level cities) is also absent. There is no doubt that the development of urban systems in small cities is diverse and also conforms to Pareto’s law or Zipf’s law, which provides a basis for further research.
The factors of city-size distribution are generally divided into two categories: natural environment and socioeconomic context. Among them, natural environmental elements, such as topography, impact the city-size distribution of the country (Wang et al., 2021). Whereas, the socioeconomic context includes but is not limited to GDP, population size, industrial structure, degree of globalization, infrastructure, and top-down state regulation, whose influence is also quite heterogeneous worldwide. (Soo, 2005; Zhou et al., 2013; Sun et al., 2019). However, there are still relatively few studies on the factors influencing the intra city-size distribution. Small cities are more closely connected to rural areas, and the influence factors of urban-rural integration should be fully considered in the study of intra-cities.
Overall, the main shortcoming of the established studies is the lack of pattern exploration for the whole sample of cities. Some studies focused on the evolution of overall city-size distribution in a particular country (or metropolitan area), while others were only in a given small city or a village area. However, it is the majority of cities above the rural areas and below the megacities with carrying capacity that is more general and widespread. Therefore, what is most urgently needed is a study of a full sample of cities as a way to highlight the missing link. The possible reason for the absence of studies is that most developing countries lack proper samples or supporting statistics, which the recent common use of remote sensing data or big data can compensate for. When satellite data are used properly, the comparability of regions across periods then arises. Additionally, the selection of impact indicators is not comprehensive, with too much emphasis on the economic dimension and neglecting the role of human subjects. Undoubtedly, it is urgent to study a large sample of independent cities in a typical region and thus derive the evolutionary patterns, general paradigms, and driving mechanisms of city-size distribution.
The YRDR is one of China’s most vigorous, open, and innovative regions, including Shanghai City, Jiangsu Province, Zhejiang Province, and Anhui Province, with a total of 41 prefecture-level cities (Figure 1). In 2020, 235 million people lived in the YRDR, accounting for about 16.66% of the national population and generating nearly 1/4 of the GDP with less than 4% of the national territory (COSC, 2012; CNBS, 2022a). In addition, the urbanization rate of the resident population in the YRDR exceeded 70% in 2020 (COSC, 2012), making it a leader in the urbanization process in China. In the YRDR, in addition to the more developed megacities, such as Shanghai, Nanjing, and Hangzhou, the economies of smaller cities and counties are also more prominent. According to the report “2022 China’s Top 100 County Economies Study,” the top 100 counties in the YRDR accounted for 46 seats. Meanwhile, there were 20 national poor counties (mainly in Anhui Province) in the YRDR, and regional development disparities still persisted.

FIGURE 1. The study area.
First of all, this paper redefined the scope of the cities because the division of administrative units in China does not fit our study. In China, districts, counties, and county-level cities are at the same administrative level, and they are all under the jurisdiction of prefecture-level cities in the broad sense. Metropolitan areas consisting of several districts are seen as prefecture-level cities in a narrow sense. Therefore, prefecture-level cities, county-level cities, and counties are all considered independent studies. However, some districts have been renamed from counties (or county-level cities) in recent years, and we still study them as separate cities, which leads to “district” in our result categories. Our city identification was flexible and practical. For example, Keqiao District of Shaoxing City was changed from Shaoxing County of Shaoxing City in 2013, but the fact that the area had long been integrated into the central city of Shaoxing cannot be ignored, and therefore Keqiao District cannot be studied independently. The Tongshan District of Xuzhou City was similar. Ultimately, our study included 214 city units and economic-geographic subdivisions were made for each province.
A Prolonged Artificial Nighttime Light Dataset of China (1984–2020) (Zhang, L. X. et al., 2021) from the National Tibetan Plateau Data Center (TPDC) was used to represent the urban scale. The Global 30 m Impervious Surface Dynamic Dataset (GISD30) from 1985 to 2020 (Liu, L. Y. et al., 2021) was used to define the urban areas. The years used in the data are 1990, 2000, 2010, and 2020.
The level of development varies from region to region, so the definition and threshold setting of towns are the key considerations of the study. Referring to China’s 1984 Report on Adjusting the Criteria for Establishing Towns and the newly revised criteria for the establishment of designated towns in Jiangsu, Anhui, and Zhejiang in 2020, the threshold value for towns was set to 0.2 km2, taking into account the actual development of the YRDR. This criterion included as many towns as possible in the study, especially early period (e.g., 1990), but not so much as to include too many rural settlements. In addition, the threshold was referenced to relevant studies to ensure a better fit level (Cheshire, 1999; Li and Sui, 2013). It is important to note that all town patches divided by rivers were manually merged to eliminate any erroneous effects on the study results.
Population data in 1990, 2000, and 2010 were from the Tabulation on the Population Census of China (COSC (Census Office of State Council), 2012). GDP, industrial value added, number of hospital beds, and food production were from the China City Statistical Yearbook and the China County Statistical Yearbook (CNBS, 2022a; CNBS, 2022b), with some missing data in 1990 filled in by the statistical yearbook of each city. City area was from the MCA (2022). These social statistics data were mainly used for the expression of impact factors.
The administrative boundary data and the government site data were obtained from the 1: 1 million Public Version of Basic Geographic Information Data in the NCSGI (2021). Average slope data were obtained from the Srtmslope 90 m in the GDC (2022). National road network data in 2000, 2010, and 2020 were obtained from the 2000 National Major Road Data Set in the GDSIPU (2020), the Global Roads Open Access Data Set (gROADS) in NASA’s Socioeconomic Data and Applications Center (CIESIN and ITOS, 2013), and the AODC (2022). These geographic information data were mainly used to support vector and raster GIS analysis.
For a long time, studies of city-size distribution have generally adopted the method of the rank-size rule, which captures the relationship between size and ranking (Zipf, 1949; Gabaix, 1999; Zhou et al., 2013). In most studies, this distribution pattern is mainly portrayed by population or land use, and a Pareto index that can measure the global city-size distribution is derived (Fluschnik et al., 2016; Shi et al., 2016; Rastvortseva and Manaeva, 2020). However, these not necessarily accurate statistics may lack comparability in time series, which in turn leads to distorted conclusions. In this paper, we use nighttime lighting data, which has emerged in recent years (Huang, Q. X. et al., 2015; Gao et al., 2017), to measure the intra city-size distribution. In the Chinese urban administrative system, each prefecture-level city consists of a main urban area (metropolitan area) and several distant counties or county-level cities (small cities), among which they have several small towns. In this paper, each city in the YRDR (any size) is treated as an independent object of study, for a total of 214 cities, all of which possess a unique Pareto index. In addition, this paper considers that some of the early towns have a value of 0 for nighttime lights, so cities with a total number of towns with lights less than 5 are excluded, i.e., no fitting calculation is performed. The formula is as follows:
Where Pni is the nighttime light DN value of the ith town of the nth city; kn is the nighttime light DN value of the first town of the nth city; Rni is the ranking of Pni; and qn is the Pareto index of the nth city. Usually the above equation is logarithmically transformed. The changed formula is as follows:
If qn is 1, the intra city-size distribution conforms to Zipf’s law, and the urban system is relatively balanced; if qn is less than 1, it indicates that the advantages of high-grade town development are not prominent and the intra city-size distribution tends to be scattered; if qn is greater than 1, it indicates that the structure of urban system tends to be polarized.
Spatial autocorrelation analysis was used to reveal the clustering and spatio-temporal association of Pareto indices in the YRDR (Anselin, 1995; Yin et al., 2022), which is applicable to reveal the spatial concentration of intra city-size distribution among different levels. One is global spatial autocorrelation analysis. The study used Global Moran’s I to inscribe the global spatial agglomeration level of the Pareto indices in the YRDR. The formula is as follows:
where n is the total number of spatial units; yi and yj denote the attribute value (Pareto index) of the ith spatial units and the jth spatial units, respectively; Wij is the spatial weight matrix;
The other one is local spatial autocorrelation analysis. Hot spot analysis (Getis-Ord Gi*) was used to indicate the degree of spatial correlation of the Pareto indices among cities, which is divided into cold spot and hot spot clusters. The formula is as follows:
where n is the total number of spatial units; yj is the attribute value (Pareto index) of element j; Wij is the spatial weight matrix. The analysis results are generally normalized and recorded as Z (Gi*). The larger the absolute value of Z (Gi*), the greater the existence of local cold spot (low-low clustering) and hot spot (high-high clustering) areas.
Previous studies generally used OLS baseline regressions, which cannot produce results with spatial heterogeneity of influencing factors. However, this paper wants to examine each indicator for different cities, and MGWR is the most suitable method. It can tell us what specific factors influence the city-size distribution of a particular city, which can provide point-to-point policy recommendations. MGWR evolved from Geographically Weighted Regression (GWR). It allows each variable to produce a different bandwidth, which can more accurately portray the spatial heterogeneity of the factors influencing the intra city-size distribution (Fotheringham et al., 2017). Thus, MGWR can easily explain the causes of heterogeneous changes in city-size distribution and provide support for targeted policy formulation. The formula is as follows:
where bw1 represents the bandwidth of the regression coefficient of the 1st variable; (ui, vi) is the central coordinate of position i; and βbw1 (ui, vi) is the regression coefficient of the 1st variable at position i; β0 and εi are the constant and error term, respectively. MGWR is equivalent to a generalized additive model (GAM), using a backward fitting algorithm, first using the GWR for initial estimation of the coefficients and calculating the initial residual ε1. The formula is as follows:
The residual ε is summed with the 1st additional term f1 and then subjected to Geographically Weighted Regression (GWR) regression with x1, thereby generating the optimal bandwidth bw1 and the new estimate of f1. The iterations continue until the changes of all the terms on successive iterations are sufficiently small to declare that convergence is reached. The study calculations were based on MGWR 2.2 software with Golden Selection as the bandwidth search mode and Bisquare as the spatial kernel function model.
Based on the study of the influencing factors of city-size distribution and the related theory of the human-land system (Wu, 1991), this paper proposed a framework for the evolution mechanism of intra city-size distribution under the interaction of “land”, “industry”, and “population” (Figure 2). The first is the natural environmental system with “land” as the core, which has been stable for a long time during the early development of the city and plays a fundamental role in economic and social development (“industry”) and population concentration (“population”). It constitutes the original driving force for the formation of the intra city-size distribution. The second is the social system with “industry” as the core, which is divided into four subsystems: location, economic and social, public services, industry restructuring, etc. It is the central dynamic representation of the urban development stage. The third is the subject system with “population” as the core, which interacts with the social system (“industry”) and is the embodiment of “land” and “industry” in individual decision-making. It constitutes the contributing demographic factor to the development of intra city-size distribution. The combined effects of the three form the land-size distribution and the economic-size distribution, which are then coupled to shape the intra city-size distribution.
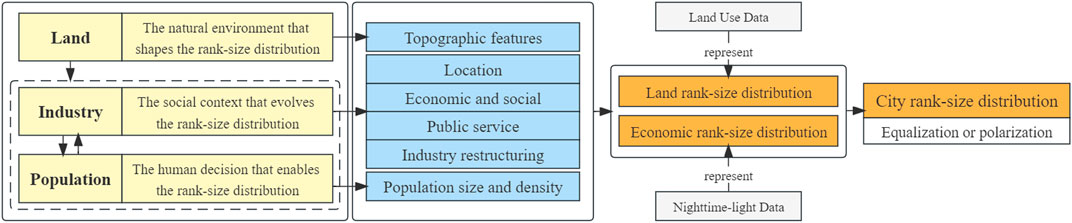
FIGURE 2. The evolution mechanism of intra city-size distribution.
According to the above assumptions of driving mechanism and theoretical elaboration of the intra city-size distribution, 10 corresponding variables were selected as influencing factors in combination with data availability (Table 1). Firstly, the average slope (slope) was used to represent the urban topographic features (“land”). Rugged topography may trigger the city-size distribution of polarization. For “industry”, the distance between government and provincial capitals was used to describe the degree of the urban location, abbreviated as distoprov. Advantageous location may trigger siphoning and spillover in different regions. Two typical indicators, GDP per capita (pcGDP) and the urbanization rate (urban) of the resident population, were important indicators of economic and social development. Using the density of highways and national roads (highway) and the number of medical beds per 1,000 people (pcmedbed) to represent the level of development of transportation and healthcare in urban public services, food production per capita (pcagri) and the ratio of secondary and tertiary industries to GDP (sector) were used to represent the industrial structure composition of agriculture, industry, and services. We assume that the more developed the economy, industry and public services are, the more balanced the town system is. Finally, population (pop) and population density (density) were important factors in representing the subject system (“population”). Obviously, an equal city-size distribution can only occur if population size and density reach a certain threshold. All variables were standardized before MGWR.
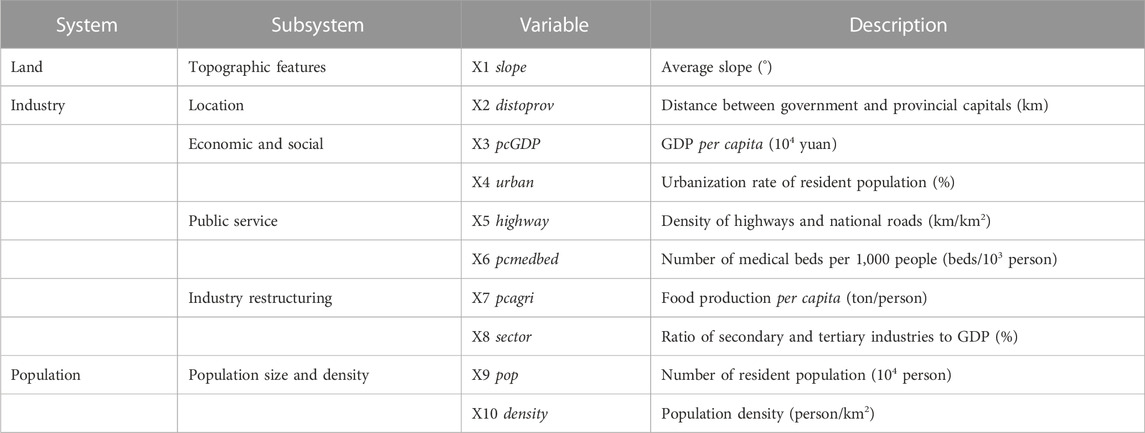
TABLE 1. Factors influencing the intra city-size distribution in the YRDR.
Firstly, the fitted levels of the size distribution of 214 cities in the YRDR need to be studied. Table 2 and Figure 3 show the descriptive statistics and fitted curves of the intra city-size distribution of key cities in the YRDR, which are analyzed below.
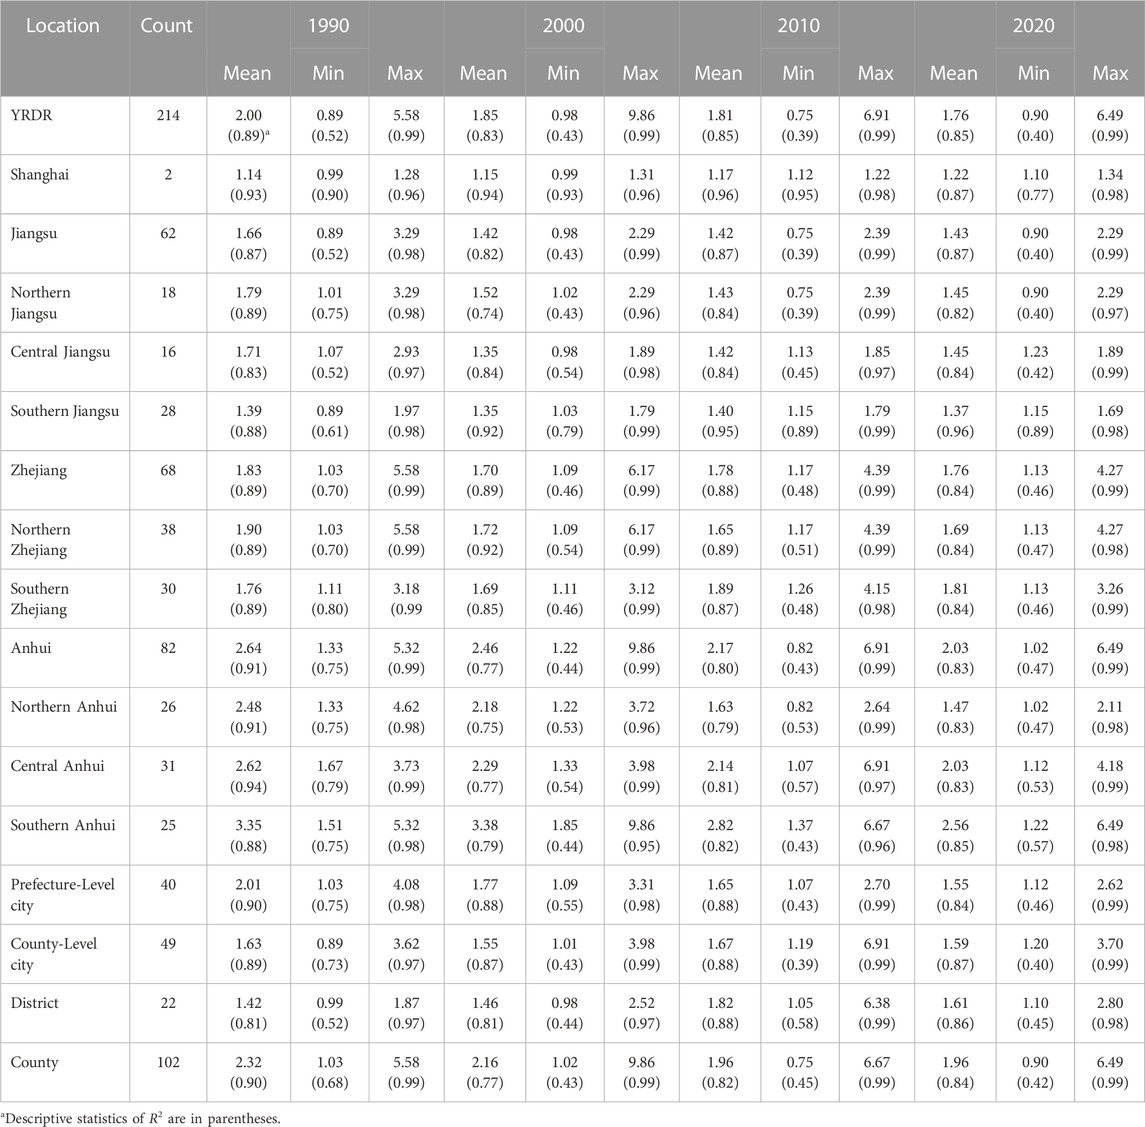
TABLE 2. Descriptive statistics of intra city-size distribution of YRDR.
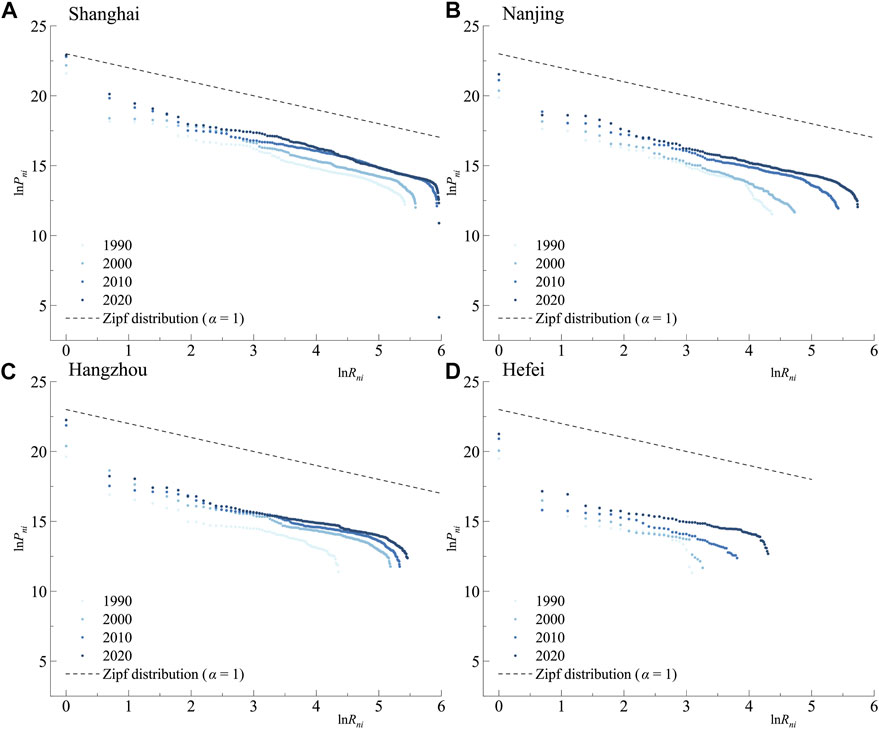
FIGURE 3. Intra city-size distribution of YRDR (key cities).
Descriptive statistics revealed that the mean R2 of intra city-size distribution in the YRDR for 1990, 2000, 2010, and 2020 were 0.89, 0.83, 0.85, and 0.85 (Table 2). The R2 was more significant than 0.8 in 89.94%, 68.85%, 73.08%, and 72.77% of the cities in the 4 periods, respectively. These percentages indicate that most of the cities in the YRDR had a intra city-size distribution consistent with a Pareto distribution. The fluctuation of R2 was mainly due to the increase in the sample of cities that met the requirements and the immaturity of these new cities’ urban systems.
In general, the Pareto indices of the YRDR presented a rapidly decreasing trend over the 3 decades, with the average value decreasing from 2.00 to 1.76. This indicates that most of the cities in the YRDR were converging toward the Zipf distribution, and the urban system was more balanced and idealized. However, from 1990 to 2020, most cities still tended to have a polarized distribution in intra city-size distribution. In most years, only 3 cities had a Pareto index of less than 1. In terms of provincial divisions, Jiangsu and Zhejiang were closer to the Zipf distribution, and had a more balanced intra city-size distribution. Anhui, on the other hand, still had a mean Pareto index greater than 2 in 2020, although Anhui had the largest decline. The above is more consistent with the general perception of the YRDR in academic fields. Anhui is not well developed in terms of its urban system due to the distance from the center of the YRDR.
As shown in Figure 3, the Pareto index for the central area of Shanghai was 1.28, 1.31, 1.22, and 1.34 in 1990, 2000, 2010, and 2020, and the R2 was also at a high value. Such a stable evolution trend indicates that Shanghai’s urban system was stable and mature in the long term. In recent years, however, the first town in the central area of Shanghai expanded rapidly, and the intra city-size distribution tended to be slightly polarized. The Pareto indices of the other 3 key cities, Nanjing, Hangzhou, and Hefei, showed almost the same declining trend and fitting level over the 30 years, falling to 1.19, 1.12, and 1.12 in 2020, respectively. This paper argues that the intra city-size distribution in these 3 cities now largely conformed to the Zipf distribution, despite the presence of “warped head” and “fat tail”.
Figures 4, 5, 6 show the intra size distribution of the cities proper of prefecture-level cities, county-level cities, and counties in the YRDR, respectively, and these three categories are the major urban units in the YRDR. Firstly, the study found that county-level cities had the best fitting level, where the average Pareto index was already 1.63 in 1990 and had hardly changed during the 30 years. This is because county-level cities tend to be counties with better economic development in China. Still, most of them had not followed the same development path as prefecture-level cities to expand their central cities (county towns). On a provincial basis, the phenomenon of “warped head” and “fat tail” in the county-level cities of Jiangsu and Zhejiang was weak, while Anhui was more prominent. Secondly, the prefecture-level cities had the next highest level of fit. Their urban systems were relatively well developed, but a significant phenomenon of “warped head” and “fat tail” was still detected, especially in Jiangsu. The prefecture-level cities had the largest degradation of the average Pareto index, reaching 1.55 in 2020. Thirdly, it can be seen that the fitting level of different counties varied widely, among which Zhejiang had the best fitting level for intra city-size distribution. Compared with the others, the average Pareto index of counties was the highest, especially in Jiangsu and Anhui, which had the problem of overdevelopment of the first town. This is because the county had long been constrained by economic development and resources, and the government had generally chosen to develop the county town intensively. Finally, Figure 7 shows the most tremendous volatility in the intra city-size distribution of districts, because these districts have changed from counties or county-level cities. Subsequently, its town system was strongly influenced by the prefecture-level cities. They gradually changed from a severe “warped head” in 1990 to a balanced distribution.
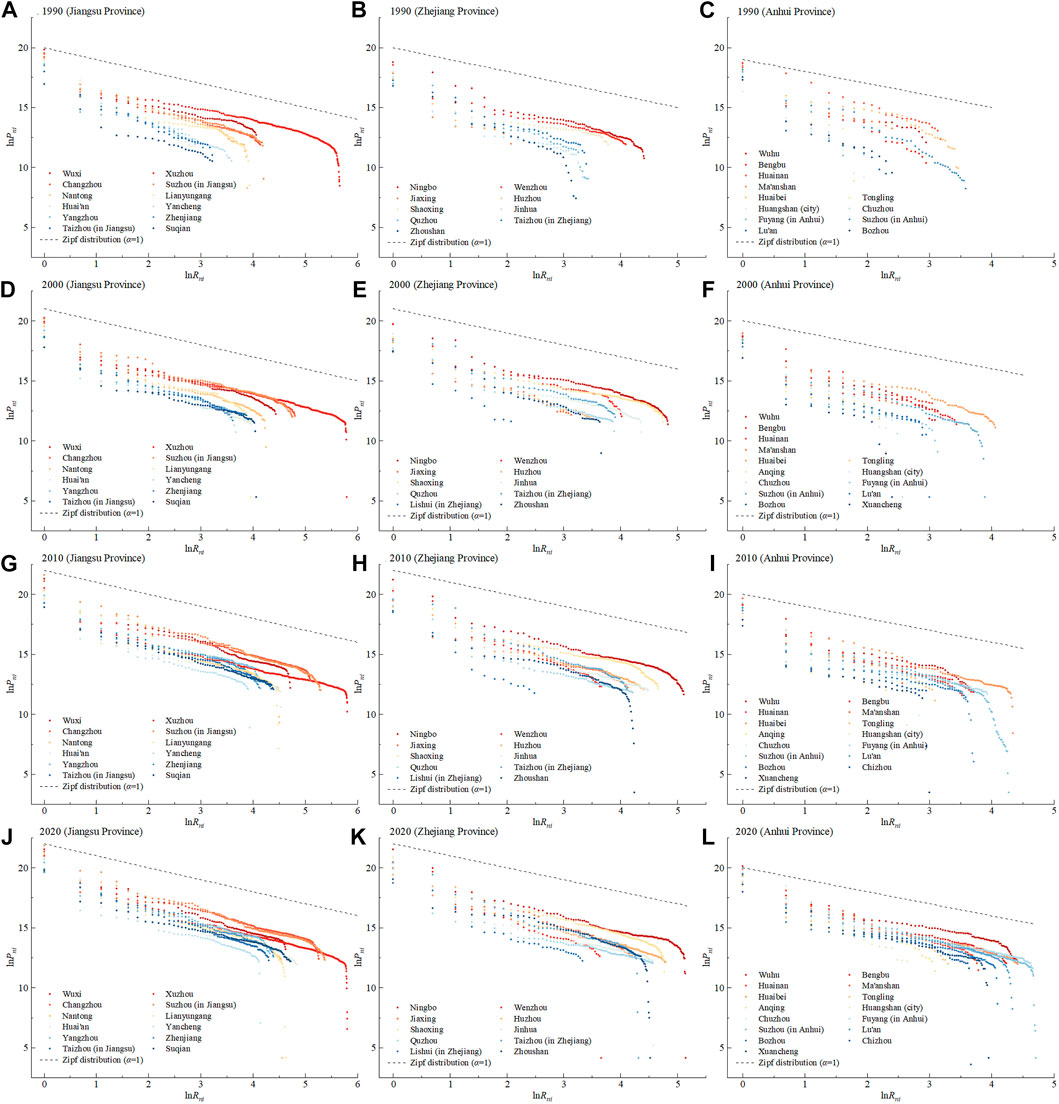
FIGURE 4. Intra city-size distribution of YRDR (prefecture-level cities).
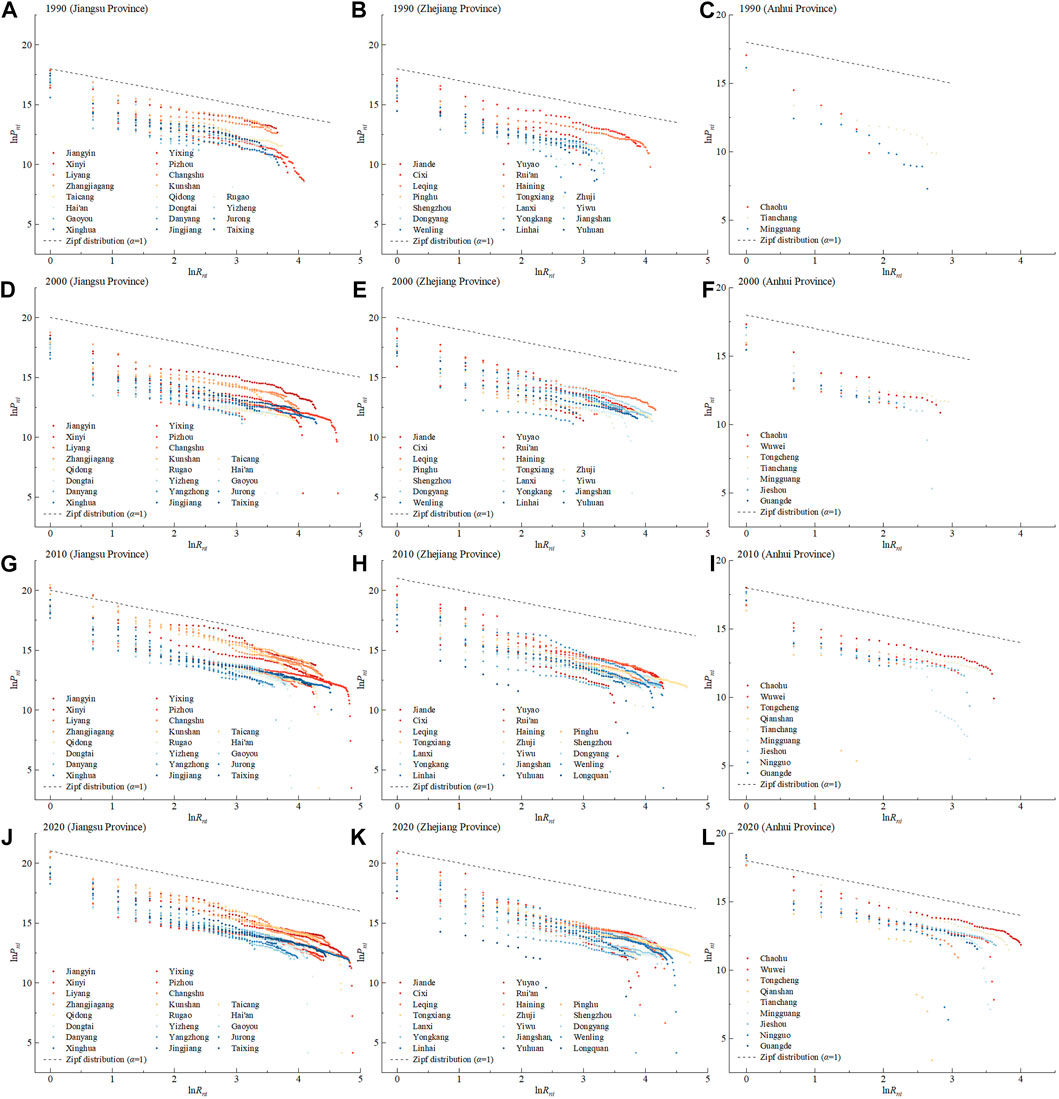
FIGURE 5. Intra city-size distribution of YRDR (county-level cities).
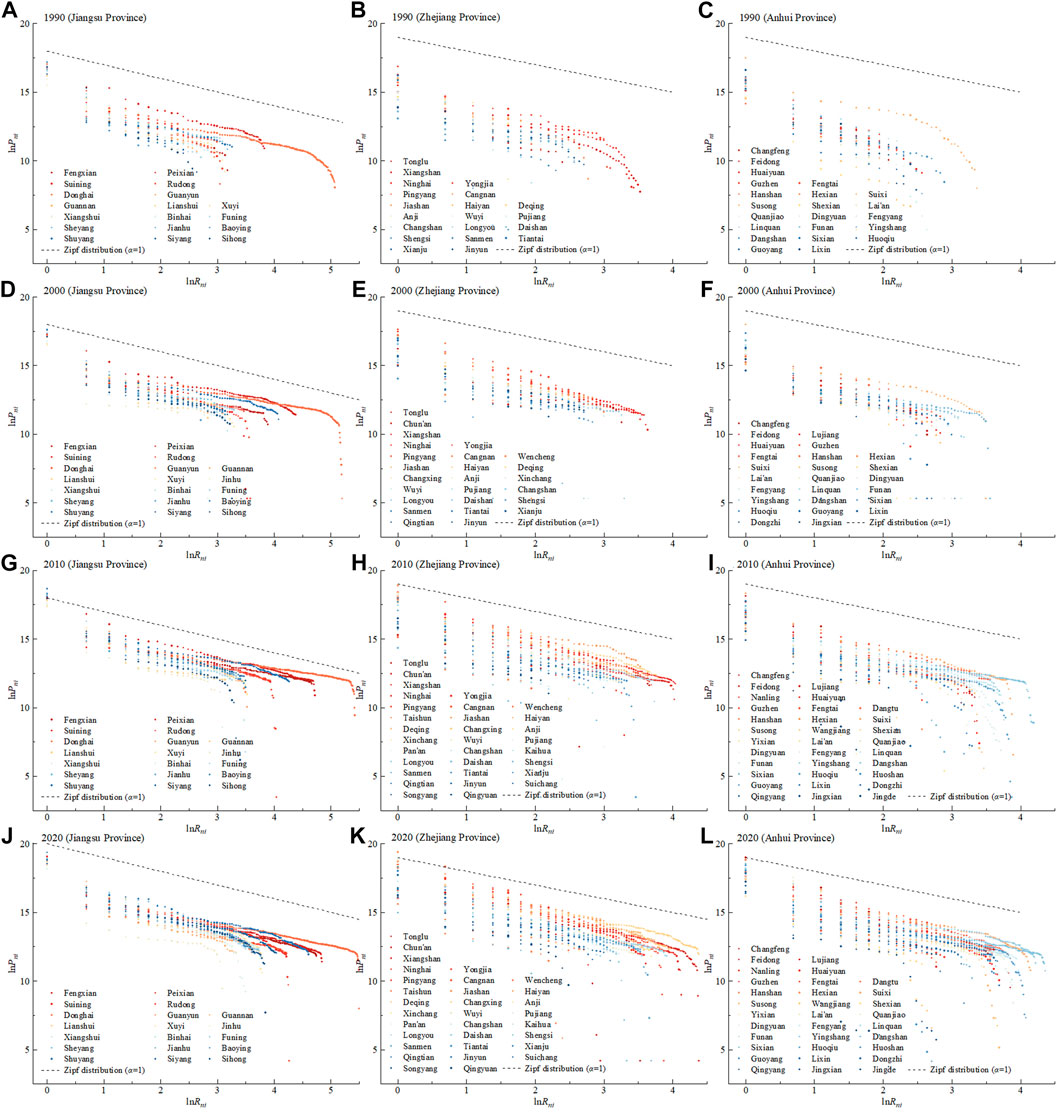
FIGURE 6. Intra city-size distribution of YRDR (counties).
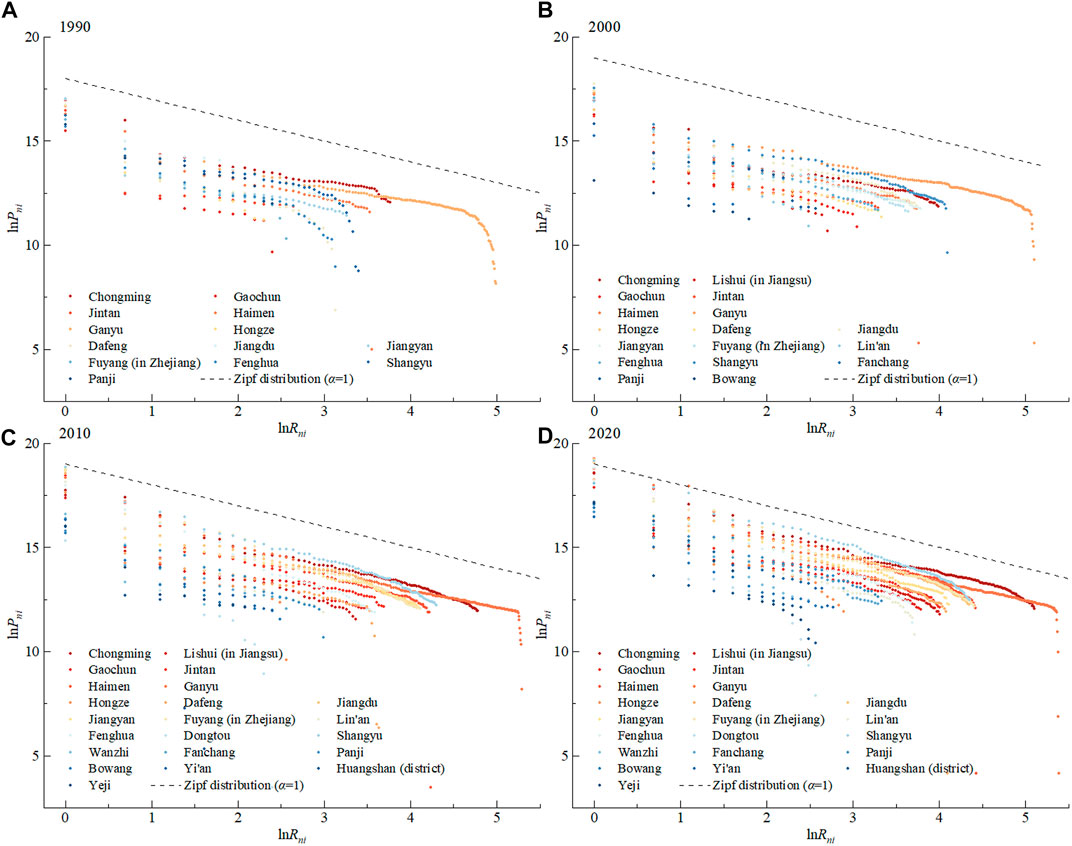
FIGURE 7. Intra city-size distribution of YRDR (districts).
The spatio-temporal distribution of the Pareto indices is graded with reference to the natural interruption point method, where cities with Pareto index between 0.75 and 1.25 are considered to conform to the Zipf distribution. From 1990 to 2020, the Pareto index showed an overall spatio-temporal pattern of high in the west and low in the east (Figure 8). In addition, there existed more cities in southern Anhui with an insufficient number of towns before 2000, so they could not be calculated to determine the Pareto index; this situation has gradually disappeared in recent years. In 2010 and 2020, the high-value distribution area of the Pareto index was mainly in southern Anhui, and the low-value area (Zipf distribution area) was distributed in the East Longhai region (Xuzhou and Lianyungang area) and the Nanjing-Zhenjiang-Yangzhou region of Jiangsu. Another province, Zhejiang, had a more fluctuating low-value distribution area, with none of the cities conforming to the Zipf distribution in 2010. Overall, Zhejiang showed a spatio-temporal pattern of a high Pareto index in the south and low in the north, as well as Anhui.
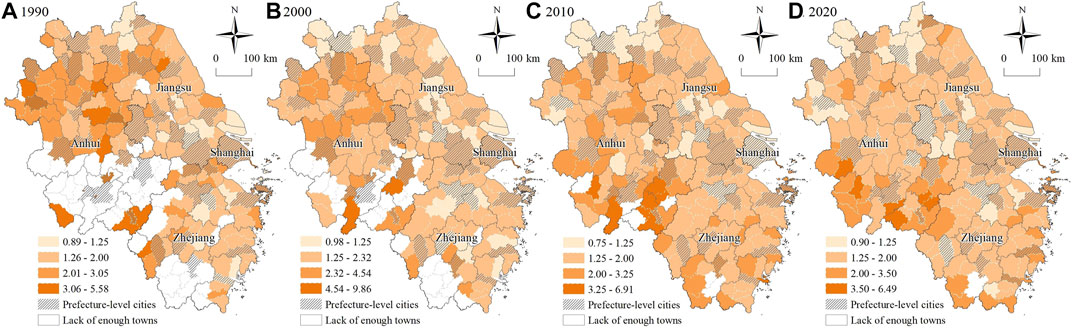
FIGURE 8. Spatio-Temporal distribution of the Pareto index.
The spatial correlation analysis of the Pareto index also confirmed the analysis. The Global Moran’s I of the Pareto index was 0.227, 0.236, 0.445, and 0.408 in 1990, 2000, 2010 and 2020, all with a p-value of 0.000. It indicates that the intra city-size distribution possessed positive global spatial agglomeration but diminished in 2020. From the results of local spatial autocorrelation analysis (Figure 9), both the cold and hot spots were large and opposed to each other in 1990, indicating that intra city-size distribution varied greatly among cities in the YRDR. As the period passed, both the extent and intensity of cold and hot spots reduced. Eventually, a hot spot existed only in southern Anhui, while the cold spot area almost completely disappeared. The above results indicate that the variability of intra city-size distribution among cities was weakening.
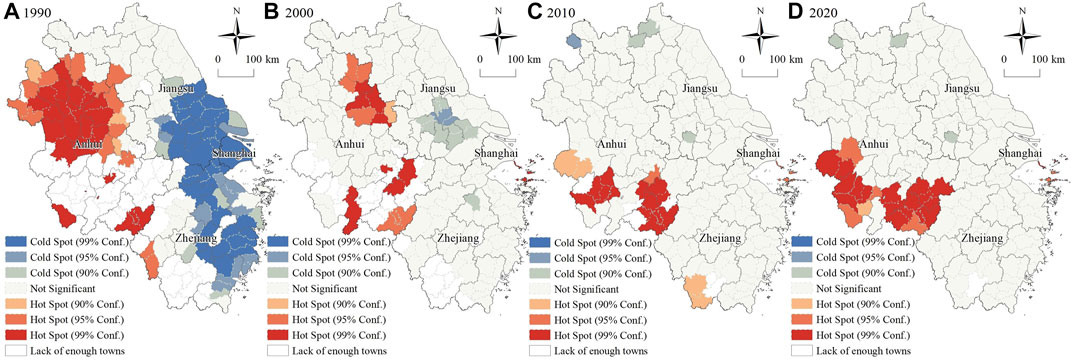
FIGURE 9. Correlation analysis of the Pareto index.
The Ordinary Least Square (OLS) results showed that the Variance Inflation Factor (VIF) for the 4 periods ranged from 1.204 to 8.945, 1.256 to 5.065, 1.364 to 4.664, and 1.326 to 4.939, respectively, indicating that there was no significant covariance in the model. The regression comparison results (Table 3) showed that MGWR experienced a significant decrease in Akaike Information Criterion, corrected (AICc) compared to OLS and GWR from 1990 to 2020, and both GWR and MGWR showed a substantial increase in R2, Adjusted R2, and smaller Residual, which indicated that MGWR was better than OLS and GWR in terms of fitting and analysis results.
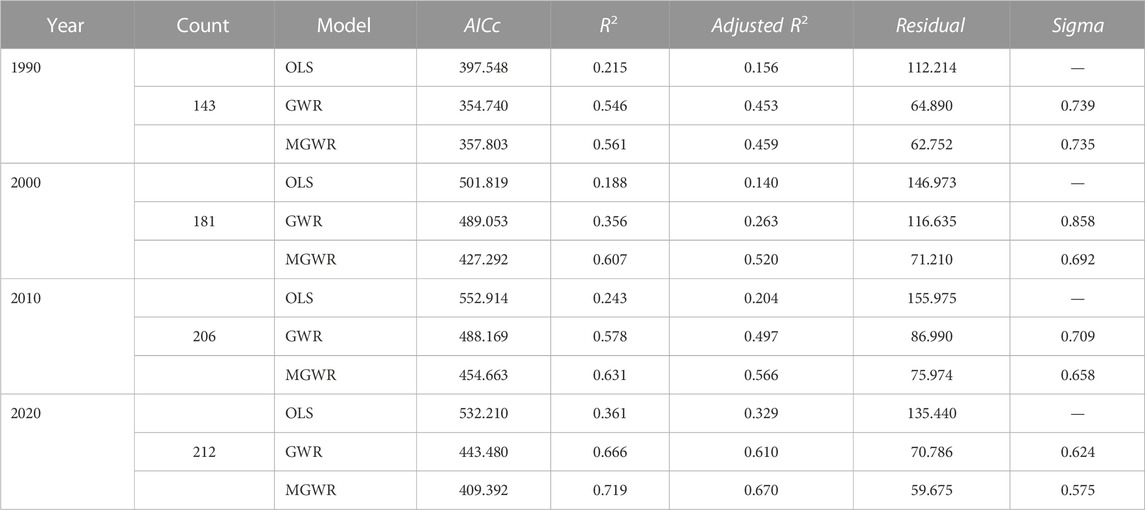
TABLE 3. Comparison of analytical results of OLS, GWR and MGWR models.
MGWR can assign different bandwidths to each factor, which then reflects the differential impact levels of different factors. The bandwidths of GWR were 107, 151, 130, and 143 for all 4 periods, but the bandwidths of different factors of MGWR varied considerably (Table 4), indicating that MGWR can identify the level of spatial heterogeneity of each factor’s influence more precisely. This paper stipulated that factors with bandwidths above the upper quartile of the sample size had small spatial heterogeneity. So the bandwidths of distoprov, urban, pcmedbed, and pop from 1990 to 2020 met these conditions; therefore, they were identified as global influencing factors. The bandwidths of the remaining 6 factors were smaller or changed significantly during the 3 decades; they were consequently identified as local influencing factors.
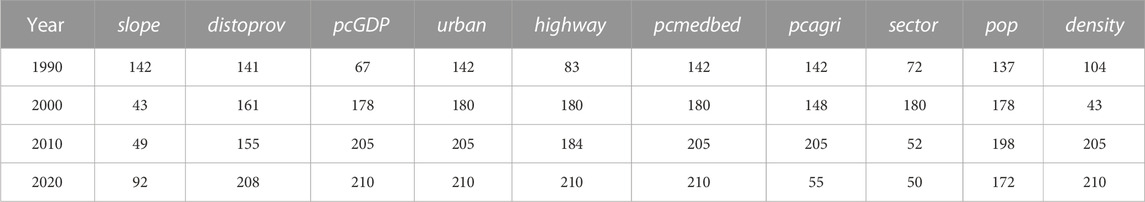
TABLE 4. Bandwidth of different influencing factors of MGWR.
Table 5 shows the descriptive statistics of the MGWR analysis of the factors influencing intra city-size distribution, and Figure 10 shows the local influence factor analysis of the Pareto indices. The specific analysis is as follows.
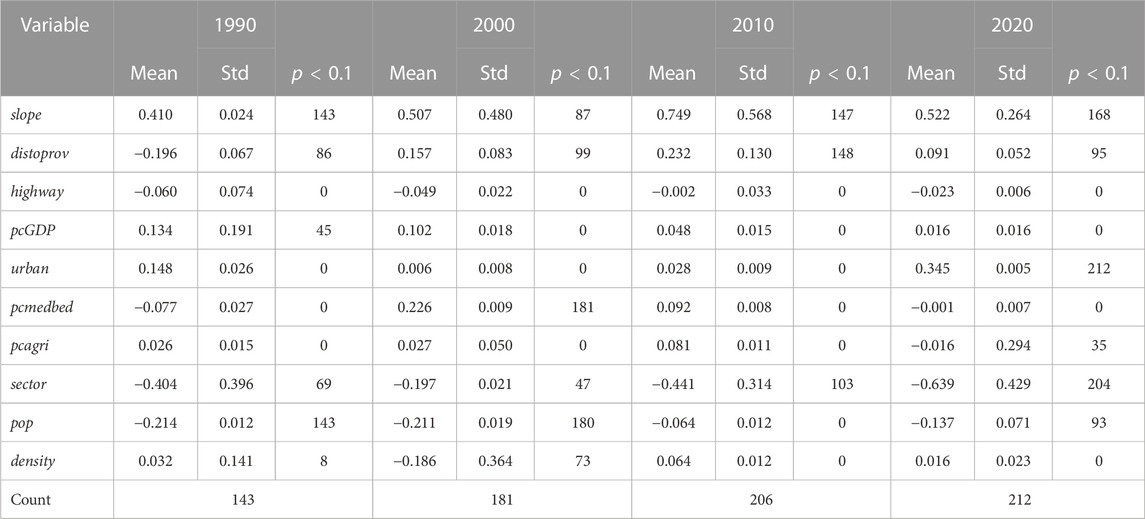
TABLE 5. Analysis of the factors influencing intra city-size distribution by MGWR.
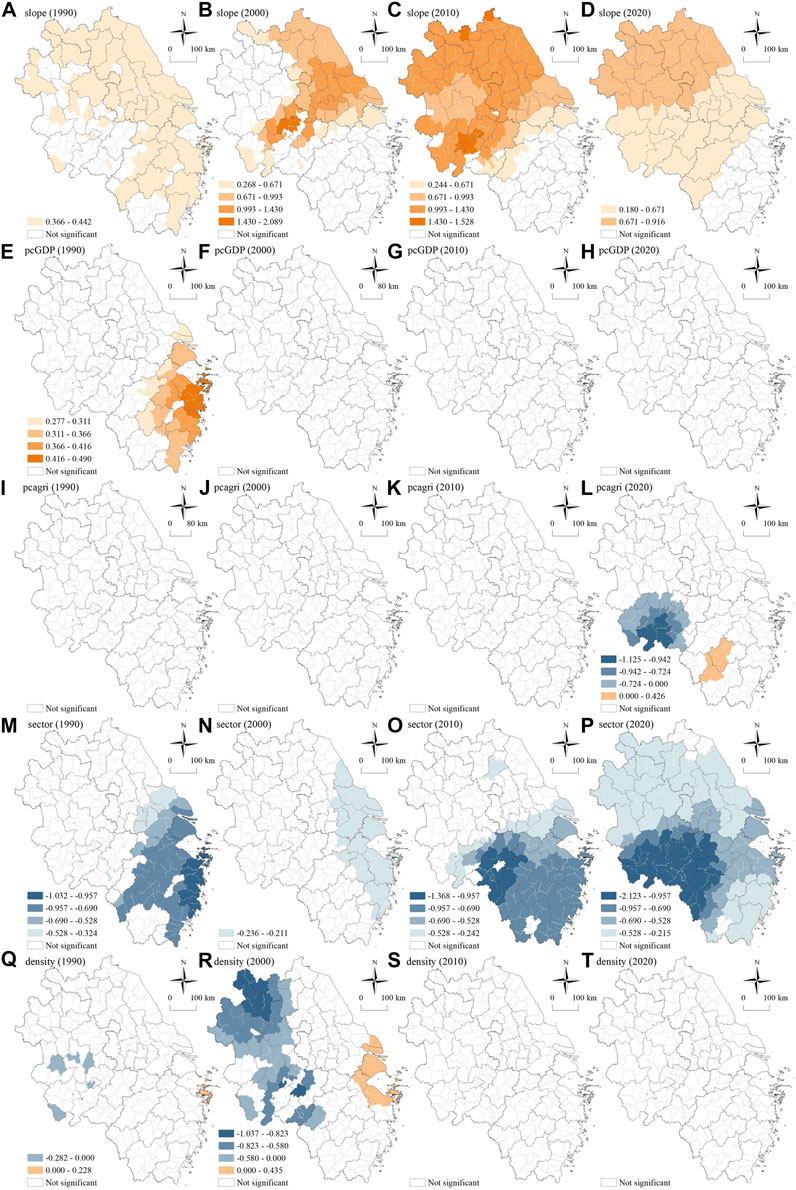
FIGURE 10. Spatial heterogeneity analysis of local factors.
The natural environment was the long-term dominant factor in most counties in the YRDR, and an advantageous natural environment contributed to a more balanced intra city-size distribution. The mean value of the impact of slope was the highest of all factors, and it was significant in the majority of cities (Table 5). MGWR analysis showed that the influence of slope reached its maximum in 2000, and then began to decline slowly. But the influence of slope had been expanding (Figure 10). In 2000, the influential high-value area was concentrated around the Huaihe River basin, and then the high-value area range kept expanding to the northern plain area. The reason for this phenomenon is that the topography of these areas was relatively flat, and suitable land was abundant for construction. As a result, larger towns can easily be formed, thus causing the polarized intra city-size distribution.
Location was a critical global influencing factor. In 1990, the mean value of distoprov was −0.196. It then turned positive in 2000 but began to decline after reaching a peak in 2010. The above phenomenon was related to the urbanization process in China. In 1990, most cities were able to develop only in the central urban areas, while the urbanization of townships had not yet begun and the mobility of the population in townships was somewhat restricted. Therefore, the radiation and attraction of the provincial capital could only reach the big cities. The closer to the provincial capital, the more the intra city-size distribution tended to polarize in the top towns. The free movement of the population and rapid urbanization after 2000 reversed this phenomenon, and the influence of provincial capitals also diminished slightly.
Economic and social factors were more influential only in specific periods and geographical areas. Among them, pcGDP was only influential in 1990 in the eastern coastal region of Zhejiang and Shanghai, suggesting that early economic development played a vital role in promoting the expansion of head towns in these places. Another global impact factor, urban, was only more influential in 2020, with a mean value of 0.345. This suggests that urbanization in the YRDR was already acting as a reverse polarization of the intra city-size distribution in 2020, and that the government should pay more attention to balanced urban development.
Public service was not a major factor in the intra city-size distribution. The highway had almost no impact and was insignificant in nearly all cities. Another factor, pcmedbed, was only significant in 2000 and had a low impact. The main reason is that the YRDR has excellent public service, and the level of transportation and medical coverage has been leading in China. As a result, the intra city-size distribution was hardly affected by public service.
The influence of industry restructuring gradually increased, and the stronger the industrial specialization, the more balanced the intra city-size distribution. Of these, pcagri was insignificant in 1990, 2000, and 2010 but had a negative impact on Southern Anhui in 2020. As the affective range of sector gradually increased, the negative high-value area was concentrated in the southern YRDR. As the industrial structure evolved and the output value increased, industry gradually sank and expanded to small towns, forming a specialized development pattern that led to a balanced scale for each grade of town.
Population was an essential factor in equalization in the early years, but its influence and significance have decreased recently. Population is the carrier of intra city-size distribution and is the core competitiveness of each city. The decline in pop influence in 1990, 2000, and 2010 is attributed to the fact that the YRDR was in a period of rapid population growth. However, the population growth fell off a cliff in 2020, and the demographic impact picked up during the population stock period. The influence of density formed a negative core in the Huang-Huai-Hai region in 2000, closely related to its huge population base.
Based on nighttime light data and land use data, the study used the Pareto indices to portray the spatio-temporal patterns of the intra city-size distribution of 214 cities in the YRDR from 1990 to 2020 (with a decade interval). An evolution mechanism of the intra city-size distribution in terms of Land–Industry–Population was constructed, and the spatial heterogeneity of factors influencing the intra city-size distribution in the YRDR using MGWR was analyzed. The discussion and conclusions are as follows.
From 1990 to 2020, most of the cities in the YRDR had a intra city-size distribution consistent with a Pareto distribution. The Pareto indices show a rapidly decreasing trend, indicating that the size distribution in most cities in the YRDR was converging toward the Zipf distribution. However, the Pareto indices of most cities were greater than 1, and the intra city-size distribution still tended to be polarized.
From 1990 to 2020, Shanghai, Nanjing, Hangzhou, and Hefei were gradually converging toward a Zipf distribution in terms of intra city-size distribution. Viewed by province, the degree of equalization was in the order of Jiangsu, Zhejiang, and Anhui. Viewed by city hierarchy, the degree of equalization was in the order of county-level cities, prefecture-level cities, and counties. The intra city-size distribution of the district was more volatile.
From 1990 to 2020, the Pareto indices showed a spatio-temporal pattern of high in the west and low in the east. Spatial correlation analysis revealed that the scope and intensity of cold and hot spots had been reduced, eventually forming a pattern in which hot spots existed only in southern Anhui and cold spots almost disappeared. This indicates that the variability of intra city-size distribution was weakening.
Land, industry, and population were essential influences on the intra city-size distribution. Among them, the natural environment (“land”) was the long-term dominant factor in most cities in the YRDR. In the social context (“industry”), location was an important global influencing factor, and economic and social factors only had a greater influence in 1990 and 2020. The influence factor of industry restructuring gradually increased, and the more specialized the industry, the more balanced the urban structure. Finally, “population” significantly influenced equalization in the early years, but decreased recently.
The results show that, first of all, Pareto’s law has strong generalizability to intra cities, which is the scientific contribution of this study. And the conclusion that the intra city-size distribution gradually tends toward Zipf distribution is also consistent with the general rule. Among them, the findings of small cities such as counties in the YRDR are the most seminal. Finally, because the YRDR has the highest level of urbanization in China, the study’s results can provide some reference for other regions.
In the YRDR, most cities showed a very prominent polarization, although it is easing. This problem is related to China’s past urban development patterns and strict control policies (Zhao et al., 2003). A larger and leading urban area can be a catalyst for urban development (Li, W. et al., 2022). The government or regulators need the impetus generated by agglomeration, as development has come first in China over the past. However, this excessive polarization may eventually bring about “agglomeration diseconomies” and “rural decay”, and the big city disease is a lesson. Especially in the background of creating a world-class urban agglomeration in the YRDR, the concept of well-balanced development and governance is what is sustainable. Fortunately, it is not too late for the government and scholars to pay more attention to the urban structure of small and medium-sized cities which have more plasticity.
The factors for intra city-size distribution possessed spatial heterogeneity. Therefore, the study believes that site-specific policies should be formulated. Higher levels of government should confer greater autonomy to the next level, and local city governments should use the policy toolkit in depth. Several policy recommendations are as follows. Firstly, the scale of the metropolitan area should be reasonably controlled, and greed for bigness should not be the dominant ideology of planning. Some developing metropolitan areas produce explosive expansion, resulting in a perverse city-size distribution and small-town decay. Such deprivation-type urbanization should be avoided. Secondly, small cities and towns should be well divided and configured in terms of industry, economy, and development orientation. Localization should be the leading idea of small towns, and they should have unique and sustainable development characteristics. For example, the Shengze Town in YRDR, Suzhou, which is famous for silk production, should be studied by other towns. Thirdly, efforts should be made to improve the habitat and infrastructure of small towns so that they can also become attractive urban spaces for people and capital. Finally, the rational allocation of the population is also very important, and the main role of people in urbanization should be given full consideration. If the YRDR can improve these aspects, it can form a sustainable urban system, and each city can grow healthily. Furthermore, YRDR will be more competitive in the global urban arena and provide better wellbeing for people, and potentially be a great reference for other regions.
Due to the complexity of intra city-size distribution coupled with the immature development of many small Chinese cities, there may be uncertainties in the findings. Several limitations should be noted. The first is data sources. With frequent changes in administrative divisions, some earlier data are unavailable, which led to some influencing factors being unable to be studied. Moreover, there is a lack of exploration of policy. The policy is difficult to quantify in this study, but it is likely to be one of the crucial influences as well. Therefore, future research should use more refined data and construct more systematic models of the impact mechanisms. Also, the measure of city-size distribution should not be limited to nighttime lights, but also use cell phone signaling and hotspot big data. Last but not least, we appeal for more research on agglomeration performance within small and medium-sized cities, which is still vacant. And a comparative study of inter city-size distribution and intra city-size distribution can be conducted.
The raw data supporting the conclusion of this article will be made available by the authors, without undue reservation.
ZP and CW conceived the idea. ZP collected the original data, wrote the manuscript and contributed to the graphics. XZ contributed to the revision of the manuscript and funding support. CW contributed to the proofreading of the manuscript. All authors contributed to the discussion and approved the final manuscript before submission.
This research was supported by the National Key R&D Program of China (No. 2019YFD1101301-02) and the Hunan Provincial Innovation Foundation for Postgraduate (No. CX20220832).
The authors would like to thank the teachers who helped this work and the institutions that provided data.
The authors declare that the research was conducted in the absence of any commercial or financial relationships that could be construed as a potential conflict of interest.
All claims expressed in this article are solely those of the authors and do not necessarily represent those of their affiliated organizations, or those of the publisher, the editors and the reviewers. Any product that may be evaluated in this article, or claim that may be made by its manufacturer, is not guaranteed or endorsed by the publisher.
The Supplementary Material for this article can be found online at: https://www.frontiersin.org/articles/10.3389/fenvs.2023.1138213/full#supplementary-material
Anselin, L. (1995). Local indicators of spatial association: Lisa. Geogr. Anal. 27 (2), 93–115. doi:10.1111/j.1538-4632.1995.tb00338.x
AODC (AMAP Open Data Center) (2022). AMAP open data center. Available at: https://lbs.amap.com/ (Accessed February 22, 2022).
Auerbach, F. (1913). Das gesetz der Bevolkerungskonzentration. Petermanns Geogr. Mittl. 59, 73–76. Available at: https://zs.thulb.uni-jena.de/receive/jportal_jparticle_00586390.
Batty, M. (2016). Empty buildings, shrinking cities and ghost towns. Environ. Plann. B 43 (1), 3–6. doi:10.1177/0265813515619858
Chauvin, J. P., Glaeser, E., Ma, Y. R., and Tobio, K. (2017). What is different about urbanization in rich and poor countries? Cities in Brazil, China, India and the United States. J. Urban Econ. 98, 17–49. doi:10.1016/j.jue.2016.05.003
Cheshire, P. (1999). Trends in sizes and structure of urban areas. H. Reg. Urban Econ. 3 (1), 1339–1373. doi:10.1016/s1574-0080(99)80004-2
CIESIN (Center for International Earth Science Information Network, Columbia University), and ITOS (Information Technology Outreach Services, University of Georgia) (2013). Global roads open access data set, version 1. New York, NY: NASA Socioeconomic Data and Applications Center. Last Modified 20220916. doi:10.7927/H4VD6WCT
CNBS (National Bureau of Statistics of China) (2022a). China city statistical yearbook (1985-2021). Beijing, China: China Statistics Press.
CNBS (National Bureau of Statistics of China) (2022b). China statistical yearbook (county-level) (2000-2021). Beijing, China: China Statistics Press.
COSC (Census Office of State Council) (2012). Tabulation on the population Census of the people's Republic of China (1990-2020). Beijing, China: China Statistics Press.
Das, R. J., and Dutt, A. K. (1993). Rank-size distribution and primate city characteristics in India: A temporal analysis. GeoJournal 29 (2), 125–137. doi:10.1007/BF00812809
Fahmi, F. Z., Hudalah, D., Rahayu, P., and Woltjer, J. (2014). Extended urbanization in small and medium-sized cities: The case of Cirebon, Indonesia. Habitat Int. 42, 1–10. doi:10.1016/j.habitatint.2013.10.003
Fang, C. L., and Yu, D. L. (2017). Urban agglomeration: An evolving concept of an emerging phenomenon. Landsc. Urban Plan. 162, 126–136. doi:10.1016/j.landurbplan.2017.02.014
Fang, C. L. (2022). Theoretical analysis on the mechanism and evolution law of urban-rural integration development. Acta Geogr. Sin. 77 (4), 759–776. doi:10.11821/dlxb202204001
Fluschnik, T., Kriewald, S., Ros, A. G. C., Zhou, B., Reusser, D. E., Kropp, J. P., et al. (2016). The size distribution, scaling properties and spatial organization of urban clusters: A global and regional percolation perspective. Isprs Int. J. Geo-Inf. 5 (7), 110. doi:10.3390/ijgi5070110
Fotheringham, A. S., Yang, W. B., and Kang, W. (2017). Multiscale geographically weighted regression (MGWR). Ann. Am. Assoc. Geogr. 107 (6), 1247–1265. doi:10.1080/24694452.2017.1352480
Gabaix, X. (1999). Zipf's law for cities: An explanation. Q. J. Econ. 114 (3), 739–767. doi:10.1162/003355399556133
Gao, B., Huang, Q. X., He, C. Y., and Dou, Y. Y. (2017). Similarities and differences of city-size distributions in three main urban agglomerations of China from 1992 to 2015: A comparative study based on nighttime light data. J. Geogr. Sci. 27 (5), 533–545. doi:10.1007/s11442-017-1391-7
Gariazzo, C., and Pelliccioni, A. (2019). A multi-city urban population mobility study using mobile phone traffic data. Appl. Spat. Anal. Polic. 12 (4), 753–771. doi:10.1007/s12061-018-9268-4
GDC (Geospatial Data Cloud of China) (2022). SRTMSLOPE 90m resolution slope data. Available at: http://www.gscloud.cn (Accessed February 22, 2022).
GDSIPU (Geographic Data Sharing Infrastructure of Peking University) (2020). National major roads Dataset 2000. Available at: https://geodata.pku.edu.cn/index.php?c=content&a=show&id=1399.
Giesen, K., and Sudekum, J. (2011). Zipf's law for cities in the regions and the country. J. Econ. Geogr. 11 (4), 667–686. doi:10.1093/jeg/lbq019
Giesen, K., Zimmermann, A., and Suedekum, J. (2010). The size distribution across all cities: Double Pareto lognormal strikes. J. Urban Econ. 68 (2), 129–137. doi:10.1016/j.jue.2010.03.007
Grachev, G. A. (2022). Size distribution of states, counties, and cities in the USA: New inequality form information. Phys. A 592, 126831. doi:10.1016/j.physa.2021.126831
Guo, J. K., Wu, L. L., Li, B., and Qin, Y. F. (2020). Rank-size structure and coupling type of coastal port city system based on multifunctional perspective. Sci. Geogr. Sin. 40 (7), 1050–1061. doi:10.13249/j.cnki.sgs.2020.07.002
Huang, W. Z., and Shi, P. J. (2021). An empirical study on rank cumulative size model of rural settlements in the Hehuang area. Acta Geogr. Sin. 76 (6), 1489–1503. doi:10.11821/dlxb202106012
Huang, Q. X., He, C. Y., Gao, B., Yang, Y., Liu, Z. F., Zhao, Y. Y., et al. (2015). Detecting the 20 year city-size dynamics in China with a rank clock approach and DMSP/OLS nighttime data. Landsc. Urban Plan. 137, 138–148. doi:10.1016/j.landurbplan.2015.01.004
Jing, Z. H., Yang, Y. C., Xia, J. G., and Zhang, P. S. (2021). Characteristics of scale structure and spatial structure of city system in Sichuan Province. Areal Res. Dev. 40 (4), 57–62. doi:10.3969/j.issn.1003-2363.2021.04.010
Li, S. J., and Sui, D. (2013). Pareto's law and sample size: A case study of China's urban system 1984–2008. Geojournal 78 (4), 615–626. doi:10.1007/s10708-012-9455-9
Li, J. G., Li, S. H., Lei, J., Zhang, X. L., Qi, J. W., Tohti, B., et al. (2022). Analysis of spatial structure in the Kashgar metropolitan area, China. Land 11 (6), 823. doi:10.3390/land11060823
Li, W., Sun, B. D., Zhang, T. L., and Zhang, Z. F. (2022). Panacea, placebo or pathogen? An evaluation of the integrated performance of polycentric urban structures in the Chinese prefectural city-regions. Cities 125, 103624. doi:10.1016/j.cities.2022.103624
Liu, X. Y., and Xin, L. J. (2022). Evolution of the structure of the urban land-price system in China based on the rank-size law. Land 11 (2), 284. doi:10.3390/land11020284
Liu, Y. S., and Yang, R. (2012). The spatial characteristics and formation mechanism of the county urbanization in China. Acta Geogr. Sin. 67 (08), 1011–1020. doi:10.11821/xb201208001
Liu L Y, L. Y., Zhang, X., Zhao, T. T., Gao, Y., Chen, X. D., and Mi, J. (2021). GISD30: Global 30-m impervious surface dynamic dataset from 1985 to 2020 using time-series Landsat imagery on the Google Earth Engine platform. Earth Syst. Sci. Data 14, 1831–1856. doi:10.5281/zenodo.5220816
Liu P X, P. X., Zhang, J., Zhang, J. X., Zhang, J. Y., and Zhang, Y. Y. (2021). The rank-size distribution and influencing factors of tourist flow: A case study of 204 scenic spots in Jiangsu province. Sci. Geogr. Sin. 41 (11), 1992–2001. doi:10.13249/j.cnki.sgs.2021.11.012
Liu, X. J., Derudder, B., and Wang, M. S. (2018). Polycentric urban development in China: A multi-scale analysis. Environ. Plan. B-Urban. 45 (5), 953–972. doi:10.1177/2399808317690155
Liu, Z., Liu, S. H., Qi, W., and Jin, H. R. (2018). Urban sprawl among Chinese cities of different population sizes. Habitat Int. 79, 89–98. doi:10.1016/j.habitatint.2018.08.001
Man, X. M., and Chen, Y. G. (2020). Fractal-based modeling and spatial analysis of urban form and growth: A case study of shenzhen in China. Isprs Int. J. Geo-Inf. 9 (11), 672. doi:10.3390/ijgi9110672
Mandelbrot, B. (1967). How long is the coast of Britain? Statistical self-similarity and fractional dimension. Science 165, 636–638. doi:10.1126/science.156.3775.636
MCA (Ministry of Civil Affairs of China) (2022). National administrative division information query platform of China. Available at: http://xzqh.mca.gov.cn/map (Accessed February 22, 2022).
NCSGI (National Catalogue Service for Geographic Information of China) (2021). 1: 1 million public version of basic geographic information data. Available at: https://www.webmap.cn/commres.do?method=result100W (Accessed February 22, 2022).
Rastvortseva, S. N., and Manaeva, I. V. (2020). Zipf's law for Russian cities: Analysis of new indicators. Ekon. Reg. 16 (3), 935–947. doi:10.17059/ekon.reg.2020-3-20
Reed, W. J., and Jorgensen, M. (2004). The double pareto-lognormal distribution: A new parametric model for size distributions. Commun. Stat-Theor. M. 33 (8), 1733–1753. doi:10.1081/sta-120037438
Robertson, K. A. (1999). Can small-city downtowns remain viable? A national study of development issues and strategies. J. Am. Plann. Assoc. 65, 270–283. doi:10.1080/01944369908976057
Shi, L. F., Zhang, Z. X., Liu, F., Zhao, X. L., Wang, X., Liu, B., et al. (2016). City size distribution and its spatiotemporal evolution in China. Chin. Geogr. Sci. 26 (6), 703–714. doi:10.1007/s11769-016-0832-z
Sonis, M., and Grossman, D. (1984). Rank-size rule for rural settlements. Socio-Econ. Plan. Sci. 18 (6), 373–380. doi:10.1016/0038-0121(84)90046-6
Soo, K. T. (2005). Zipf's law for cities: A cross-country investigation. Reg. Sci. Urban Econ. 35 (3), 239–263. doi:10.1016/j.regsciurbeco.2004.04.004
Sun, B. D., Jin, X. X., and Lin, J. (2019). China's new pattern of urbanization toward coordinated development of large, medium and small cities: Evolution and determinants of city size distribution since 1949. Geogr. Res-Aust. 38 (1), 75–84. doi:10.11821/dlyj020180443
Takasaka, H. (1978). Dynamic analysis of city size distribution: A case study of niigata prefecture in Japan. Geogr. Rev. 51 (3), 223–234. doi:10.4157/grj.51.223
Wang, Y., Sun, B. D., and Zhang, T. L. (2021). Spatio-temporal change and influencing factors of city size distribution: Global empirical research based on LandScan data. Prog. Geogr. 40 (11), 1812–1823. doi:10.18306/dlkxjz.2021.11.002
Wu, C. J. (1991). The core of study of geography: Geographical system of human-land relationship. Econ. Geogr. 11 (03), 1–6. Available at: https://oversea.cnki.net/kcms/detail/detail.aspx?dbname=CJFD1991&filename=JJDL199103002&dbcode=CJFD.
Yin, X. S., Hussain, J., and Kui, Z. (2022). The spatial distribution pattern and formation mechanism of the spatial agglomeration of Chinese higher education population: A cross-province comparison. Appl. Spat. Anal. Polic. 15 (2), 315–338. doi:10.1007/s12061-021-09392-5
Zhang, T. L., Sun, B. D., Li, W., Dan, B., and Wang, C. X. (2019). Polycentricity or dispersal? The spatial transformation of metropolitan Shanghai. Cities 95, 102352. doi:10.1016/j.cities.2019.05.021
Zhang, L. X., Ren, Z. H., Chen, B., Gong, P., Fu, H. H., and Xu, B. (2021). A prolonged artificial nighttime-light Dataset of China (1984-2020). Beijing: National Tibetan Plateau Data Center. Last Modified 03/04. doi:10.11888/Socioeco.tpdc.271202
Zhao, S., Chan, R., and Sit, K. (2003). Globalization and the dominance of large cities in contemporary China. Cities 20 (4), 265–278. doi:10.1016/S0264-2751(03)00031-3
Zhou, S. Y., Dai, J. C., and Bu, J. H. (2013). City size distributions in China 1949 to 2010 and the impacts of government policies. Cities 32, S51–S57. doi:10.1016/j.cities.2013.04.011
Keywords: city-size distribution, multiscale geographically weighted regression, spatio-temporal pattern, influencing factors, Yangtze River Delta Region
Citation: Pang Z, Zhao X and Wang C (2023) Intra city-size distribution in the Yangtze River Delta Region: Equalization or polarization. Front. Environ. Sci. 11:1138213. doi: 10.3389/fenvs.2023.1138213
Received: 05 January 2023; Accepted: 20 March 2023;
Published: 04 April 2023.
Edited by:
Imran Hanif, Government College University, Lahore, PakistanReviewed by:
Maros Finka, SPECTRA CE EU at STU in Bratislava, SlovakiaCopyright © 2023 Pang, Zhao and Wang. This is an open-access article distributed under the terms of the Creative Commons Attribution License (CC BY). The use, distribution or reproduction in other forums is permitted, provided the original author(s) and the copyright owner(s) are credited and that the original publication in this journal is cited, in accordance with accepted academic practice. No use, distribution or reproduction is permitted which does not comply with these terms.
*Correspondence: Xianchao Zhao, emhhb3hpYW5jaGFvQGh1dC5lZHUuY24=
Disclaimer: All claims expressed in this article are solely those of the authors and do not necessarily represent those of their affiliated organizations, or those of the publisher, the editors and the reviewers. Any product that may be evaluated in this article or claim that may be made by its manufacturer is not guaranteed or endorsed by the publisher.
Research integrity at Frontiers
Learn more about the work of our research integrity team to safeguard the quality of each article we publish.