 Honggen Xu1
 Donghui Zhang
 Yuanyuan Tang
 Xusheng Li
95% of researchers rate our articles as excellent or good
Learn more about the work of our research integrity team to safeguard the quality of each article we publish.
Find out more
ORIGINAL RESEARCH article
Front. Environ. Sci. , 28 July 2023
Sec. Environmental Informatics and Remote Sensing
Volume 11 - 2023 | https://doi.org/10.3389/fenvs.2023.1138177
This article is part of the Research Topic Hyperspectral Imaging in Environmental Monitoring and Analysis View all 5 articles
Soil oxides are important diagnostic indicators for soil quality assessment, and their content has a positive effect on adsorption of heavy metals, remediation of pollution, and enhancement of organic matter enrichment. Moreover, soil oxides are affected by multiple environmental factors such as soil pH, geomorphological, and elevation, and their distribution is highly regional. In this study, 421 ground soil samples and 2 hyperspectral satellite data were collected. The content distribution of 8 main oxides in soil, including SiO2, Al2O3, Fe2O3, MgO, CaO, Na2O, K2O, and Corg. were obtained according to the process of data preprocessing, spectral transformation, feature extraction, band combination, and model establishment. The results indicated that the homogenization spectral transformation method is the most suitable; The calculation accuracy of complex spectral characteristic parameters is inferior to that of characteristic bands; The difference model is more suitable for the extraction of soil oxide content in this study area; The average content of SiO2 and CaO shows a decreasing trend with the elevation increasing; The average content of SiO2 and Fe2O3 shows an upward trend with the increase of slope; East is the main geomorphic direction of soil oxide enrichment. SiO2, Al2O3, and MgO are the three soil oxides with the highest correlation. The response relationship between soil oxides, topography and pH is discussed, and the distribution rule of soil oxides and environmental determinants are obtained, which provides a set of technical schemes for digital soil research. This study can extract the content of soil components in a large area, analyze the causes, and provide a new technical scheme for soil investigation and treatment.
Soil oxides are an crucial materials of soil formed by weathering of rocks, forming the nutrients required for plant growth and food production (Richter et al., 2009). Therefore, the content of soil oxides is a key diagnostic indicator in the soil rating and classification systems of various countries (Shi X. et al., 2014; Mezned et al., 2018; Marghany, 2021; Sahwan et al., 2021). Research shows that, firstly, oxides in soil can hold certain substances. Iron aluminum oxides can adsorb organic carbon (Qi et al., 2021) and precipitate organic carbon (Xu et al., 2022). The stability of soil aggregate water is gradually enhanced with the increase of Al, Fe, Mn oxide content (Allegretta et al., 2022). It can also regulate the content of organic matter, nitrogen cycle, and other nutrients in soil effectively (Gu et al., 2019). Secondly, oxides in soil can repair heavy metal pollution. Iron manganese oxide will have oxidation-reduction effect with arsenic, reducing the degree of heavy metal pollution (Wan et al., 2021; Zhao et al., 2022). Soil oxides are also key material for remediation of antibiotic contamination in soil (Zhao et al., 2019). Iron oxides and their precursors have been widely used in in-situ remediation of heavy metal contaminated soil (Huang et al., 2021). Manganese oxide is an fatal active component of soil minerals, which can strengthen the remediation of pyrene contaminated soil (Rathod et al., 2016). Thirdly, oxides in soil are indicators of many physical and chemical parameters. Adding iron oxides can counteract the adverse effects of hydrothermal carbon on soil physical and chemical properties (Zhao et al., 2022). Amorphous aluminum oxides inhibit the decomposition of soil organic matter through adsorption and inhibition of microbial activity (Zhao et al., 2019), and soil texture can be evaluated based on soil oxide data (Richter et al., 2009).
In addition, the environmental factors closely related to the distribution of soil oxides are also significant reference information for analyzing soil composition. The research indicates that the micro terrain shaping caused by rainfall intensity has a direct impact on the soil moisture of the soil slope (P et al., 2022). The content of total arsenic in soil will gradually increase with the decrease of elevation and slope and the content of heavy metals in soil will increase under a certain range of elevation and slope (Saidi et al., 2022). Iron oxide was formed by aging of soil iron crystals, and the content of iron oxide increased with the increase of soil depth (Mendes et al., 2022). Manganese oxide is mainly affected by soil pH, and the content of manganese oxide increases with the increase of pH. The trend of soil silicon oxide and aluminum oxide is opposite, and their contents decrease with the increase of pH (Zabcic et al., 2014).
In view of this, the remote sensing technology is introduced into the extraction of soil components to give full play to its advantages of non-contact, nondestructive, large-area extraction, etc., in order to extract the soil oxide components, in order to extract the soil oxide content (Marghany, 2022b). The traditional method is to design a kilometer grid, organize manpower to take samples, and send them to professional laboratories for laboratory analysis (Rathod et al., 2016). Remote sensing technology has technical advantages in the identification, inversion, supervision, and risk assessment of soil composition (Kusuma et al., 2012; Shi X. et al., 2014; Rathod et al., 2016). Accurate extraction of iron oxide (Liu and Sun, 2019), water content (Cudahy et al., 2010), and heavy metal (Ding et al., 2022) has been achieved through the process of characteristic bands selection (Pessoa et al., 2016), building remote sensing reflectance index (Shi X.-Z. et al., 2014), establishing calculation model (Mendes et al., 2022), conducting band combination (Sellitto et al., 2009), content prediction (Li, 2020), etc. The reflectance variation of soil oxides can be obtained based on the combination of hyperspectral satellite and ground spectral data (Sahwan et al., 2021). The reflectivity of 350–570 nm band decreases, and the reflectivity of 570–2,500 nm band increases with the increase of iron oxide content (Xu et al., 2022). In terms of algorithm, both conventional regression algorithm (Lin et al., 2013; Steinberg et al., 2016; McLennan et al., 2017) and machine learning algorithm (Huang et al., 2021; Mendes et al., 2022; Saidi et al., 2022; Xu et al., 2022) have achieved good accuracy in soil oxide extraction. The response relationship between oxides and environment was explored in order to improve the applicability of spectral extraction of soil oxides. pH and soil oxides can undergo dissimilatory reduction reaction (Heller Pearlshtien and Ben-Dor, 2020), improving the absorption of soil silicon source (Rathod et al., 2016), regulate soil activity (Heller Pearlshtien and Ben-Dor, 2020), and participate in the nitrogen cycle (Dong et al., 2011). A series of new application achievements have been made in the prediction of heavy metal content in soil (Zabcic et al., 2014; Huang et al., 2021; Bouzidi et al., 2022; Tobi et al., 2022), extraction of organic matter content (Qi et al., 2021), and formulation of soil remediation plan (Velicogna et al., 2021) by analyzing the mechanism of pH according to these phenomena.
Fenghuang County, which is representative of soil composition and environment, was selected as the study area. spectral transformation, feature extraction, band combination and other algorithms were studied, and the extraction results of eight soil oxide components were obtained supported by hyperspectral satellite data and 421 ground sampling point data. The response relationship between soil oxides, topography, and pH is discussed, and the distribution rule of soil oxides and environmental determinants are obtained, which provides a set of technical schemes for digital soil research (Bouzidi et al., 2022). It is of great significance for the innovative application of remote sensing technology, especially hyperspectral technology in the field of soil investigation and resource exploration (Gu et al., 2019; Sahwan et al., 2021).
Fenghuang County, Xiangxi Tujia and Miao Autonomous Prefecture, Hunan Province, China is selected as the study area (109°18′E∼109°48′E, 27°44′N∼28°19′N). Fenghuang County is located in the hinterland of Wuling Mountains, 66 km long from north to south, 50 km wide from east to west, with a total land area of 1745 km2. The area of cultivated land is 343 km2, including 258 km2 of paddy field and 85 km2 of dry land. The altitude of the study area is 169–1059 m. The valley and hilly area in the east and southeast corner are the first step (Huang et al., 2021), the middle area from northeast to southwest is the second step, and the middle mountain area in the northwest is the third step (Figure 1). The surface material is mainly red rock with some limestone and face rock. The land is mainly planted with rice, oil crops, medicinal materials, tea, citrus, and kiwi (Figure 1).
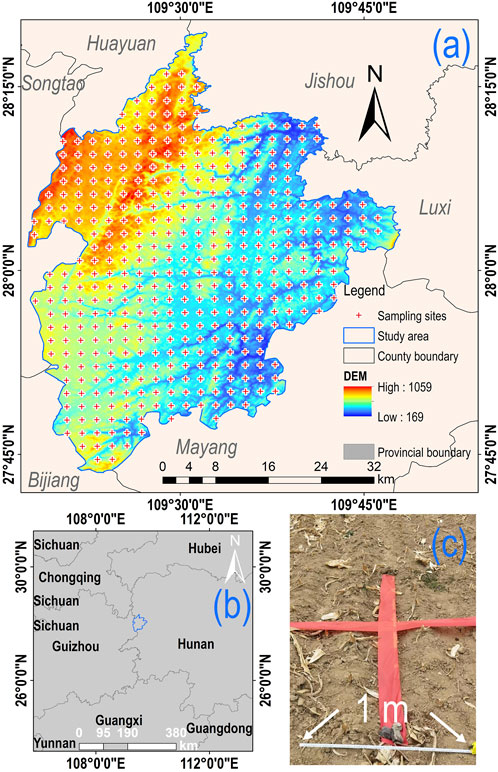
FIGURE 1. Basic information of the study area. (A) Study area and the geographical distribution of sampling sites; (B) Geographic location of the study area; (C) Located the sampling points by hand-held GPS, and the center of the crosshair is the geographic coordinate of the sampling sites. Then take soil for in-situ analysis in the region within 1 m.
Soil samples were collected from the farmland at an equal distance interval of 2 km (Laukamp, 2022). Take 0–20 cm of topsoil, collect 5 sub samples in equal amount, take 1000 g as the final sample after complete mixing, put it into a sealed polyethylene bag, and the sealed polyethylene bag shall be put into a cloth bag (Liu and Sun, 2019). After being ground, it passes through 150 μm nylon screens, attached with the unique barcode and longitude and latitude information, bagged for testing, and a total of 421 valid sample points are obtained (Leroi et al., 2008; McLennan et al., 2017). 421 samples were divided into 295 samples in the modeling set and 126 samples in the validation set at a ratio of 7:3.
Sorted and standardized after the soil samples are numbered, they are sent to Wuhan Mineral Resources Supervision and Testing Center of the Ministry of Land and Resources for testing. The content of 8 kinds of soil main oxides, such as SiO2, Al2O3, Fe2O3, MgO, CaO, Na2O, K2O, and Corg., were obtained (Rathod et al., 2016; Bouzidi et al., 2022; Laukamp, 2022). Among them, SiO2, Al2O3, Fe2O3, and K2O are detected by Axios wavelength dispersive X-ray fluorescence spectrometer according to Supporting Methods for Regional Geochemical Analysis Part 3: Determination of 24 Elements including Silicon by X-ray Fluorescence Spectrometry (standard number: WHCS-FF-CS/03-2019) (Mendes et al., 2022); MgO, CaO, and Na2O are detected by ICAP 7400 Inductively Coupled Plasma Spectrometer according to Supporting Methods for Regional Geochemical Analysis Part 2: Determination of 20 Elements including Barium by Inductively Coupled Plasma Atomic Emission Spectrometry (standard number: WHCS-FF-CS/02-2019) (Shi X. et al., 2014); Corg. was tested according to Supporting Methods for Regional Geochemical Analysis Part 18 Determination of Organic Carbon by potassium dichromate Volumetric Method (standard No.: WHCS-FF-CS/18-2019) (Qi et al., 2021). The content of 8 soil oxides basically follows the normal distribution law (Table 1).
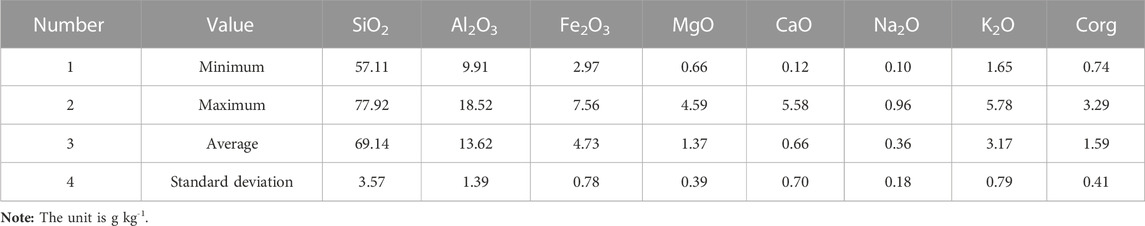
TABLE 1. Content of soil oxide in samples.
The selected Orbiter satellite OHS sensor is used for data acquisition (Steinberg et al., 2016; Ding et al., 2022). Push scan imaging mode is adopted, with single imaging of 150 km × 400 km, with a spatial resolution of 10 m, and a spectral resolution of 2.5 nm. The hyperspectral data of 32 wavebands can be obtained in the range of 400–1000 nm. The date of data acquisition is 13 September 2022, and the data of the two sceneries covers 96% of the administrative area of Fenghuang County (Figure 2).
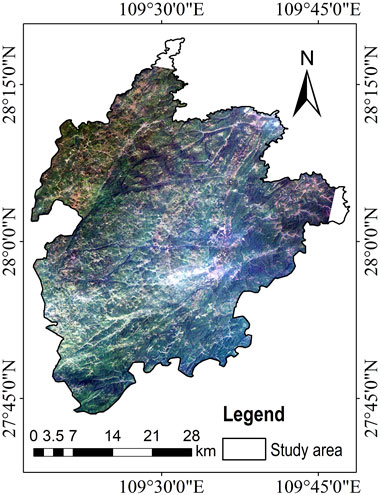
FIGURE 2. OHS hyperspectral satellite data observation.
1) Spectral transformation algorithm
The reflectance data are transformed into four types, logarithm, exponent, first-order differential, and spectral homogenization in order to highlight the soil oxide information contained in the spectral value (Ben-Dor et al., 2006). The logarithm of reflectivity will not change the relative relationship of the data, which can help stabilize the variance, so that the reflectivity is always dispersed in a manner close to the normal distribution, and the logarithmic reflectivity distribution is independent of the mean value (Steinberg et al., 2016; Gopinathan et al., 2022). Since the reflectivity is between 0 and 1, the absolute value is generally taken for ease of calculation (Huang et al., 2021). The calculation formula is:
Where,
Where,
Where,
Where,
2) Spectral feature algorithm
Five spectral characteristics are solved for the original reflectivity and the transformed reflectivity, spectral integral, absorption depth, absorption width, dispersion coefficient, and spectral variance (Leroi et al., 2008; Shi X. et al., 2014; Demattê et al., 2015; Laukamp, 2022). Spectral integration expresses the overall trend of reflectivity within the wavelength range by calculating the sum of reflectivity within the wavelength range. The calculation formula is:
Where,
Where,
Where,
3) Band combination algorithm
Spectral characteristic values are obtained, and mathematical models of soil oxide content, pH and spectral characteristic values are established on the basis of spectral transformation and spectral feature extraction (Zabcic et al., 2014). Three band combination algorithms including band difference, band ratio, and band difference and ratio are selected for content inversion and accuracy evaluation in order to facilitate the understanding and understandability of the model (Kusuma et al., 2012; Li, 2020). The band difference model can remove the interference information and obtain the spectral characteristic variable closest to the content (Sahwan et al., 2021). The calculation formula is:
Where, y is the inversion value of the oxide content in the soil; a and b are model coefficients;
Where, y is the inversion value of the oxide content in the soil; a and b are model coefficients;
Where, y is the inversion value of the oxide content in the soil; a and b are model coefficients;
4) Precision evaluation method
The determination coefficient R2 and root mean square error RMSE were selected to evaluate the accuracy of the model (Zhang et al., 2023). R2 reflects the accuracy of model fitting data and represents the proportion of variance explained by the model. The range is 0–1. The closer to 1, the stronger the ability of equation variables to interpret y, and the more suitable the model is for the data. On the contrary, the closer to 0, the worse the model fitting (Zhang et al., 2022). For example, R2 = 0.7 means that the model explains 70% of the uncertainty, and the model is acceptable. The R2 coefficient calculation formula is:
Where, n is the sample size;
Where, n is the number of sample points;
The inversion model accuracy of 8 soil components was calculated under different spectral transformation and band combination algorithms. The relatively optimal spectral model was selected based on the determination coefficient and root mean square error (Li N. et al., 2022). In general, the root mean square error of the model with high determination coefficient is low (Zhang et al., 2022). The two calculation results show obvious negative correlation effect, which facilitates the selection of optimal model (Figure 3).
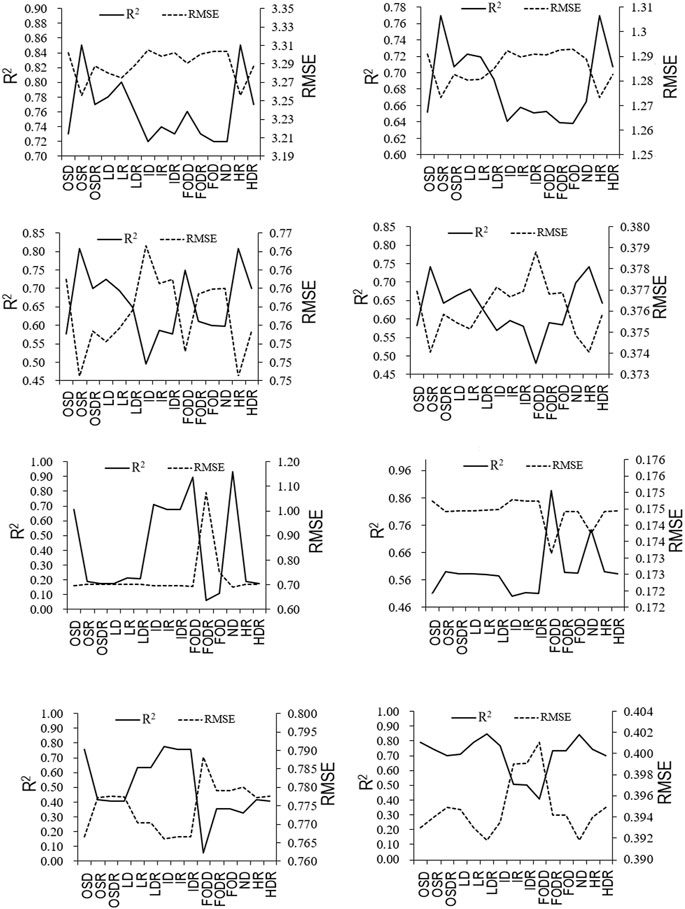
FIGURE 3. Inversion accuracy of 8 soil components.
The results indicate that (Table 2), 1) The extraction accuracy of SiO2, Fe2O3, MgO, and Na2O is higher after spectral homogenization. The accuracy of the model is higher after the first order differential treatment of CaO. K2O and Corg. also improved the accuracy of the model after exponential and logarithmic processing. Al2O3 can be directly modeled by the original spectrum; 2) Although spectral integral, absorption depth, absorption width, dispersion coefficient, spectral variance, and other characteristic variables have been solved, only the content of MgO and Corg. was calculated, and satisfactory results were obtained with such complex spectral characteristics. The other seven soil component characteristic parameters with higher accuracy are the reflectivity or reflectance conversion value of the specified wavelength (Richter et al., 2009; Brossard et al., 2016); 3) Among the 8 extraction models of soil components, 3 models with higher relative accuracy used ratio models, 4 models used difference models, and only 1 model used difference and ratio models. The result indicated that the difference model is more suitable for the extraction of soil oxide content in this study area (Saidi et al., 2022); 4) In terms of the extraction accuracy of the model, the determination coefficients of SiO2, Fe2O3, CaO and Corg. exceed 0.80. The root mean square error is mainly related to the data dispersion of the sample points (Shi X. et al., 2014). The larger the standard deviation is, the larger the root mean square error of the model is (Zhang et al., 2022).
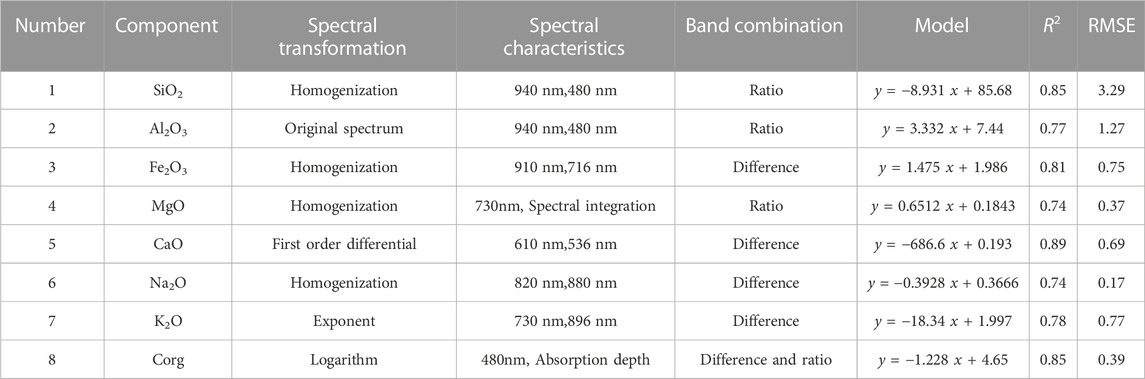
TABLE 2. Relative optimal model of soil nine components.
According to the above model, calculate the content values of 9 soil components in the study area (Figure 4). The content of SiO2 in Fenghuang County is between 20.09 and 161.20 g kg-1, with an average content of 69.24 g kg-1. The distribution is low in the northwest and high in the southeast; The content of Al2O3 ranges from 0.27 g kg-1–51.87 g kg-1, with an average content of 13.57 g kg-1. The distribution of Al2O3 is high in the northwest and gradually decreases toward the southeast; The content of Fe2O3 is between 1.813 and 13.29 g kg-1, with an average content of 3.18 g kg-1. The content in other areas is relatively uniform except for the high content in the northern mountain areas; The content of MgO ranges from 0.55 to 8.87 g kg-1, with an average content of 1.38 g kg-1. The content of MgO is high in the northwest. Other areas are closely related to the distribution of water systems and river valleys (Poppiel et al., 2020); The content of CaO is lower than 5.29 g kg-1, and the average content is 0.45 g kg-1, which is evenly distributed in the whole study area. There is no obvious regional characteristics, and the content is generally low; The content of Na2O ranges from 0.07 to 0.62 g kg-1, with an average content of 0.36 g kg-1, showing a zonal distribution to solve the north-south trend, forming a very distinctive distribution zone; K2O content ranges from 0.10 g kg-1–51.62 g kg-1, with an average content of 3.16 g kg-1. The content is low in areas with dense population activities and water systems, while the content in forest and farmland areas is high (Zabcic et al., 2014); The content of Corg. is 0.23–3.22 g kg-1, with an average content of 1.60 g kg-1. It is obviously low in urban areas, but high in mountain and forest areas (Richter et al., 2009).
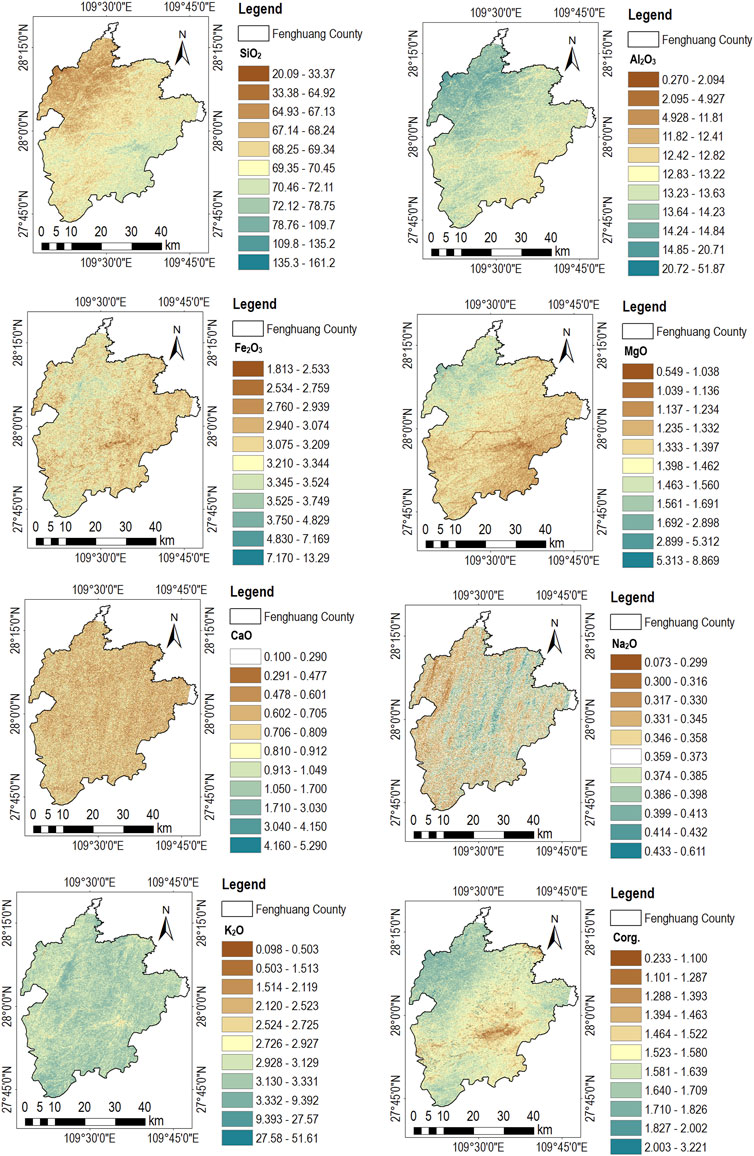
FIGURE 4. Mapping results of 8 soil components.
Elevation (Cudahy et al., 2010), slope (Saidi et al., 2022), and aspect (Leone, 2000) are selected as the potential environmental determinants of soil oxide content relationship since the study area presents typical three-level height difference characteristics, and the response relationship between each soil oxide and the surrounding environment is explored (Zhang et al., 2023). The elevation of the remote sensing image is the vertical height of each pixel from the datum plane. The elevation of the study area is divided into six grades. The relationship between the content and elevation is studied by counting the content of soil oxides in each elevation difference range (Figures 5A). The gradient of the surface unit reflects the severity of the terrain change (Shi X. et al., 2014). The gradient is divided into 9 grades according to the unequal distance by the actual situation of the study area (Ben-Dor et al., 2006). Explore the relationship between slope and soil oxides. Slope mainly affects rainfall scouring, which is valuable for studying potential catchment (Figures 5B). Slope aspect refers to the direction that the slope faces, that is, the direction of the slope (Pessoa et al., 2016). The slope aspect is divided into 9 categories. The soil composition may have a certain occurrence relationship with the slope aspect Due to the combined effect of earth rotation and sunlight (Figures 5C).
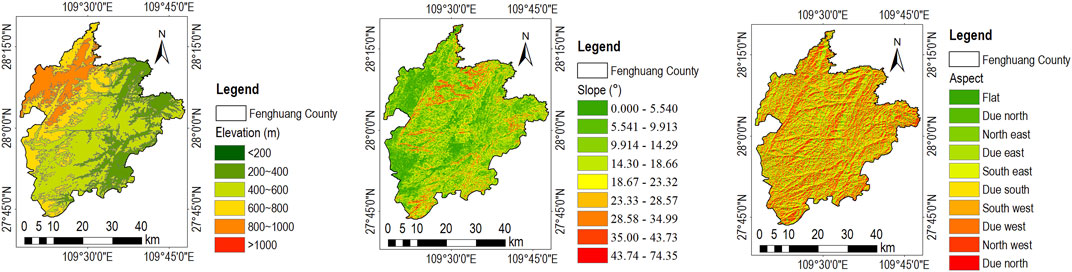
FIGURE 5. Geomorphological of the study area.
The results indicate that (Table 3): 1) The average content of SiO2 and CaO decreased significantly as the elevation increased; while the average content of Al2O3, Fe2O3, MgO, and Corg. showed an obvious upward trend (Mendes et al., 2022; Tobi et al., 2022); There is no clear linear relationship between the average content of Na2O and K2O and the elevation, and the maximum value occurs in the lower elevation range (Poppiel et al., 2020; Qi et al., 2021). 2) In terms of the relationship between soil oxide content and slope, the average content of SiO2 and Fe2O3 shows an obvious upward trend with the increase of slope; The average content of Al2O3 decreased firstly and then increased; The average contents of MgO, Na2O, K2O, and Corg. are almost not affected by the slope; The average content of CaO shows a decreasing trend (McLennan et al., 2017). 3) In terms of the relationship between soil oxide content and slope aspect, the average content of SiO2 is relatively highest in the northwest direction, reaching 69.66 g kg-1; The relative highest average content of Al2O3 is due east, reaching 13.71 g kg-1; The relative highest average content of Fe2O3 is due north, reaching 3.20 g kg-1; The relative highest average content of MgO is due east, reaching 1.41 g kg-1; The average content of CaO is relatively highest in the direction of due east and southeast, both 0.69 g kg-1 (Shi X.-Z. et al., 2014); The relatively highest average content of Na2O is also in the direction of due east and southeast, reaching 0.37 g kg-1; The relative highest average content of K2O is also in the direction of due east and southeast, reaching 3.19 g kg-1; The average content of Corg. has no clear directivity, and the content is almost 1.60 g kg-1. To sum up, 5 kinds have the highest average content in the direction of due east, 1 kind of northwest, 1 kind of due north, and 1 kind of non-directivity among the 8 kinds of soil oxides, indicating that the due east direction of the study area is the main geomorphic direction of soil oxide enrichment (Sellitto et al., 2009).
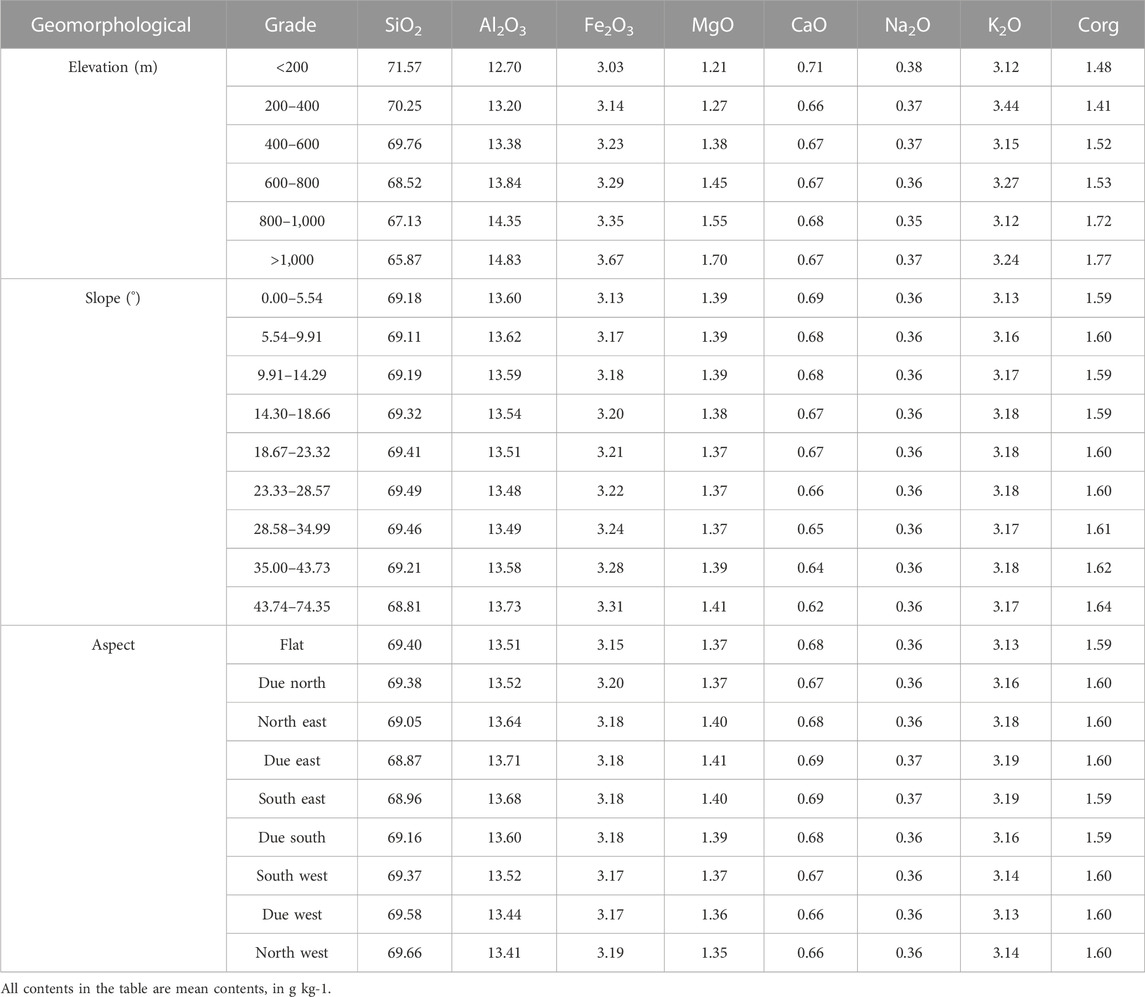
TABLE 3. Soil oxide content under different geomorphological.
The pH distribution map of the study area was extracted in order to explore the action mechanism of the above soil oxides on soil pH (Zabcic et al., 2014) (Figure 6). The pH value ranges from 3.35 to 13.83, with an average value of 6.22, and the soil is slightly acidic. It is also found that the distribution of soil pH is related to many factors such as landform (McLennan et al., 2017), human activities (Li, 2020), and river courses (Kusuma et al., 2012).
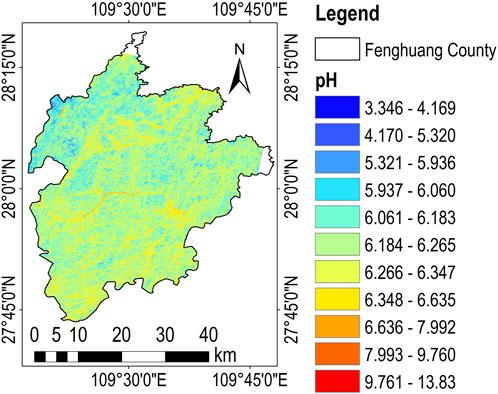
FIGURE 6. pH distribution map of study area.
The covariance of the calculated results of 8 soil oxide contents and pH values is divided by the standard deviation to obtain the correlation coefficients of the above 8 calculated results, that is, the special covariance after standardization in order to master the relationship between soil pH and oxides (Zhang et al., 2023). The correlation coefficient is between ±1, which reflects the correlation of various components since the range of covariance ranges from positive infinity to negative infinity (Li X. et al., 2022) (Figure 7). The results indicated that, 1) the most closely related component to soil pH was Fe2O3, with a positive correlation coefficient of 0.49. The correlation coefficients of other soil oxides were lower than the absolute value of 0.40; 2) In terms of correlation of eight soil oxides, the negative correlation between SiO2 and Al2O3 reached 0.91, the negative correlation between SiO2 and MgO reached 0.91, and the positive correlation between Al2O3 and MgO reached 0.95, making them the three soil oxides with the highest correlation; 3) The soil oxides closely related to the content of Corg. are SiO2, Al2O3 and MgO, and their absolute correlation coefficients exceed 0.50, indicating the occurrence form of soil carbon element, which exists in the form of combination with silicate; 4) The correlation coefficients of CaO, Na2O, K2O and other soil oxides are very low, especially CaO compared with other soil oxides. All the correlation coefficients are close to 0, indicating that these soil oxides are highly independent, and the content is independent of other soil oxides (Richter et al., 2009; Shi X. et al., 2014; Sahwan et al., 2021; Saidi et al., 2022).
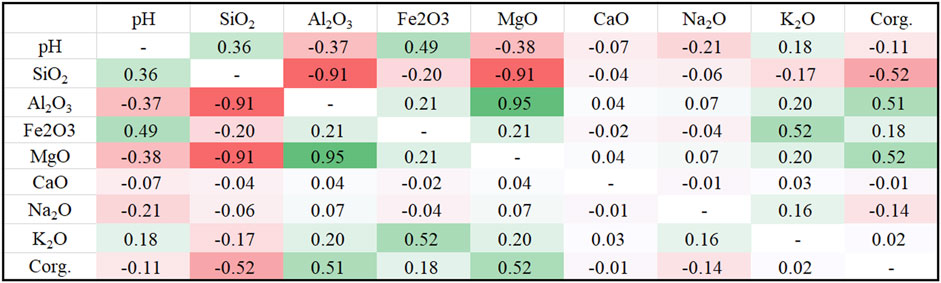
FIGURE 7. Correlation coefficient of 8 soil components.
In this paper, by measuring the content of 8 main oxides in 421 soil samples and the corresponding soil pH value (Zabcic et al., 2014), with the support of hyperspectral satellite data (Steinberg et al., 2016; Poppiel et al., 2020), four spectral transformation methods (Gu et al., 2019; Huang et al., 2021; Zhao et al., 2022), five spectral feature extraction algorithms (Heller Pearlshtien and Ben-Dor, 2020; Huang et al., 2021), and three spectral band combination methods (Ben-Dor et al., 2006; Li, 2020) were studied to extract the content information in the whole region. A comprehensive technical method system suitable for satellite hyperspectral soil composition retrieval was established, and the quantitative extraction of key soil components was realized (Leone, 2000; Rathod et al., 2016). The accuracy of the model is verified, and the method is proved to be efficient and reliable taking the determination coefficient R2 and root mean square error RMSE as indicators (Mezned et al., 2018). It saves time, labor and labor, and has a high economy compared with the traditional assay and interpolation methods (Marghany, 2021).
The research proves that different soil oxides have different applicable spectral transformation, spectral characteristics and band combination methods, so separate modeling is required. The content of soil oxides in the whole area was calculated on this basis, and the distribution law was obtained according to the distribution law (Zhang et al., 2023). The elevation, slope, aspect, and pH value are selected to deduce the relationship between soil oxide content and the environment in order to further grasp the determining factors of content distribution, and the extent to which each soil component is affected by the environment and whether it determines the soil acidity and alkalinity are concluded (Zhao et al., 2019). The above achievements confirm the previous conclusions on soil composition (Dong et al., 2011), acidity and alkalinity (Zabcic et al., 2014), remediation (Li, 2020), water and soil loss (Lin et al., 2013), and content reduction mechanism (Mendes et al., 2022), and play a good demonstration role in the further application of new technologies in this field (Zhao et al., 2019; Marghany M., 2022). In a word, with the gradual promotion of satellite hyperspectral data, research in related fields will become one of the mainstream directions of digital soil research for a long time in the future.
The original contributions presented in the study are included in the article/supplementary material, further inquiries can be directed to the corresponding author.
HX: Conceptualization, methodology, software, validation, formal analysis, investigation, data curation, writing original draft, and writing review and editing. DZ, YT: Conceptualization, methodology, validation, formal analysis, investigation, data curation, writing original draft, writing review, editing, project administration, and funding acquisition. LD, WK: Software, validation, formal analysis, investigation, and resources. XL: Methodology, software, resources, and editing, supervision, formal analysis, investigation, and data curation. All authors contributed to the article and approved the submitted version.
This research was funded by the Survey of Land Quality in Western Hunan of China Geological Survey Geochemical (ZD20220214), the National Natural Science Foundation of China (No. 42272346), the Innovation Team of XPCC’s Key Area (No. 2018CB004), and the Major Projects of High-Resolution Earth Observation (No. 30-H30C01-9004-19/21).
We would like to thank the editors and reviewers for their valuable opinions and suggestions that improved this research.
The authors declare that the research was conducted in the absence of any commercial or financial relationships that could be construed as a potential conflict of interest.
All claims expressed in this article are solely those of the authors and do not necessarily represent those of their affiliated organizations, or those of the publisher, the editors and the reviewers. Any product that may be evaluated in this article, or claim that may be made by its manufacturer, is not guaranteed or endorsed by the publisher.
The Supplementary Material for this article can be found online at: https://www.frontiersin.org/articles/10.3389/fenvs.2023.1138177/full#supplementary-material
FODDR, First order differential difference and ratio; FODD, First order differential difference; FODR, First order differential ratio; LD, Logarithmic difference; LR, Logarithmic ratio; LDR, Logarithmic difference and ratio; ID, Index difference; IR, Index ratio; IDR, Index difference and ratio; ND, Normalized difference; HR, Homogenization ratio; HDR, Homogenization difference and ratio; OSD, Original spectral difference; OSR, Original spectral ratio; OSDR, Original spectral difference and ratio.
Allegretta, I., Legrand, S., Alfeld, M., Gattullo, C. E., Porfido, C., Spagnuolo, M., et al. (2022). SEM-EDX hyperspectral data analysis for the study of soil aggregates. Geoderma 406, 115540. doi:10.1016/j.geoderma.2021.115540
Ben-Dor, E., Levin, N., Singer, A., Karnieli, A., Braun, O., and Kidron, G. J. (2006). Quantitative mapping of the soil rubification process on sand dunes using an airborne hyperspectral sensor. Geoderma 131, 1–21. doi:10.1016/j.geoderma.2005.02.011
Bouzidi, W., Mezned, N., and Abdeljaoued, S. (2022). Mineralogical mapping using EO-1 Hyperion data for iron mine identification. J. Appl. Rem. Sens. 16. doi:10.1117/1.JRS.16.024514
Brossard, M., Marion, R., and Carrére, V. (2016). Deconvolution of SWIR reflectance spectra for automatic mineral identification in hyperspectral imaging. Remote Sens. Lett. 7, 581–590. doi:10.1080/2150704X.2016.1168946
Cudahy, T., Jones, M., Thomas, M., Cocks, P., Agustin, F., Caccetta, M., et al. (2010). “Mapping soil surface mineralogy at tick hill, north-western queensland, Australia, using airborne hyperspectral imagery,” in Proximal soil sensing. Editors R. A. Viscarra Rossel, A. B. McBratney, and B. Minasny (Dordrecht: Springer Netherlands), 211–229. doi:10.1007/978-90-481-8859-8_18
Dai, X., Fan, W., Shan, Y., Gao, Y., Liu, C., Nie, R., et al. (2022). LAI-based phenological changes and climate sensitivity analysis in the three-river headwaters region. Remote Sens. 14, 3748. doi:10.3390/rs14153748
Demattê, J. A. M., Alves, M. R., Gallo, B. C., Fongaro, C. T., Souza, A. B. e., Romero, D. J., et al. (2015). Hyperspectral remote sensing as an alternative to estimate soil attributes. Rev. CIÊNCIA AGRONÔMICA 46. doi:10.5935/1806-6690.20150001
Ding, S., Zhang, X., Sun, W., Shang, K., and Wang, Y. (2022). Estimation of soil lead content based on GF-5 hyperspectral images, considering the influence of soil environmental factors. J. Soils Sediments 22, 1431–1445. doi:10.1007/s11368-022-03169-0
Dong, H., Chen, C., Wang, J., Qin, Q., Jiang, H., Zhang, N., et al. (2011). “Study on quantitative retrieval of soil nutrients,” in 2011 IEEE international geoscience and remote sensing symposium (Vancouver, BC, Canada: IEEE), 3330–3333. doi:10.1109/IGARSS.2011.6049997
Gopinathan, P., Priyadarsi, R., Subramani, T., and Karunanidhi, D. (2022). Detection of iron-bearing mineral assemblages in Nainarmalai granulite region, south India, based on satellite image processing and geochemical anomalies. Environ. Monit. Assess. 194, 866. doi:10.1007/s10661-022-10570-2
Gu, X., Wang, Y., Sun, Q., Yang, G., and Zhang, C. (2019). Hyperspectral inversion of soil organic matter content in cultivated land based on wavelet transform. Comput. Electron. Agric. 167, 105053. doi:10.1016/j.compag.2019.105053
Heller Pearlshtien, D., and Ben-Dor, E. (2020). Effect of organic matter content on the spectral signature of iron oxides across the VIS–nir spectral region in artificial mixtures: An example from a red soil from Israel. Remote Sens. 12, 1960. doi:10.3390/rs12121960
Huang, Z., Huang, W., Li, S., Ni, B., Zhang, Y., Wang, M., et al. (2021). Inversion evaluation of rare earth elements in soil by visible-shortwave infrared spectroscopy. Remote Sens. 13, 4886. doi:10.3390/rs13234886
Kusuma, K. N., Ramakrishnan, D., and Pandalai, H. S. (2012). Spectral pathways for effective delineation of high-grade bauxites: A case study from the savitri river basin, Maharashtra, India, using EO-1 hyperion data. Int. J. Remote Sens. 33, 7273–7290. doi:10.1080/01431161.2012.700131
Laukamp, C. (2022). “Geological mapping using mineral absorption feature-guided band-ratios applied to prisma satellite hyperspectral level 2D imagery,” in Igarss 2022 - 2022 IEEE international geoscience and remote sensing symposium (Kuala Lumpur, Malaysia: IEEE), 5981–5984. doi:10.1109/IGARSS46834.2022.9884015
Leone, A. (2000). Multivariate analysis of laboratory spectra for the assessment of soil development and soil degradation in the southern apennines (Italy). Remote Sens. Environ. 72, 346–359. doi:10.1016/S0034-4257(99)00110-8
Leroi, V., Bibring, J. P., and Berthé, M. (2008). in MicrOmega: A VIS/NIR hyperspectral microscope for in situ analysis in space. Editor J. M. Oschmann, M. W. M. de Graauw, and H. A. MacEwen (Marseille, France, 70104C. doi:10.1117/12.787250
Li, N., Ning, Z., Chen, M., Wu, D., Hao, C., Zhang, D., et al. (2022a). Satellite and machine learning monitoring of optically inactive water quality variability in a tropical river. Remote Sens. 14, 5466. doi:10.3390/rs14215466
Li, X., Zhang, D., Jiang, C., Zhao, Y., Li, H., Lu, D., et al. (2022b). Comparison of lake area extraction algorithms in qinghai-tibet plateau leveraging google earth engine and landsat-9 data. Remote Sens. 14, 4612. doi:10.20944/preprints202206.0020.v1
Li, Z. (2020). Selenium-enriched soil mapping using airborne SASI images. Geoderma 363, 114133. doi:10.1016/j.geoderma.2019.114133
Lin, C., Zhou, S.-L., and Wu, S.-H. (2013). Using hyperspectral reflectance to detect different soil erosion status in the subtropical hilly region of southern China: A case study of changting, fujian Province. Environ. Earth Sci. 70, 1661–1670. doi:10.1007/s12665-013-2253-y
Liu, J., and Sun, Z. (2019). Study on hyperspectral characteristics and content estimation of soil iron oxide. IOP Conf. Ser. Earth Environ. Sci. 300, 022147. doi:10.1088/1755-1315/300/2/022147
Marghany, M. (2022a). “Chapter 7 - texture and quantum entropy algorithms for mineral and hydrocarbon explorations in synthetic aperture radar images,” in Advanced algorithms for mineral and hydrocarbon exploration using synthetic aperture radar. Editor M. Marghany (Elsevier), 203–224. doi:10.1016/B978-0-12-821796-2.00005-7
M. Marghany (Editor) (2022b). “Front matter,” Advanced algorithms for mineral and hydrocarbon exploration using synthetic aperture radar (Elsevier). doi:10.1016/B978-0-12-821796-2.01001-6
McLennan, S. M., Giles, D., and Hill, S. M. (2017). Late Miocene-Pliocene coastal acid sulphate system in southeastern Australia and implications for genetic mechanisms of iron oxide induration. Geoderma 294, 1–18. doi:10.1016/j.geoderma.2016.12.021
Mendes, W. de S., Demattê, J. A. M., Minasny, B., Silvero, N. E. Q., Bonfatti, B. R., Safanelli, J. L., et al. (2022). Free iron oxide content in tropical soils predicted by integrative digital mapping. Soil Tillage Res. 219, 105346. doi:10.1016/j.still.2022.105346
Mezned, N., Bouzidi, W., and Abdeljaouad, S. (2018). “Hyperspectral reflectance Spectroscopy and X-ray diffraction for iron minerals characterization in northern Tunisia,” in Earth resources and environmental remote sensing/GIS applications IX. Editors U. Michel,, and K. Schulz (Berlin, Germany: SPIE), 61. doi:10.1117/12.2325635
Pessoa, L. G. M., Freire, M. B. G. D. S., Wilcox, B. P., Green, C. H. M., De Araújo, R. J. T., and De Araújo Filho, J. C. (2016). Spectral reflectance characteristics of soils in northeastern Brazil as influenced by salinity levels. Environ. Monit. Assess. 188, 616. doi:10.1007/s10661-016-5631-6
Poppiel, R. R., Lacerda, M. P. C., Rizzo, R., Safanelli, J. L., Bonfatti, B. R., Silvero, N. E. Q., et al. (2020). Soil color and mineralogy mapping using proximal and remote sensing in midwest Brazil. Remote Sens. 12, 1197. doi:10.3390/rs12071197
Qi, J.-Y., Zhao, X., He, C., Virk, A. L., Jing, Z.-H., Liu, Q.-Y., et al. (2021). Effects of long-term tillage regimes on the vertical distribution of soil iron/aluminum oxides and carbon decomposition in rice paddies. Sci. Total Environ. 776, 145797. doi:10.1016/j.scitotenv.2021.145797
Rathod, P. H., Müller, I., Van der Meer, F. D., and de Smeth, B. (2016). Analysis of visible and near infrared spectral reflectance for assessing metals in soil. Environ. Monit. Assess. 188, 558. doi:10.1007/s10661-016-5568-9
Richter, N., Jarmer, T., Chabrillat, S., Oyonarte, C., Hostert, P., and Kaufmann, H. (2009). Free iron oxide determination in mediterranean soils using diffuse reflectance spectroscopy. Soil Sci. Soc. Am. J. 73, 72–81. doi:10.2136/sssaj2008.0025
Sahwan, W., Lucke, B., Sprafke, T., Vanselow, K. A., and Bäumler, R. (2021). Relationships between spectral features, iron oxides and colours of surface soils in northern Jordan. Eur. J. Soil Sci. 72, 80–97. doi:10.1111/ejss.12986
Saidi, S., Ayoubi, S., Shirvani, M., Azizi, K., and Zeraatpisheh, M. (2022). Comparison of different machine learning methods for predicting cation exchange capacity using environmental and remote sensing data. Sensors 22, 6890. doi:10.3390/s22186890
Sellitto, V. M., Fernandes, R. B. A., Barrón, V., and Colombo, C. (2009). Comparing two different spectroscopic techniques for the characterization of soil iron oxides: Diffuse versus bi-directional reflectance. Geoderma 149, 2–9. doi:10.1016/j.geoderma.2008.11.020
Shi, X., Aspandiar, M., Lau, I. C., and Oldmeadow, D. (2014a). Assessment of Acid Sulphate Soil both on surface and in subsurface using hyperspectral data. Can. J. Remote Sens. 39, 468–480. doi:10.5589/m13-054
Shi, X.-Z., Aspandiar, M., and Oldmeadow, D. (2014b). Reflectance spectral characterization and mineralogy of acid sulphate soil in subsurface using hyperspectral data. Int. J. Sediment Res. 29, 149–158. doi:10.1016/S1001-6279(14)60031-7
Steinberg, A., Chabrillat, S., Stevens, A., Segl, K., and Foerster, S. (2016). Prediction of common surface soil properties based on vis-NIR airborne and simulated EnMAP imaging spectroscopy data: Prediction accuracy and influence of spatial resolution. Remote Sens. 8, 613. doi:10.3390/rs8070613
Tobi, A., Essalhi, M., El Azmi, D., Bouzekraoui, M., and El Ouaragli, B. (2022). Prospección minera de la mineralización de óxidos de Fe-Mn-Pb en Jbel Skindis (Alto Atlas Oriental, Marruecos) basada en teledetección y SIG. estudgeol 78, e147. doi:10.3989/egeol.44641.614
Velicogna, J. R., Schwertfeger, D., Jesmer, A., Beer, C., Kuo, J., DeRosa, M. C., et al. (2021). Soil invertebrate toxicity and bioaccumulation of nano copper oxide and copper sulphate in soils, with and without biosolids amendment. Ecotoxicol. Environ. Saf. 217, 112222. doi:10.1016/j.ecoenv.2021.112222
Wan, Y., Fan, Y., and Jin, M. (2021). Application of hyperspectral remote sensing for supplementary investigation of polymetallic deposits in Huaniushan ore region, northwestern China. Sci. Rep. 11, 440. doi:10.1038/s41598-020-79864-0
Xu, S., Zhao, Y., Wang, M., and Shi, X. (2022). A comparison of machine learning algorithms for mapping soil iron parameters indicative of pedogenic processes by hyperspectral imaging of intact soil profiles. Eur. J Soil Sci. 73. doi:10.1111/ejss.13204
Zabcic, N., Rivard, B., Ong, C., and Mueller, A. (2014). Using airborne hyperspectral data to characterize the surface pH and mineralogy of pyrite mine tailings. Int. J. Appl. Earth Observation Geoinformation 32, 152–162. doi:10.1016/j.jag.2014.04.008
Zhang, D., Zhang, L., Sun, X., Gao, Y., Lan, Z., Wang, Y., et al. (2022). A new method for calculating water quality parameters by integrating space–ground hyperspectral data and spectral-in situ assay data. Remote Sens. 14, 3652. doi:10.3390/rs14153652
Zhang, D., Zhu, Z., Zhang, L., Sun, X., Zhang, Z., Zhang, W., et al. (2023). Response of industrial warm drainage to tide revealed by airborne and sea surface observations. Remote Sens. 15, 205. doi:10.3390/rs15010205
Zhao, F., Yang, L., Chen, L., Xiang, Q., Li, S., Sun, L., et al. (2019). Soil contamination with antibiotics in a typical peri-urban area in eastern China: Seasonal variation, risk assessment, and microbial responses. J. Environ. Sci. 79, 200–212. doi:10.1016/j.jes.2018.11.024
Keywords: soil oxides, hyperspectral remote sensing, geomorphological, quantitative remote sensing, correlation
Citation: Xu H, Zhang D, Tang Y, Dai L, Kong W and Li X (2023) Response of soil oxides in complex terrain region to environment revealed by hyperspectral observations. Front. Environ. Sci. 11:1138177. doi: 10.3389/fenvs.2023.1138177
Received: 05 January 2023; Accepted: 03 July 2023;
Published: 28 July 2023.
Edited by:
Roozbeh Rajabi, Qom University of Technology, IranReviewed by:
Mahsa Nakhostinrouhi, GFZ German Research Centre for Geosciences, GermanyCopyright © 2023 Xu, Zhang, Tang, Dai, Kong and Li. This is an open-access article distributed under the terms of the Creative Commons Attribution License (CC BY). The use, distribution or reproduction in other forums is permitted, provided the original author(s) and the copyright owner(s) are credited and that the original publication in this journal is cited, in accordance with accepted academic practice. No use, distribution or reproduction is permitted which does not comply with these terms.
*Correspondence: Donghui Zhang, emhhbmdkb25naHVpQGFpcmNhcy5hYy5jbg==
Disclaimer: All claims expressed in this article are solely those of the authors and do not necessarily represent those of their affiliated organizations, or those of the publisher, the editors and the reviewers. Any product that may be evaluated in this article or claim that may be made by its manufacturer is not guaranteed or endorsed by the publisher.
Research integrity at Frontiers
Learn more about the work of our research integrity team to safeguard the quality of each article we publish.