 Miao miao Tang
 Dong Xu2
94% of researchers rate our articles as excellent or good
Learn more about the work of our research integrity team to safeguard the quality of each article we publish.
Find out more
ORIGINAL RESEARCH article
Front. Environ. Sci., 18 April 2023
Sec. Environmental Economics and Management
Volume 11 - 2023 | https://doi.org/10.3389/fenvs.2023.1137570
This article is part of the Research TopicLow-Carbon Transformation for Sustainable DevelopmentView all 14 articles
Low-carbon economy is not only an important topic for the globe but also a serious challenge for China with its economy entering a new level. Based on the DEA-undesirable model and Malmquist index model, urban agglomeration of the Yangtze River Delta and the Guangdong–Hong Kong–Macao Greater Bay Area from 2010 to 2021 were selected as research samples. Based on that, a panel generalized method of moments model was constructed to analyze the effects of the education level, technological development, and their interaction on urban carbon emission efficiency. It found that 1) the carbon emission efficiency of the Yangtze River Delta and the Guangdong–Hong Kong–Macao Greater Bay Area urban agglomerations shows a steady growth trend, but the overall level is low and there are regional differences, among which pure technical efficiency mainly limits the improvement of comprehensive efficiency; 2) the education level and technological development have a high positive correlation on urban carbon emission, and their interaction is conducive to the improvement of carbon emission efficiency. The carbon emission efficiency has a significant advantage under the influence of control variables, such as the economic development level, industrial structure upgrading, opening-up degree, and Internet penetration rate. 3) According to the economic dimension and population dimension, the samples of the Yangtze River Delta and the Guangdong–Hong Kong–Macao Greater Bay Area were divided into large cities and small cities, and regression results showed no substantial changes. It shows that the research conclusion is scientific. According to the aforementioned conclusion, this paper puts forward corresponding countermeasures and suggestions.
Since the reform and opening up, China has made remarkable achievements with the transition dividend, investment dividend, and human capital dividend brought about by market-oriented reforms. Urbanization has increasingly amplified the contradiction between the economic development and ecological environment with deteriorating environment and soaring pollutant emission. Among the main pollutants, carbon dioxide is the main culprit causing the greenhouse effect, destroying the ecological environment and hindering sustainable development. Carbon emission efficiency, which can accurately estimate carbon dioxide emissions per unit of GDP, draws many academics’ attention, who study the environment as a crucial component of evaluating environmental performance. Therefore, how to improve carbon emission efficiency has become a problem that people need to face. In order to identify the ways to achieve carbon sustainability, governments and academics are committed to researching the factors that affect carbon emission efficiency.
Theoretically, carbon emission is the result of many factors such as the development stage, economic structure, and consumption pattern. As the core driving force in promoting total factor production and economic transformation, technological innovation is considered as the main factor affecting carbon emission. The new endogenous growth theory holds that modern economic growth mainly comes from human capital, such as education, training, further learning, medical treatment, and migration, among which education is the main way of human capital accumulation. Therefore, it is imperative to explore the key roles of education and technology on carbon emission efficiency.
To create high-quality development of agglomeration economy, China has been devoted to optimizing the internal structure of urban agglomeration and enhancing the capacity of innovative policy to build an ecological security barrier (Guo et al., 2022). The Yangtze River Delta and the Guangdong–Hong Kong–Macao Greater Bay Area are not the only regions with the most prosperous economy, the highest level of development in education and science and technology, and the fastest speed of transformation and upgradation of the industrial structure in China but also low-carbon pilot cities with the theme of replacing old and new driving forces, which are highly representative. Thus, this paper chooses the two urban agglomerations to analyze the effect of technological innovation on the carbon emission.
At present, China is facing the dual challenge of balancing economic development and controlling carbon emissions. It is necessary to put forward this question: Can the “upgrading of education” promote the carbon emission efficiency of urban agglomeration? Can technology service industry be used as the future undertaker of economic growth to improve urban carbon emission efficiency? Based on these two problems, this paper adopted the DEA-undesirable model and the Malmquist index model, using the Yangtze River Delta and the Guangdong–Hong Kong–Macao Greater Bay Area urban agglomeration during 2010–2021, as research samples. Based on this, a panel tobit model was constructed to systematically investigate the impacts of the education level, technological development, and their interaction on the carbon emission efficiency of the Yangtze River Delta and the Guangdong–Hong Kong–Macao Greater Bay Area urban agglomeration.
This paper is structured as follows: Section 2 reviews the previous research studies. Section 3 puts forward the hypothesis of the influencing mechanisms of technological innovation and education on carbon emission efficiency. Section 4 illustrates the methods and data sources, followed by the research results in Section 5. Section 6 presents the conclusion, including the research limitations and prospects.
The existing literature has fully demonstrated the important impact of carbon emission efficiency on economic growth and puts forward the concepts of carbon productivity (Wang et al., 2017), carbon emission intensity (Wang and Zheng, 2020), carbon emission performance (Wang et al., 2020), and carbon emission accounting (Hu et al., 2022). These studies are closely related to the coordinated realization of sustainable economic development and carbon reduction in the Report on The Work of The Government of 2021. Carbon emission efficiency fully expresses the supporting and leading role of carbon reduction in high-quality economic development, consistent with the relevant discussion of opening up the path of green and low-carbon transformation development with Chinese characteristics in the academic circle and police departments.
On the whole, the previous studies on the influencing factors of carbon emission efficiency are mostly conducted by generalized method of moments (GMM) estimation in academia, mainly including the urbanization rate (Zhou et al., 2022), innovation input (Gao et al., 2019), energy intensity (Lv et al., 2015), and environmental regulation (Long et al., 2013). Existing studies on higher education promoting the development of a low-carbon economy have been relatively mature. Educational level is an important factor to stimulate public awareness of environmental protection and to fulfill social responsibilities. Some scholars make use of CSS2013 data for research, reflecting that the more educated the workers are, the more likely they are to comply with environmental laws and regulations and fulfill legal obligations of environmental protection.
The new information technologies featuring big data, cloud computing, artificial intelligence, and the Internet of Things are the core factors driving the rising of the sixth Kondratyev long wave cycle, with the carbon emission efficiency of cities greatly improved. Empirical studies by using dynamic spatial econometric models show the influence of technological innovation on clean combustion and flexible use of fossil energy. Also, emission reduction can be achieved by combining carbon capture, usage, and storage (CCUS) technology and other means (Yang et al., 2021). Some scholars advocate the concept of low-carbon environmental protection “park city” and propose that the economic system of low-carbon development should embrace technological innovation. Carbon emissions can be reduced by strengthening key generic technologies of carbon neutrality and zero-carbon industrial process reengineering technologies through technology fusion and process optimization (Philip et al., 2022). In addition, other scholars’ studies on the impact of technological development on industrial economic efficiency (Li, 2019), regional innovation performance (Hajek et al., 2019), environmental economy, and sustainable development (Yang et al., 2020) also provide an important reference for this paper.
It can be seen that there is a close correlation between the education level, technological development, and low-carbon economy. The academic research on low-carbon economy is mainly devoted to carbon emission efficiency, with the scope limited at several aspects: first, most existing research only involved the carbon emission management intensity or single-factor carbon emission efficiency, with little insight into the total factor carbon; second, the third-party effect of the education level on technological innovation and carbon emission efficiency remains to be examined; third, in terms of the research scale, most studies are extensively carried out from the international, national, and provincial levels, cities, and enterprises, while there are few studies based on economic circle and urban agglomeration. Different from existing research studies, this paper specifies the scale of samples with urban agglomerations through the construction of GMM estimation to analyze the impacts of the education level, technological development, and their interaction on urban carbon emission efficiency.
The influencing mechanism of education and technology on carbon emission efficiency is explained in Figure 1.
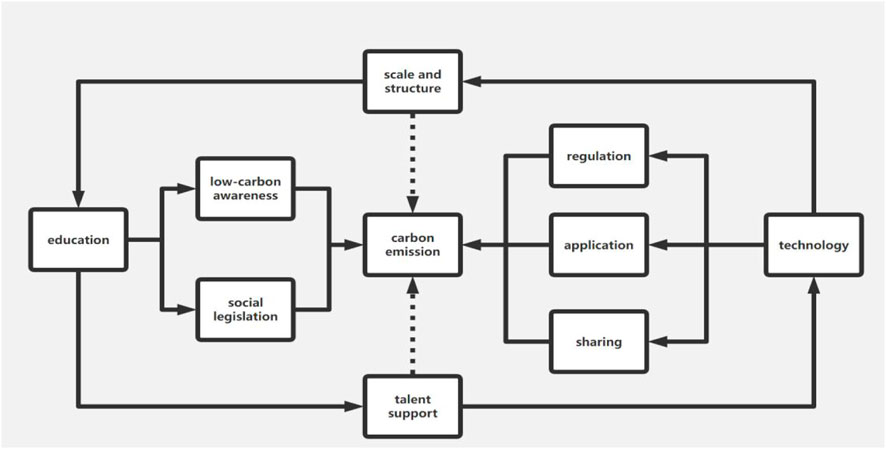
FIGURE 1. Influencing mechanism of education and technology on carbon emission.
First, education is conducive to the improvement of carbon emission efficiency. As the public education level and understanding of environmental protection laws have increased, the public now frequently uses legal ways to persuade polluters to cut carbon emissions when their operations endanger public health. Second, educated human capital can enhance public awareness of low-carbon alternatives. To some extent, higher education groups find it easier to live a low-carbon lifestyle. They can convert theoretical knowledge into practice and enhance public awareness of low-carbon living through professional human capital, thus contributing to carbon emission reduction.
Therefore, the first hypothesis of this paper can be concluded as follows: H1: Education is conducive to improving urban carbon emission efficiency.
First, the development of scientific technology has opened up new channels of network supervision. 5G and IPV6 technologies have dramatically changed the means, medium, and form of information dissemination. As the public increasingly calls for the right to know and supervise the environment, they can participate in the environmental governance through the environmental reporting hotline “12369,″ national government affairs service platforms, official Weibo and WeChat accounts, and other online channels. The pollution emission behaviors can be restricted to some extent when the reputation and stock price of polluters get affected by a large amount of pollutants produced, discharged, and the degree of environmental pollution. Second, the development and application of low-carbon technologies will reduce the carbon emission intensity. Technological innovation can produce profound changes in the future energy structure and utilization. For example, “electric vehicles,” “semiconductor lighting,” “clean coal utilization,” and other new energy projects have improved the efficiency of urban carbon emission. Third, technological development improves urban carbon emission efficiency through sharing effects, obtaining innovation advantages, and realizing the improvement of carbon emission efficiency. The development of science and technology makes the connection between cities closer and makes use of formal and informal relationships to effectively share and integrate human, financial, material, and other resources, so as to gain innovative advantages and realize the improvement of carbon emission efficiency.
On this basis, the second hypothesis can be drawn as follows: H2: Technology is conducive to improving urban carbon emission efficiency.
As a revolution in the field of social production, “science and technology innovation plus education” plays an important role in the allocation of educational resources. On the one hand, higher education, acting as the incubator of talents and knowledge, meets the demands of society for innovative professionals in line with the times. In the process, a new educational ecosystem is often built where higher education becomes a gathering area and concentration of innovation, adhering to the educational concept of flexibility, openness, and diversity. On the other hand, the structure and scale of higher education can be adjusted through the employment substitution effect and compensation effect. In other words, the combination of science and technology innovation and education replaces the ordinary labor force with artificial intelligence robots to a great extent and energizes low-carbon economy through distance education and the integration of educational resources across time and space, which gives rise to the third hypothesis of this paper: H3: The deep integration of “technological innovation plus education” prompts urban carbon emission efficiency.
Data envelopment analysis (DEA) has the defect of scaling up or reducing in the same proportion based on radial and angle problems. Traditional non-parametric DEA methods often overestimate the efficiency of the decision-making unit due to radial selection and relaxation problems. To reflect the nature of urban carbon emission efficiency more objectively, Tone proposed that the relaxation variables of input and output should be directly placed into a non-angle and non-radial SBM-undesirable model of the objective function, avoiding input factor redundancy and undesired error generation in the traditional DEA model (Barros and Wanke, 2017). Based on this, this paper adopted the DEA–SBM-undesirable model to evaluate the carbon emission efficiency of the Yangtze River Delta and the Guangdong–Hong Kong–Macao Greater Bay Area urban agglomeration. Its model form is as follows.
Suppose there are n independent decision-making units (DMUs) in a production system with m inputs. Each DMU has three corresponding vectors: input factor X, expected output Yg, and unexpected output Y b, where the input matrix X = {X1,X2,.,Xn}, X > 0; the expected output matrix Yg ={Y1g,Y2g,., Yng}, Yg>0; and the undesired output matrix Y b = {Y1b,Y2b,., Ynb}, Yb>0. Assuming that the unchanged reward scale is the production possibility, we set p= {(X, Y g, Y b)|X ≥ Xλ, Yg ≤ Ygλ, Yb ≤ Ybλ, λ ≥ 0}, where λ is the density vector and represents the weight. According to Tone’s method, the SBM model of non-expected output can be expressed as follows:
According to the formula, the objective function p* expresses the efficiency value to be measured, and p*∈ [0,1], where S_ represents the excess input, Sg represents the insufficient expected output, Sb represents the redundancy of the unexpected output, and λ is the weight vector. When p* = 1, S_ =Sg =Sb are all equal to 0, indicating that S_, Sg, and Sb do not exist when the DMU is completely efficient. When p*≠1, it means that the DMU is inefficient or has efficiency loss. In this case, the efficiency can be improved by adjusting the relaxation scale of the optimization factor of the input and output.
Urban agglomeration refers to a relatively complete urban agglomeration functioning as a comprehensive center, which gathers considerable cities within a certain range through the modern transportation and information network. The development of urban agglomeration is an important way to optimize the urban function and layout. With the proposal of the new urbanization planning strategy, cities have become the center of the service industry. In order to specifically reflect the economic development process of the Yangtze River Delta and the Guangdong–Hong Kong–Macao Greater Bay Area urban agglomeration, relevant data are selected, published in China Urban Statistical Yearbook, Statistical Bulletin of National Economic and Social Development, and the official website of the National Bureau of Statistics from 2010 to 2021, with certain missing statistics supplemented based on interpolation.
The index system is constructed from the perspective of “resource input–economic output–pollution output,” as shown in Table 1. The capital input is calculated through the sustainable inventory method, based on Humphrey’s measure (Humphrey et al., 1984). The labor input selects employees from various cities over the years, on the basis of the work of Carvajal et al. (2012). Energy consumption refers to the work of Azadeh, which measures the whole society’s electricity consumption (Azadeh et al., 2013). The expected output refers to the work of Groen (2010 as the base period); GDP is taken as the index of the desirable output, with the GDP deflator of each city made by the National Bureau of Statistics for deflating treatment (Groen et al., 2013). The non-desired output is calculated by using the calculation method given in the Second Volume (Energy) of the National Greenhouse Gas Inventory Guide of IPCC, based on the nine kinds of energy consumed in various regions and converted into heat and emission coefficients (Behera et al., 2015).
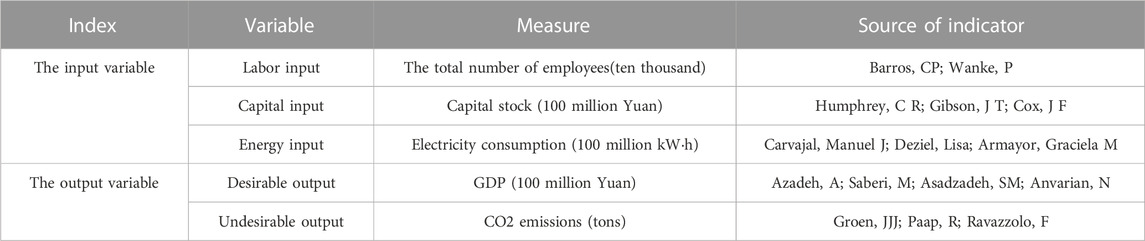
TABLE 1. Carbon emission evaluation index system.
According to the production function, the weight of the expected output and the non-expected output is 50% by default in this paper, and the threshold varying from 0.2, 0.4, 0.6, 0.8, and 1 is set to divide the efficiency value into five levels: low efficiency, low efficiency, medium efficiency, high efficiency, and efficiency. As shown in Table 2, there are only 30 efficient cities, accounting for 9.091%; 15 high-efficiency cities (4.545%); and 39 medium-efficiency cities (11.818%). The number of less-efficient cities reached 161 in total, accounting for approximately 48.788%, and 85 inefficient cities (25.758%). The DEA-Solver Pro 5.0 software is used to make an empirical analysis of the carbon emission efficiency of the Yangtze River Delta and the Guangdong–Hong Kong–Macao Greater Bay Area urban agglomeration during 2010–2021. The result shows that the carbon emission efficiency of the sample is in an unbalanced state, as demonstrated in the previous academic literature (Lu et al., 2022). Thus, considerable work has to be carried out to promote the green and low-carbon transformation of the energy and resource structure, and the Yangtze River Delta and the Guangdong–Hong Kong–Macao Greater Bay Area city clusters still have a lot of room for development to improve the carbon emission efficiency.
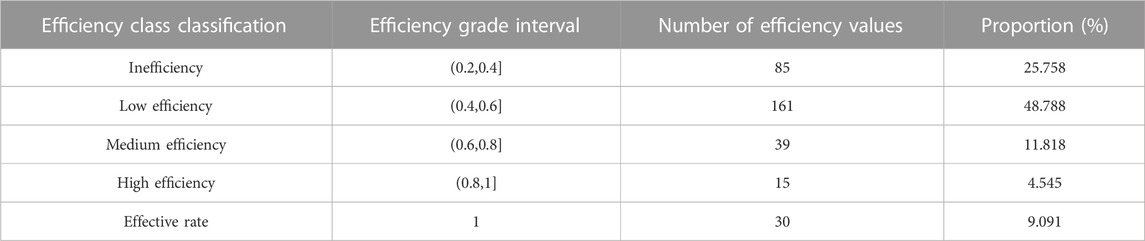
TABLE 2. Distribution of carbon emission efficiency levels in urban agglomeration from 2010 to 2021.
The annual mean variation of carbon emission efficiency in the Yangtze River Delta and the Guangdong–Hong Kong–Macao Greater Bay Area urban agglomeration from 2010 to 2021 is shown in Figure 2. The changes of technical efficiency and comprehensive efficiency show a trend of homogeneity, which indicates that technological progress is the main internal driving force for the improvement of urban carbon emission efficiency (Liu et al., 2018). The carbon emission efficiency shows a steady growth trend on the whole, most of which distributes the low-efficiency stage (0.4 and 0.6), proving that the Yangtze River Delta and the Guangdong–Hong Kong–Macao Greater Bay Area urban agglomeration bears the mission of balancing economic growth and low-carbon development, and science and technology would become the core driving force for building the future urban carbon emission reduction system.
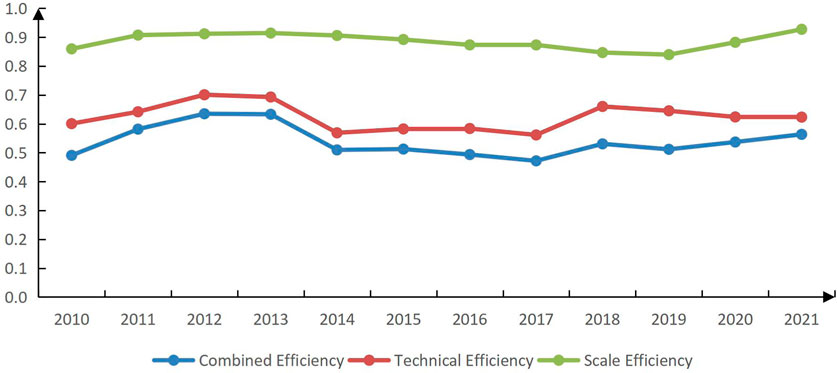
FIGURE 2. Global benchmark of carbon emission efficiency from 2010 to 2021.
As shown in Figure 3, there was a similar state of oscillation in the trend of the annual Malmquist index of carbon emission efficiency in the Yangtze River Delta and the Guangdong–Hong Kong–Macao Greater Bay urban agglomeration from 2010 to 2021. The urban agglomeration of the Yangtze River Delta increased slowly from 2010 to 2013, began to decline after 2013, reached the lowest point in 2017, and then, showed an upward trend with an average value of 0.541. The Guangdong–Hong Kong–Macao Greater Bay city cluster was on the rise as a whole and fluctuated repeatedly from 2010 to 2021, with an average value of 0.527. Based on the analysis of the changes from 2010 to 2021, it was found that the growth range of the Yangtze River Delta urban agglomeration was higher than that of the Guangdong–Hong Kong–Macao Greater Bay urban agglomeration.
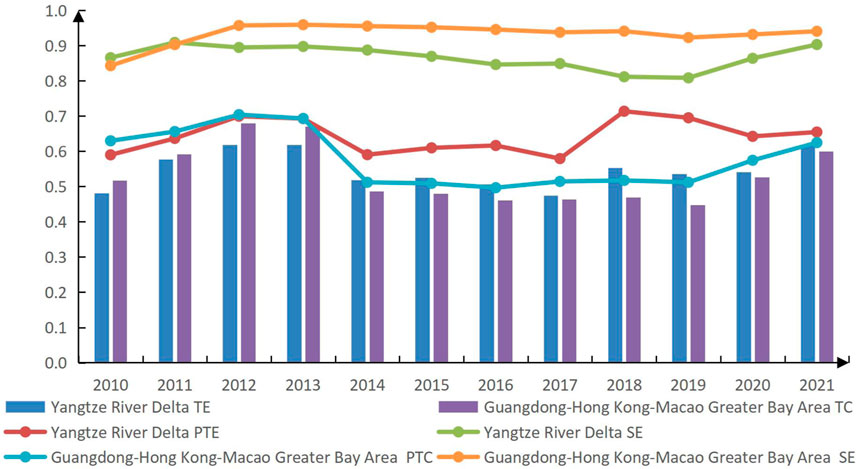
FIGURE 3. Carbon emission efficiency of urban agglomeration from 2010 to 2021.
In order to clarify the reasons for the change of carbon emission efficiency in the Yangtze River Delta and the Guangdong–Hong Kong–Macao Greater Bay urban agglomerations, this paper also decomposed the annual Malmquist index of the two urban agglomerations, and the results are shown in Table 3. In general, the efficiency scale of the two urban agglomerations is higher than that of the technical efficiency of the decade, indicating that the improvement of carbon emission efficiency is mainly due to the progress of technology. More specifically, there are obvious gradient differences between the internal development stage of the Yangtze River Delta urban agglomeration and the regional economy. For example, different regions have their own advantages of resources and technology. Shanghai is the regional leader in terms of education, Jiangsu’s advanced manufacturing industry is dense, and Zhejiang’s private economy and Anhui’s emerging industry are developing rapidly. These resource differentiation and synergic advantages bring high scientific research output to many emerging cities in the Yangtze River Delta. However, the Guangdong–Hong Kong–Macao Greater Bay Area city cluster is losing its original regional merit with the rise of increasingly prominent problems such as labor price, international trade friction, and serious environmental pollution in recent years, despite its superiority in the reform and opening up policies. Except for Shenzhen, Guangzhou, Hong Kong, and Macao, other cities show a lack of sustained momentum for a relatively low proportion of high-tech industries and knowledge-intensive and technology-intensive industries. They are dominated by labor-intensive enterprises and mid-end and low-end manufacturing industries. In general, there is a small gap in carbon emission efficiency between the Yangtze River Delta urban agglomeration and the Guangdong–Hong Kong–Macao Greater Bay urban agglomeration, and there is a trend of synchronous development for the future for a long time, as the two urban agglomerations are well matched.
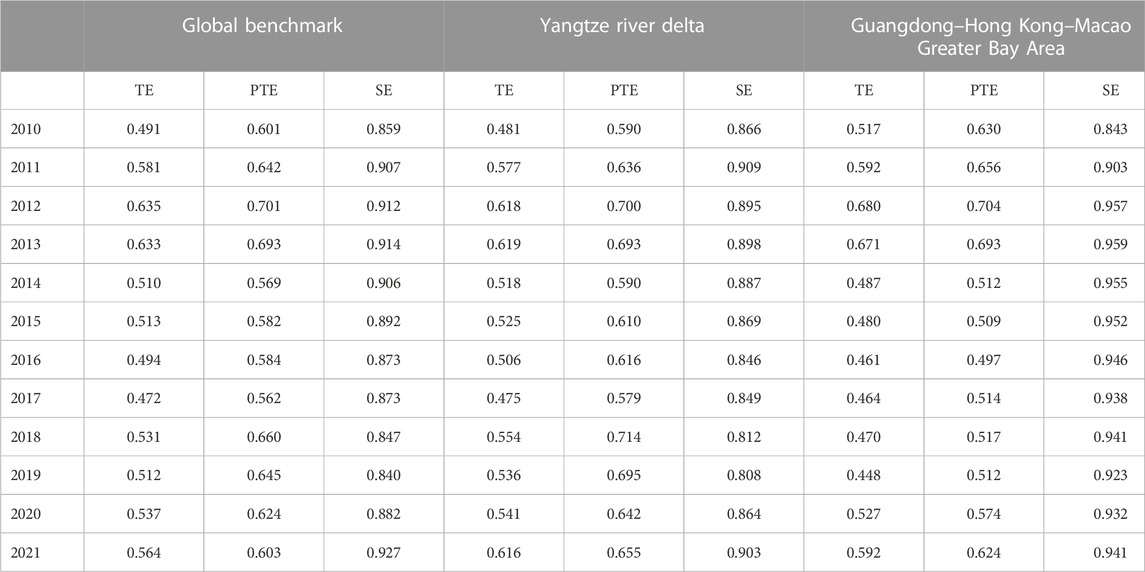
TABLE 3. Carbon emission efficiency of urban agglomeration from 2010 to 2021.
Considering that urban carbon emission efficiency also affects the development of science and technology innovation and education, that is, there is a mutual influence between science and technology innovation, education, and the urban carbon emission efficiency, the system generalized method of moments (SYS-GMM) method is selected to estimate the equation model, and the mixed ordinary least squares (OLS) model is used for comparison. In addition, in the data pre-processing, in order to eliminate the influence of extreme values and heteroscedasticity, the control variables are taken from the natural logarithm, and the continuous variables are Winsorized at the upper and lower 1%.
We assume that there is a finite fourth-order moment for each period. However, the (2N*1) vectors,
where
According to the model designed in this study, it is assumed that there are moment conditions,
When A* satisfies,
Then, the distribution of
Original hypothesis:
where
We assume for this reason
For this purpose, the validity of the instrumental variable selection and fitting effect was judged by AR(1), AR(2), and the Sargan test, and the following model test was established:
In the aforementioned formula, time is represented by i, region is represented by t, β0 represents the cross-sectional effect, β1-βn represents the estimation coefficient, ε represents the random error term, and “control” represents all control variables.
Explained variables: Considering the possible non-linear effects, combined with resource utilization and environmental costs, the natural logarithm of urban carbon emission efficiency (CEE) was taken for processing.
The instrumental variables used in the GMM model are the first and second lagged terms of the endogenous variables of education and technology. The reason for using these instrumental variables is mainly because the lagged terms of the endogenous variables are directly correlated with the endogenous variables instead of the dependent variable, which satisfies the conditions for the use of instrumental variables.
Core explanatory variable: Referring to Varela-Mato’s research education level (lnEDU), the number of students in urban colleges and universities (10,000) was measured (Varela-Mato et al., 2012). According to Yang’s research and technological development degree (limit), the number of urban researchers (10,000) was measured (Yang and Wei, 2019). In order to investigate the degree of substitution and complementarity between science and technology development and education more conveniently, their interaction term, lnEDUxlnIT, was introduced into regression analysis to improve the reliability of the test.
Control variables: According to domestic and foreign research results and considering the internal relationship between the independence and comprehensiveness of index selection, the following measurement criteria are adopted: The economic development (ED) level is measured using the GDP growth rate of each city (Wang et al., 2014). There are obvious differences in the economic level between the Yangtze River Delta and the Guangdong–Hong Kong–Macao Greater Bay city clusters, and the level of economic development directly affects urban carbon emission efficiency. The industrial structure is measured using the ratio of the secondary industry to GDP (Chen and Li, 2011). Urban industrialization makes the rate of resource and environment loss exceed its carrying capacity, which is bound to interfere with urban carbon emission efficiency. Foreign direct investment (FDI) is expressed by the ratio of the total amount of actually utilized foreign capital to GDP (Ismail and Yuliyusman, 2013), and the export value is calculated by converting the average exchange rate of 12 months in the current year into RMB. Relying on the regions with high external orientation, the dependence of the foreign capital in the Yangtze River Delta and the Guangdong–Hong Kong–Macao Greater Bay city cluster must be taken into consideration. Internet popularity is represented by the number of Internet users, referring to the practices of the China Internet Network Information Center (CNNIC) and Nepomuceno et al. (2020). The descriptive statistical results of the main variables are shown in Table 4.
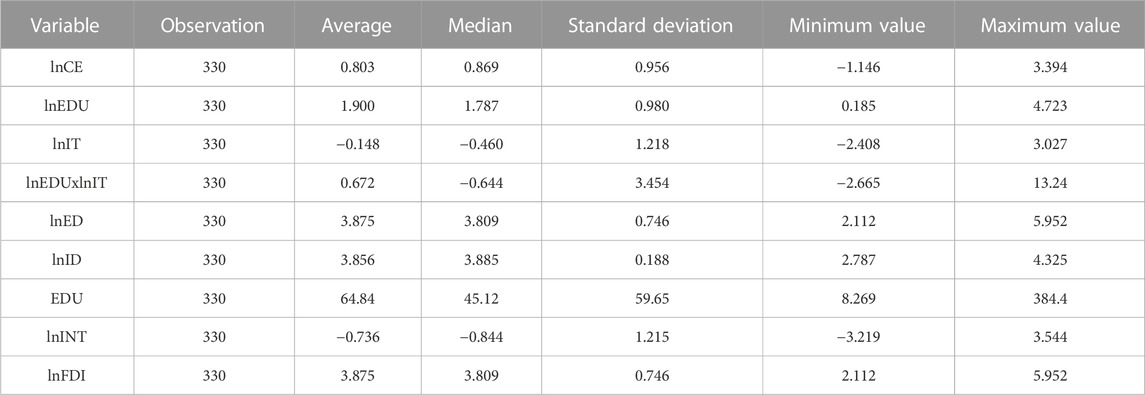
TABLE 4. Descriptive statistical analysis.
This study used the Pearson correlation coefficient to examine the correlation among the variables, and the results are shown in Table 5. According to the correlation analysis, the correlation coefficient between the educational level (lnEDU) and carbon emission efficiency (lnCE) is 0.136, which is significantly positive at 5%, preliminarily verifying hypothesis 1; the correlation coefficient between the technological development level (lnIT) and carbon emission efficiency (lnCE) is 0.098, which is significantly positive at 10%, preliminarily verifying hypothesis 2; and similarly, the correlation coefficient of the interaction between the technological development and educational level (lnEDUxlnIT) and carbon emission efficiency is 0.014, which is significantly positive, preliminarily verifying hypothesis 3.

TABLE 5. Correlation analysis results.
In addition, the sample data of this study are an unbalanced panel data, and Stata commands are used to detect the variance inflation factor of the variables. The results show that the VIF coefficients of all explanatory variables are less than 3, indicating that there is no serious multicollinearity between the observed variables, and the sample data can be put into the regression model for further testing.
Since this paper uses a model (4.1) system GMM regression model for analysis of the baseline regression test, robustness test, and heterogeneity test, the premise of the establishment of the system GMM regression model needs to pass two tests: first is the autocorrelation test of the perturbation term; that is, there is the first-order autocorrelation of the perturbation term, but the second order and higher order of the perturbation term will not be autocorrelated, which needs to be tested by using the Arellano–Bond method; the second is that since multiple instrumental variables are used, an over-identification test is required to ensure that the instrumental variables used are all valid, and the over-identification test requires the Sargan test after removing the robust standard errors of model I and regressing it again. Before conducting regression analysis, we also performed cross-sectional dependence tests on the panel data used using Pesaran’s test and Friedman’s test. The results, shown in Table 6, do not reject the null hypothesis that there is no cross-sectional correlation. This also indicates that there is no contemporaneous interference in the disturbance term of our regression, which leads to biased estimation results.
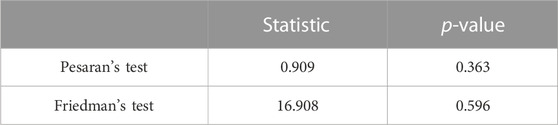
TABLE 6. Cross-sectional dependence test.
Table 7 reports the estimation results of the systematic GMM regression model, in which the explanatory variable is the urban carbon emission efficiency, and the results of the autocorrelation and over-identification test of the nuisance term of the systematic GMM regression model show that the p-value of AR(1) is 0.006, which is less than 0.1 over the significance test, while the p-value of AR(2) is 0.803, which is higher than 0.1. It shows that the perturbation term has the first-order autocorrelation at the 1% significance level, but no second-order autocorrelation. Also, it can be decided that the model difference equation avoids residual autocorrelation, so system GMM regression model I passes the autocorrelation test of the perturbation term. In addition, because system GMM model I uses instrumental variables, it also needs to be tested for over-identification of instrumental variables, and after removing the robust standard deviation and regression again, the Sargan test is performed, and the p-value of 0.692 is obtained, which is higher than 0.1; that is, the original hypothesis of “all instrumental variables are valid” is accepted, so the model I passed the over-identification test for instrumental variables, indicating the reasonableness of the selection of instrumental variables and the applicability of the data to the systematic GMM model for estimation.
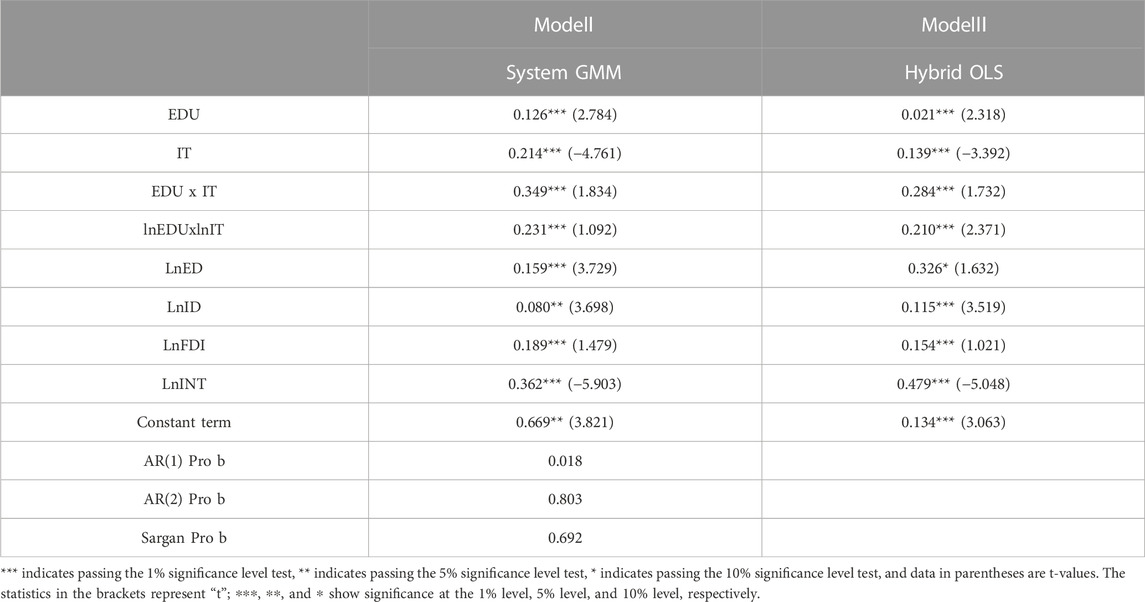
TABLE 7. Estimation results of the effects of the education level and technology development level on the efficiency of urban carbon emissions.
The results of the systematic GMM and mixed OLS estimation are reported in model I in Table 7. It was found that the coefficient of education level positively affecting urban carbon emission efficiency is 0.126, which implies that the education level can promote urban carbon emission efficiency, and the results are consistent with the original hypothesis, and a similar finding was presented by Chao An (Liu et al., 2018). The public has the right to know, participate, express, and supervise carbon emissions, and the education level of workers is an important factor affecting environmental protection. Strengthening the education and publicity of carbon emission reduction will provide a good social atmosphere and a solid social foundation for improving the efficiency of urban carbon emissions and building a beautiful China. Accordingly, hypothesis 1 is confirmed. The regression coefficient of the level of science and technology development affecting urban carbon emission efficiency in model II is 0.214, which is significantly positive at the 1% level and both pass the 1% significance level test, and this study accepts the original hypothesis, which is similar to the results of Wang et al.’s (2022b) study. China’s scientific and technological innovation is still in its infancy and has a wide space for development, and while broadening the breadth of energy sources, scientific and technological innovation can also promote energy efficiency, reduce total energy consumption, and use the spillover effect of technological efficiency to offset the expansion effect of carbon emissions in the production and living process and ultimately promote the efficiency of carbon emissions. Accordingly, hypothesis 2 is confirmed.
In addition, in order to make a comparison and to judge whether the regression results of GMM are robust or not, OLS (model II) with mixed regression is attached, and from the results, it can be seen that the text robustness test is a success.
According to the social survey report in the Statistical Bulletin of National Economic and Social Development of the People’s Republic of China in 2021, the main causes of urban environmental pollution are the excessive use of high-carbon energy (42.7%) and the limited environmental awareness of the public (35.6%). This reveals that the carbon emission efficiency of the Yangtze River Delta and the Guangdong–Hong Kong–Macao Greater Bay Area urban agglomerations is closely related to levels of science and technology and education. In model 4, the interaction term (lnEDUxlnIT) between science and technology development and education level was verified, and the corresponding coefficient of the interaction term was significantly positive. It proves that higher education could maintain and even enhance the positive influence of science and technology development on carbon emission efficiency to a certain extent. With the improvement of the education level, people gradually increase their awareness of energy conservation and emission reduction and pay more attention to the improvement of the quality of life. Thus, the contradiction of the low utilization rate of science and technology caused by the low education level can be effectively resolved. This finding demonstrates hypothesis 3.
As we all know, in terms of the series of control variables, the results represented by model 4 indicate that the regression coefficient of the economic development level on urban carbon emission efficiency is 0.159 and significant at the 1% level, which is consistent with the study of Luo (Yang et al., 2019a). The improvement of the economic development level in the Yangtze River Delta and the Guangdong–Hong Kong–Macao Greater Bay Area urban agglomerations is conducive to the upgrading of the energy consumption structure, which stimulates the emergence of new technologies, thus greatly improving the utilization efficiency of clean energy and carbon emission reduction. The effect of the industrial structure on urban carbon emission efficiency is significantly positive, and the regression coefficient is 0.080, which passes the significance test of 1%, consistent with the study of Li (Li et al., 2017). With the continuous advancement of the industrial upgrading degree, the proportion of low-end industries with high energy consumption and high pollution decreases and gradually shifts or withdraws from the stage of economic development, while strategic emerging industries and high-end manufacturing industries become the pillar industries of industrial economy and even the whole economic system. In recent years, technology-intensive industries, such as new energy vehicles, industrial robots, integrated circuits, biomedicine, and aerospace equipment manufacturing, in the Yangtze River Delta and Guangdong–Hong Kong–Macao Bay area have become new engines of driving economic growth, while the growth of labor-intensive industries, such as metal manufacturing, garment and textile, food processing, and building construction, has slowed down, and the manufacturing industry has moved from the middle- and low-end levels to the middle- and high-end levels, which greatly improves the efficiency of urban carbon emissions. The regression coefficient of the degree of external development is positive and significant, which is consistent with the findings of Qu (Yang et al., 2019b). As enterprises in the Yangtze River Delta and the Guangdong–Hong Kong–Macao Greater Bay Area continue to become global, the overseas investment allows enterprises to break down trade and tariff barriers in the international market, alleviating the inhibitory effect of factor market distortions in improving urban carbon efficiency and, thus, improving resource mismatch. With a positive coefficient of 0.362 and passing the 1% significance level test, Internet development on carbon emission efficiency also provides information support for the improvement of carbon emission efficiency, which is in line with the findings of Yang (Yang et al., 2022). People who use the Internet platform can supervise and report the events that violate the environmental system, especially in the Yangtze River Delta and Guangdong–Hong Kong–Macao Greater Bay Area city clusters, where the Internet infrastructure is well built, and the Internet publicity is extremely popular than the traditional paper media, which is more conducive to significantly improving carbon emission efficiency.
To ensure the reliability of the research results, the following heterogeneity test is conducted: the Yangtze River Delta urban agglomeration and the Guangdong–Hong Kong–Macao Greater Bay urban agglomeration are divided into large cities and small cities using the economic dimension and the population dimension. The regression results are detailed in Table 8. The particularity of urban agglomerations becomes more and more obvious when the differences become increasingly larger.
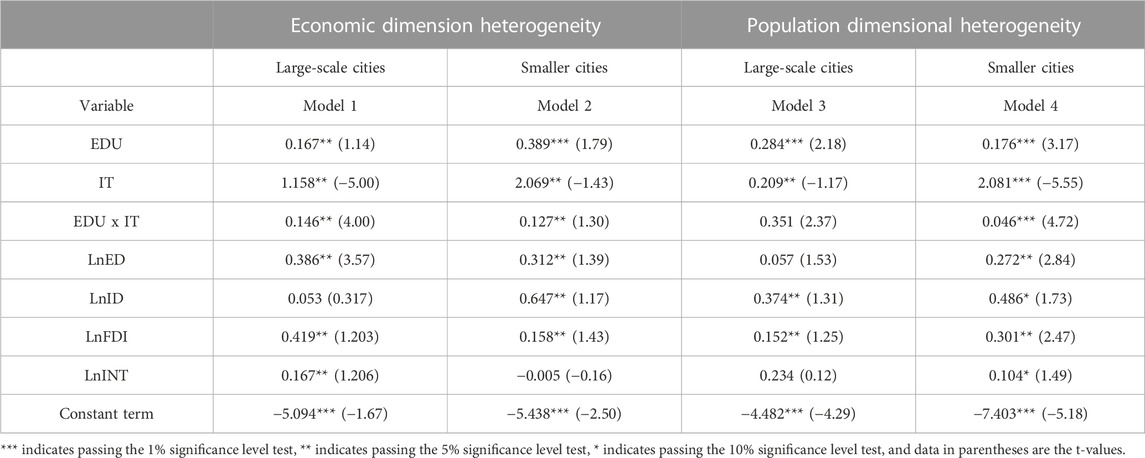
TABLE 8. Heterogeneity test.
Considerable scientific reports and literature all believe that carbon dioxide emission is prone to the developing areas. Due to the lack of funds, transportation, science and technology, and education resources, less-developed cities produce urban carbon emissions (Jie et al., 2015). Considering that the carbon emission efficiency is economically oriented, the sample urban agglomerations are divided as large-scale cities and small-scale cities based on GDP and the population size. As shown in Table 8, the regression coefficients of 0.167 for large-scale cities and 0.389 for small-scale cities significantly contribute to the carbon emission efficiency of the Yangtze River Delta city cluster and the Guangdong–Hong Kong–Macao Greater Bay city cluster at the 5% and 1% levels, respectively, in terms of the education level. In terms of science and technology development, the regression coefficient of 1.158 passed the 1% statistical significance test for large-scale cities and 2.069 passed the 5% statistical significance test for small-scale cities, and the heterogeneity is not significantly different in terms of science and technology development. In terms of the interaction term between science and technology innovation and education level, the coefficient of the interaction term 0.146 is significantly positive at the 1% level for large-scale cities and 0.127 is significantly positive at the 5% level for small-scale cities. The results show that the heterogeneity in the economic dimension between the Yangtze River Delta city cluster and the Guangdong–Hong Kong–Macao Greater Bay city cluster is mainly manifested in the gap of the education level, where the excellent education resources in large cities tend to be saturated, and too much investment is of little significance to improve urban carbon emission efficiency; small cities have fragile education ecology and are still in the period of rapid expansion of education scale, and strengthening education investment has a significant effect on the intensity, trend, and level of improvement of urban carbon emission efficiency.
It is well known that population, as one of the dynamic elements of the environment, have an impact on carbon emission efficiency through production, living and consumption behaviors (Liu et al., 2021). China is a vast and populous country, and while urban population expansion provides a favorable environment for capital accumulation in science and technology and education in the Yangtze River Delta city cluster and the Guangdong–Hong Kong–Macao Greater Bay city cluster, it also leads to an increase in CO2 emissions. Therefore, the same heterogeneity exists at the level of the urban population size. Here, cites with a permanent resident population over 1 million are set as large-scale cities, while others with 500,000 to 1 million are set as small-scale cities. As shown in Table 8, in terms of the education level, both large-scale and small-scale cities improving their education level significantly enhance urban carbon emission efficiency at the 1% confidence level, with regression coefficients of 0.284 and 0.176, respectively, which is not a significant difference. In terms of science and technology development, the regression coefficient for large-scale cities is 0.209 and passes the 5% statistical significance test, while the regression coefficient for small-scale cities is 0.281 and passes the 1% statistical significance test. In terms of interaction between science and technology innovation and education, the coefficient of the interaction term 0.046 is significantly positive at the 1% level for small-scale cities, while it is not significant for large-scale cities. The results indicate that the heterogeneity in the population dimension between the Yangtze River Delta urban agglomeration and the Guangdong–Hong Kong–Macao Greater Bay urban agglomeration is mainly manifested in the gap of science and technology level. Small cities are limited by the volume of education and the level of science and technology development, coupled with the lack of location advantages, such as capital, location, policies, and labor. Also, enterprises have vicious competition in limited resources, policies, and projects and insufficient capacity in low-carbon technology research and development. Large urban cities are able to meet the needs of urban low-carbon economic development in terms of market space, network infrastructure, capital, and talent, etc. With the support of science and technology, the development and application of low-carbon clean energy and energy-saving low-carbon technologies are more conducive to enhancing the efficiency of urban carbon emissions.
To explore the effects of higher education level (lnEDU), technological development (lnIT), and their interaction terms (lnEDUxlnIT) on carbon emissions efficiency, the GMM model was used to construct a GMM model by analyzing macro and micro data of the carbon emission efficiency of the Yangtze River Delta city cluster and the Guangdong–Hong Kong–Macao Greater Bay Area city cluster from 2010 to 2021. The findings are as follows.
In terms of time trends, the overall carbon emission efficiency of the Yangtze River Delta and Guangdong–Hong Kong–Macao Greater Bay urban agglomerations is low and on the rise from 2010 to 2021, and the increasing emission efficiency of the urban agglomerations is mainly driven by technological progress; in terms of geography, the carbon emission efficiency of the Yangtze River Delta urban agglomeration grows faster than that of the Guangdong–Hong Kong–Macao Greater Bay urban agglomeration. The results of the full-sample regression show that the impact of higher education, technological development, and their interaction on urban carbon emissions has a high positive correlation. Carbon emission efficiency has a positive effect under the influence of control variables such as the level of economic development, industrial structure upgrading, the degree of foreign development, and the popularity of the Internet. The regression results of the heterogeneity test show that the carbon efficiency of the Yangtze River Delta urban agglomeration and the Guangdong–Hong Kong–Macao Greater Bay urban agglomeration show divergent characteristics in different levels of cities, but the significance and direction of the key variables do not change substantially.
In response to the research results, this study proposes four recommendations: first, establishing a long-term mechanism for securing capital investment, rewarding, and recommending in science and technology, higher education, and other fields to increase financial support for research and development fund projects, especially for technological innovation projects of high-tech enterprises; second, strengthening the protection of intellectual property rights, promoting the application of energy-saving and emission reduction technology achievements, and increasing technology market turnover (carbon capture and storage and other technologies) through multiple platforms online and offline; third, improving institutional accountability in the energy sector, establishing a compensation system for the ecological environment, an incentive system for low-carbon innovation, and a low-carbon GDP assessment system to curb the disorderly development of industries with high pollution and energy consumption, and vigorously developing high-output, low-energy consumption and low-emission service industries; and fourth, promoting the collaboration between enterprises, universities, and research institutions and implementing a number of incentives to cultivate skilled personnel in the cutting-edge field, so as to help China move to the middle and high end of the global carbon emission reduction value chain.
Based on the panel data of the Yangtze River Delta and Guangdong–Hong Kong–Macao Greater Bay Area cities from 2010 to 2021, this paper constructs a panel GMM model to analyze the effects of education level, technological development, and their interaction on the efficiency of urban carbon emissions and proposes relevant recommendations in the hope of contributing to the global environmental pollution control. One limitation of this study is about other models, such as the Tapio decoupling model and the semi-parametric space panel vector antiregression model. They can be used to further analyze the complex relationship between education level, technological development, and the interaction between them on urban carbon emissions in the future study. In addition, this study analyses data at a macro level and does not take into account the particular situation of the economic, educational, and technological development of urban agglomerations. There is a need to further study the population and other aspects of information to enrich and improve the conclusions.
The original contributions presented in the study are included in the article/Supplementary Material; further inquiries can be directed to the corresponding author.
MT: Conceptualization, writing—review and editing, methodology, and manuscript revision. DX: Acquisition of original data, software, formal analysis, methodology, and manuscript revision. QL: Reference management, funding acquisition, and manuscript revision critically. All authors contributed to the manuscript and approved the submitted version.
The authors declare that the research was conducted in the absence of any commercial or financial relationships that could be construed as a potential conflict of interest.
All claims expressed in this article are solely those of the authors and do not necessarily represent those of their affiliated organizations, or those of the publisher, the editors, and the reviewers. Any product that may be evaluated in this article, or claim that may be made by its manufacturer, is not guaranteed or endorsed by the publisher.
The Supplementary Material for this article can be found online at: https://www.frontiersin.org/articles/10.3389/fenvs.2023.1137570/full#supplementary-material
Azadeh, A., Saberi, M., Asadzadeh, S. M., and Anvarian, N. (2013). An adaptive-network-based fuzzy inference system-data envelopment analysis algorithm for optimization of long-term electricity consumption, forecasting and policy analysis: The case of seven industrialized countries. Energy Sources Part B-Economics Plan. Policy 8, 56–66. doi:10.1080/15567249.2011.628959
Barros, C. P., and Wanke, P. (2017). Efficiency in Angolan thermal power plants: Evidence from cost structure and pollutant emissions. Energy 130, 129–143. doi:10.1016/j.energy.2017.04.114
Behera, C. R., Srinivasan, B., Chandran, K., and Venkatasubramanian, V. (2015). Model based predictive control for energy efficient biological nitrification process with minimal nitrous oxide production. Chem. Eng. J. 268, 300–310. doi:10.1016/j.cej.2015.01.044
Carvajal, M. J., Deziel, L., and Armayor, G. M. (2012). Labor supply functions of working male and female pharmacists: In search of the backward bend. Res. Soc. Adm. Pharm. 8, 552–566. doi:10.1016/j.sapharm.2012.01.006
Chen, H. X., and Li, G. P. (2011). Empirical study on effect of industrial structure change on regional economic growth of Beijing-Tianjin-Hebei Metropolitan Region. Chin. Geogr. Sci. 21, 708–714. doi:10.1007/s11769-011-0478-9
Gao, X. Y., Lyu, Y. W., Shi, F., Zeng, J. T., and Liu, C. Y. (2019). The impact of financial factor market distortion on green innovation efficiency of high-tech industry. Ekoloji 28, 3449–3461.
Groen, J. J. J., Paap, R., and Ravazzolo, F. (2013). Real-time inflation forecasting in a changing world. J. Bus. Econ. Statistics 31, 29–44. doi:10.1080/07350015.2012.727718
Guo, F. P., Wang, Z. F., Ji, S. B., and Lu, Q. B. (2022). Influential nodes identification in the air pollution spatial correlation weighted networks and collaborative governance: Taking China's three urban agglomerations as examples. Int. J. Environ. Res. Public Health 19, 4461–5371. doi:10.3390/ijerph19084461
Hajek, P., Henriques, R., Castelli, M., and Vanneschi, L. (2019). Forecasting performance of regional innovation systems using semantic-based genetic programming with local search optimizer. Comput. Operations Res. 106, 179–190. doi:10.1016/j.cor.2018.02.001
Hu, H. X., Zhang, Y. L., Yao, C., Guo, X., and Yang, Z. J. (2022). Research on cost accounting of enterprise carbon emission (in China). Math. Biosci. Eng. 19, 11675–11692. doi:10.3934/mbe.2022543
Humphrey, C. R., Gibson, J. T., and Cox, J. F. (1984). Cycle counting as a method for improving perpetual inventory accuracy. Hosp. Mater. Manag. Q. 6, 59–64.
Ismail, R., and Yuliyusman, F. (2013). Impact of globalization on labour productivity in the Malaysian construction sector. Life Sci. Journal-Acta Zhengzhou Univ. Overseas Ed. 9, 3235–3242.
Jie, Z., Yang, X., Bo, L., and Xiao, C. (2015). Urban macro-level impact factors on Direct CO2 Emissions of urban residents in China. Energy Build. 107, 131–143. doi:10.1016/j.enbuild.2015.08.011
Li, Z. L., Sun, L., Geng, Y., Dong, H. J., Ren, J. Z., Liu, Z., et al. (2017). Examining industrial structure changes and corresponding carbon emission reduction effect by combining input-output analysis and social network analysis: A comparison study of China and Japan. J. Clean. Prod. 162, 61–70. doi:10.1016/j.jclepro.2017.05.200
Li, Q. Y. (2019). Regional technological innovation and green economic efficiency based on DEA model and fuzzy evaluation. J. Intelligent Fuzzy Syst. 37, 6415–6425. doi:10.3233/jifs-179220
Liu, B. Q., Tian, C., Li, Y. Q., and Song, H. H. (2018). Research on the effects of urbanization on carbon emissions efficiency of urban agglomerations in China. J. Clean. Prod. 197, 1374–1381. doi:10.1016/j.jclepro.2018.06.295
Liu, J. H., Li, M. X., and Ding, Y. T. (2021). Econometric analysis of the impact of the urban population size on carbon dioxide (CO2) emissions in China. Environ. Dev. Sustain. 23, 18186–18203. doi:10.1007/s10668-021-01433-w
Long, X. L., Oh, K., and Cheng, G. (2013). Are stronger environmental regulations effective in practice? The case of China's accession to the WTO. J. Clean. Prod. 39, 161–167. doi:10.1016/j.jclepro.2012.08.005
Lu, X. H., Zhang, Y. W., Li, J. J., and Duan, K. F. (2022). Measuring the urban land use efficiency of three urban agglomerations in China under carbon emissions. Environ. Sci. Pollut. Res. 29, 36443–36474. doi:10.1007/s11356-021-18124-8
Lv, W. D., Hong, X. X., and Fang, K. N. (2015). Chinese regional energy efficiency change and its determinants analysis: Malmquist index and Tobit model. Ann. Operations Res. 228, 9–22. doi:10.1007/s10479-012-1094-5
Nepomuceno, K., Nepomuceno, T., and Sadok, D. (2020). Measuring the Internet technical efficiency: A ranking for the world wide web pages. Ieee Lat. Am. Trans. 18, 1119–1125. doi:10.1109/tla.2020.9099750
Philip, L. D., Emir, F., and Udemba, E. N. (2022). Investigating possibility of achieving sustainable development goals through renewable energy, technological innovation, and entrepreneur: A study of global best practice policies. Environ. Sci. Pollut. Res. 29, 60302–60313. doi:10.1007/s11356-022-20099-z
Varela-Mato, V., Cancela, J. M., Ayan, C., Martin, V., and Molina, A. (2012). Lifestyle and health among Spanish university students: Differences by gender and academic discipline. Int. J. Environ. Res. Public Health 9, 2728–2741. doi:10.3390/ijerph9082728
Wang, Y. D., and Zheng, Y. M. (2020). Spatial effects of carbon emission intensity and regional development in China. Environ. Sci. Pollut. Res. 28, 14131–14143. doi:10.1007/s11356-020-11557-7
Wang, P. C., Lee, Y. M., and Chen, C. Y. (2014). Estimation of resource productivity and efficiency: An extended evaluation of sustainability related to material flow. Sustainability 6, 6070–6087. doi:10.3390/su6096070
Wang, K., Xian, Y. J., Wei, Y. M., and Huang, Z. M. (2017). Sources of carbon productivity change: A decomposition and disaggregation analysis based on global luenberger productivity indicator and endogenous directional distance function. Ecol. Indic. 66, 545–555. doi:10.1016/j.ecolind.2016.02.034
Wang, S. J., Gao, S., Huang, Y. Y., and Shi, C. Y. (2020). Spatiotemporal evolution of urban carbon emission performance in China and prediction of future trends. J. Geogr. Sci. 30, 757–774. doi:10.1007/s11442-020-1754-3
Wang, Q. Z., Zhao, T., and Wang, R. (2022). Carbon neutrality ambitions and reinforcing energy efficiency through OFDI reverse technology spillover: Evidence from China. Pol. J. Environ. Stud. 31, 315–328. doi:10.15244/pjoes/139739
Yang, Z. S., and Wei, X. X. (2019). The measurement and influences of China's urban total factor energy efficiency under environmental pollution: Based on the game cross-efficiency DEA. J. Clean. Prod. 209, 439–450. doi:10.1016/j.jclepro.2018.10.271
Yang, J. A., Tang, L., Mi, Z. F., Liu, S., Li, L., and Zheng, J. L. (2019). Carbon emissions performance in logistics at the city level. J. Clean. Prod. 231, 1258–1266. doi:10.1016/j.jclepro.2019.05.330
Yang, H. L., Chen, X. C., Tang, J. W., Zhang, L., Zhang, C. S., Perry, D. C., et al. (2019). External carbon addition increases nitrate removal and decreases nitrous oxide emission in a restored wetland. Ecol. Eng. 138, 200–208. doi:10.1016/j.ecoleng.2019.07.021
Yang, J., Chen, M. L., Fu, C. Y., and Chen, X. D. (2020). Environmental policy, tax, and the target of sustainable development. Environ. Sci. Pollut. Res. 27, 12889–12898. doi:10.1007/s11356-019-05191-1
Yang, L., Zheng, F. C., and Jin, S. (2021). Spatio-temporal analysis of meta distribution for cell-center/cell-edge users. Ieee Trans. Commun. 69, 8256–8270. doi:10.1109/tcomm.2021.3108353
Yang, X., Shang, G. Y., and Deng, X. Z. (2022). Estimation, decomposition and reduction potential calculation of carbon emissions from urban construction land: Evidence from 30 provinces in China during 2000-2018. Environ. Dev. Sustain. 24, 7958–7975. doi:10.1007/s10668-021-01769-3
Keywords: science and technology innovation strategy, urban carbon emission efficiency, education level, Internet popularization, DEA-undesirable model
Citation: Tang Mm, Xu D and Lan Q (2023) How does education affect urban carbon emission efficiency under the strategy of scientific and technological innovation?. Front. Environ. Sci. 11:1137570. doi: 10.3389/fenvs.2023.1137570
Received: 04 January 2023; Accepted: 04 April 2023;
Published: 18 April 2023.
Edited by:
Gul Jabeen, Harbin Institute of Technology, ChinaReviewed by:
Mohamed R. Abonazel, Cairo University, EgyptCopyright © 2023 Tang, Xu and Lan. This is an open-access article distributed under the terms of the Creative Commons Attribution License (CC BY). The use, distribution or reproduction in other forums is permitted, provided the original author(s) and the copyright owner(s) are credited and that the original publication in this journal is cited, in accordance with accepted academic practice. No use, distribution or reproduction is permitted which does not comply with these terms.
*Correspondence: Qiang Lan, bGFucWlhbmdAZ3hzdG51LmVkdS5jbg==
Disclaimer: All claims expressed in this article are solely those of the authors and do not necessarily represent those of their affiliated organizations, or those of the publisher, the editors and the reviewers. Any product that may be evaluated in this article or claim that may be made by its manufacturer is not guaranteed or endorsed by the publisher.
Research integrity at Frontiers
Learn more about the work of our research integrity team to safeguard the quality of each article we publish.