 Jiancheng Chen
 Heng Sun
95% of researchers rate our articles as excellent or good
Learn more about the work of our research integrity team to safeguard the quality of each article we publish.
Find out more
ORIGINAL RESEARCH article
Front. Environ. Sci. , 17 February 2023
Sec. Environmental Citizen Science
Volume 11 - 2023 | https://doi.org/10.3389/fenvs.2023.1136318
This article is part of the Research Topic Carbon Neutrality, Social Media, Artificial Intelligence, volume II View all 13 articles
Based on the network attention data of China’s agricultural listed companies from 2012 to 2020, this paper uses the IV model to measure and investigate the impact of network attention on the carbon dioxide emission performance of China’s agricultural listed companies and its mechanism. The findings are as follows: 1) The carbon dioxide emission intensity of listed agricultural companies in China is generally decreasing year by year and the carbon dioxide emission performance is improving; 2) The increasing network attention has significantly reduced the carbon dioxide emission intensity of agricultural listed companies and brought about better carbon dioxide emission performance; 3) The relationship between network attention and carbon dioxide emission performance of agricultural listed companies has network, regional and property heterogeneity; 4) The investment in environmental protection has strengthened the inhibition effect of network attention on the unit carbon dioxide emissions of agricultural listed companies. The research conclusion enriches the literature on “network concern - environmental governance”, and also provides ideas for developing countries to exert the environmental governance effect of network concern in the process of carbon neutrality.
China is a large agricultural country and the largest carbon dioxide (CO2) emitter in the world. In the process of agricultural modernization, the agricultural sector is an important source of carbon dioxide emissions in China. According to the statistics of the Food and Agriculture Organization of the United Nations (FAO), China’s agricultural sector’s generalized carbon dioxide emissions reached 663 million tons in 2019, accounting for 11.1% of the global agricultural sector’s total emissions. The Chinese government attaches great importance to how to reduce the intensity of carbon dioxide emissions from agricultural enterprises and achieve the goal of carbon neutrality. In recent years, the Chinese central government has continuously strengthened the construction of ecological civilization, actively promoted carbon neutrality in various fields, including the agricultural sector, and released a strong signal of concern about environmental protection, resource recycling, carbon reduction, and carbon reduction (Hansen et al., 2018). In 2015, China adopted the new Environment Protection Law. In 2021, the work report of the central government made clear for the first time the overall goal of carbon emission reduction of carbon peak in 2030 and carbon neutrality in 2060. The above has greatly enhanced the binding force of formal environmental regulations on environmental pollution behavior, and the cost of agricultural enterprises for pollution control and operation has also increased (Yu and Morotomi, 2022). Moreover, in addition to the formal environmental regulations implemented by the government, the public’s attention to the network should not be underestimated. Under the background that environmental protection is increasingly valued by society, Chinese people have been paying close attention to the environmental pollution problem of agricultural enterprises, and have made a voice in the network to form a strong network attention, to provide support for the green development of agricultural enterprises. However, as an informal environmental regulation that complements formal environmental regulation, whether and how network attention affects the carbon dioxide emission performance of agricultural enterprises has not received enough attention from the academic community (Chen and Wu, 2021). In particular, there remain some academic differences in the relationship between network attention and the performance of companies’ carbon dioxide emissions. The “irrelevance theory” (Hart and Ahuja, 1996; Ziegler et al., 2008), “promotion theory” (Kathuria, 2007; Zheng et al., 2018; Han, 2022), and other views have been put forward. The lack of direct empirical evidence makes it necessary to systematically investigate and analyze the impact and mechanism of network attention on the carbon dioxide emission performance of agricultural listed companies under the Chinese scenario. Given this, this paper takes China’s agricultural listed companies from 2012 to 2020 as a sample to systematically investigate the possible impact of network attention on carbon dioxide emission performance and its impact mechanism.
Compared with the previous literature, the marginal contributions that this study may bring are as follows: First, because of the controversy of “network attention and carbon dioxide emission performance”, we use the data generated by the largest search engine in China to systematically investigate the impact of network attention on carbon dioxide emission performance; Second, focus on the agricultural sector, which has been less involved in previous studies, analyze and examine the impact mechanism of network attention on the carbon dioxide emission performance of agricultural listed companies, and thicken the mechanism literature of “network attention - environmental governance” in developing countries; Third, the conclusions of this paper also provide ideas and suggestions for promoting the green development of agriculture in developing countries and strengthening the carbon neutral governance under the network media.
Carbon dioxide emission performance is a beneficial result of the ecological restoration and protection of environmental pollution by the emission subject (Hou et al., 2021), which shows the positive action on the prevention and control of greenhouse gases such as carbon dioxide (Nkhata and Breen, 2010). It is worth noting that existing studies have shown that network attention as a non-environmental regulation can bring direct and indirect effects on the performance of carbon dioxide emissions (Sissenwine, 2007). Focusing on the issue of network attention and carbon dioxide emission performance, existing studies have focused on the impact of formal environmental regulations on carbon dioxide emission performance, and the impact and mechanism of network attention on carbon dioxide emission performance.
The first piece of literature is about the relationship between formal environmental regulation and carbon dioxide emission performance. Most of the existing studies believe that formal environmental regulations such as environmental protection laws can help promote carbon dioxide emission performance. On the one hand, the traditional hypothesis is that there is a mutual constraint between the environmental objectives and the objectives of the enterprise. Meeting the objectives of one party will inevitably negatively affect the objectives of the other party, which could have a negative impact on the performance of carbon dioxide emissions (Johnson, 2010). For example, Gray and Shadbegian (1995) took the U.S. pulp and paper industry, petroleum refining industry, and steel industry as the research object, and found that the increase of environmental costs inhibited the growth of productivity level, that is, the productivity level and growth rate of enterprises subject to stricter environmental control were significantly lower than those subject to less environmental control. Yang et al. (2012) also show that it is difficult to improve the performance of companies’ carbon dioxide emissions solely through spontaneous market behaviour. Cui et al. (2015) analyzed the carbon dioxide emissions performance of the U.S. manufacturing industry and found that there was an inverse relationship between enterprise productivity and carbon dioxide emissions per unit output. On the other hand, in recent years, more and more scholars believe that formal environmental regulation led by the government can significantly improve the performance of carbon dioxide emissions (Shen, 2016). Zhao and Luo (2017) have shown that official regulations, including emissions monitoring and the implementation of standards, are key factors in promoting the reduction of carbon dioxide emissions. Wang et al. (2020) found that formal environmental regulations such as environmental supervision have a positive effect on the reduction of carbon dioxide emissions in Chinese provinces. Jia and Lin (2021) proposed that under China’s “carbon neutral” policy scenario, formal environmental regulations should play a moderating role in reducing the intensity of carbon dioxide emissions.
The second literature on the relationship between network attention and the performance of carbon dioxide emissions, but there are also a few arguments. First, a small number of studies have found that informal environmental regulation such as network attention, has no correlation with carbon dioxide emission performance. Hart and Ahuja (1996) found that environmental protection measures taken by non-governmental organizations or markets do not clearly correlate with the performance of carbon dioxide emissions. Ziegler et al. (2008) found that informal environmental regulation could not achieve an obvious response to environmental governance. Second, informal environmental regulations such as media pressure and network pressure can significantly improve the performance of carbon dioxide emissions. Kathuria (2007) found that the pressure of news reports significantly reduced the pollutant emission intensity of enterprises according to the research on media pressure and environmental governance performance in India. Zheng et al. (2018) found that online media attention will put greater pressure on companies’ environmental governance, forcing them to respond to improve the performance of carbon dioxide emissions. Han (2022) proposed that the pressure from the media and public opinion supervision becomes the power of enterprise environmental protection, which can imperceptibly change the enterprise’s environmental protection ideas, from environmental end treatment to cleaner production, and bring a positive impact on enterprise environmental governance.
The third literature discusses the mechanism of the influence of network attention on carbon dioxide reduction. Most scholars focus on the pressure mechanism, which can be subdivided into reputation pressure, disciplinary pressure, and market pressure. First of all, network attention will bring reputation pressure to pollution-discharging enterprises, and affect carbon dioxide emissions and governance behavior. Lesser (2008) pointed out that network attention would bring reputation pressure to enterprises, forcing enterprises to make decisions to fulfill environmental protection responsibilities and improve environmental performance. Khaqqi et al. (2018) believed that for the consideration of future development and enterprise value, enterprises often attach importance to their reputation in the network. The media pays attention to environmental protection issues such as carbon dioxide emissions of enterprises, puts them under reputation pressure, and promotes enterprises to increase investment in environmental protection and improve environmental performance. Moreover, higher network attention will attract the attention of regulatory authorities, especially the unofficial negative environmental protection information disclosed by the network, which is easy to bring administrative punishment pressure and risk to enterprises and urge them to improve their carbon dioxide emission behavior. Cheng and Liu (2018) found that network information would increase regulatory attention and the likelihood of penalties for heavily polluting corporations. Zhang and Xie (2020) found that the supply of public opinion and other information increases the cost of pollution and the fear of environmental punishment, which helps to form external constraints on environmental pollution behavior. In addition, media and network attention have brought market pressure to enterprises and promoted enterprises to reduce carbon emissions. For example, Cai et al. (2020) believed that media and network attention would bring strong market pressure to listed companies in the capital market and stimulate listed companies to adopt green technology to reduce environmental risks. Lei et al. (2022) pointed out that under the network focus scenario, listed companies have the motivation to respond to market green development expectations and improve environmental competitiveness.
To sum up, although many pieces of literature believe that enterprises will improve the performance of carbon dioxide emissions due to the pressure of network attention, there are still some conclusions to the contrary. In particular, the existing literature has not explored the relationship between the agricultural sector’s network concern and carbon dioxide emissions performance, and there is little direct evidence from the agricultural sector in developing countries, which requires systematic analysis and investigation. Accordingly, this paper focuses on the impact of the network attention of agricultural listed companies, the main body of pollutant emissions in non-industrial sectors ignored by the academic community, on the performance of carbon dioxide emissions, to strengthen the academic understanding of “the mystery of network attention and agricultural carbon reduction".
The instrumental variable model is an effective estimation model to solve the endogenous problem, and it has strong applicability to alleviate the self-selection of samples and overcome the high correlation between independent variables and random disturbance items (Amemiya, 1985). Compared with other estimation models, the instrumental variable model makes the causal relationship evaluation between independent variables and dependent variables more objective by looking for instrumental variables that are highly related to independent variables and not related to random error terms (Cragg and Donald, 1993). formula (1) shows the IV model:
In Eq. 1,
The IV model is the basis for us to examine the relationship between network attention and the carbon dioxide emission performance of agricultural enterprises. Next, based on Eq. 1, the exogenous instrumental variable model is used to examine the impact of network attention on the carbon dioxide emission performance of agricultural enterprises. At the same time, it is effective to use lag-independent variables to construct tool variables, which is helpful to estimate consistent estimators of parameters (Koop et al., 2012). The specific model 2) is constructed, as shown in Eq. 2:
In Eq. 2,
Carbon dioxide emission performance (
Tool variables of network attention (Media): Network attention refers to the degree of the public’s attention to the enterprise based on the internet media, which is measured by the search index. In the context of the Chinese internet, the public first chooses Baidu Search, the largest local search engine, to focus on relevant enterprises and express their opinions online. With reference to the practice of McCreery (2010), based on the number of internet users searching in Baidu, define the first tool variable, the total annual network attention (Media_total). Furthermore, to avoid the error in the estimation of a single indicator, based on Kitty (2011) and other ideas, the second instrumental variable - the annual total number of urban broadband access users (Access_user) is set.
Environmental protection administrative punishment (Epap): Formal environmental regulation is an important external factor driving enterprises to improve environmental protection behavior. A strong administrative sanction to protect the environment will limit companies’ carbon emissions behaviour and correct their inappropriate behaviour in environmental governance. In order to control the impact of administrative power on the performance of carbon dioxide emissions, referring to the practice of Ding and Shahzad (2022), the intensity of formal environmental regulation is measured based on the annual environmental protection administrative punishment of agricultural listed companies.
Financial leverage (Lev): Since carbon reduction itself is a high investment, long cycle process, enterprises need to raise necessary funds for environmental protection equipment upgrading, emission reduction technology upgrading, etc. through financial leverage. The ratio of total liabilities to total assets of agricultural listed companies is used to measure the level of financial leverage.
Enterprise size (Size): In addition to the capital factor, another factor closely related to the performance of carbon dioxide emissions is enterprise size. Larger enterprises tend to emit more greenhouse gases, and the corresponding greenhouse gas emission intensity will also be affected. We refer to the practice of Shao et al. (2016) and introduce the enterprise scale variable. The logarithmic measurement of enterprise asset scale is intended to control the change of environmental protection governance effect brought by enterprise scale.
Development status (Growth): Enterprises at different stages of development will present different environmental governance motivations. When enterprises develop rapidly, their carbon dioxide emissions will increase. They will face greater pressure on environmental governance and may invest more funds in the field of environmental governance to promote the improvement of carbon dioxide emissions performance. We learn from Soltani et al. (2021). The growth rate of business income is used to measure the development status, so as to control the impact of development status on carbon dioxide emission performance.
Age of establishment (Firmage): The operation and management activities of enterprises that have been established for a long time are relatively standardized, and they are motivated to implement more strict environmental governance behaviors, thus causing changes in the performance of enterprises’ carbon dioxide emissions. Refer to Cole et al. (2015) and measure the above indicators by taking logarithms of the company’s establishment years.
Board governance (Board): The board of directors is the core organization for business decision-making, and the governance of the board of directors determines the corporate environmental governance behavior to a large extent. A larger board size means more directors participate in environmental governance decisions. In order to control the decision-making behavior of the board of directors on environmental governance, referring to the practice of Okoye (2010), we measure the governance variables of the board of directors by taking logarithms of the size of the board of directors.
Environmental protection investment (Epinvest): Listed agricultural companies under the pressure of network media have the motivation to increase environmental protection investment and improve environmental performance. At a time when environmental protection is becoming increasingly important, network attention may stimulate enterprises to pay attention to environmental protection, force them to invest more funds in the field of environmental protection, and bring about changes in the carbon dioxide emission performance of agricultural listed companies. With reference to Liu et al. (2022), it is measured by the annual environmental protection investment of agricultural listed companies. Table 1.
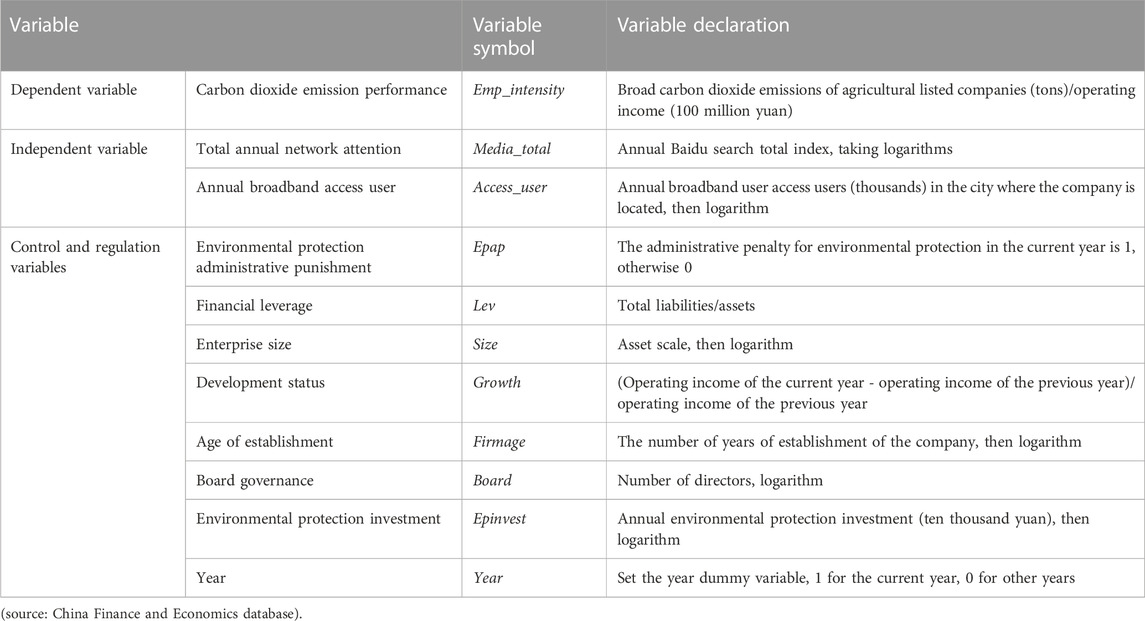
TABLE 1. Variable definitions.
This paper selects China’s A-share agricultural listed companies from 2012 to 2020 as the initial sample, and standardizes the sample as follows: 1) exclude the sample of agricultural listed companies that are specially treated by the CSRC and have delisting risks; 2) Remove the samples of agricultural listed companies with more missing data; 3) Exclude the sample of agricultural listed companies that have been listed for less than 2 years. In addition, in order to supplement panel data, some missing values are supplemented by the industry average. After sorting out, 324 sample observations were obtained. The Baidu search index is derived from the data disclosed by the Baidu search engine, and other variable data is derived from the China Finance and Economics (CSMAR) database.
Table 2 reports the descriptive statistics of the main variables. The mean value of Emp_intensity is 3.552, the standard deviation is 11.853, the minimum value is 0.000, and the maximum value is 116.755, which indicates that there are obvious differences in carbon dioxide emission intensity of Chinese agricultural listed companies. Combined with the time series distribution data in Table 3, from the data on carbon dioxide emission intensity of listed agricultural companies in China from 2012 to 2020, the annual average of carbon dioxide emission intensity during the statistical period is 3.552. The decline in carbon dioxide emission intensity after 2017 is very obvious. It should be noted that before 2017, although the carbon dioxide emission intensity of Chinese agricultural listed companies was at a low level, it was mainly due to the small scale of non-modern agriculture and low carbon dioxide emissions. In 2017, the central government of China put forward the concept of “agricultural modernization” in the government work report for the first time, and actively advocated the development of “green agriculture”. Later, a group of large agricultural listed companies with modern characteristics and practices to reduce carbon dioxide emissions grew rapidly. Therefore, the carbon dioxide emission intensity of agricultural listed companies shows the characteristics of the decreasing year by year and improving carbon dioxide emission performance.
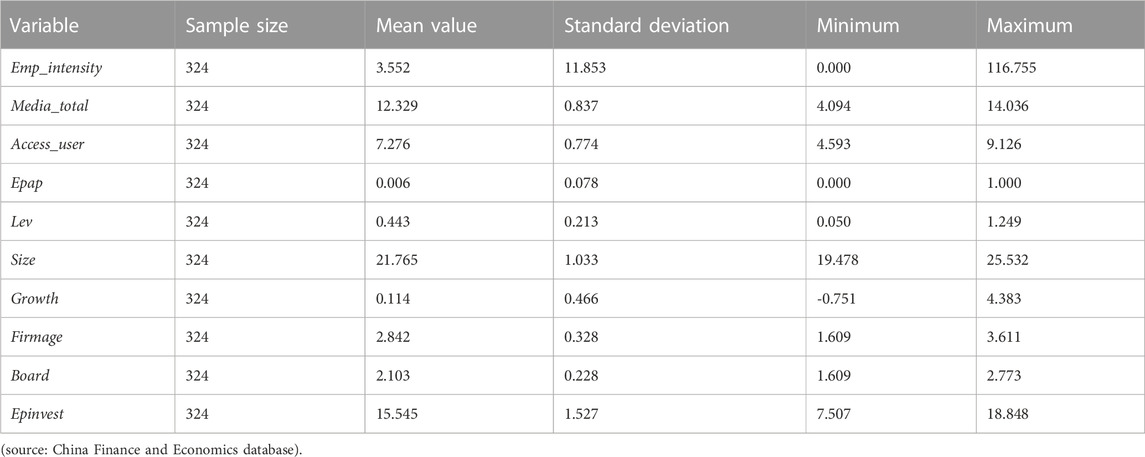
TABLE 2. Descriptive statistics of the main variables.
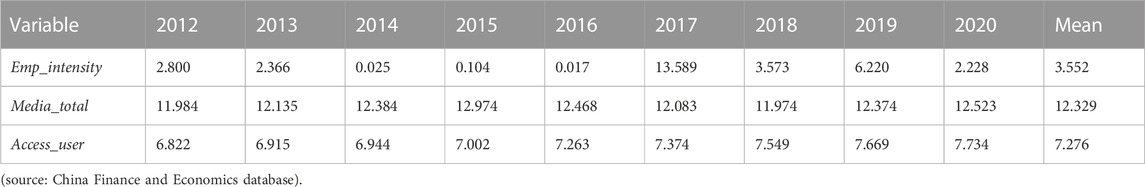
TABLE 3. Time series distribution of carbon dioxide emission performance (Emp_intensity) and network attention (Media).
Among the independent variables of network attention, the average value of Media_total is 12.329, and the standard deviation is 0.837, indicating that China’s agricultural listed companies have more widespread network concerns. Another independent variable, Access_user, is 7.276, with a standard deviation of 0.774, which also shows that there are many network users in the cities where agricultural listed companies are located, which brings a certain scale of network attention. Combined with the temporal distribution description of network attention in Table 3, Media_total and Access_user values are increasing year by year, which shows that Chinese agricultural listed companies are increasingly concerned by the network. From the perspective of control variables, the mean values of Epap, Lev, Size, Growth, Firmage, and Board variables are 0.006, 0.443, 21.765, 0.114, 2.842, and 2.103 respectively, and the standard deviations are 0.078, 0.213, 1.033, 0.457, 0.328, and 0.228 respectively. This conveys the real information that China’s agricultural listed companies have less environmental protection punishment, use financial leverage, relatively large scale, rapid development, long establishment time, and considerable internal governance. As an adjusting variable, the average value of Epinvest is 15.545, and the standard deviation is 1.572, indicating that there are certain differences in the environmental protection investment of different agricultural listed companies. In general, the results of the descriptive statistics are basically in line with the realistic characteristics of environmental governance and network concerns of China’s agricultural listed companies. In addition, before the benchmark test, we also conducted a correlation coefficient test. The variance inflation factor was significantly lower than 10, and there was no serious multicollinearity problem among the main variables.
Due to the pressure of reputation, punishment, and market caused by network concern, agricultural listed companies are sensitive to green development issues and are prone to make more environmentally friendly behaviors, reduce environmental risks of enterprises and improve the competitiveness of carbon dioxide emissions. This makes network attention help to promote the performance of carbon dioxide emissions. Table 4 reports the results of the benchmark test based on model 2). Columns 1) and 2) examined the overall impact of the network attention of China’s agricultural listed companies on the performance of carbon dioxide emissions. In order to judge the effectiveness of the lag instrumental variables, we first test the insufficient identification and weak instrumental variables of the two instrumental variables. The total amount of network attention in the lag period Media_total(-1) and the total number of urban broadband users in the lag period Access_user(-1) is a tool variable, and the p-value of the under-identification test (Kleibergen-Paap rk LM statistic) is 0.026 and 0.000 respectively. The estimated results reject the original hypothesis, indicating that the instrumental variables are related to the original explanatory variables. In addition, the test results of weak instrumental variables (Cragg-Donald Wald F statistic) of the two instrumental variables are greater than 10, which are 97.218 and 158.535 respectively, indicating that the selection risk of instrumental variables is low. From the overall regression results, in column 1) and column 2), the estimated coefficients of Media_total and Access_user are significantly negative, indicating that the increasing network attention has significantly reduced the carbon dioxide emission intensity of agricultural listed companies and brought about better carbon dioxide emissions performance.
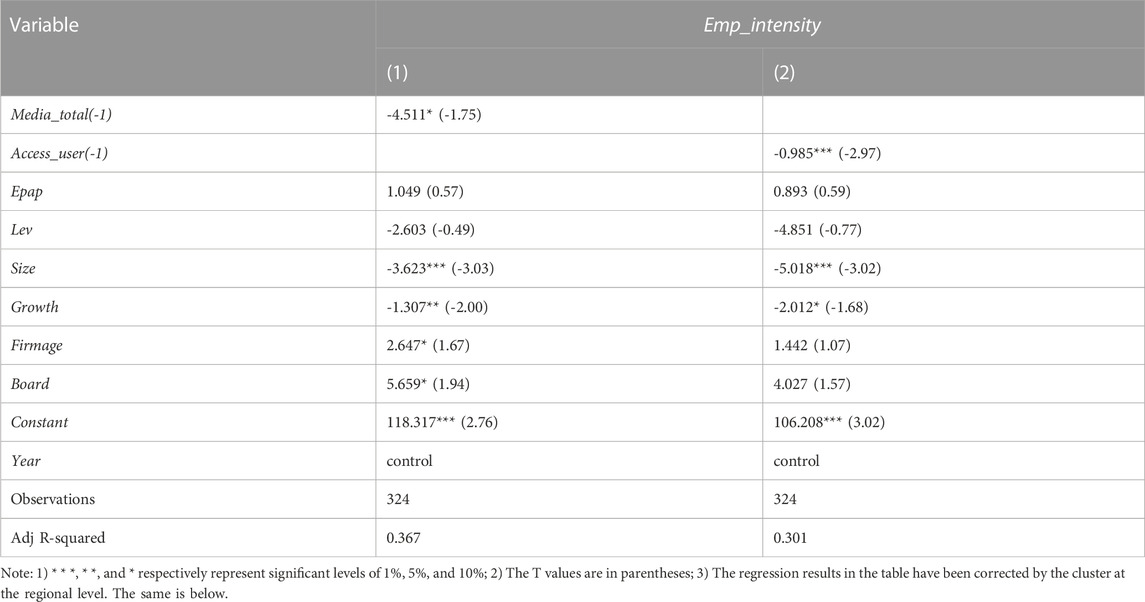
TABLE 4. Results of benchmark regression.
Table 5 reports the results of the heterogeneity test. Columns 1)–4), 5)–8), and 9)–(12) examined the impact of network attention on carbon dioxide emission performance of agricultural listed companies based on the heterogeneity of network, region, and property rights. Columns 1) to 4) are divided into PC concerns and mobile internet concerns according to the main sources of the total number of network searches. The network heterogeneity test results show that the independent variable Media_total and Access_user are only significantly negative in column 3) and column 4), with estimated coefficients of -4.921 and -2.086 respectively, indicating that the network focus mainly on mobile internet search has a more significant effect on the improvement of carbon dioxide emission performance of agricultural listed companies. From the regression of regional heterogeneity of column 5)–8) subsamples, the independent variable Media_total and Access_user are significantly negative in column 6), column 7), and column 8), and the estimated coefficients are -1.086, -6.051 and -0.573 respectively. At the same time, the coefficient difference test of variable Access_user in column 6) and column 8) shows that there is a significant difference in the estimated coefficient of independent variables, that is, the estimated coefficient of independent variables in the central and western groups is more significant. The above shows that network attention has a more significant impact on the carbon dioxide emission performance of agricultural listed companies in the central and western regions. From the regression of property right heterogeneity of subsamples 9) to (12), the independent variable is significantly negative in columns 9) and (10), and the estimated coefficients are - 7.397 and - 1.864 respectively, indicating that network attention has a more obvious impact on the environmental governance behavior of state-owned agricultural listed companies. Therefore, there is the network, regional, and property heterogeneity in the promotion of China’s network attention on the carbon dioxide emission performance of agricultural listed companies.
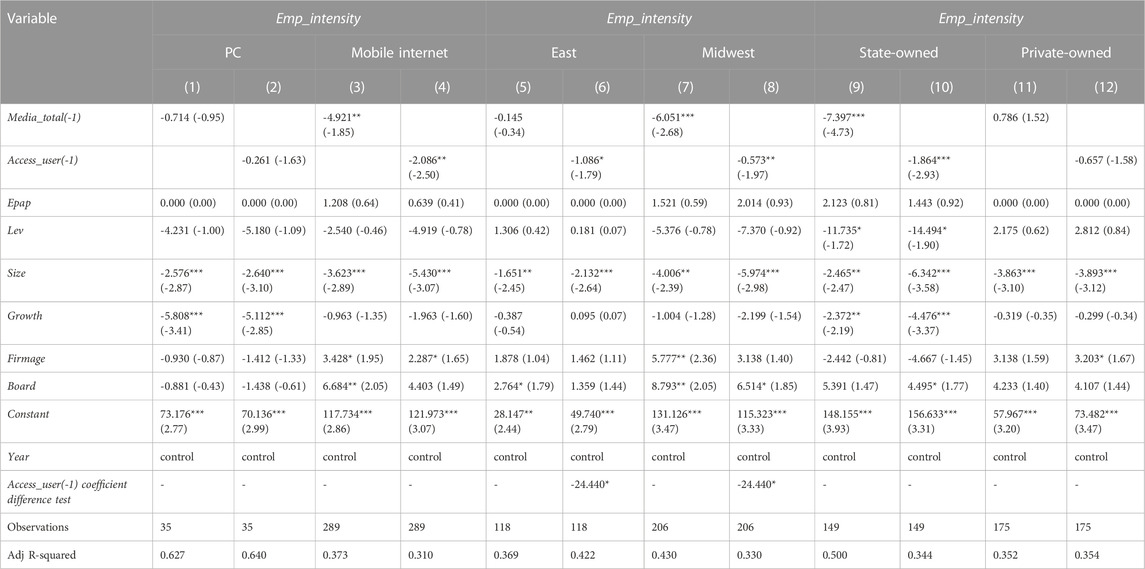
TABLE 5. Results of heterogeneity regression.
In fact, with the rapid development of the internet, the external governance effect of network attention on environmental protection is increasingly obvious (Schrlau et al., 2011). Compared with the PC’s attention, using mobile internet can get rid of location restrictions and search more convenient and accurate, which makes the attention from mobile internet not only far exceed the PC’s attention in magnitude, but also exert more obvious and focused network pressure (Wang et al., 2022), bringing more powerful carbon dioxide emission control effect than PC’s attention. In addition, the eastern coastal provinces are the regions where China opened up earlier and changed to a market economy. The agricultural enterprises in this region have a strong concept of green environmental protection. However, agricultural enterprises in the central and western regions are often inferior to those in the eastern coastal regions in terms of environmental protection awareness and behavior performance (Komarek et al., 2015), which makes the improvement effect of network attention on the carbon dioxide emission performance of agricultural enterprises in the central and western regions more obvious. Finally, the nature of property rights of Chinese enterprises includes state-owned and private enterprises, and there are significant differences in the motivation and motivation of corresponding emission reduction (Wu et al., 2019). Compared with private agricultural listed companies with the primary goal of chasing profits, state-owned agricultural listed companies also shoulder the goal of fulfilling political tasks and social responsibilities. It has more power to actively respond to network concerns and public expectations by reducing other greenhouse emissions per unit product, making the network focus more significant in improving the carbon dioxide emission performance of state-owned agricultural listed companies.
In recent years, promoting green and low-carbon transformation has been regarded as an important direction for enterprises to move towards high-quality development and has attracted the attention of Chinese netizens. In this context, agricultural listed companies will pay more attention to environmental protection issues and have the motivation to respond to network concerns, to invest more costs to promote environmental protection, which makes environmental protection costs play a mechanistic role for the network to focus on improving the performance of carbon dioxide emissions. On the one hand, a higher degree of network attention can help alleviate the degree of environmental information asymmetry of agricultural listed companies, enable them to detect and fill gaps while enhancing environmental awareness (Lo et al., 2012), and help enterprises reasonably increase environmental protection investment expenditure; On the other hand, highly concerned enterprises have a higher exposure probability of environmental protection news, which will make agricultural listed companies fully feel the public’s environmental protection requirements, and to alleviate the pressure on environmental protection (Hu et al., 2019), increase the investment in environmental protection costs, enhance the “carbon reduction and consumption reduction” efforts, to meet the social environmental protection requirements.
Based on model 2), add the Epinvest regulatory variable representing the environmental protection cost input. Via Media_total(-1) * Epivest(-1) and Access_user(-1) * Epinvest(-1) two interaction terms are used to test the possible mechanism of environmental protection investment. Table 6 reports the mechanism test results. In column 1), the estimated coefficient of Media_total(-1) * Epivest(-1) is -2.215, and it is significantly negative at the level of 5%. This shows that the investment in environmental protection has adjusted the relationship between network attention and carbon dioxide emission intensity of agricultural listed companies, and has significantly promoted the reduction of carbon dioxide emission intensity of agricultural listed companies. In addition, in column 2), the estimated coefficient of Access_user(-1) * Epinvest(-1) is also significantly negative, which further confirms the above conclusion. To sum up, the investment in environmental protection costs will strengthen the inhibition effect of network attention on the unit carbon dioxide emissions of agricultural listed companies.
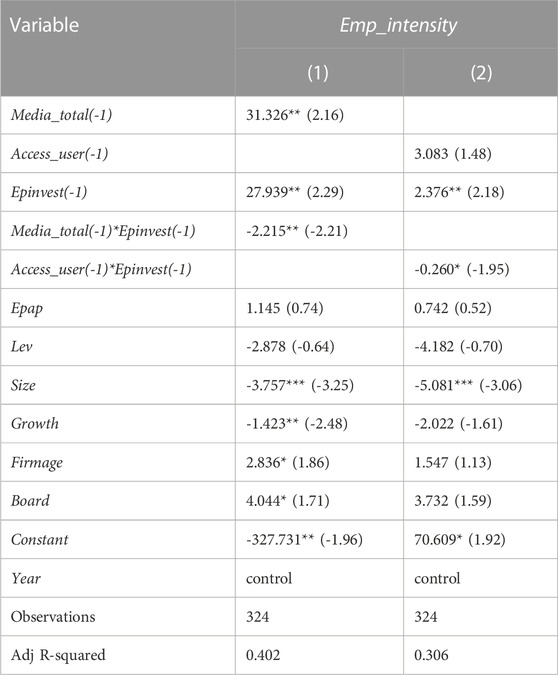
TABLE 6. Results of mechanism testing.
In the part of the robustness test, we focus on mitigating possible estimation bias caused by variable selection and model setting. The robustness regression by replacing key variables, adjusting the model, and deleting the samples of special years. First, replace variables and models. Considering that network attention is not only reflected in the annual search volume based on mainstream search engines, but also reflected in the amount of attention from computers and mobile internet. Therefore, referring to Francesca et al. (2017), we set into the computer side annual network attention (Pc_total) alternative indicators for regression; Second, transform the model. Due to the possible non-linear relationship between the network attention and the carbon dioxide emission performance of agricultural enterprises, referring to Shakil (2020), the original model introduced the quadratic term of the independent variable (Pc_total^2) to test again; Finally, delete the special year regression. Since 2019, the central government of China has issued the “Regulations on the Supervision of Central Ecological Environment Protection” and implemented a more explicit ecological environment protection supervision system. The government’s increased environmental protection supervision may have a disturbing impact on the carbon dioxide emission performance of agricultural enterprises. Referring to the practice of Zhan et al. (2022), the samples in 2019 and 2020 were excluded from robustness testing. From the results of the robustness test in Table 7, in column 1), after replacing the variable and model, the variable Pc_total estimated coefficient is still significantly negative. In column 2), after non-linear model regression, there is no significant non-linear relationship between annual PC network attention (Pc_total) and carbon dioxide emission performance (Emp_intensity), indicating that the original linear regression results are reliable. In column 3), after deleting the special year sample, the variable Pc_total estimated coefficient is still significantly negative. The above tests show that the previous conclusions are relatively robust.
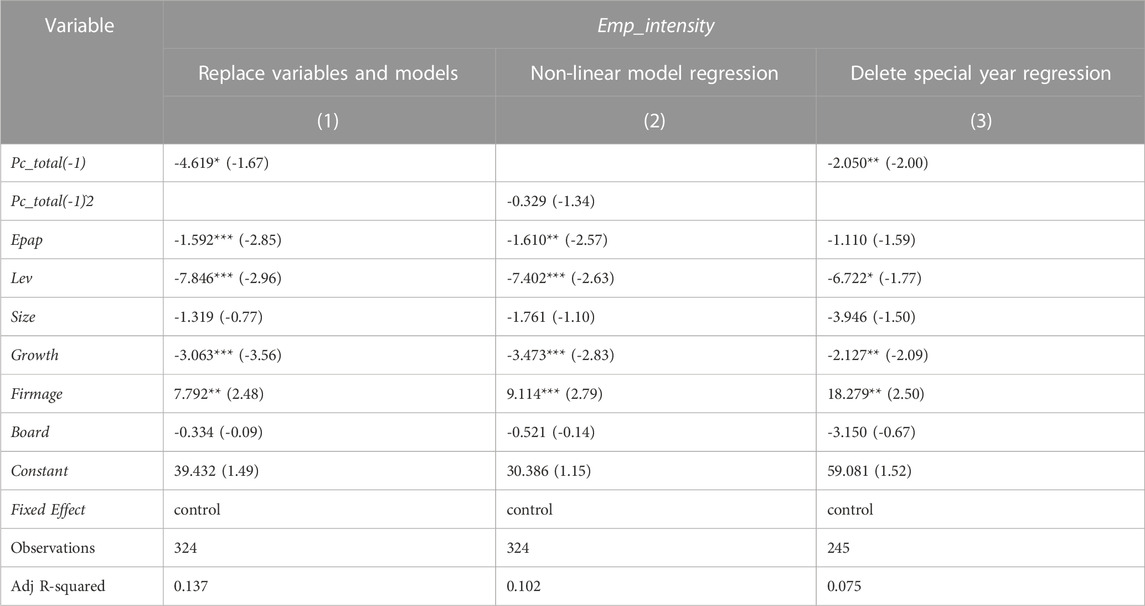
TABLE 7. Robustness test results.
China is the largest developing country in the world and the country with the largest number of internet users. The environmental governance effect of its network attention deserves attention. This paper focuses on the agriculture sector, which has been neglected in the past and uses the unique network attention data in China to study the impact of network attention on the carbon dioxide emission performance of agricultural listed companies. The research found that: 1) By measuring the carbon dioxide emission intensity of China’s agricultural listed companies, it is found that the overall carbon dioxide emission intensity is decreasing year by year and the carbon dioxide emission performance is improving; 2) Based on the instrumental variable model, the impact of network attention on the carbon dioxide emission performance of agricultural listed companies was examined. It was found that the increasing network attention significantly reduced the carbon dioxide emission intensity of agricultural listed companies, and brought better carbon dioxide emission performance; 3) Based on the heterogeneity analysis, it is found that there are network, regional, and property heterogeneity in the promotion of China’s network attention on the carbon dioxide emission performance of agricultural listed companies; 4) Taking environmental protection investment as the potential mechanism, the test found that environmental protection investment will strengthen the inhibition effect of network attention on carbon dioxide emissions per unit of agricultural listed companies.
The research conclusions provide useful ideas and wisdom for China and other developing countries to promote carbon-neutral action, tap the potential of emission reduction in the agricultural sector, and give full play to the emission reduction effect of network governance. We suggest that: 1) developing countries should give full play to the role of informal environmental regulation in environmental governance in carbon neutral action, encourage non-governmental organizations to participate in environmental protection publicity, open channels for the public to express suggestions related to environmental protection issues, and increase the network attention and response to pollution issues; 2) Local governments should earnestly fulfill the obligations of the first responsible unit for implementing the carbon neutrality task in the region, scientifically design the system and mechanism for regional coordinated control of carbon dioxide emissions, encourage the green and low-carbon development of agriculture, and other sectors, and do good in guiding the public opinion of the carbon neutrality network; 3) Agricultural listed companies should pay attention to the carbon dioxide governance effect of network concern, actively look at the environmental pressure brought by network concern, actively respond to the environmental protection opinions of network concern and increase the investment in environmental protection costs, promote the improvement of carbon dioxide emission performance, and promote the green and high-quality development path.
Finally, this paper may have limitations in the following aspects, which need to be deepened in the future: First, according to academic practice and data availability, this paper uses carbon dioxide emission intensity as an alternative variable of environment-related performance. If more sufficient data can be obtained in the future, it can be further expanded to other environmental pollution performance levels such as soil and water; Second, based on the characteristics of China’s online reality, this paper examines the impact of online attention on carbon dioxide emissions performance based on Baidu Search Index. In the future, we can try to use other online social media data to enrich research.
The original contributions presented in the study are included in the article/Supplementary Material, further inquiries can be directed to the corresponding author.
JC: Original writing, Editing and Revise paper HS: Original writing, Editing and Revise paper, Supervision, Data collection and analysis.
This study is partially supported by China National Social Science Fund (18BGL052).
The authors declare that the research was conducted in the absence of any commercial or financial relationships that could be construed as a potential conflict of interest.
All claims expressed in this article are solely those of the authors and do not necessarily represent those of their affiliated organizations, or those of the publisher, the editors and the reviewers. Any product that may be evaluated in this article, or claim that may be made by its manufacturer, is not guaranteed or endorsed by the publisher.
The Supplementary Material for this article can be found online at: https://www.frontiersin.org/articles/10.3389/fenvs.2023.1136318/full#supplementary-material
Amemiya, Y. (1985). Instrumental variable estimator for the nonlinear errors-in-variables model. J. Econ. 28 (3), 273–289. doi:10.1016/0304-4076(85)90001-6
Cai, X., Zhu, B., Zhang, H., Li, L., and Xie, M. (2020). Can direct environmental regulation promote green technology innovation in heavily polluting industries? Evidence from Chinese listed companies. Sci. Total Environ. 746, 140810. doi:10.1016/j.scitotenv.2020.140810
Chen, W., and Wu, Y. (2021). China's new environmental protection law and green innovation: Evidence from prefecture-level cities. Complexity 36, 1–13. doi:10.1155/2021/5566357
Cheng, J., and Liu, Y. (2018). The effects of public attention on the environmental performance of high-polluting firms: Based on big data from web search in China. J. Clean. Prod. 186, 335–341. doi:10.1016/j.jclepro.2018.03.146
Cole, M., Elliott, R., and Shimamoto, K. (2015). Globalization, firm-level characteristics and environmental management: A study of Japan. Ecol. Econ. 59 (3), 312–323. doi:10.1016/j.ecolecon.2005.10.019
Cragg, J. H., and Donald, S. (1993). Testing identifiability and specification in instrumental variable models. Econ. Theory 9 (2), 222–240. doi:10.1017/S0266466600007519
Cui, J., Lapan, H., and Moschini, G. C. (2015). Productivity, export, and environmental performance: Air pollutants in the United States. Am. J. Agric. Econ. 98 (2), 447–467. doi:10.1093/ajae/aav066
Ding, X., and Shahzad, M. (2022). Environmental administrative penalty, environmental disclosures, and the firm’s cash flow: Evidence from manufacturing firms in China. Environ. Sci. Pollut. Res. 29 (24), 36674–36683. doi:10.1007/s11356-021-18145-3
Francesca, F., Andrea, M., Martella, D., and Casagrande, M. (2017). Development in attention functions and social processing: Evidence from the attention network test. Br. J. Dev. Psychol. 35 (2), 169–185. doi:10.1111/bjdp.12154
Gray, W. B., and Shadbegian, R. J. (1995). Pollution abatement costs,regulation,and plant-level productivity. Cambridge, Massachusetts: National Bureau of Economic Research. doi:10.3386/w4994
Han, Y. (2022). Promoting green economy efficiency through fiscal decentralization and environmental regulation. Environ. Sci. Pollut. Res. 9, 11675–11688. doi:10.1007/s11356-022-22952-7
Hansen, M. H., Li, H., and Svarverud, R. (2018). Ecological civilization: Interpreting the Chinese past, projecting the global future. Glob. Environ. Change 53 (11), 195–203. doi:10.1016/j.gloenvcha.2018.09.014
Hart, S. L., and Ahuja, G. (1996). Does it pay to be green? An empirical examination of the relationship between emission reduction and firm performance. Bus. Strategy Environ. 5, 30–37. doi:10.1002/(SICI)1099-0836(199603)5:1<30:AID-BSE38>3.0.CO;2-Q
Hou, Y., Zhang, K., Zhu, Y., and Liu, W. (2021). Spatial and temporal differentiation and influencing factors of environmental governance performance in the Yangtze River Delta, China. Sci. Total Environ. 801 (11), 149699. doi:10.1016/j.scitotenv.2021.149699
Hu, X., Sun, Y., Liu, J., Meng, J., Wang, X., Yang, H., et al. (2019). The impact of environmental protection tax on sectoral and spatial distribution of air pollution emissions in China. Environ. Res. Lett. 14 (5), 054013. doi:10.1088/1748-9326/ab1965
Jia, Z., and Lin, B. (2021). How to achieve the first step of the carbon-neutrality 2060 target in China: The coal substitution perspective. Energy 233 (11), 121179. doi:10.1016/j.energy.2021.121179
Johnson, T. (2010). Environmentalism and NIMBYism in China: Promoting a rules-based approach to public participation. Environ. Polit. 19 (3), 430–448. doi:10.1080/09644011003690914
Kathuria, V. (2007). Informal regulation of pollution in a developing country: Evidence from India. Ecol. Econ. 63 (2-3), 403–417. doi:10.1016/j.ecolecon.2006.11.013
Khaqqi, K. N., Sikorski, J. J., Hadinoto, K., and Kraft, M. (2018). Incorporating seller/buyer reputation-based system in blockchain-enabled emission trading application. Appl. energy 209, 8–19. doi:10.1016/j.apenergy.2017.10.070
Kitty, V. V. (2011). Review: Environment, media and communication. Media Int. Aust. 138 (1), 161–162. doi:10.1177/1329878X1113800119
Komarek, A. M., Li, L. L., and Bellotti, W. D. (2015). Whole-farm economic and risk effects of conservation agriculture in a crop-livestock system in Western China. Agric. Syst. 137, 220–226. doi:10.1016/j.agsy.2014.10.013
Koop, G., Gonzalez, L. R., and Strachan, R. (2012). Bayesian model averaging in the instrumental variable regression model. J. Econ. 171 (2), 237–250. doi:10.1016/j.jeconom.2012.06.005
Lei, Z., Huang, L., and Cai, Y. (2022). Can environmental tax bring strong porter effect? Evidence from Chinese listed companies. Environ. Sci. Pollut. Res. 29 (21), 32246–32260. doi:10.1007/s11356-021-17119-9
Lesser, W. (2008). Environmental protection and the social responsibility of firms: Perspectives from law, economics and business. Am. J. Agric. Econ. 90 (1), 283–285. doi:10.1111/j.1467-8276.2007.00998_4.x
Liu, G., Yang, Z., and Zhang, F. (2022). Environmental tax reform and environmental investment: A quasi-natural experiment based on China's environmental protection tax law. Energy Econ. 109, 106000. doi:10.1016/j.eneco.2022.106000
Lo, H. W., Fryxell, G. E., Rooij, B. V., Wang, W., and Li, P. H. (2012). Explaining the enforcement gap in China: Local government support and internal agency obstacles as predictors of enforcement actions in Guangzhou. J. Environ. Manag. 30 (11), 227–235. doi:10.1016/j.jenvman.2012.07.025
McCreery, A. C. (2010). Media attention, political processes, and air pollution in the United States: A time - series analysis (1959-1998). Organ. Environ. 23 (3), 255–270. doi:10.1177/1086026610382619
Nkhata, B. A., and Breen, C. M. (2010). Performance of community-based natural resource governance for the Kafue Flats (Zambia). Environ. Conserv. 37 (3), 296–302. doi:10.1017/S0376892910000585
Okoye, A. (2010). The unidirectionality of the labyrinthine reflex in relation to the unidirectionality of the optokinetic reflex. Acta oto-laryngologica 50 (7), 507–516. doi:10.3109/00016485909129226
Patten, D. M. (2005). The accuracy of financial report projections of future environmental capital expenditures: A research note. Account. Organ. Soc. 30 (5), 457–468. doi:10.1016/j.aos.2004.06.001
Schrlau, J. E., Geiser, L., Hageman, K. J., Landers, D. H., and Simonich, S. M. (2011). Comparison of lichen, conifer needles, passive air sampling devices, and snowpack as passive sampling media to measure semi-volatile organic compounds in remote atmospheres. Environ. Sci. Technol. 45 (24), 10354–10361. doi:10.1021/es202418f
Shakil, M. H. (2020). Environmental, social and governance performance and stock price volatility: A moderating role of firm size. J. Public Aff. 22 (3). doi:10.1002/pa.2574
Shao, S., Liu, J., Geng, Y., Miao, Z., and Yang, Y. (2016). Uncovering driving factors of carbon emissions from China's mining sector. Appl. Energy 166 (15), 220–238. doi:10.1016/j.apenergy.2016.01.047
Shen, W., Liu, Y., Yan, B., Wang, J., He, P., Zhou, C., et al. (2016). Cement industry of China: Driving force, environment impact and sustainable development. Renew. Sustain. Energy Rev. 11, 618–628. doi:10.1016/j.rser.2016.11.033
Sissenwine, M. (2007). Environmental science, environmentalism and governance. Environ. Conserv. 34 (2), 90–91. doi:10.1017/s0376892907003906
Soltani, M., Kashkooli, F. M., Souri, M., Rafiei, B., Jabarifar, M., Gharali, K., et al. (2021). Environmental, economic, and social impacts of geothermal energy systems. Renew. Sustain. Energy Rev. 140, 110750. doi:10.1016/j.rser.2021.110750
Wang, J., Wang, W., Ran, Q., Irfan, M., Ren, S., Yang, X., et al. (2022). Analysis of the mechanism of the impact of internet development on green economic growth: Evidence from 269 prefecture cities in China. Environ. Sci. Pollut. Res. 29 (7), 9990–10004. doi:10.1007/s11356-021-16381-1
Wang, Z., Xia, Z., and Xia, Y. (2020). Dynamic relationship between environmental regulation and energy consumption structure in China under spatiotemporal heterogeneity. Sci. Total Environ. 738 (1), 140364. doi:10.1016/j.scitotenv.2020.140364
Wu, P., Wang, Y., Chiu, Y. H., Li, Y., and Lin, T. Y. (2019). Production efficiency and geographical location of Chinese coal enterprises - undesirable EBM DEA. Resour. Policy 64 (12), 101527. doi:10.1016/j.resourpol.2019.101527
Yang, C. H., Tseng, Y. H., and Chen, C. P. (2012). Environmental regulations, induced R&D, and productivity: Evidence from Taiwan's manufacturing industries. Resour. Energy Econ. 34 (4), 514–532. doi:10.1016/j.reseneeco.2012.05.001
Yu, C., and Morotomi, T. (2022). The effect of the revision and implementation for environmental protection law on ambient air quality in China. J. Environ. Manag. 306 (3), 114437. doi:10.1016/j.jenvman.2022.114437
Zhan, X. G., Li, R. Y. M., Liu, X. Y., He, F., Wang, M. T., Qin, Y., et al. (2022). Fiscal decentralisation and green total factor productivity in China: SBM-GML and IV model approaches. Front. Environ. Sci. 10, 989194. doi:10.3389/fenvs.2022.989194
Zhang, T., and Xie, L. (2020). The protected polluters: Empirical evidence from the national environmental information disclosure program in China. J. Clean. Prod. 258 (2), 120343. doi:10.1016/j.jclepro.2020.120343
Zhang, Y. L., and Cao, F. (2015). Is it time to tackle PM2.5 air pollutions in China from biomass-burning emissions? Environ. Pollut. 202 (7), 217–219. doi:10.1016/j.envpol.2015.02.005
Zhao, X., and Luo, D. (2017). Driving force of rising renewable energy in China: Environment, regulation and employment. Renew. Sustain. Energy Rev. 68 (1), 48–56. doi:10.1016/j.rser.2016.09.126
Zheng, Y., Ru, G., and Yan, L. (2018). The impact of informal environmental regulation on inter-regional transfer decision of pollution enterprises. J. Industrial Technol. Econ. 37 (10), 137–142. doi:10.1016/j.rser.2016.09.126
Keywords: carbon neutralization, network attention, carbon dioxide emission intensity, environmental protection investment, IV model
Citation: Chen J and Sun H (2023) Network attention and carbon dioxide emission performance of agricultural enterprises: Empirical evidence from China’s baidu search index. Front. Environ. Sci. 11:1136318. doi: 10.3389/fenvs.2023.1136318
Received: 02 January 2023; Accepted: 06 February 2023;
Published: 17 February 2023.
Edited by:
Rita Yi Man Li, Hong Kong Shue Yan University, Hong Kong SAR, ChinaReviewed by:
Guangqin Li, Anhui University of Finance and Economics, ChinaCopyright © 2023 Chen and Sun. This is an open-access article distributed under the terms of the Creative Commons Attribution License (CC BY). The use, distribution or reproduction in other forums is permitted, provided the original author(s) and the copyright owner(s) are credited and that the original publication in this journal is cited, in accordance with accepted academic practice. No use, distribution or reproduction is permitted which does not comply with these terms.
*Correspondence: Heng Sun, c3lfYmZ1cGhkQDE2My5jb20=
Disclaimer: All claims expressed in this article are solely those of the authors and do not necessarily represent those of their affiliated organizations, or those of the publisher, the editors and the reviewers. Any product that may be evaluated in this article or claim that may be made by its manufacturer is not guaranteed or endorsed by the publisher.
Research integrity at Frontiers
Learn more about the work of our research integrity team to safeguard the quality of each article we publish.