
94% of researchers rate our articles as excellent or good
Learn more about the work of our research integrity team to safeguard the quality of each article we publish.
Find out more
ORIGINAL RESEARCH article
Front. Environ. Sci., 30 March 2023
Sec. Atmosphere and Climate
Volume 11 - 2023 | https://doi.org/10.3389/fenvs.2023.1135030
This article is part of the Research TopicClimate-Environment Interactions under Global WarmingView all 25 articles
 Yuanmeng Li1,2,3,4
 Jieming Chou1,2,3,4*
 Weixing Zhao1,2,3,4
 Yuan Xu1,2,3,4
 Yidan Hao1,2,3,4
 Haofeng Jin1,2,3,4
Most of the countries along the Belt and Road are still developing, with their carbon emissions yet to peak. There is a lack of comprehensive analysis and research to judge these countries' current carbon peak state and quantify key driving factors contributing to their carbon emissions. This study aims to fill this gap.A new method for judging a country's peak carbon status based on a time series of carbon emissions is developed. We divide the status of all countries along the Belt and Road into four categories: reached the peak, peak plateau period 1 (the downward trend is not significant), peak plateau period 2 (obvious recession), and not reached the peak. LMDI factorization is used to decompose the change in carbon emissions of energy consumption into multiple factors: carbon intensity, energy intensity, economic output, and population size, based on Kaya's identity theory. The carbon emission and socioeconomic databases from 2000 to 2019 are utilized for this analysis. The main positive driving factor of the three countries (Hungary, Romania, Czech Republic) that have reached the peak is GDP PPP per population, while other driving factors make negative contributions to carbon emissions. In some years, these countries briefly experienced a negative contribution of GDP PPP per population to carbon emissions. The driving factors of carbon emissions for countries in the peak plateau period are not stable, with contributions of GDP PPP per population, energy intensity, and carbon intensity fluctuating periodically. In countries that have not reached the peak of carbon emissions, population growth and economic growth are significant positive contributors, while the effect of driving factors that negatively contribute to carbon emissions is less obvious.The study's findings provide valuable insights into the carbon emission peak status and driving factors of countries along the Belt and Road, which can be used to guide policymaking and future research in addressing climate change and promoting sustainable development in these regions.
The increase in carbon dioxide emissions is one of the most important causes of global climate change (Rehman et al., 2021; Sovacool et al., 2021; Qader et al., 2022). This situation is a major and urgent global challenge facing humanity. In 2013, proposed the cooperation initiative of building the “New Silk Road Economic Belt” and the “21st Century Maritime Silk Road” (referred to as “the Belt and Road”) (Hong, 2016). Green development and green investment are important components of the Belt and Road Initiative (Yin, 2019; Xue et al., 2021; Fan et al., 2022). The total carbon emissions of countries along the Belt and Road account for approximately 35% worldwide (Shi et al., 2022). With the advancement of urbanization and industrialization, carbon emissions in these countries may continue to rise (Hou et al., 2020). Therefore, the changes in carbon emissions of countries along the Belt and Road will affect the progress of global carbon emission reduction.
Current research on carbon emission pathways and peaking mainly includes the following three categories: The first category judges whether a region has reached its carbon peak based on long-term emission data. This type of research generally sets goals and judgment standards first and then directly judges whether carbon has reached the peak target or predicts the peak year based on carbon emission levels or historical trajectories. For example, only when the carbon emission peak has reached the highest level compared with the latest period and a long enough period of time has passed can it be determined if regional carbon emissions have reached the peak. Within a period after carbon peaking, regional carbon emissions must be reduced to a certain level or remain stable to rule out false peaks due to other factors (Wu and Xu, 2022; Wang and Yang, 2018; Riah et al., 2021). The advantage of this type of method is that it is more accurate in judging whether carbon dioxide has historically peaked, but it cannot predict the situation of carbon peaking in the future.
The second category analyzes the influencing factors of carbon emissions based on a comprehensive model to judge the trend of carbon emissions or predict the peak year based on the changing trend of the main influencing factors. Examples include the STIRPAT model method (Ulucak et al., 2021), Kaya formula (Yamaji et al., 1991), Tapio decoupling coefficient method (Shi, 2020), LMDI decomposition model (Ang, 2004) and input‒output model (Minx et al., 2009). These studies judge and predict the future trend or peak of carbon emissions based on changes in major factors such as population, GDP, energy intensity, and technological progress. The advantage of this type of method is that it can well judge the influencing factors of carbon emissions. However, the judgment of the carbon peak may not be accurate enough.
The third category is to judge the future trajectory of urban emissions based on a certain evolution law of emissions in a certain country or region. For example, Churkina (2008) used the urban evolution model to predict the carbon emission evolution trend of a single city in the ideal state and obtained the carbon emissions under the future baseline scenario. Wang et al. (2019) used the survival model to analyze the factors affecting the timing of the carbon emission peak and predicted the conditional probability of achieving the carbon emission peak. Chou et al. (2022) used the carbon Kuznets curve (CKC) model to test national carbon emission peaks. The advantage of this type of method is that for regions with stable development, the reliability of the predicted peak time of carbon emissions is relatively high. However, it is impossible to accurately assess the influencing factors of carbon emissions, and it is not suitable for regions with large fluctuations in development.
Contemporary scholars have been conducting research on the carbon emissions of countries along the Belt and Road. Zhang and Han (2022) found that the production-type carbon emissions of these countries are significantly higher than the consumption-type carbon emissions. Moreover, the growth rate of production-type carbon emissions is faster than that of consumption-type carbon emissions. This suggests that policies aimed at reducing carbon emissions in these countries need to target production-side measures, such as improving energy efficiency in industrial processes and promoting renewable energy sources. Wang et al. (2021) divided the countries along the Belt and Road into seven regions and studied the spillover effects of carbon emissions in these countries and their feedback effects. They found that the intraregional effect is greater than the interregional effect in the 7 regions, and the spillover effect is greater than the feedback effect. These findings indicate that policies to reduce carbon emissions in the Belt and Road region should prioritize regional cooperation and collaboration to address cross-border spillover effects. Chen et al. (2020) focused on changes in capacity utilization in Belt and Road countries and evaluated carbon emission reduction as an important factor. They suggest that improving capacity utilization and reducing carbon emissions can be achieved simultaneously through the adoption of more sustainable production processes and the development of low-carbon industries. Some scholars (Han et al., 2018; Lu et al., 2020) have studied the transfer of carbon emissions in Belt and Road countries from the perspective of embodied carbon emissions. Their findings highlight the importance of taking into account the full life cycle of products and services when evaluating carbon emissions. Finally, Chou et al. (2022) used the CKC model to predict the peak situation of different country groups in the Belt and Road region. Their study suggests that while some countries in the region have already reached their peak carbon emissions, others are expected to peak in the coming years. This highlights the need for tailored policy measures that take into account the varying stages of development and emissions profiles of different countries along the Belt and Road.
Research on the countries along the Belt and Road has become a popular topic. Most of these studies used the second or third methods to evaluate the carbon emission path and peak research. The use of the first type of method is still relatively small and represents the current research gap. Moreover, current research often ignores the heterogeneity among countries at different peak stages. To fill the research gap, this paper attempts to make new contributions in the following ways. First, this paper proposes a clear carbon peak judgment model based on the first type of method and classifies the current status of all countries along the Belt and Road into three categories: not reached peak, reached peak, and plateau. Then, based on the Kaya identity in the second type of method, the LMDI decomposition model is used to study the driving factors of carbon emission changes in countries along the Belt and Road at different stages. When the reasons for peaking or not peaking in different countries are identified, policy recommendations can be made as evidence. The research question that this paper hopes to solve is what kind of peak state currently defines countries along the Belt and Road? What are the driving factors that cause them to form such a state? Only by answering these scientific questions can the green development of the Belt and Road Initiative be effectively guaranteed. Policy recommendations can then be made for potential solutions for the low-carbon development of the Belt and Road.
China’s official list of countries along the Belt and Road currently comprises 65 countries (People’s Daily Online, 2017). The specific list of countries can be found in the Appendix. Considering the availability and completeness of data, this paper excludes some countries with severe data loss, and the actual number of countries studied is 53. These countries are mainly distributed in Asia and Europe, except for some Central and Eastern European countries and Singapore, most of which are developing countries.
The carbon emission-related research data used in this paper come from greenhouse gas emissions from energy (IEA, 2021a) and world energy balances (IEA, 2021b) released by the World Energy Agency (IEA). The dataset comprises diverse categories of information pertaining to carbon emissions and energy consumption at the national level. This includes national annual total carbon emissions, national carbon emissions categorized by industry and energy, as well as national fossil energy consumption statistics. The dataset also incorporates national population and national annual GDP PPP per population figures sourced from the World Bank (2022). The temporal scope of all the data presented in the dataset spans from 2000 to 2019.
The process of judging whether carbon mission in an area reaches the peak is shown in Figure 1. The first judgment standard is to judge whether the time observation window after the carbon peak point or inflection point appears is sufficient. Within the time scale of the study, a country’s CO2 emissions will have a maximum at one time, but this time point may not be the peak or inflection point of carbon emissions (Chou et al., 2022). If the amount of data n < 5 after the maximum year, the country is considered not to have reached the peak. The reason for this is due to the fact that after a region reaches its peak carbon emissions, a considerable period of observation is still required to confirm the onset of a decline, rather than a mere reduction over a few years (Chen et al., 2021). Moreover, if the volume of data is limited, it becomes impractical to conduct trend testing.
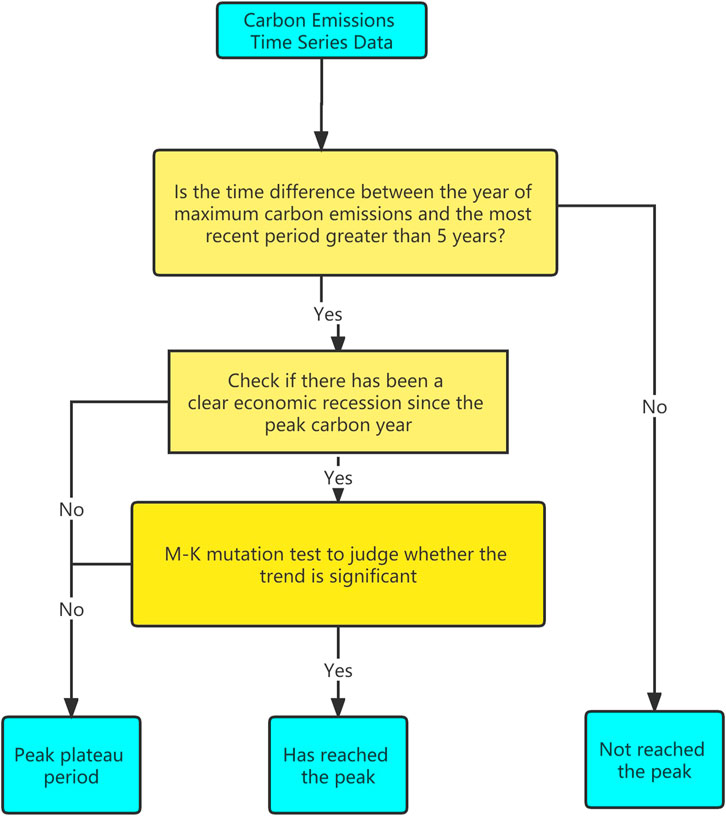
FIGURE 1. Carbon peak judgment flow chart.
The second judgment standard is to judge whether the decline in carbon emissions is due to an economic recession. The ideal reduction in carbon emissions should be caused by measures such as industrial upgrading or energy substitution. However, in reality, it may also be caused by economic recession resulting from national turmoil (Copley, 2022; Jiang & Stern, 2021. From the numerical point of view, such countries may have already completed carbon peaking. However, if such countries recover, their carbon emissions may still rise. Therefore, it cannot be considered that such countries have completed their carbon peak; they should be classified as in a plateau period.
The third judgment criterion is to judge whether the carbon emission decline trend of the countries reaching the peak or inflection point is significant in the following time. This article uses the M-K (Mann-Kendall) trend test method proposed by Mann (1945); Hussain & Mahmud (2019). The advantage is that the M-K test does not require the data to be normally distributed, nor does it require the change trend to be linear (Karmeshu, 2012). If the country’s CO2 emissions after the maximum year have a significant downward trend, the country is considered to have reached its peak; if there is no significant trend, the country is considered to be in the plateau period. The calculation principle is as follows:
For a time series Xt = (x1,x2,…xn), the calculation principle of the statistic S of the MK trend test is as follows:
Among them, f is the test function:
Then, calculate the variance Var and Z statistics:
Finally, the data were tested with a two-sided test. When -Z1-a ≤ Zs ≤ Z1-a, the sequence has a significant change trend; otherwise, the trend is not significant. Since this article only needs to explore whether the downward trend is significant, Z1-a values less than −1.28, −1.96, and −2.32 correspond to a significant downward trend at the 90%, 95%, and 99% confidence levels, respectively.
Decomposition analysis is used to quantify changes in various variables over time. There are two widely discussed techniques for conducting decomposition analysis, which are extensively elaborated upon in the literature. These methodologies are known as Structural Decomposition Analysis (SDA) and Exponential Decomposition Analysis (IDA). These techniques were developed independently and are commonly used to analyze changes in energy consumption and CO2 emissions (Mikayilov et al., 2020). In energy and environmental research, IDA is the most commonly used analytical method to better understand the drivers of changes in carbon emissions. The LMDI method is the most widely employed technique within the IDA framework. Here, this paper adopts the LMDI decomposition method based on the Kaya identity.
The establishment of the Kaya identity is to decompose the CO2 emissions into factors, which can be specifically expressed as:
Among these factors, CO2, EN, GDP, and POP represent carbon dioxide emissions, primary energy consumption, gross domestic product, and total domestic population, respectively. The Kaya equation reveals the driving forces affecting CO2 emissions:
Ci represents the amount of CO2 emitted per unit of energy consumption, which can be further extended to “carbon intensity”, that is, different types of energy determine the amount of CO2 emitted per unit of energy consumption; Ei represents the amount of energy consumed per unit of GDP, that is, “energy intensity”. The higher the energy intensity is, the higher the amount of CO2 produced per unit of GDP; Yi represents the average social living standard and macroeconomic performance reflected by GDP per capita. For developing countries, the higher the GDP per capita is, the higher the CO2 emissions caused by the high-carbon consumption pattern; Pi represents the total population. With the acceleration of urbanization, the sharp increase in the urban population leads to a substantial increase in CO2 emissions.
Let ΔCO2 be the total amount of CO2 change from 0 to t within the total span change time period. Cef, Eef, Yef, and Pef represent the four influencing factors of Ci, Ei, Yi, and Pi, respectively. The decomposition value of ΔCO2 is based on the specific steps of the LMDI factor decomposition method proposed by Ang (2003). In this study, the improved Kaya identity is subjected to additive decomposition to obtain the following results:
In the time period ranging from 0 to t, the differential operator is applied to both sides of the formula. Subsequently, the calculation formula for the contribution rate of each item is obtained as follows:
According to the judgment flow chart in Figure 1, this paper determines the peak status of countries along the Belt and Road. The list is shown in Table 1. Among them, peak plateau period 1 refers to countries that have already seen an inflection point but a downward trend. Peak plateau period 2 refers to countries that have completed their carbon emission peak but are experiencing significant economic recession. The indicator for judging economic recession in this paper is the Tapio decoupling coefficient between carbon emissions and economic development. These data come from the authors’ previous research (Chou et al., 2022).
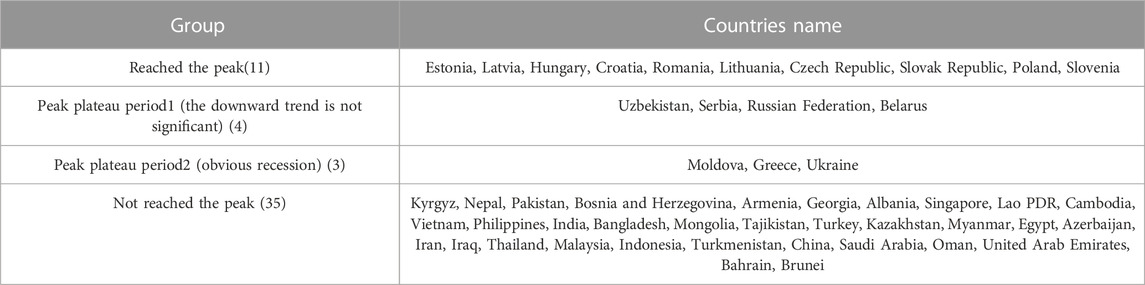
TABLE 1. List of countries with different peak status.
The spatial distribution of countries with different peak states is shown in Figure 2. Most of the countries along the Belt and Road have not reached peak carbon emissions. They are mainly distributed in Asia. Most of these countries are still developing and comprise the majority of countries along the Belt and Road. The countries that have reached peak carbon emissions are all distributed in Europe, but Europe is not the only country that has reached peak carbon emissions. Central European countries have basically reached their carbon dioxide peaks. However, some countries in southern and eastern Europe are still in the peak plateau period. Uzbekistan, Serbia, the Russian Federation, and Belarus are currently at the inflection point of carbon peaks, but their downward trends are not significant. On the other hand, according to their emissions data, Moldova, Greece, and Ukraine have already peaked; however, their economies have declined significantly. According to the research results of Declercq et al. (2011), the decline in carbon emissions caused by this economic recession is very likely to reverse with economic recovery in the future. Therefore, this category of countries is still judged as being in the plateau period of the carbon peak.
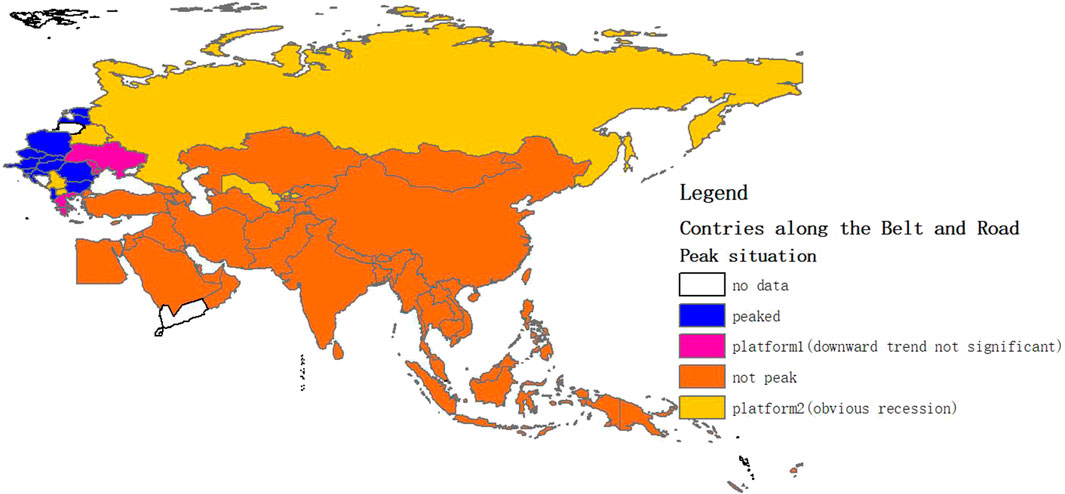
FIGURE 2. Country distribution map of different peak states.
The carbon emission trends of all countries along the Belt and Road are shown in Figure 3. Since the level of carbon emissions in different countries is very different, directly expressing the total amount may affect the graphic effect. Therefore, in Figure 3, the emissions of each country in 2000 are set as the benchmark value of 100. The emissions of subsequent years are measured based on the emissions of 2000 so that we can better see the trends and changes of these countries in the past 2 decades. Countries that have not reached the peak have mostly shown a significant upward trend in carbon emissions. Countries in the peak plateau period 1 (with no significant downward trend) have fluctuating and unstable carbon emissions. Countries in the peak plateau period 2 (with obvious recession) have carbon emissions that are fluctuating and decreasing. Countries that have reached the peak have shown a stable downward trend in carbon emissions after reaching the inflection point.
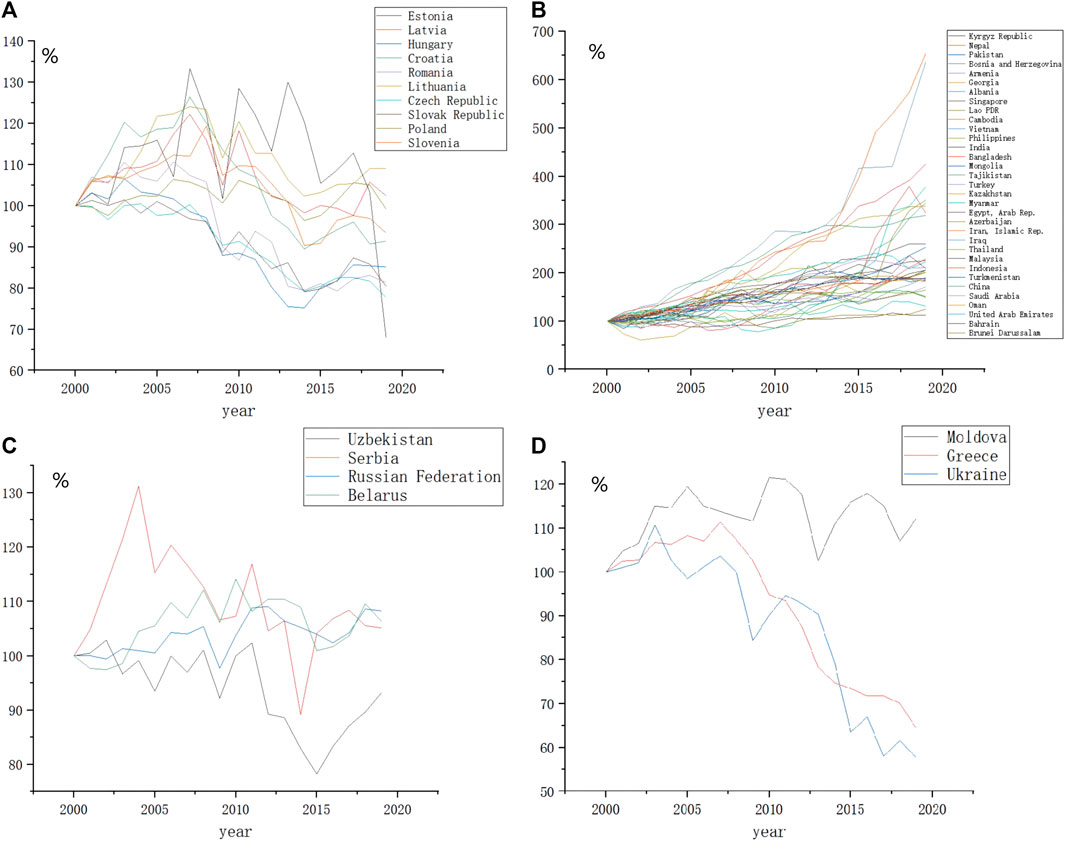
FIGURE 3. The trend of carbon emissions in countries along the Belt and Road. (A) Reached the peak; (B) Peak plateau period1 (the downward trend is not significant); (C) Peak plateau period2 (obvious recession); (D) Not reached the peak.
Table 2 shows the downward trend determined by the M-K trend test. Countries not listed in the table are on an upward trend or have not seen an inflection point. Although the carbon emissions of Uzbekistan, Serbia, the Russian Federation, and Belarus in the first column have reached an inflection point, their downward trend is not significant. Due to the fact that their corresponding Z values exceed −1.28, Z values lower than −1.28, −1.96, and −2.32 indicate a significant descending trend at the 90%, 95%, and 99% confidence intervals, respectively. Hence, said countries fall into the category of “peak plateau period 1″countries.
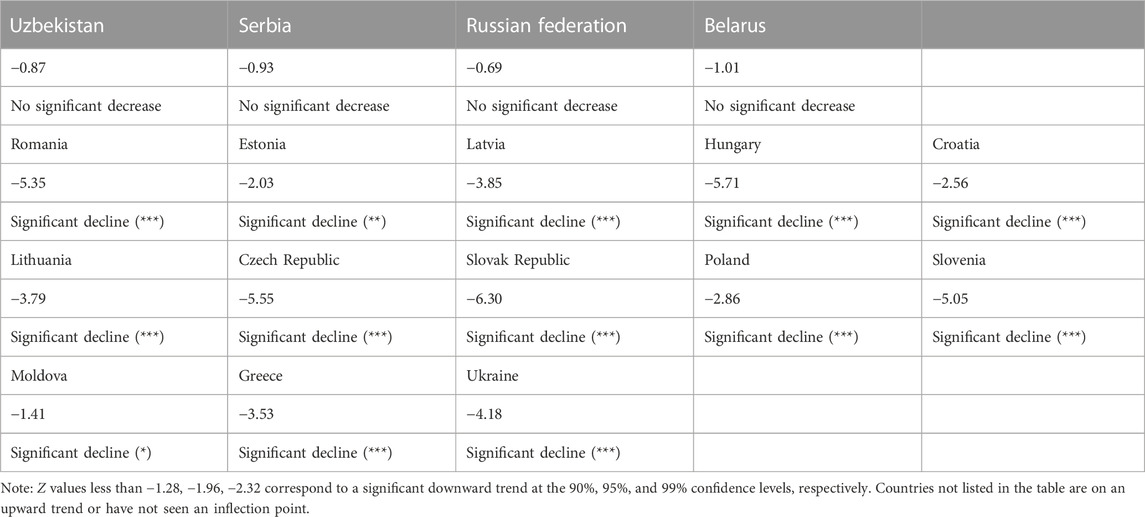
TABLE 2. M-K test of whether the downward trend is significant.
Due to the large number of countries along the Belt and Road, this paper selects some representative countries from each category for the following research as follows: reached the peak: Hungary, Romania, Czech Republic; peak plateau period 1 (the downward trend is not significant): Russian Federation; peak plateau period 2 (obvious recession): Greece, Ukraine; and not reached the peak: Saudi Arabia, Vietnam, Pakistan. The time changes of their driving factors are shown in Figure 4. All driving factors take the data of 2000 as the benchmark value of 100; the values of subsequent years are first divided by the data of 2000 and then multiplied by 100. Different countries show different characteristics in the driving factors of carbon emissions. Except for Greece, the GDP PPP of most countries is growing. The population growth of countries that have not yet reached the peak is relatively significant, while the population of other countries remains roughly unchanged or slightly decreased. The energy density of most countries has been decreasing over the past 20 years (except for Saudi Arabia). The carbon intensity of Saudi Arabia and Vietnam has increased significantly, while the energy density of other countries has not changed significantly.
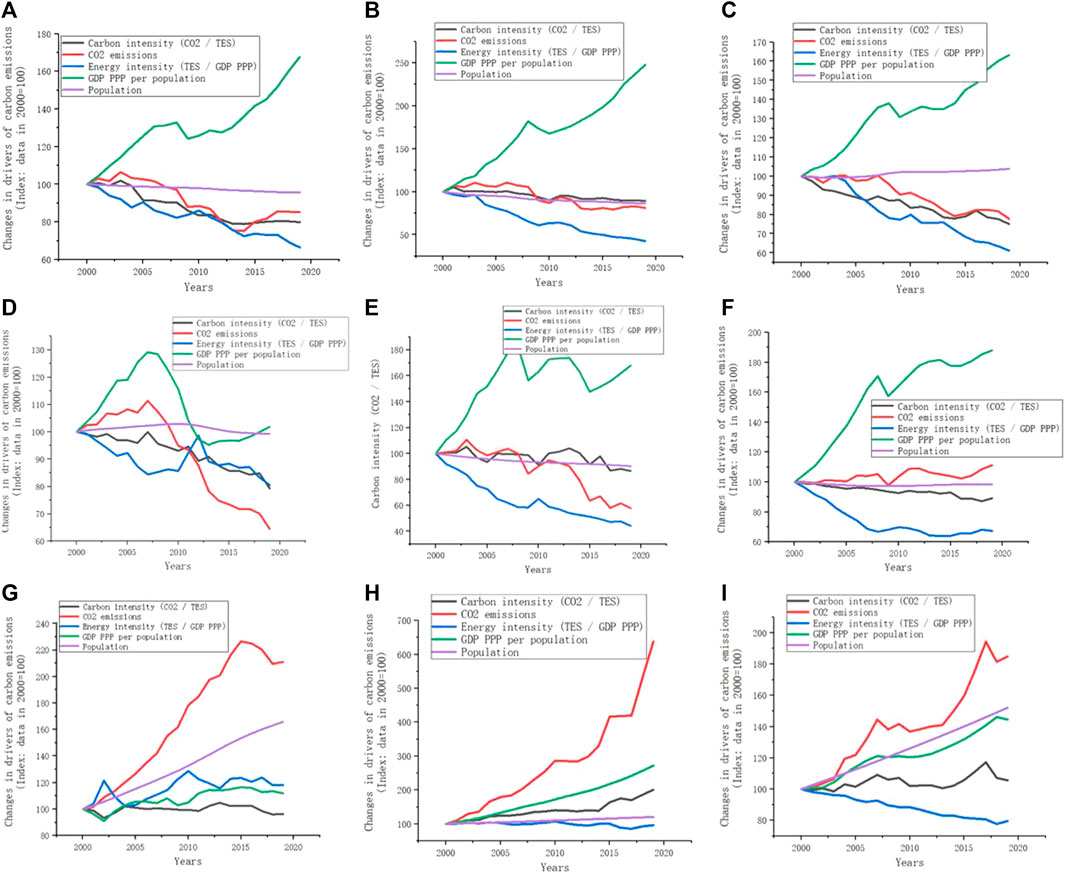
FIGURE 4. The carbon emissions drivers in countries along the Belt and Road. (A) Hungary; (B) Romania; (C) Czech Republic; (D) Greece; (E) Ukraine; (F) Russian Federation; (G) Saudi Arabia; (H) Pakistan. (I) Vietnam.
Figure 5. The decomposition results of the driving factors of carbon emission changes in these nine countries are shown, and the results are calculated for one period per year. The positive value of the driving factor indicates that it has made a positive contribution to carbon emissions during this time period. Conversely, a negative value for the driving factor indicates a negative contribution to carbon emissions during this time period. Figure 5 shows that in the three countries that have reached their peaks (Hungary, Romania, Czech Republic), the main driving factor of positive contribution is GDP PPP per population, while other driving factors make negative contributions to carbon emissions. However, this situation does not always exist. Due to the European debt crisis in 2008-2010, these countries briefly experienced a situation where GDP PPP per population made a negative contribution to carbon emissions. This situation is even more pronounced in Greece. Before 2008, its situation was similar to that of the previous three countries. However, after 2008, its GDP PPP per population made a large negative contribution to carbon emissions, while energy intensity became a large positive contributor to carbon emissions. Drivers of carbon emissions in Ukraine have fluctuated widely over a 20-year period. The contributions of GDP PPP per population, energy intensity and carbon intensity fluctuate periodically, sometimes positively and sometimes negatively. The energy intensity and carbon intensity of the Russian Federation were the main negative contributors to carbon emissions in the first decade, but these were offset by the rapid growth of GDP PPP per population. Over the next 10 years, the values of both positive and negative contributors decreased. Compared with the above six countries, the three countries that have not reached the peak of carbon emissions reflect completely different characteristics. The first is that population growth is a very significant positive contributor to carbon emissions, which is very obvious in Saudi Arabia and Pakistan. The second feature is that there are few drivers that contribute negatively to carbon emissions; Vietnam in particular has only experienced declines in energy intensity in individual years. The rest of the time, all drivers are positive contributors to carbon emissions.
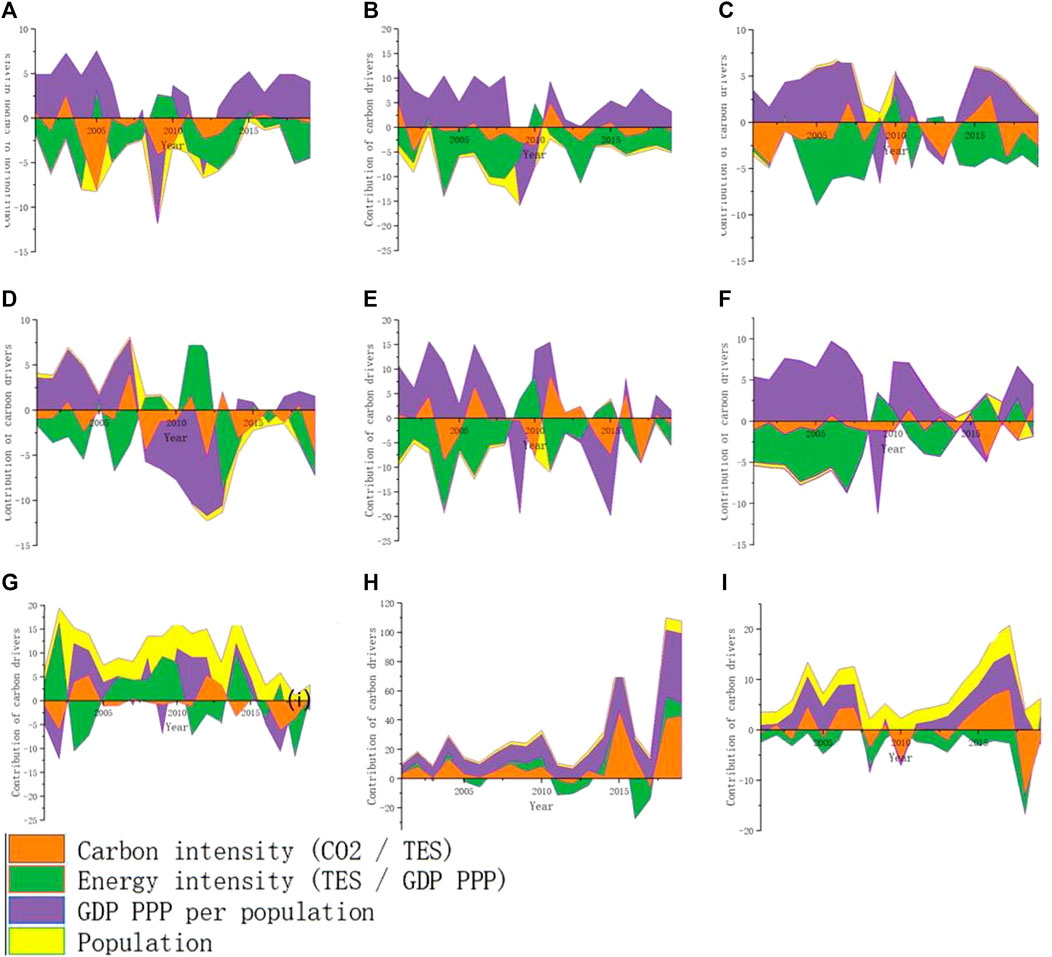
FIGURE 5. Decomposition results of driving factors for carbon emission changes in nine countries. (A) Hungary; (B) Romania; (C) Czech Republic; (D) Greece; (E) Ukraine; (F) Russian Federation; (G) Saudi Arabia; (H) Pakistan. (I) Vietnam.
Table 3 shows the total contribution of the nine countries’ carbon emission drivers from 2000 to 2019. Changes in carbon intensity are positive in Vietnam and Pakistan and negative in all other countries. Energy intensity has a positive contribution in Saudi Arabia and a negative contribution in other countries. GDP PPP per population is a positive contribution in all countries. Population has a positive contribution in Hungary, Romania, Greece, Ukraine, and the Russian Federation and a negative contribution in the Czech Republic, Saudi Arabia, Vietnam, and Pakistan.
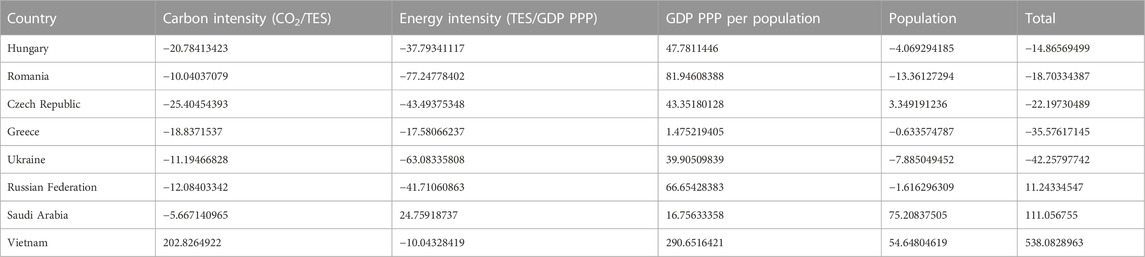
TABLE 3. Total contribution of carbon emission drivers in 2000–2019 for 9 countries.
From the perspective of different stages of carbon peaking, different types of countries show different characteristics. The increase in GDP PPP per population in countries that have peaked carbon emissions is the only positive driver of carbon emissions, but this effect is mainly offset and exceeded by the decline in carbon intensity and energy intensity. The reduction in population has a certain negative effect on carbon emissions, but this effect is not obvious. The increase in GDP PPP per population of the Russian Federation in peak plateau period 1 (the downward trend is not significant) is also the only positive driver of carbon emissions. The carbon emission reduction effect brought by several other driving factors is not enough to offset the positive contribution of GDP PPP per population. Greece and Ukraine, which are in peak plateau period 2 (obvious recession), present a different situation. The main reason for the reduction in Greece’s carbon emissions is that the GDP PPP per population has grown very little. The main reason for the reduction in Ukraine’s carbon emissions is the decline in energy intensity. In countries where carbon emissions have not peaked, population growth has made a positive contribution to carbon emissions. Saudi Arabia is characterized by an increase in energy intensity over 2 decades, which suggests that its economic structure is still very energy-dependent and that this situation has not improved. Although the energy intensity of Vietnam and Pakistan has made a certain negative contribution to carbon emissions, the growth of carbon intensity, GDP PPP per population, and population has offset and exceeded such emission reduction effects. Therefore, carbon emissions in these countries continue to increase and have not yet reached their carbon peak.
The lower the carbon emissions produced by a unit of energy in a country is, the healthier the country’s energy structure will be. The change in carbon intensity is caused by the different types of energy; that is, the different types of energy determine the amount of CO2 emitted per unit of energy consumption. Figure 6 shows the proportion of carbon emissions produced by various fossil energy sources in nine countries. Coal, oil, and natural gas are still the main sources of emissions (more than 90%). Figure 6 shows the proportion of carbon emissions produced by various fossil energy sources in nine countries. Coal, oil, and natural gas are still the main sources of emissions (more than 90%). The countries with a marked decline in carbon intensity are Hungary and Romania, which are characterized by a significant decline in the share of emissions from coal. In contrast, Vietnam is increasingly dependent on coal for energy, making it a very large contributor to its carbon intensity. The nations of Hungary and Romania have demonstrated a notable reduction in carbon intensity, which can be attributed to a significant decrease in the proportion of carbon emissions originating from coal. The proportion of carbon emissions generated by coal in Hungary has decreased from 27% to 17%, and in Romania it has decreased from 71% to 60%. Conversely, Vietnam’s carbon intensity has experienced a surge, primarily due to an increasing dependence on coal as a primary energy source, resulting in a substantial contribution to its carbon intensity. The proportion of carbon emissions generated by coal in Vietnam has increased from 8% to 21%.
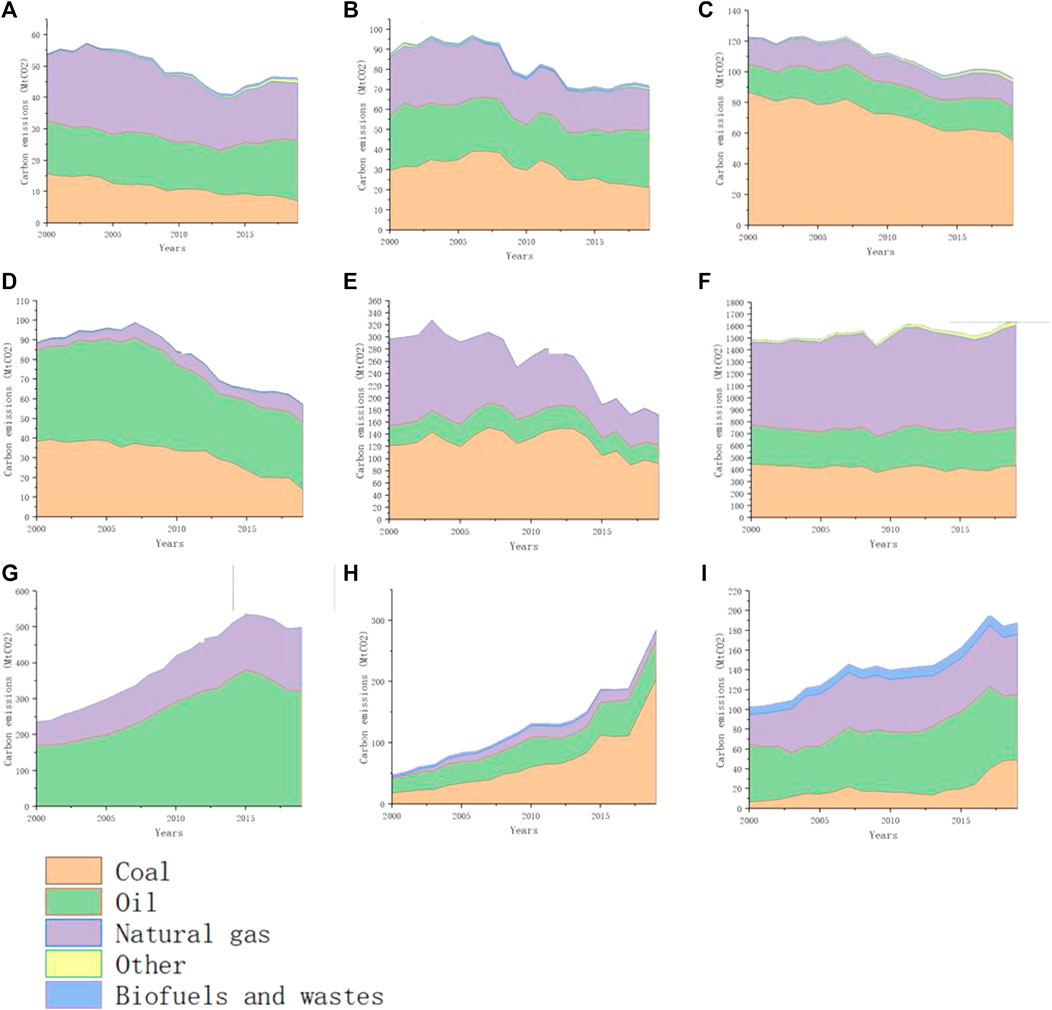
FIGURE 6. The share of carbon emissions produced by different types of fossil energy in nine countries. (A) Hungary; (B) Romania; (C) Czech Republic; (D) Greece; (E) Ukraine; (F) Russian Federation; (G) Saudi Arabia; (H) Pakistan. (I) Vietnam.
The significance of energy intensity is to measure whether a country’s development is green and healthy. Changes in energy intensity are mainly caused by changes in the country’s industrial structure. If a country’s carbon dioxide emissions per unit of GDP decline while its economy grows, it means that the country has achieved a low-carbon development model. Figure 7 shows the share of carbon emissions generated by each sector for nine countries. Power generation produces the most carbon emissions in all countries. Among the three countries that have reached their carbon peaks, the carbon emissions generated by power generation continue to decline because their power generation efficiency and clean energy proportion are increasing. The shares of several countries in the peak plateau period did not change much. The share of carbon emissions produced by power generation in countries that have not reached their carbon peak is still increasing, which may be caused by new urbanization and industrialization. The other large emitters are industry and transport, whose shares have changed little in the three countries that have already peaked. Shares even fell in recessionary countries such as Ukraine. However, in countries that have not reached the peak, there is a trend that shares continue to increase.
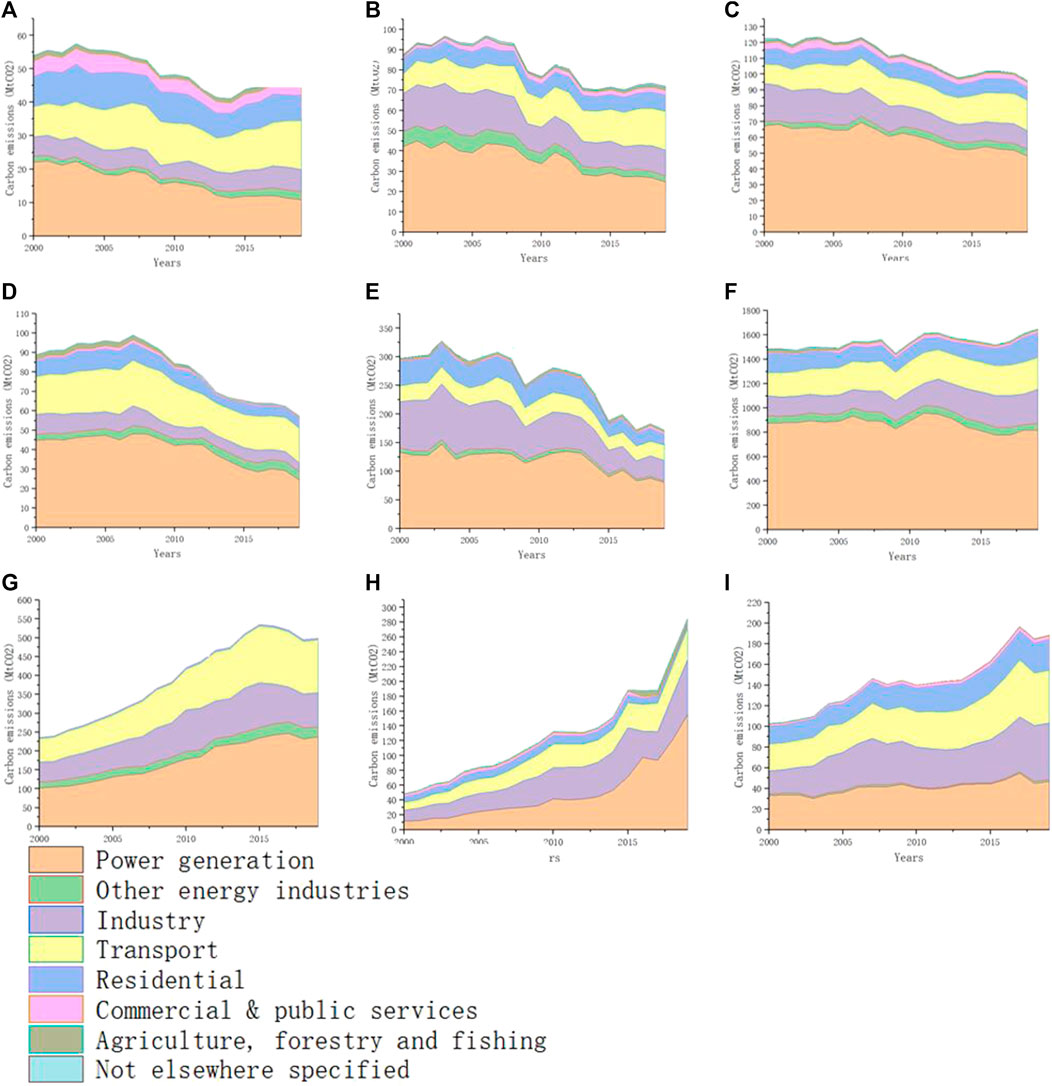
FIGURE 7. Share of carbon emissions generated by each sector in nine countries. (A) Hungary; (B) Romania; (C) Czech Republic; (D) Greece; (E) Ukraine; (F) Russian Federation; (G) Saudi Arabia; (H) Pakistan. (I) Vietnam.
Reviewing the results of Figures 4, 5, we find that economic growth and population increase are the main positive drivers of carbon emissions most of the time. Seen from the underlying reasons, economic growth is a necessary condition to meet the basic needs of people’s material life and development. Energy consumption is the basic input to maintain economic operation, and carbon emissions are a direct byproduct of energy consumption. Population growth directly determines the scale of human social activities. Specifically, economic growth is a positive driver of carbon emissions most of the time, except for Greece and Ukraine, which are in the peak plateau period2 (obvious recession), showing certain negative effects. The populations in the three countries that have not reached the peak have grown rapidly in the past 2 decades, hence, population has become a very important positive driver of their carbon emissions.
This study develops a new method for judging the peak carbon status of a country based on the time series of carbon emissions. We divide the status of all countries along the Belt and Road into four categories: reached the peak, peak plateau period 1 (the downward trend is not significant), peak plateau period 2 (obvious recession), and not reached the peak. In addition, this study uses the carbon emission database and socioeconomic database of countries along the Belt and Road from 2000 to 2019 to measure the driving factors of carbon emission changes in these countries. To this end, based on the theory of Kaya’s identity, we use LMDI factorization to decompose the change in carbon emissions of energy consumption into multiple factors: carbon intensity, energy intensity, economic output, and population size. Our research found the following:
(1) Most of the countries along the Belt and Road have carbon emissions that have not reached their peak. These countries are mainly developing ones in Asia, and they also comprise the majority of countries along the Belt and Road. The countries that have reached peak carbon emissions are all distributed in Europe, but Europe is not the only region that has reached peak carbon emissions. Central European countries have basically reached their carbon dioxide peaks. However, some countries in southern and eastern Europe are still in the peak plateau period.
(2) The carbon emission driving factors of countries in different carbon peak stages reflect different characteristics. The main driving factor of the positive contribution of the three countries that have reached the peak is GDP PPP per population, while other driving factors have made negative contributions to carbon emissions. However, in some years, these countries briefly experienced the negative contribution of GDP PPP per population to carbon emissions. The driving factors of the country’s carbon emissions in the peak plateau period are not stable. The contributions of GDP PPP per population, energy intensity and carbon intensity fluctuate periodically, sometimes positively and sometimes negatively. In countries that have not reached the peak of carbon emissions, population growth and economic growth are very significant positive contributors to carbon emissions, and the effect of driving factors that negatively contribute to carbon emissions is not so obvious.
(3) The reason for peaking in countries that have already reached their carbon intensity is that improvements in their energy and industrial structures have resulted in significant declines in their carbon intensity and energy intensity. The main problem of countries in the peak plateau period1 is that their “carbon peak” is largely caused by economic recession, rather than an improvement in energy and industrial structures. The main problem of countries in the peak plateau period2 is that the carbon emission reduction measures are not strong enough, resulting in an insignificant reduction in carbon emissions. The main problem for countries that have not peaked their carbon emissions is the growth in carbon emissions resulting from rapid population and economic growth. At the same time, their energy and industrial structures have not been improved, or the improvement is not enough to offset such growth.
However, this study still has certain limitations. Since the Kaya identity involves multiple variables, the estimation results may be affected by interactions and uncertainties among these variables. For example, energy emission intensity can be influenced by the choice of different energy sources and improvements in production processes. Economic structural factors may also differ due to specific economic development patterns in different countries or regions. Despite the uncertainty of the Kaya identity method, it is still a useful tool to help us understand the impact of different factors on CO2 emissions and develop corresponding emission reduction strategies.
The original contributions presented in the study are included in the article/supplementary material, further inquiries can be directed to the corresponding author.
YL wrote the first draft of the manuscript. JC contributed to the concept and design of the study. WZ sorted out the database. YX, YH, and HJ revised the manuscript.
This research was supported by the National Natural Science Foundation of China (Grant No. 42075167). This research was also funded by the State Key Laboratory of Earth Surface Processes and Resource Ecology of Beijing Normal University (Grant No. 2022-GS-01).
The authors would like to thank the reviewers and editors for the beneficial and helpful suggestions for this article.
The authors declare that the research was conducted in the absence of any commercial or financial relationships that could be construed as a potential conflict of interest.
All claims expressed in this article are solely those of the authors and do not necessarily represent those of their affiliated organizations, or those of the publisher, the editors and the reviewers. Any product that may be evaluated in this article, or claim that may be made by its manufacturer, is not guaranteed or endorsed by the publisher.
Ang, B. W. (2004). Decomposition analysis for policymaking in energy:. Energy policy 32 (9), 1131–1139. doi:10.1016/s0301-4215(03)00076-4
Chen, Z., Yan, T., Zhao, W., and Ni, G. (2021). Capacity utilization loss of the Belt and Road countries incorporating carbon emission reduction and the impacts of China’s OFDI. J. Clean. Prod. 280, 123926. doi:10.1016/j.jclepro.2020.123926
Chou, J., Li, Y., Xu, Y., Zhao, W., Li, J., and Hao, Y. (2022). Carbon dioxide emission characteristics and peak trend analysis of countries along the Belt and Road. Environ. Sci. Pollut. Res., 1–15. doi:10.1007/s11356-022-22124-7
Churkina, G. (2008). Modeling the carbon cycle of urban systems. Ecol. Model. 216 (2), 107–113. doi:10.1016/j.ecolmodel.2008.03.006
Copley, J. (2022). Decarbonizing the downturn: Addressing climate change in an age of stagnation. Competition & Change, Thousand Oaks, California, USA, 10245294221120986.
Declercq, B., Delarue, E., and D’haeseleer, W. (2011). Impact of the economic recession on the European power sector’s CO2 emissions. Energy Policy 39 (3), 1677–1686. doi:10.1016/j.enpol.2010.12.043
Fan, Q., Liu, J., Zhang, T., and Liu, H. (2022). An Evaluation of the Efficiency of China’s green investment in the Belt and Road countries. Struct. Change Econ. Dyn. 60, 496–511. doi:10.1016/j.strueco.2022.01.003
Han, M., Yao, Q., Liu, W., and Dunford, M. (2018). Tracking embodied carbon flows in the Belt and Road regions. J. Geogr. Sci. 28 (9), 1263–1274. doi:10.1007/s11442-018-1524-7
Hou, J., Deng, X., Springer, C. H., and Teng, F. (2020). A global analysis of CO2 and non-CO2 GHG emissions embodied in trade with Belt and Road Initiative countries. Ecosyst. Health Sustain. 6 (1), 1761888. doi:10.1080/20964129.2020.1761888
Hussain, M., and Mahmud, I. (2019). pyMannKendall: a python package for non parametric Mann Kendall family of trend tests. J. Open Source Softw. 4 (39), 1556. doi:10.21105/joss.01556
IEA (2021a). Greenhouse gas emissions from energy (database). Available at: https://www.iea.org/data-and-statistics/data-sets.
IEA (2021b). World energy balances (database). Available at: https://www.iea.org/data-and-statistics/data-sets.
Lu, Q., Fang, K., Heijungs, R., Feng, K., Li, J., Wen, Q., et al. (2020). Imbalance and drivers of carbon emissions embodied in trade along the Belt and Road Initiative. Appl. Energy 280, 115934. doi:10.1016/j.apenergy.2020.115934
Mikayilov, J. I., Mukhtarov, S., Dinçer, H., Yüksel, S., and Aydın, R. (2020). Elasticity analysis of fossil energy sources for sustainable economies: A case of gasoline consumption in Turkey. Energies 13 (3), 731. doi:10.3390/en13030731
Minx, J. C., Wiedmann, T., Wood, R., Peters, G. P., Lenzen, M., Owen, A., et al. (2009). Input–output analysis and carbon footprinting: An overview of applications. Econ. Syst. Res. 21 (3), 187–216. doi:10.1080/09535310903541298
Qader, M. R., Khan, S., Kamal, M., Usman, M., and Haseeb, M. (2022). Forecasting carbon emissions due to electricity power generation in Bahrain. Environ. Sci. Pollut. Res. 29 (12), 17346–17357. doi:10.1007/s11356-021-16960-2
Rehman, A., Ma, H., Ahmad, M., Irfan, M., Traore, O., and Chandio, A. A. (2021). Towards environmental Sustainability: Devolving the influence of carbon dioxide emission to population growth, climate change, Forestry, livestock and crops production in Pakistan. Ecol. Indic. 125, 107460. doi:10.1016/j.ecolind.2021.107460
Shi, C. (2020). Decoupling analysis and peak prediction of carbon emission based on decoupling theory. Sustain. Comput. Inf. Syst. 28, 100424. doi:10.1016/j.suscom.2020.100424
Shi, Q., Zhao, Y., Qian, Z., Zheng, L., and Wang, S. (2022). Global value chains participation and carbon emissions: Evidence from Belt and Road countries. Appl. Energy 310, 118505. doi:10.1016/j.apenergy.2021.118505
Sovacool, B. K., Griffiths, S., Kim, J., and Bazilian, M. (2021). Climate change and industrial F-gases: A critical and systematic review of developments, sociotechnical systems and policy options for reducing synthetic greenhouse gas emissions. Renew. Sustain. energy Rev. 141, 110759. doi:10.1016/j.rser.2021.110759
Ulucak, R., Erdogan, F., and Bostanci, S. H. (2021). A STIRPAT-based investigation on the role of economic growth, urbanization, and energy consumption in shaping a sustainable environment in the Mediterranean region. Environ. Sci. Pollut. Res. 28 (39), 55290–55301. doi:10.1007/s11356-021-14860-z
Wang, F., and Yang, F. (2018). A review of research on China’s carbon emission peak and its forcing mechanism. Chin. J. Popul. Resour. Environ. 16 (1), 49–58. doi:10.1080/10042857.2018.1433810
Wang, J., Dong, K., Dong, X., and Jiang, Q. (2021). Research on the carbon emission effect of the seven regions along the Belt and Road—Based on the spillover and feedback effects model. J. Clean. Prod. 319, 128758. doi:10.1016/J.JCLEPRO.2021.128758
World Bank (2022). World development indicators. Available at: https://databank.worldbank.org/source/world-development-indicators.
Wu, Y., and Xu, B. (2022). When will China’s carbon emissions peak? Evidence from judgment criteria and emissions reduction paths. Energy Rep. 8, 8722–8735. doi:10.1016/j.egyr.2022.06.069
Xue, H., Lan, X., Zhang, Q., Liang, H., and He, Z. (2021). Assessment of the green development level for participating countries in the Belt and Road initiative. Ann. Operations Res., 1–21. doi:10.1007/s10479-021-04440-2
Yamaji, K., Matsuhashi, R., Nagata, Y., and Kaya, Y. (1991). An integrated system for CO2/energy/GNP analysis: Case studies on economic measures for CO2 reduction in Japan. Workshop on CO2 reduction and removal: measures for the next century, 19. Austria: International Institute for Applied Systems Analysis Laxenburg.
Yin, W. (2019). Integrating sustainable development goals into the Belt and Road initiative: Would it be a new model for green and sustainable investment? Sustainability 11 (24), 6991. doi:10.3390/su11246991
East Asia: Mongolia.
ASEAN 10 countries: Singapore, Malaysia, Indonesia, Myanmar, Thailand, Laos, Cambodia, Vietnam, Brunei, and the Philippines.
West Asia 18 countries: Iran, Iraq, Turkey, Syria, Jordan, Lebanon, Israel, Palestine, Saudi Arabia, Yemen, Oman, United Arab Emirates, Qatar, Kuwait, Bahrain, Greece, Cyprus, and Egypt’s Sinai Peninsula.
South Asia 8 countries: India, Pakistan, Bangladesh, Afghanistan, Sri Lanka, Maldives, Nepal, and Bhutan.
Central Asia 5 countries: Kazakhstan, Uzbekistan, Turkmenistan, Tajikistan, and Kyrgyzstan.
Commonwealth of Independent States, Commonwealth of Independent States (CIS) 7 countries: Russia, Ukraine, Belarus, Georgia, Azerbaijan, Armenia, and Moldova.
Central and Eastern Europe 16 countries: Poland, Lithuania, Estonia, Latvia, Czech Republic, Slovakia, Hungary, Slovenia, Croatia, Bosnia and Herzegovina, Montenegro, Serbia, Albania, Romania, Bulgaria, and North Macedonia.
Keywords: the Belt and Road initiative, carbon emission, LMDI decomposition analysis, carbon peak, Kaya identity
Citation: Li Y, Chou J, Zhao W, Xu Y, Hao Y and Jin H (2023) Decomposition of carbon emission driving factors and judgment of peak status in countries along the Belt and Road. Front. Environ. Sci. 11:1135030. doi: 10.3389/fenvs.2023.1135030
Received: 31 December 2022; Accepted: 20 March 2023;
Published: 30 March 2023.
Edited by:
Zhiyuan Hu, School of Atmospheric Sciences, Sun Yat-sen University, ChinaReviewed by:
Shujuan Hu, Lanzhou University, ChinaCopyright © 2023 Li, Chou, Zhao, Xu, Hao and Jin. This is an open-access article distributed under the terms of the Creative Commons Attribution License (CC BY). The use, distribution or reproduction in other forums is permitted, provided the original author(s) and the copyright owner(s) are credited and that the original publication in this journal is cited, in accordance with accepted academic practice. No use, distribution or reproduction is permitted which does not comply with these terms.
*Correspondence: Jieming Chou, Y2hvdWptQGJudS5lZHUuY24=
Disclaimer: All claims expressed in this article are solely those of the authors and do not necessarily represent those of their affiliated organizations, or those of the publisher, the editors and the reviewers. Any product that may be evaluated in this article or claim that may be made by its manufacturer is not guaranteed or endorsed by the publisher.
Research integrity at Frontiers
Learn more about the work of our research integrity team to safeguard the quality of each article we publish.