 Jianan Chen
 Miaomiao Cheng1*
 Wim de Vries
 Xuejun Liu
 Wen Xu
- 1State Key Laboratory of Environmental Criteria and Risk Assessment, Chinese Research Academy of Environmental Sciences, Beijing, China
- 2College of Resources and Environmental Sciences, Key Laboratory of Plant–Soil Interactions, Ministry of Education, National Observation and Research Station of Agriculture Green Development (Quzhou, Hebei), China Agricultural University, Beijing, China
- 3Meteorology and Air Quality Group, Wageningen University & Research, Wageningen, Netherlands
- 4Environmental Systems Analysis Group, Wageningen University and Research, Wageningen, Netherlands
Ammonia (NH3) emissions from intensive anthropogenic activities is an important component in the global nitrogen cycle that has triggered large negative impacts on air quality and ecosystems worldwide. An accurate spatially explicit high resolution NH3 emission inventory is essential for modeling atmospheric aerosol pollution and nitrogen deposition. However, existing NH3 emission inventories in China are still subject to several uncertainties. In this review we firstly summarize the widely used methods for the estimate of NH3 emissions and discuss their advantages and major limitations. Secondly, we present aggregated data from ten NH3 emission inventories to assess the trends in total anthropogenic NH3 emissions in China over the period 1980–2019. Almost emission estimates reported that NH3 emissions in China have doubled in the last four decades. We find a substantial differences in annual total NH3 emissions, spatial distributions and seasonal variations among selected datasets. In 2012, the median emission (Tg yr−1) and associated minimum-maximum ranges are 12.4 (8.5_17.2) for total emission, 9.9 (8.1_13.8) for agriculture, 0.3 (0.2_1.0) for industry, 0.4 (0.2_1.1) for residential and 0.1 (0.1_0.3) for transport and other emission of 1.5 (0.3_2.6). In general, peak emissions occur in summer but in different months, the higher NH3 emission intensities are concentrated in the NCP area, and in eastern and south-central China but distinct regional discrepancy among selected datasets. Finally, we made an analysis of the reasons and levels of difference in NH3 emission estimates with recommendations for improvement of China’s NH3 emission inventory.
1 Introduction
Atmospheric ammonia (NH3), as an important component of reactive nitrogen (Nr), plays a key role in atmospheric chemistry and the global nitrogen cycle (Erisman et al., 2008; Fowler et al., 2013). As the most abundant alkalinity gas in the atmosphere, NH3 can readily react with both H2SO4 and HNO3 to form ammonium sulfate and ammonium nitrate (Xu et al., 2017b; Xu et al., 2022). These secondary ammonium inorganic aerosols account for 20%–60% of PM2.5 in China (Ye et al., 2011; Huang et al., 2014), which are responsible for serious air pollution in the past 2 decades (Meng et al., 2022). Moreover, substantial NH3 emission led to excessive Nr deposition, resulting in a series of environmental issues including biological diversity reduction and soil acidification, and degradation of water bodies by runoff (Liu et al., 2011; Xu et al., 2015b; Xu et al., 2018).
The Haber–Bosch process converts atmospheric inert N2 to biologically available nitrogen. At the end of the 20th century, about 50% of the world population was fed by food production derived from chemical nitrogen (N) fertilizer inputs (Erisman et al., 2008). However, the increased N fertilizer input caused a decline in the nitrogen use efficiency, enhancing N surpluses (inputs minus crop N removal), resulting in N loss in the form of gas emissions, including NH3 and of nitrate to water. Global agricultural NH3 emissions increased by 78% since 1980 (Liu et al., 2022a). Livestock manure and synthetic fertilizers represent the two most important contributors of NH3 emissions, and together they represent more than 70% of the global emissions and even 80% of NH3 emissions in Asia (Bouwman et al., 2002; Streets et al., 2003).
China is recognized as a global hotpot of NH3 emission owing to agricultural intensification since 1980 with related strongly enhanced N fertilizer applications (Warner et al., 2016; Zhan et al., 2021). An accurate NH3 emission inventory is important to guide nitrogen management for improving air quality. Numerous studies have been published, including NH3 emission estimates in China with a bottom-up method, focusing on agriculture systems. In addition, improved methods have been developed to estimate emissions by a top-down approach. For example, inverse modeling has been used to constrain NH3 emissions, this approach improves a priori bottom-up emissions by assimilating satellite observation or surface monitoring network datasets (Cao et al., 2020; Chen et al., 2021; Marais et al., 2021). However, recent estimates of total NH3 emissions for China differ by more than a factor of two, due to using different methods, considering different emission factors and emission sources (Kong et al., 2019). This uncertainty can be even much larger at regional scale due to large differences in the spatio-temporal distributions of the emissions (Zhang et al., 2018).
In this review, we compared ten existing long-term NH3 emission budgets for China (Table 1). We analyzed characteristics of NH3 emissions in China from several of the state-of-the-art published datasets, covering the period 1980_2019, and present the trends of NH3 emission over the past few decades. In addition, we present their estimates for the spatial distributions over China for the base year 2015 and the monthly variations, considering the period included by each model. The primary objective is to clarify the differences among the various published NH3 emission estimates for China. We finalize the paper with recommendations for future steps in developing improved NH3 emission inventories.
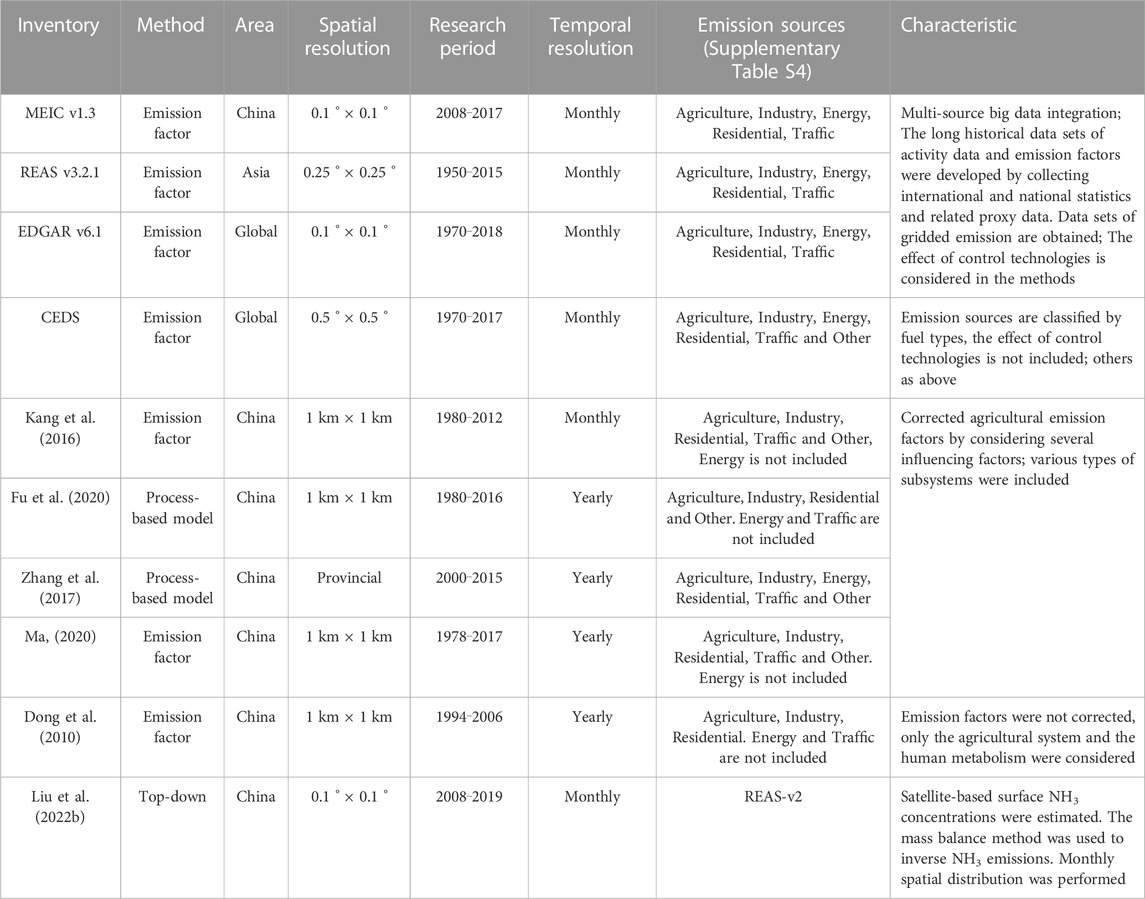
TABLE 1. Summary of the inventories used in this study.
2 Methods on estimation of NH3 emissions
Multiple publications have reported NH3 emission inventories for China. The methods are usually divided into two different approaches, known generally as bottom-up and top-down methods, where bottom_up approaches can be further subdivided in empirical bottom-up approaches and process-based model bottom-up approaches, as described below.
2.1 Bottom-up empirical model approach
In the empirical bottom-up method, emissions of NH3 are calculated using statistical compilations of the products of the activity data (the sources) and their corresponding condition-specific emission factors (Zheng et al., 2021). This statistical bottom-up method is also sometimes referred to as an emission factor method, and uses the following general equation:
where E(NH3) is the estimated annual total NH3 emissions over some area (e.g., using provincial boundaries summed at the national scale of the country. i, p, and m represent the source type, the study area in China, and the month, respectively. Ai,p,m is the activity data for each specific category, and EFi,p,m is the corresponding emission factors (Huang et al., 2012; Kang et al., 2016).
Agricultural activities represent the largest contributor of NH3 emissions in China, and recent reports confirm that agricultural activities account for more than 80% of total NH3 emissions nationally (Zhang et al., 2011; Huang et al., 2012; Xu et al., 2016). Cropland ecosystems are an important source of atmospheric NH3 because of extensive nitrogen fertilizer applications, which lead to substantial NH3 volatilization. Earlier research has pointed out that NH3 volatilization rates from fertilizer application strongly depend on fertilizer types, rates, and application method (Huang et al., 2012). In addition, emissions depend on prevailing environmental conditions, such as soil properties and meteorological conditions (temperature, wind speed and precipitation) (Li et al., 2021). The adjusted EFs are then a function of the above parameters for specific conditions (Huang et al., 2012), as shown in the following equation:
where EFi is the emission factor for a specific condition. EF0i is the reference emission factor associated with fertilizer type i, and CF are the correction factors for each variable, such as pH, application rate, temperature and fertilization methods, including basal dressing and top dressing (Huang et al., 2012). These parameters used to adjust EFs are derived from peer-reviewed literatures, which is uniform European EFs or referring to existing native measurements.
Ammoniacal nitrogen (TAN) in livestock waste can be hydrolyzed to ammonium and subsequent NH3 volatilization to the surrounding air, or lost through other pathways during various stages of manure management such as storage and spreading, represents another important source of emission that must be included in ammonia inventories. Most of the earlier studies calculated NH3 emission from livestock waste as a product of domestic animal quantities multiply by an approximate annual EF per animal (Buijsman et al., 1987). More recent researches improved estimates using emission factors based on distinct phases of manure management for different livestock categories, including manure housing, storage, spreading and grazing stage (Dong et al., 2010; Zhang et al., 2010). Other studies compiled recent inventories of optimized NH3 emission using a mass-flow approach, which regards domestic animals in several typical categories, and distinguishes emissions from animals raised by completely different agricultural practices, including free-range, intensive and grazing systems (Li et al., 2021). For each of livestock system, TAN inputted into manure management is the product of the daily amount of urine and excrement produced (kg (day capita)−1, N content (%), and TAN content (%).The livestock NH3 emissions are estimated by multiplying TAN at four different stages of manure management: outdoor, manure housing, storage, and spreading onto farmland with the corresponding EFs (Huang et al., 2012; Kang et al., 2016). The EFs from each livestock waste management are affected by many additional factors. For example, NH3 emissions from the housing stage depends on factors such as housing conditions, humidity, temperature, from spreading stage depends on practices such as basal or deep application.
2.2 Bottom-up process-based model approach
Although improved estimation methods with correction emission factor can reduce uncertainties, there remain several uncertainties. For example, due to a lack of well-defined EFs, the parameters applied in one study conducted under one set of environmental conditions are likely not fit to be directly deployed in a subsequent inventory or study under different conditions. For domestic animals, the potential EFs of each source cannot be exactly determined as conditions vary widely over time and distance (Wang et al., 2021). To narrow the gap between different methods of NH3 emission estimates and the real emission, process-based models (e.g., DNDC, CHANS) have been introduced. These process-based models capture spatio-temporal variations of NH3 emissions by incorporating input-output processes and the interactions between subsystems (Fu et al., 2015; Xu et al., 2018).
The basic principle of process-based models is the use of a mass balance of model inputs and outputs of the system, quantifying all relevant Nr flows and their interactions with the linkages among air, soil and water subsystems (Gu et al., 2012; Luo et al., 2018). For calculation of atmospheric NH3, studies mainly focus on the NH3 subsystem, since the process-based modes consider all significant N outputs, including gas emissions (N2O, NO, NH3), dissolved soil N and crop uptake in response all relevant cropland N inputs (organic manure, N deposition, nitrogen fixation, crop residues and synthetic N fertilizer). The resulting total NH3 emissions are then calculated as the product of NH3 concentration in the soil liquid phase and the parameterized emission coefficients (Yang et al., 2022).
In summary, NH3 emissions calculated by a process-based model approach is a product of corresponding parameterization factors. The model needs a corrected the EFs by considering relevant environmental conditions to accurately assess the emission of the main contributors to NH3 emissions.
2.3 Inverse modeling
An inversion approach also provides insights into the spatial and temporal patterns of NH3 emissions. Inverse modeling starts from an a priori bottom-up emission estimates, and refines it by assimilating observation datasets to obtain a posteriori emissions. This method is also referred to as a top-down method.
The current inverse estimates use either simple mass-balance methods or more complicated data assimilation schemes, such as a Kalman filter and variational data-assimilation. Such methods start with a model simulation that uses a priori emissions and translates these emissions into “simulated observations”. Thus, atmospheric chemistry transport models are an indispensable tool. The Model-3 atmospheric model represented by the Community Multiscale Air Quality Modeling System (CMAQ) and GEOS-Chem model have been widely used to simulate air pollutant concentrations (Pleim and Ran, 2011; Chen et al., 2021; Marais et al., 2021). Next, the mismatch between simulated and true observations is used to define a cost-function that is subsequently minimized. In the case of NH3, the observation datasets used in the inversion can be either from surface monitoring of NHX or satellite observations of NH3 column concentrations.
There are some existing studies that optimized NH3 emissions in China using datasets from surface monitoring networks. NH3 emissions in China were constrained by assimilating NH3 surface observations using an ensemble Kalman filter (Kong et al., 2019). This method is formulated as follows:
where x represents the augmented state. In this state, c and E represent the vectors of monthly NH3 concentrations and emissions, respectively. b is the background state (a priori), and a is the update state (a posteriori). Pb background error covariance matrix that is flow dependent and represented by an ensemble [50 in Kong et al. (2019)]. y0 represents the vector of the observations with an error covariance matrix of R. H is the linear observational operator that maps the m-dimensional state vector x to a p- (number of observations) dimensional observational vector Hxb.
Paulot et al. (2014) improved the NH3 emissions in China for 2005–2008 by minimizing a cost function using variational data-assimilation. NH4+ wet deposition flux measurements from a monitoring network were used to constrain NH3 emissions. The cost function (J) defined as
where yobs and ysim represent the vector of observed monthly wet deposition fluxes of NH4+ and the collocated model values. Sobs and Sa represent the error covariance matrix of the observation system and that of the emissions. The second (background) term in the cost function represents the costs that are related with deviations from the a priori emissions. In their formulation, η is a vector of log-normal scaling factors with elements
Recent advancement in satellite remote sensing techniques enables the observation of atmospheric NH3 vertical columns accurately across time and space. Several studies reported observations of the spatio-temporal distribution of NH3 by utilizing the NH3 column density retrieved from the Tropospheric Emission Spectrometer (TES) (Beer et al., 2008; Shephard et al., 2015), the Cross-track Infrared Sounder (CrIS) (Shephard and Cady-Pereira, 2015), the Atmospheric Infrared Sounder (AIRS) (Warner et al., 2016; Warner et al., 2017) and the Infrared Atmospheric Sounding Interferometer (IASI) (Van Damme et al., 2020; Chen et al., 2021; Luo et al., 2022).
Inverse modeling techniques assimilating these satellite observations have provided unique opportunities to improve NH3 emission estimates with high spatial and temporal resolution using continuous, near real-time, large-scale measurement (Chen et al., 2021). This top-down method has been applied to derive NH3 emissions in other countries and at the global scale (Cao et al., 2020; Chen et al., 2021; Luo et al., 2022; van der Graaf et al., 2022), but such inversion studies are still very limited in China. Zhang et al. (2018) optimized Chinese NH3 emissions by assimilating TES satellite observations of NH3 column concentration for March–October 2008. A state-of-the-art study reported long-term IASI-derived NH3 emission in China by the mass-balance method (Liu et al., 2022b). This mass-balance method was used to exploit the ratio of NH3 emissions to NH3 concentrations. The satellite-derived monthly top-down NH3 emissions (Esat) are derived as follows:
where Ωsat represents either satellite observations of NH3 monthly columns or surface NH3 concentrations derived from satellite columns; Emodel are the monthly NH3 emissions used in model, and Ωmodel represents either the monthly NH3 columns or surface concentration during the satellite overpass simulated by ATM.
Besides, some research validated the inverse model results by combining data from monitoring networks with aircraft remote sensing NH3 observations (Shephard et al., 2015; Sun et al., 2015).
3 Characteristics on NH3 emission in China
We collected ten NH3 emission estimates for China for this review with detailed information on each inventory listed in Table 1. These long-term studies provided an annual trend in NH3 emission, such that we can further survey the impact of policies and regulations on NH3 emissions. Some of these are publicly available datasets [(MEICv1.3), (REASv3.2), (EDGARv5.0) and (CEDS_2020_v1.0)], except for some existing literatures we referred, thus we analyze their spatial and temporal distributions by simply downloading gridded monthly data and take out gridded NH3 emission in China from some global datasets. These estimates covered comprehensive anthropogenic sources, and do not focus just on the agricultural system. In addition, some datasets offered separate NH3 emission estimates by sector. This allows an analysis of the contributions of different sectors to the total NH3 emission.
3.1 Annual trends
Results of interannual variation of NH3 emission for the past few decades in China derived in the ten investigated different studies are given in Figure 1 and Table 1. According to these studies, the national annual emission has roughly doubled since the 1980 from 6.4 (5.2–8.5) Tg yr−1 to 14.0 (9.8–20.8) Tg yr−1 (median, minimum-maximum value) in 2015 (Figure 1, Supplementary Table S1). From an overall perspective, the emission trends can roughly be divided in two stages. From 1980 to 1996, the emissions increased steadily by approximately 5.2 (1.9–6.2) Tg yr−1, with a rapid annual growth rate of about 2.1% yr−1. This is due to an increased synthetic fertilizer application and the fast increase in livestock production, which increased in that time period by a factor of 2 (Kang et al., 2016; Fu et al., 2020; Yu et al., 2020).
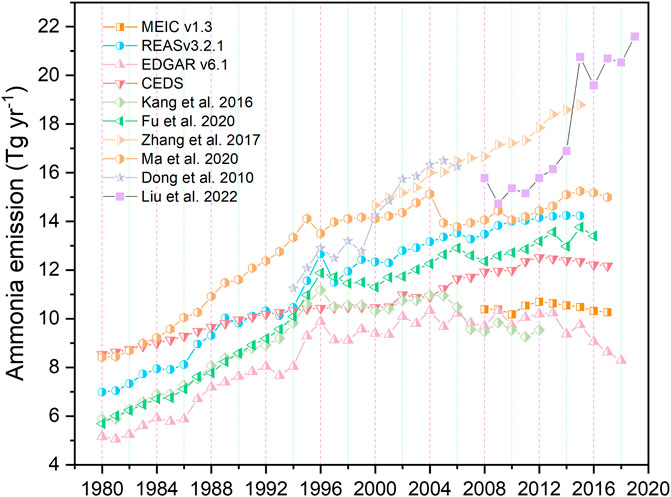
FIGURE 1. Comparison of ammonia emissions in China from ten published results and datasets.
NH3 emissions experienced a temporary slow-down in 1997 and then began to fluctuate with slower growth rates in later years. The emission decline in 1997 can be attributed to the Asia financial crisis which caused a significant reduction in both the livestock and fertilizer industries. From 1998 to 2015, emissions increased by about 1.9 (0.7–2.3) Tg yr−1. A gradual decline in the growth rate of emissions starting in 1998 is likely due to a variety of national strategies and government policies aimed at mitigating NH3 emissions (Ma, 2020). In that period, various emission reduction policies were introduced, such as the corrected air quality standard, national action plan on air pollution control, fertilization recommendation and shut down of small thermal power plants. Encouraged by the Chinese government, a plan on zero increase in fertilizer use was raised in 2015 (Liu et al., 2020). Under the government’s initiative and the effects of a growing market economy, traditional free-range systems for the livestock industry were gradually replaced by large-scale intensive methods, and significant changes in farming practices were implemented. Another influence is in the replacement of ammonium bicarbonate (ABC) with urea, and since NH3 volatilization from ABC is more than two-fold that from urea, a measurable decline in emissions followed (Kang et al., 2016). It should also be noted that changes in the proportions of livestock categories occurred. For example, the class proportion of intensively reared animals for beef cattle, pigs and laying hens significantly increased (Kang et al., 2016). These changes explain why fertilizer production and annual population of poultry have both doubled after 1998 without a corresponding increase in national NH3 emissions.
Contrary to slower growth rates in NH3 emission based on bottom-up methods, Liu et al. (2022a) suggested a rapid growth rate in NH3 emission from 2009 to 2015, with a peak in 2015, using a top-down approach. This increase is driven mainly by observed increases of IASI NH3 column concentrations. This observed increase in NH3 columns over China is likely largely due to a decrease in SO2 emissions in China since 2013 because of air pollution control measures, reducing the transformation of alkaline NH3 to (NH4)2SO4 (Luo et al., 2022).
NH3 emissions in existing databases show visible differences both in terms of total annual emissions and long-term trends. The levels of NH3 emission in the same years are widely different depending on the methods used to obtain the estimates (Figure 1 and Supplementary Table S1). Some results showed gradual stabilization of emissions, while others observed a consistent and stable growth pattern. Such large variations are primarily caused by the following reasons:
1) Agricultural activities represent the largest contributor of NH3 emissions in China, and the range of variation in agriculture emission mainly determines the differences in the estimates of total NH3 emission (Figure 2 and Supplementary Table S3). The activity level of specific sources and emission factors (EFs) are the two principal factors directly affecting NH3 emission estimates, most of these results are based on bottom-up methods. The activity data of agriculture such as fertilizer consumption and livestock numbers are comparable, because data sources in most previous studies cited the same statistical yearbook of each province. The discrepancies are thus mainly a result of inconsistent EFs applied in different inventories, especially some studies use uniform European EFs without adjust by parameters for specific conditions.
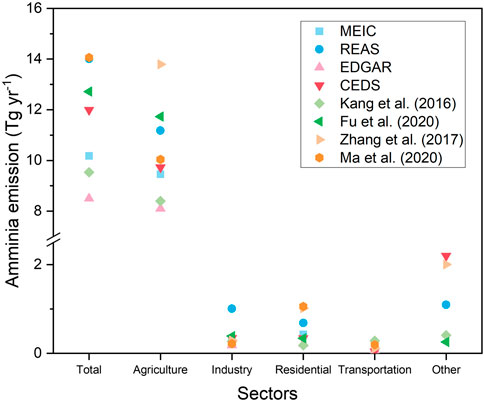
FIGURE 2. The range of differences in ammonia emission from different sectors in 2012 from eight different studies.
In this review, we included studies that mostly employed constant European-based EFs without considering specific agricultural practices and local environmental factors. It should be noted that many recent studies in China to derived emission factors (functions) for fertilizer and manure application as a function of management (e.g. fertilizer type, fertilization method), crop type, livestock type, climate (rainfall, temperature) and/or soil properties (e.g. SOC, clay, pH, CEC, bulk density) such as (Huang et al., 2012; Xu et al., 2015a; Zhou et al., 2015; Xu et al., 2016; Xu et al., 2017a; Wang et al., 2018; Zhang et al., 2018). Considering high volatilization of ABC compared to urea, and interannual variation of synthetic fertilizer types, means some previous studies adopted much lower EFs than those who adjusted for the local environmental conditions, or those who estimated emission from livestock manure employing a mass-flow approach (Huang et al., 2012; Kang et al., 2016). The corrected EFs differed by more than a factor of two when the full range of influences is considered. For instance, the final corrected EFs used in Zhang et al. (2017) are approximately 16.6% higher than in other studies.
2) The source categories included in the compiled inventories are not identical (Supplementary Table S4). Notably, the non-agriculture sectors were usually not considered in some compiled ammonia inventories, mainly because of their relatively small contribution to total emissions. Consequently, several inventories reported that cropland and livestock emissions gradually stabilized since the beginning of the 21st century, but total emissions still show a steady growth because of miscellaneous non-agricultural sources that rose sharply during this period (Fu et al., 2020; Ma, 2020). The emissions from traffic, waste disposal and residential sectors are expected to be dominant in urban and industrial areas, where contributions from the agricultural sector are relatively small (Chang et al., 2019; Fu et al., 2020; Feng et al., 2022). Overlooking these non-agriculture sectors explains thus further the differences in trends and the large range in NH3 emission estimates.
3) The definition of the emission categories and the inclusion of subcategories is inconsistent and sometimes unclear. These discrepancies are not only reflected in categorization of sources, but also in terms of subcategories for each category. Cropland fertilization is included in most estimates. In the study of Kang et al. (2016), however, only synthetic fertilizer applications were calculated, while others reported the subcategories “synthetic fertilizer” and “organic fertilizer” (manure spreading) separately (Fu et al., 2020; Kurokawa and Ohara, 2020; Ma, 2020). Moreover, the “agricultural soil”, “N-fixing crop” and “crop residue compost” subcategories were counted as part of the agricultural system in some studies (Supplementary Table S4) (Kang et al., 2016; Zhang et al., 2017; Ma, 2020). Similar issues exist with other sources, such as residential and biomass burning. The inclusion or exclusion of a subcategory may lead to greater uncertainty in NH3 emission, thereby increasing the difficulty of comparing different published results.
3.2 Seasonal variation
Figure 3 shows that the inventories report substantial seasonal variations of NH3 emissions from six existing studies. The tendency of monthly emissions to rise from January to July and then decline agrees with the temperature patterns and the timing of known agricultural practices. In general, peak emissions occur from June to August, and the highest and lowest monthly emissions were recorded as 1.1 (0.7–3.2) Tg/month in July and 0.7 (0.5–1.4) Tg/month in January. Emissions in summer are approximately two times as high as in winter. These features coincide with seasonal distributions based on studies using an inversion model approach (Paulot et al., 2014; Kong et al., 2019; Evangeliou et al., 2021). The satellite-based monthly spatial distribution in China from (Liu et al., 2022b) show that high NH3 emissions in North China Plain (NCP) occur in June and July.
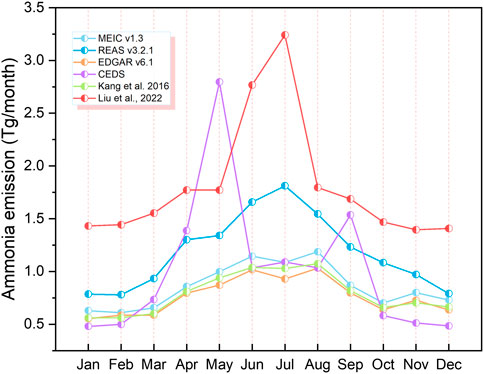
FIGURE 3. The seasonal variations of NH3 emissions (Tg/month) in China from six different studies. (Monthly emissions were collected from the most recent year available for each dataset).
The seasonal variation of NH3 emission is mainly dominated by agriculture activities and temperature, especially synthetic fertilizer application (Figure 4). In China, the spring farming begins in April, and the NH3 emissions continuously increase due to intensive fertilizer application coupled with higher temperatures in the following 1–2 months. Some summer plants such as maize are usually seeded in June with base and topdressing fertilization of other plants. Associated cropland emissions thus peak during June and August (Huang et al., 2012; Kang et al., 2016). From autumn onwards, most of the crops are harvested, which leads to an overall decline of emissions. Conversely, less NH3 volatilization related to lower temperatures and rare cultivation occurs during the winter. The NH3 emission from livestock manure shows a minor seasonal pattern, mainly dominated by seasonal temperature patterns (Figure 4) (Zhang et al., 2018; Li et al., 2021). As with NH3 emissions from livestock and fertilizer applications, the NH3 emissions from biomass burning or forest fires also show a distinct seasonal distribution. However, these effects do not significant influence the temporal disparities of total emissions in these studies due to their relatively small overall contributions (Kang et al., 2016).
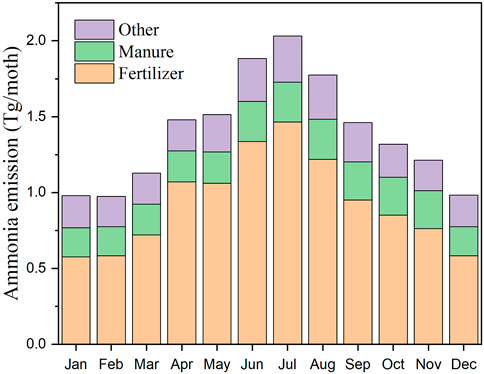
FIGURE 4. The seasonal pattern of major emission sources in China (Tg/month). (The data source is only from REAS because fertilizer and livestock manure are merged as agriculture in other datasets.)
Apart from the obvious seasonal variations, some modelling studies report significantly different monthly emissions. For example, the emission peaks often occur in different months. In particular, Paulot et al. (2014) used a new agricultural emissions inventory (MASAGE_NH3) to suggest that the largest emissions occurred in April and July due to the timing of fertilizer practices. This phenomenon is consistent with some earlier studies that focused on cropland fertilization only (Zhang et al., 2011; Wang et al., 2021). Others studies reported peak NH3 emissions that occurred in May and September due to inaccurate grasp of the timing of fertilizer application (Cao et al., 2011; Hoesly et al., 2018). The seasonal distribution from CEDS show a more uniform emission peak compared to other studies. In CEDS studies, regional procedures and practices of agriculture fertilization were ignored, leading to large variation in monthly emissions. Crop types are another confounding factor. There is considerable spatial heterogeneity in crop-categories in China, with maize mainly in the north and rice mainly in the south. Moreover, even within a single crop type category, variations exist. For example, maize crops include spring maize and summer maize. Spring maize is fertilized in March-April but the optimal date of summer maize fertilization is much later, from June to August depending on the region (Li et al., 2021). The actual farming conditions drive these differences in the fertilization dates of different provinces. In most previous studies, fertilization dates are fixed to a specific month without considering spatial heterogeneity, and they ignore the different crop types and agricultural practices on the ground. However, recent studies consider quite some variations (e.g. Li et al. (2021)), thus explaining differences in the temporal variation.
3.3 Spatial distribution
The spatial patterns of NH3 emission data are compared for the year 2015, being available from four gridded datasets revealing a large spatial variability over China (Figure 5). The highest NH3 emission intensities are concentrated in the NCP area, and in eastern and south-central China, due to intensive agricultural practices in the provinces of Shandong, Hebei and Henan. Although six provinces (Shandong, Henan, Hebei, Tianjin, Jiangsu and Anhui) account for only 8% of mainland China, they contribute almost 30% of the total NH3 emission in China. The high emission intensity in the NCP is associated with a rapid growth rate in fertilization and livestock practices in that region. In addition, predominately alkaline soil properties in NCP further result in higher NH3 volatilization (Zhang et al., 2010; Fu et al., 2020). The Beijing-Tianjin-Hebei region shows remarkable NH3 emissions, dominated by non-agriculture sources consistent with the result of satellite remote sensing observations (Van Damme et al., 2015; Liu et al., 2017).
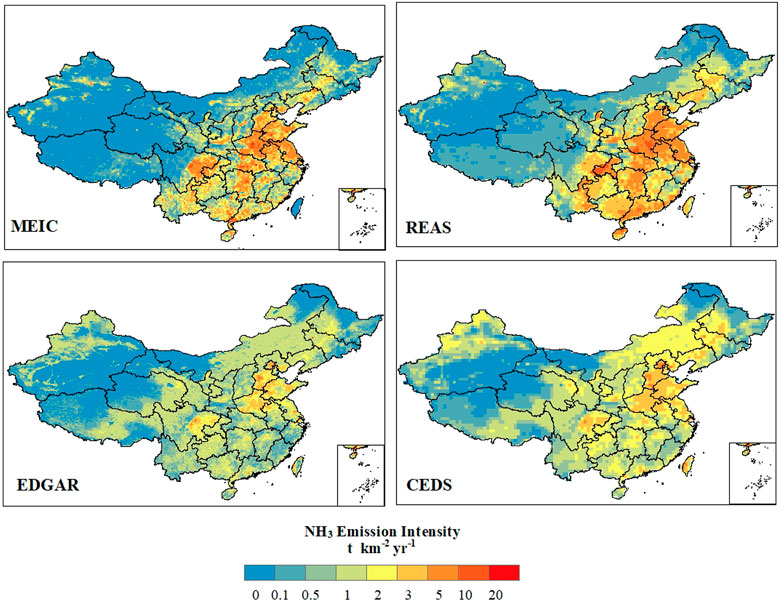
FIGURE 5. Spatial distribution of gridded NH3 emissions in 2015 from China.
The intensive agriculture of the Sichuan Basin plays a significant role in high NH3 emission in southwest China, with the highest observed growth rates of ∼2.3% yr−1 (Table 2). The emission contribution from Sichuan accounts for 6.5% of the national total emission, mainly caused by fertilizer application and livestock, which jointly contribute 87% for this major regional emitter (Huang et al., 2012). In contrast, the regions with low NH3 emission are primarily located across northwest and northeast China. These regions are characterized by dry climates with infrequent application of synthetic fertilizer, lower population densities and less overall industrial activity (Ma, 2020).
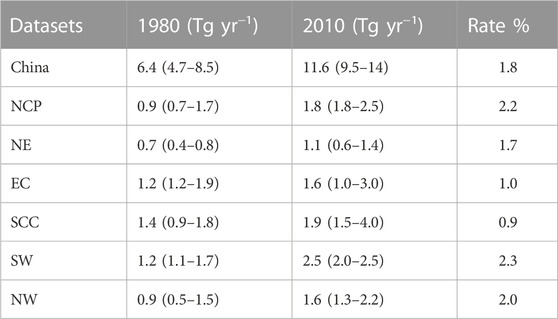
TABLE 2. The average annual growth of NH3 emission in six different regions from 1980 to 2010. (Detailed information of regions is in Supplementary Table S2.)
Some studies show a higher emission intensity in NCP, eastern and Sichuan basin compared to other regions (MEIC and REAS). This is similar to spatial distribution derived by IASI, and satellite-based studies also show a high spatial variation and hotspot areas (Chen et al., 2020; Liu et al., 2022b). Other datasets show a more uniform distribution in most areas in China (EDGAR and CEDS). The major reason of this discrepancy is again that inconsistent EFs of agricultural activities are applied in different inventories. The neglected non-agriculture sectors and subcategories are also explanations for discrepancies in the spatial distribution of NH3 emissions in the different inventories.
4 Summary and recommendations
Increased anthropogenic activities in China have driven a two-fold rise in NH3 emission to the atmosphere over the past few decades (Figure 1). Cropland and livestock emissions represent the largest contributors in China, accounting for approximately 80% of total emission (Figure 2). Non-agriculture sources, such as human excrement, waste treatment, traffic and NH3 escape, contribute much less to the emissions. Although slowing, the growth rate in NH3 emission from agriculture and non-agriculture sources has increased rapidly over the recent decades (Ma, 2020). Emission hotspots are located in the North China Plain, the Middle and Lower Yangtze River delta of economic development, and the Sichuan Basin (Figure 5). Seasonally, the peak NH3 emissions is predicted in summer, consistent with agricultural practices and changes in temperature (Figure 3 and Figure 4).
Several differences are identified in the estimates of country totals, spatial distribution and monthly variation in NH3 emission by the various studies. The differences are mainly caused by the wide range of EFs used by different studies, and the neglect of some or all non-agricultural sources (Xu et al., 2016; Kong et al., 2019). Additionally. Some studies ignored the actual agricultural practices and existing spatial heterogeneity of agricultural activities (Li et al., 2021). Several prevailing inventories only had coarse temporal and spatial resolutions. The NH3 emission estimates are often accomplished at provincial scales and then allocated to coarse spatial grids with the consequent loss of detailed point sources (Dong et al., 2010; Fu et al., 2020). Based on the insights from our comparison of NH3 emission estimates, we offer the following five recommendations.
First, we should establish a logical and clear scheme for NH3 emission calculations, including major emission sectors and categories. A standardized classification of subcategories needs to clarify important concepts to reduce bias in emission estimates. This can be accomplished, by incorporating energy, power, fuel combustion source contributions, and by including other conditions (Xian et al., 2019). The classification of subcategories will form a consistent basis for comparison of different results. Clear definitions of each sector and all the subcategories will reduce biases in the future. The neglect of some sources leads to biases in emission estimates, especially as the importance of non-agricultural sources will gradually increase in the future (Chen et al., 2022).
Second, we need to improve the accuracy of primary parameters that drive NH3 emissions, such as cropland fertilization, livestock excretion and their corresponding emission factors. We recommend replacement of uniform European EFs with locally-measured-field EFs (Zhang et al., 2018). Specify the factors that should be considered for EFs correction and use a standard and transparent method to apply these corrections.
Third, we noticed that data downloaded from the same data sources at different times varied significantly. Clear documentation of data collected and the use of the most up-to-date statistics are essential, especially when there are major corrections later applied to the records (Zheng et al., 2021).
Fourth, there are both bottom-up and top-down methods of pollutant estimates, and each approach possesses specific strengths and weaknesses based on different assumptions. We recommend developing NH3 emission estimates with different approaches and comparing the results to further improve our understanding of NH3 emission and the main uncertainties. An ideal approach is to combine bottom-up with top-down inversion methods (Paulot et al., 2014; Zhang et al., 2017).
Finally, the quality, accuracy, temporal resolution and timeliness of national statistics should be continuously improved through the design of better data-collection methods (farm surveys and censuses). The numbers of different types of livestock directly impact the accuracy and usefulness of NH3 emission estimates, but the necessary input data are often lacking or incomplete in some regions (Zhang et al., 2018). The statistical activity data are at the annual scale at present, and significant reduction in the uncertainties of seasonal and spatial estimates can be obtained if monthly statistics are employed. A final issue is that relevant statistics are often published with substantial time lags because of the time and resources needed to collect and process the input data. This situation leads to the use of suboptimal data from previous years for current year model simulations and NH3 estimates (Zhang et al., 2021).
Author contributions
JC: Writing-original draft, Writing-review and editing, Formal analysis, Data curation, Visualization. MC: Discussed the results and commented, Funding acquisition. MK, WV: Writing-review & editing, Commented on the paper. QZ and XL: Suggestion. FZ: Supervision. WX: Writing-review & editing, discussed the results and commented on the paper.
Funding
This work was supported by the National Natural Science Foundation of China (42175137), the National Key Research and Development Program of China (2022YFC3703400), the National Key Research and Development Program of China (2021YFD1700902), the High-level Team Project of China Agricultural University, and the Beijing Advanced Discipline Funding.
Conflict of interest
The authors declare that the research was conducted in the absence of any commercial or financial relationships that could be construed as a potential conflict of interest.
Publisher’s note
All claims expressed in this article are solely those of the authors and do not necessarily represent those of their affiliated organizations, or those of the publisher, the editors and the reviewers. Any product that may be evaluated in this article, or claim that may be made by its manufacturer, is not guaranteed or endorsed by the publisher.
Supplementary material
The Supplementary Material for this article can be found online at: https://www.frontiersin.org/articles/10.3389/fenvs.2023.1133753/full#supplementary-material
References
Beer, R., Shephard, M. W., Kulawik, S. S., Clough, S. A., Eldering, A., Bowman, K. W., et al. (2008). First satellite observations of lower tropospheric ammonia and methanol. Geophys. Res. Lett. 35 (9), L09801. doi:10.1029/2008gl033642
Bouwman, A. F., Boumans, L. J. M., and Batjes, N. H. (2002). Estimation of global NH3 volatilization loss from synthetic fertilizers and animal manure applied to arable lands and grasslands. Glob. Biogeochem. Cycles 16 (2), 1–14. doi:10.1029/2000gb001389
Buijsman, E., Maas, H. F. M., and Asman, W. A. H. (1987). Anthropogenic NH3 emissions in europe. Atmos. Environ. 21, 1009–1022. doi:10.1016/0004-6981(87)90230-7
Cao, G., Zhang, X., Gong, S., An, X., and Wang, Y. (2011). Emission inventories of primary particles and pollutant gases for China. Chin. Sci. Bull. 56 (8), 781–788. doi:10.1007/s11434-011-4373-7
Cao, H., Henze, D. K., Shephard, M. W., Dammers, E., Cady-Pereira, K., Alvarado, M., et al. (2020). Inverse modeling of NH3 sources using CrIS remote sensing measurements. Environ. Res. Lett. 15 (10), 104082. doi:10.1088/1748-9326/abb5cc
Chang, Y., Zou, Z., Zhang, Y., Deng, C., Hu, J., Shi, Z., et al. (2019). Assessing contributions of agricultural and nonagricultural emissions to atmospheric ammonia in a Chinese megacity. Environ. Sci. Technol. 53 (4), 1822–1833. doi:10.1021/acs.est.8b05984
Chen, S., Cheng, M., Guo, Z., Xu, W., Du, X., and Li, Y. (2020). Enhanced atmospheric ammonia (NH3) pollution in China from 2008 to 2016: Evidence from a combination of observations and emissions. Environ. Pollut. 263, 114421. doi:10.1016/j.envpol.2020.114421
Chen, Y., Shen, H., Kaiser, J., Hu, Y., Capps, S. L., Zhao, S., et al. (2021). High-resolution hybrid inversion of IASI ammonia columns to constrain US ammonia emissions using the CMAQ adjoint model. Atmos. Chem. Phys. 21 (3), 2067–2082. doi:10.5194/acp-21-2067-2021
Chen, Z. L., Song, W., Hu, C. C., Liu, X. J., Chen, G. Y., Walters, W. W., et al. (2022). Significant contributions of combustion-related sources to ammonia emissions. Nat. Commun. 13 (1), 7710. doi:10.1038/s41467-022-35381-4
Community Emissions Data System (2021). Community emissions data system. Available at: Accesses https://zenodo.org/record/3754964#.YtKqw6135D8 (September 21, 2021).
Dong, W. X., Xing, J., and Wang, S. X. (2010). Temporal and spatial distribution of anthropogenic ammonia emissions in China: 1994-2006. Huanjing Kexue 31 (7), 1457–1463.
Emissions Database for Global Atmospheric Research (2023). Emissions database for global atmospheric research. Available at: https://edgar.jrc.ec.europa.eu/ (Accesses January 10, 2023).
Erisman, J. W., Sutton, M. A., Galloway, J., Klimont, Z., and Winiwarter, W. (2008). How a century of ammonia synthesis changed the world. Nat. Geosci. 1 (10), 636–639. doi:10.1038/ngeo325
Evangeliou, N., Balkanski, Y., Eckhardt, S., Cozic, A., Van Damme, M., Coheur, P.-F., et al. (2021). 10-year satellite-constrained fluxes of ammonia improve performance of chemistry transport models. Atmos. Chem. Phys. 21 (6), 4431–4451. doi:10.5194/acp-21-4431-2021
Feng, S., Xu, W., Cheng, M., Ma, Y., Wu, L., Kang, J., et al. (2022). Overlooked nonagricultural and wintertime agricultural NH3 emissions in quzhou county, north China plain: Evidence from 15N-stable isotopes. Environ. Sci. Technol. Lett. 9 (2), 127–133. doi:10.1021/acs.estlett.1c00935
Fowler, D., Coyle, M., Skiba, U., Sutton, M. A., Cape, J. N., Reis, S., et al. (2013). The global nitrogen cycle in the twenty-first century. Philosophical Trans. R. Soc. B-Biological Sci. 368 (1621), 20130164. doi:10.1098/rstb.2013.0164
Fu, H., Luo, Z., and Hu, S. (2020). A temporal-spatial analysis and future trends of ammonia emissions in China. Sci. Total Environ. 731, 138897. doi:10.1016/j.scitotenv.2020.138897
Fu, X., Wang, S. X., Ran, L. M., Pleim, J. E., Cooter, E., Bash, J. O., et al. (2015). Estimating NH3 emissions from agricultural fertilizer application in China using the bi-directional CMAQ model coupled to an agro-ecosystem model. Atmospheric Chem. Phys. 15 (2), 6637–6649. doi:10.5194/acp-15-6637-2015
Gu, B., Ge, Y., Ren, Y., Xu, B., Luo, W., Jiang, H., et al. (2012). Atmospheric reactive nitrogen in China: Sources, recent trends, and damage costs. Environ. Sci. Technol. 46 (17), 9420–9427. doi:10.1021/es301446g
Hoesly, R. M., Smith, S. J., Feng, L., Klimont, Z., Janssens-Maenhout, G., Pitkanen, T., et al. (2018). Historical (1750–2014) anthropogenic emissions of reactive gases and aerosols from the Community Emissions Data System (CEDS). Geosci. Model Dev. 11 (1), 369–408. doi:10.5194/gmd-11-369-2018
Huang, R.-J., Zhang, Y., Bozzetti, C., Ho, K.-F., Cao, J.-J., Han, Y., et al. (2014). High secondary aerosol contribution to particulate pollution during haze events in China. Nature 514 (7521), 218–222. doi:10.1038/nature13774
Huang, X., Song, Y., Li, M., Li, J., Huo, Q., Cai, X., et al. (2012). A high-resolution ammonia emission inventory in China. Glob. Biogeochem. Cycles 26. doi:10.1029/2011gb004161
Kang, Y., Liu, M., Song, Y., Huang, X., Yao, H., Cai, X., et al. (2016). High-resolution ammonia emissions inventories in China from 1980 to 2012. Atmos. Chem. Phys. 16 (4), 2043–2058. doi:10.5194/acp-16-2043-2016
Kong, L., Tang, X., Zhu, J., Wang, Z., Pan, Y., Wu, H., et al. (2019). Improved inversion of monthly ammonia emissions in China based on the Chinese ammonia monitoring network and Ensemble Kalman Filter. Environ. Sci. Technol. 53 (21), 12529–12538. doi:10.1021/acs.est.9b02701
Kurokawa, J., and Ohara, T. (2020). Long-term historical trends in air pollutant emissions in Asia: Regional Emission inventory in Asia (REAS) version 3. Atmos. Chem. Phys. 20 (21), 12761–12793. doi:10.5194/acp-20-12761-2020
Li, B., Chen, L., Shen, W., Jin, J., Wang, T., Wang, P., et al. (2021). Improved gridded ammonia emission inventory in China. Atmos. Chem. Phys. 21 (20), 15883–15900. doi:10.5194/acp-21-15883-2021
Liu, L., Xu, W., Lu, X., Zhong, B., Guo, Y., Lu, X., et al. (2022a). Exploring global changes in agricultural ammonia emissions and their contribution to nitrogen deposition since 1980. Proc. Natl. Acad. Sci. U. S. A. 119 (14), e2121998119. doi:10.1073/pnas.2121998119
Liu, L., Zhang, X., Xu, W., Liu, X., Lu, X., Wang, S., et al. (2017). Ground ammonia concentrations over China derived from satellite and atmospheric transport modeling. Remote Sens. 9 (5), 467. doi:10.3390/rs9050467
Liu, P., Ding, J., Liu, L., Xu, W., and Liu, X. (2022b). Estimation of surface ammonia concentrations and emissions in China from the polar-orbiting infrared atmospheric sounding interferometer and the FY-4A geostationary interferometric infrared sounder. Atmos. Chem. Phys. 22 (13), 9099–9110. doi:10.5194/acp-22-9099-2022
Liu, X., Duan, L., Mo, J., Du, E., Shen, J., Lu, X., et al. (2011). Nitrogen deposition and its ecological impact in China: An overview. Environ. Pollut. 159 (10), 2251–2264. doi:10.1016/j.envpol.2010.08.002
Liu, X. J., Xu, W., Du, E. Z., Tang, A. H., Zhang, Y., Zhang, Y. Y., et al. (2020). Environmental impacts of nitrogen emissions in China and the role of policies in emission reduction. Philosophical Trans. R. Soc. A-Mathematical Phys. Eng. Sci. 378 (2183), 20190324. doi:10.1098/rsta.2019.0324
Luo, Z., Hu, S., and Chen, D. (2018). The trends of aquacultural nitrogen budget and its environmental implications in China. Sci. Rep. 8, 10877. doi:10.1038/s41598-018-29214-y
Luo, Z., Zhang, Y., Chen, W., Van Damme, M., Coheur, P.-F., and Clarisse, L. (2022). Estimating global ammonia (NH3) emissions based on IASI observations from 2008-2018. Atmos. Chem. Phys. 22, 10375–10388. doi:10.5194/acp-22-10375-2022
Ma, S. (2020). High-resolution assessment of ammonia emissions in China: Inventories, driving forces and mitigation. Atmos. Environ. 229, 117458. doi:10.1016/j.atmosenv.2020.117458
Marais, E. A., Pandey, A. K., Van Damme, M., Clarisse, L., Coheur, P. F., Shephard, M. W., et al. (2021). UK ammonia emissions estimated with satellite observations and GEOS-chem. J. Geophys. Res. Atmos. 126 (18). doi:10.1029/2021jd035237
Meng, F., Zhang, Y., Kang, J., Heal, M. R., Reis, S., Wang, M., et al. (2022). Trends in secondary inorganic aerosol pollution in China and its responses to emission controls of precursors in wintertime. Atmos. Chem. Phys. 22 (9), 6291–6308. doi:10.5194/acp-22-6291-2022
Multiresolution Emission Inventory for China (2021). Multiresolution emission inventory for China. Available at: http://meicmodel.org/ (Accesses October 10, 2021).
Paulot, F., Jacob, D. J., Pinder, R. W., Bash, J. O., Travis, K., and Henze, D. K. (2014). Ammonia emissions in the United States, European Union, and China derived by high-resolution inversion of ammonium wet deposition data: Interpretation with a new agricultural emissions inventory (MASAGE_NH3). J. Geophys. Research-Atmospheres 119 (7), 4343–4364. doi:10.1002/2013jd021130
Pleim, J., and Ran, L. (2011). Surface flux modeling for air quality applications. Atmosphere 2 (3), 271–302. doi:10.3390/atmos2030271
Regional Emission inventory in Asia (2021). Regional emission inventory in Asia. Available at: https://www.nies.go.jp/REAS/index.html (Accesses September 21, 2021).
Shephard, M. W., and Cady-Pereira, K. E. (2015). Cross-track Infrared Sounder (CrIS) satellite observations of tropospheric ammonia. Atmos. Meas. Tech. 8 (3), 1323–1336. doi:10.5194/amt-8-1323-2015
Shephard, M. W., McLinden, C. A., Cady-Pereira, K. E., Luo, M., Moussa, S. G., Leithead, A., et al. (2015). Tropospheric emission spectrometer (TES) satellite observations of ammonia, methanol, formic acid, and carbon monoxide over the Canadian oil sands: Validation and model evaluation. Atmos. Meas. Tech. 8 (12), 5189–5211. doi:10.5194/amt-8-5189-2015
Streets, D. G., Bond, T. C., Carmichael, G. R., Fernandes, S. D., Fu, Q., He, D., et al. (2003). An inventory of gaseous and primary aerosol emissions in Asia in the year 2000. J. Geophys. Research-Atmospheres 108 (D21). doi:10.1029/2002jd003093
Sun, K., Cady-Pereira, K., Miller, D. J., Tao, L., Zondlo, M. A., Nowak, J. B., et al. (2015). Validation of TES ammonia observations at the single pixel scale in the San Joaquin Valley during DISCOVER-AQ. J. Geophys. Res. Atmos. 120 (10), 5140–5154. doi:10.1002/2014jd022846
Van Damme, M., Clarisse, L., Franco, B., Sutton, M. A., Erisman, J. W., Wichink Kruit, R., et al. (2020). Global, regional and national trends of atmospheric ammonia derived from a decadal (2008-2018) satellite record. Environ. Res. Lett. 16, 055017. doi:10.1088/1748-9326/abd5e0
Van Damme, M., Erisman, J. W., Clarisse, L., Dammers, E., Whitburn, S., Clerbaux, C., et al. (2015). Worldwide spatiotemporal atmospheric ammonia (NH3) columns variability revealed by satellite. Geophys. Res. Lett. 42 (20), 8660–8668. doi:10.1002/2015gl065496
van der Graaf, S., Dammers, E., Segers, A., Kranenburg, R., Schaap, M., Shephard, M. W., et al. (2022). Data assimilation of CrIS NH3 satellite observations for improving spatiotemporal NH3 distributions in LOTOS-EUROS. Atmos. Chem. Phys. 22 (2), 951–972. doi:10.5194/acp-22-951-2022
Wang, C., Cheng, K., Ren, C., Liu, H., Sun, J., Reis, S., et al. (2021). An empirical model to estimate ammonia emission from cropland fertilization in China. Environ. Pollut. 288, 117982. doi:10.1016/j.envpol.2021.117982
Wang, C., Yin, S., Bai, L., Zhang, X., Gu, X., Zhang, H., et al. (2018)., 193. China, 200611–201623. doi:10.1016/j.atmosenv.2018.08.063High-resolution ammonia emission inventories with comprehensive analysis and evaluation in Henan, China, 2006–2016Atmos. Environ.
Warner, J. X., Dickerson, R. R., Wei, Z., Strow, L. L., Wang, Y., and Liang, Q. (2017). Increased atmospheric ammonia over the world's major agricultural areas detected from space. Geophys. Res. Lett. 44 (6), 2875–2884. doi:10.1002/2016gl072305
Warner, J. X., Wei, Z., Strow, L. L., Dickerson, R. R., and Nowak, J. B. (2016). The global tropospheric ammonia distribution as seen in the 13-year AIRS measurement record. Atmos. Chem. Phys. 16 (8), 5467–5479. doi:10.5194/acp-16-5467-2016
Xian, C., Zhang, X., Zhang, J., Fan, Y., Zheng, H., Salzman, J., et al. (2019). Recent patterns of anthropogenic reactive nitrogen emissions with urbanization in China: Dynamics, major problems, and potential solutions. Sci. Total Environ. 656, 1071–1081. doi:10.1016/j.scitotenv.2018.11.352
Xu, P., Koloutsou-Vakakis, S., Rood, M. J., and Luan, S. (2017a). Projections of NH(3) emissions from manure generated by livestock production in China to 2030 under six mitigation scenarios. Sci. Total Environ. 607-608, 78–86. doi:10.1016/j.scitotenv.2017.06.258
Xu, P., Liao, Y. J., Lin, Y. H., Zhao, C. X., Yan, C. H., Cao, M. N., et al. (2016). High-resolution inventory of ammonia emissions from agricultural fertilizer in China from 1978 to 2008. Atmos. Chem. Phys. 16 (3), 1207–1218. doi:10.5194/acp-16-1207-2016
Xu, P., Zhang, Y., Gong, W., Hou, X., Kroeze, C., Gao, W., et al. (2015a). An inventory of the emission of ammonia from agricultural fertilizer application in China for 2010 and its high-resolution spatial distribution. Atmos. Environ. 115, 141–148. doi:10.1016/j.atmosenv.2015.05.020
Xu, W., Liu, L., Cheng, M., Zhao, Y., Zhang, L., Pan, Y., et al. (2018). Spatial-temporal patterns of inorganic nitrogen air concentrations and deposition in eastern China. Atmos. Chem. Phys. 18 (15), 10931–10954. doi:10.5194/acp-18-10931-2018
Xu, W., Luo, X. S., Pan, Y. P., Zhang, L., Tang, A. H., Shen, J. L., et al. (2015b). Quantifying atmospheric nitrogen deposition through a nationwide monitoring network across China. Atmos. Chem. Phys. 15 (21), 12345–12360. doi:10.5194/acp-15-12345-2015
Xu, W., Song, W., Zhang, Y., Liu, X., Zhang, L., Zhao, Y., et al. (2017b). Air quality improvement in a megacity: Implications from 2015 beijing parade blue pollution control actions. Atmos. Chem. Phys. 17 (1), 31–46. doi:10.5194/acp-17-31-2017
Xu, W., Zhao, Y., Wen, Z., Chang, Y., Pan, Y., Sun, Y., et al. (2022). Increasing importance of ammonia emission abatement in PM(2.5) pollution control. Sci. Bull. (Beijing) 67 (17), 1745–1749. doi:10.1016/j.scib.2022.07.021
Yang, Y., Liu, L., Bai, Z., Xu, W., Zhang, F., Zhang, X., et al. (2022). Comprehensive quantification of global cropland ammonia emissions and potential abatement. Sci. Total Environ. 812, 151450. doi:10.1016/j.scitotenv.2021.151450
Ye, X., Ma, Z., Zhang, J., Du, H., Chen, J., Chen, H., et al. (2011). Important role of ammonia on haze formation in Shanghai. Environ. Res. Lett. 6 (2), 024019. doi:10.1088/1748-9326/6/2/024019
Yu, X. N., Shen, L., Hou, X. H., Yuan, L., Pan, Y. P., An, J. L., et al. (2020). High-resolution anthropogenic ammonia emission inventory for the Yangtze River Delta, China. Chemosphere 251, 126342. doi:10.1016/j.chemosphere.2020.126342
Zhan, X., Adalibieke, W., Cui, X., Winiwarter, W., Reis, S., Zhang, L., et al. (2021). Improved estimates of ammonia emissions from global croplands. Environ. Sci. Technol. 55 (2), 1329–1338. doi:10.1021/acs.est.0c05149
Zhang, L., Chen, Y., Zhao, Y., Henze, D. K., Zhu, L., Song, Y., et al. (2018). Agricultural ammonia emissions in China: Reconciling bottom-up and top-down estimates. Atmos. Chem. Phys. 18 (1), 339–355. doi:10.5194/acp-18-339-2018
Zhang, X. M., Wu, Y. Y., Liu, X. J., Reis, S., Jin, J. X., Dragosits, U., et al. (2017). Ammonia emissions may be substantially underestimated in China. Environ. Sci. Technol. 51 (21), 12089–12096. doi:10.1021/acs.est.7b02171
Zhang, X., Zou, T., Lassaletta, L., Mueller, N. D., Tubiello, F. N., Lisk, M. D., et al. (2021). Quantification of global and national nitrogen budgets for crop production. Nat. Food 2 (7), 529–540. doi:10.1038/s43016-021-00318-5
Zhang, Y., Dore, A. J., Ma, L., Liu, X. J., Ma, W. Q., Cape, J. N., et al. (2010). Agricultural ammonia emissions inventory and spatial distribution in the North China Plain. Environ. Pollut. 158 (2), 490–501. doi:10.1016/j.envpol.2009.08.033
Zhang, Y., Luan, S., Chen, L., and Shao, M. (2011). Estimating the volatilization of ammonia from synthetic nitrogenous fertilizers used in China. J. Environ. Manag. 92 (3), 480–493. doi:10.1016/j.jenvman.2010.09.018
Zheng, B., Cheng, J., Geng, G., Wang, X., Li, M., Shi, Q., et al. (2021). Mapping anthropogenic emissions in China at 1 km spatial resolution and its application in air quality modeling. Sci. Bull. 66 (6), 612–620. doi:10.1016/j.scib.2020.12.008
Keywords: ammonia emission, estimation, approach, spatial-seasonal, difference
Citation: Chen J, Cheng M, Krol M, de Vries W, Zhu Q, Liu X, Zhang F and Xu W (2023) Trends in anthropogenic ammonia emissions in China since 1980: A review of approaches and estimations. Front. Environ. Sci. 11:1133753. doi: 10.3389/fenvs.2023.1133753
Received: 29 December 2022; Accepted: 09 February 2023;
Published: 02 March 2023.
Edited by:
Lei Liu, Lanzhou University, ChinaReviewed by:
Yuanhong Zhao, Ocean University of China, ChinaYuepeng Pan, Institute of Atmospheric Physics (CAS), China
Copyright © 2023 Chen, Cheng, Krol, de Vries, Zhu, Liu, Zhang and Xu. This is an open-access article distributed under the terms of the Creative Commons Attribution License (CC BY). The use, distribution or reproduction in other forums is permitted, provided the original author(s) and the copyright owner(s) are credited and that the original publication in this journal is cited, in accordance with accepted academic practice. No use, distribution or reproduction is permitted which does not comply with these terms.
*Correspondence: Miaomiao Cheng, Y2hlbmdtbUBjcmFlcy5vcmcuY24=; Wen Xu, d2VueHVAY2F1LmVkdS5jbg==