 Taquan Ma1
 Donghui Zhang2*
 Xusheng Li3Yao Huang4
 Lifu Zhang4,5
 Zhenchang Zhu6Xuejian Sun4,5Ziyue Lan4Wei Guo7
- 1College of Geography and Tourism, Chongqing Normal University, Chongqing, China
- 2Institute of Remote Sensing Satellite, China Academy of Space Technology, Beijing, China
- 3Tianjin Centre of Geological Survey, China Geological Survey, Tianjin, China
- 4Progoo Research Institute, Tianjin Progoo Information Technology Co., Ltd., Tianjin, China
- 5Aerospace Information Research Institute, Chinese Academy of Sciences, Beijing, China
- 6Guangdong Provincial Key Laboratory of Water Quality Improvement and Ecological Restoration for Watersheds, Institute of Environmental and Ecological Engineering, Guangdong University of Technology, Guangzhou, China
- 7Shenzhen Intelligence. Ally Technology Co., Ltd., Shenzhen, China
Water environment health assessment is one of the vital fields closely related to the quality of human life. The change of material contained in water will lead to the reflectance change of hyperspectral remote sensing data. According to this phenomenon, the water quality parameters are calculated to achieve the purpose of water quality monitoring. Series knowledge graphs in this field are drawn after analyzing 564 publications from WOS (Web of Science) and EI (The Engineering Index) databases since 1994 with the support of VOSviewer and CiteSpace. Including statistics of documents publication time, contribution analysis, the influence of publications and journals, and the influence of funding institutions. It is concluded that the research trend of hyperspectral water quality monitoring is the machine learning algorithm based on UAV (Unmanned Aerial Vehicle) hyperspectral instrument data by analyzing scientific research cooperation, keyword analysis, and research hotspots. The whole picture of the research is obtained in this field from four subfields: application scenarios, data sources, water quality parameters, and monitoring algorithms in this paper. It is summarized that the miniaturization, integration, and intelligence of hyperspectral sensors will be the research trend in the next 10 years or even longer. The conclusions have significant reference values for this field.
1 Introduction
Water is called the source of life, which makes protecting water resources, preventing water pollution and rational using water resources hot issues of concern to all mankind (Hou et al., 2022). In the summer of 2022, the water level of rivers dropped sharply, and the residents had difficulty drinking water in many countries both in Europe and Asia, making the public pay more attention to water resources (Zhang et al., 2022). Remote sensing technology has been applied to water environment monitoring for more than 40 years (Mueksch, 1994). It is generally believed that remote sensing technology can play a vital role in water boundary, water depth, water temperature, and water quality evaluation (Leuven et al., 2002; Calderón et al., 2013; Rotkiske and Jr, 2018). With the increase in the number of bands and the optimization of the algorithm, more and more water quality parameters can be quantified, especially in water quality evaluation (Mbuh, 2018). Early water color remote sensing was mainly used in a wide range of marine applications (Herut et al., 1999; Wolny et al., 2020). While more and more advanced sensors are recently applied to water quality monitoring with the aggravation of inland water quality problems (Qian et al., 2017; Cao et al., 2018; Niu et al., 2021; Lu et al., 2022).
The application scenario of remote sensing technology has gradually transitioned from the ocean and river to the study of lakes and urban water networks, which proves that remote sensing technology has steadily developed from macroscopic observation to microscopic monitoring (Delegido et al., 2014). Regarding monitoring data sources, from satellite and airborne to UAV and water surface buoy data (Zhang et al., 2022). The data showed a change in law from multispectral to hyperspectral integration. The water quality parameters monitored by remote sensing technology gradually transition from chlorophyll and cyanobacteria to calculate more than ten chemical parameters (Govender et al., 2007). The application range is progressively developed from optical parameters to non-optical parameters. And the research of monitoring algorithms has made rapid progress, from regression and correlation algorithms to artificial intelligence and machine learning algorithms (Maier and Keller, 2019; Sarigai et al., 2021). As a result, the efficiency and accuracy of data calculation are constantly improving.
Although hyperspectral remote sensing technology is one of the irreplaceable technologies for water quality monitoring and has become the scientific community’s consensus, there is no mature theory and method to replace the traditional chemical reagent method completely, and many studies are still in the exploratory stage. Therefore, it is of great significance for the follow-up research to fully evaluate the application status of remote sensing technology in the water environment (Lee et al., 2008; Zhang et al., 2009; Harmel et al., 2012; Song et al., 2012). Some publications on Hyperspectral water quality monitoring and analysis have appeared in different disciplines since 1994 (Mueksch, 1994). It is not difficult to find that the existing research mainly focuses on limited fields such as atmospheric correction, data preprocessing, modeling algorithms, and application case analysis through the investigation of publications in this field (Salama and Monbaliu, 2002; Reuter et al., 2017). There are few publications on application scenarios, data sources, monitoring indicators, and algorithm trends. Only Joyce et al. researched the publication’s analysis of multisensor technology for water quality monitoring in catchment areas through literature metrology analysis and knowledge mapping analysis (O’Grady et al., 2021).
Other publications discuss single indicators, such as chlorophyll and total phosphorus, but rarely involve a systematic analysis of water quality parameters combined with hyperspectral technology (Maier and Keller, 2019; Li et al., 2020). In addition, there is almost no comprehensive study on the development trend of water quality parameter calculation methods. Considering that the data platform of Science Network (WOS) is more scientific research papers, and the EI data platform includes engineering application publications based on summarizing previous studies, this paper searches the two data platforms of WOS and EI to provide a more comprehensive information. Therefore, this paper conducts a bibliometric analysis on 564 selected publications, quantifies the literature performance, and analyzes highly cited literature by using the data analysis function of WOS and EI databases. Meanwhile, in the knowledge map in the visual software of VOSviewer, CiteSpace, and Excel, the knowledge transformation is carried out on the data involved, the knowledge composition and development trend in this field is clarified, the potential research hotspots are explored, and the development direction of future technology is predicted (Govender et al., 2007; O’Grady et al., 2021). And the technical system of hyperspectral remote sensing water quality monitoring is systematically summarized from four subfields (scene, data source, parameter, and algorithm). In the end, the paper discusses the Frontier technologies such as miniaturization, intellectualization, and interdisciplinary application potential of the instrument for reference by production and scientific research institutions.
2 Data sources and methods
2.1 Data collation
The full name of WOS is Web of Science, which is Clarivate’s product (formerly Thomson Reuters intellectual property and Technology). WOS includes three famous Citation Index Databases (SCI, SSCI, and A & HCI) and collects authoritative and influential journals in various disciplines. WOS, as a document retrieval tool due to its strict selection criteria and citation index mechanism, has also become one of the essential basic evaluation tools of bibliometrics and scientific metrology. WOS can retrieve relevant papers in various ways, such as keywords, authors, topics, DOI, etc. And it can enable authors or researchers to find the articles and data efficiently. EI is the citation abbreviation of the Engineering Index, a largescale comprehensive retrieval tool with the most extended history, and was founded by the American Federation of Engineers in 1884 (Palmer et al., 2015; Li et al., 2020). EI enjoys a high reputation worldwide in the academic, engineering, and information circles and is a critical retrieval tool commonly recognized by scientific and technological circles (Aasen et al., 2015). The content includes the research results of all engineering disciplines and engineering activities.
According to the statement of “TS = (hyperspectral AND water quality AND monitor)”, Retrieve relevant papers in the WOS and EI databases. The data source is set to “search in web of science core collection” in the WOS platform (Hilton et al., 2012). Then, select the citation index as “Editions: All”, select the document field as “Topic” and set the retrieval time as “Publication: All years (1994–2022)”. Six hundred thirtytwo records were retrieved from WOS. Select the retrieval time from “all years” to “till now”, and 404 records are extracted in the EI platform. Two hundred fiftyone publications are retrieved by the two databases simultaneously, and 221 publications are irrelevant. Finally, 564 practical items were obtained after selection.
2.2 Data collation
The bibliometric analysis aims to summarize a series of results by describing publications objectively, systematically, and quantitatively. It is generally divided into four steps: sampling, recording entries, cataloging, and metrics. The first three steps are to record the titles, author, keywords, publication time, main methods, quoted data, etc., of the publication through reasonable rules to form standardized data. Then, the metrics are realized to extract and analyze the hidden information in all publications, which can provide a direction for future research. The above work is more standardized and efficient with the support of software represented by VOSviewer and CiteSpace (Govender et al., 2007). VOSviewer is a free software based on Java developed by the Centre for Science and Technology Studies (CWTS) of Leiden University in the Netherlands in 2009 (Ben-Dor et al., 2002). It is mainly adapted to the mock examination undirected network analysis and focuses on the visualization of scientific knowledge. CiteSpace, known as “citation space”, is a citation visual analysis software that focuses on analyzing the potential knowledge contained in scientific analysis and is gradually developed under the background of scient metrics and data visualization (O’Grady et al., 2021). This paper analyzes the scientific research status and trend in the field of water quality hyperspectral monitoring from four aspects with the support of the above software. The research scheme includes word counting, concept classification, spatial analysis, and semantic intensity analysis.
3 Results
3.1 Statistics of documents publication time
It can be concluded that the water quality monitoring work based on hyperspectral technology is generally divided into three research stages according to the statistics of the number of publications and citation frequency in the last 30 years (Figure 1).
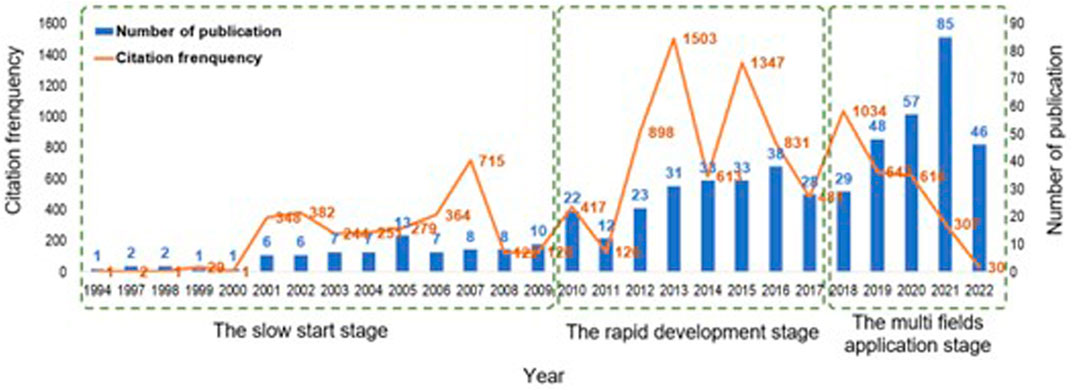
FIGURE 1. Time distribution of number of publication and citation frequency from 1994 to 2022.
3.1.1 The first stage is the slow start stage (1994–2009)
The satellite (Mueksch, 1994; Östlund et al., 2001; Duan et al., 2009) and airborne hyperspectral (Barducci and Pippi, 1997; Herut et al., 1999; Kallio et al., 2001) data are gradually applied from exploration experiments, which are used to the evaluation of nutrient elements in water, especially the calculation of chlorophyll concentration (Flink et al., 2001). It has attracted European scholars’ attention, particularly in assessing the eutrophication of water. The atmospheric correction algorithm suitable for water area is studied, and the concept of water leaving reflectivity is proposed in hyperspectral preprocessing (Salama and Monbaliu, 2002). The number of documents in this stage has increased from 12 to more than 5. The main reason is that the rapid development of airborne sensor technology has solved the difficulties of hyperspectral data sources (Barducci and Pippi, 1997). The number of citations reached 2,00,800, and the scope of research ranged from eutrophication monitoring (Jiao et al., 2006), hyperspectral data preprocessing (Kohler et al., 2004), and sensor development (Lee et al., 2011) to water quality inversion model realization (Song et al., 2005), and water quality monitoring (Kutser et al., 2006). New concepts, such as the combined use of hyperspectral and GIS technologies (Leuven et al., 2002) and the comprehensive monitoring of multiscale remote sensing data (Schmid et al., 2004), have been developed, especially after 2000. It has been further integrated with environmental science (Xie et al., 2006; Gong et al., 2008) and proposed the solution of coastal survey (Hlaing et al., 2010) and quantitative hyperspectral (Tong et al., 2010; Xiong et al., 2012) after 2007.
3.1.2 The second stage is rapid development (2011–2017)
The research focuses on three cores: environmental pollution monitoring, multisource data collaboration, and research on single water quality parameter extraction with the continuous maturity of sensor technology. Airborne and satellite hyperspectral remote sensing data can be used to provide accurate records of water quality changes in pollution monitoring, such as total nitrogen concentration inversion (Pan et al., 2011), water bloom warning (Song Y. et al., 2010), suspended matter concentration calculation (Shen et al., 2011), seawater intrusion (SONG et al., 2011), and organic matter calculation (Zhu and Yu, 2013). These publications generally take a river or lake as an example of numerical analysis and mapping and gradually introduce water quality hyperspectral technology into environmental pollution monitoring. It is generally concluded that hyperspectral technology can solve the water pollution problems of departments, but not all in the application process. Collaborative processing and comprehensive application of multiple sensors have become significant achievements in this research stage to improve data availability further. Satellite hyperspectral and water surface in situ data (Augusto-Silva et al., 2014; Keith et al., 2014), satellite hyperspectral and airborne hyperspectral (Ahmed et al., 2011), polarization technology and hyperspectral technology (Harmel et al., 2012), hyperspectral and thermal infrared data (Calderón et al., 2013), satellite hyperspectral and satellite multispectral data (Chang et al., 2014), hyperspectral technology and fluorescence technology (Chen et al., 2015), and other data collaborative processing research (Beck et al., 2016; Reuter et al., 2017), which makes more scholars in cross fields understand hyperspectral technology, and try to get more innovative results after the introduction. The number of published papers has increased to a certain extent at this stage, but the frequency of citations has increased significantly. The number of sources in 2013 and 2015 exceeded 1,300, reflecting the phenomenon of cross integration in this field. The third research focus is on the exploration of individual water quality indicators. A precise spectral mechanism and calculation algorithm are given for indicators such as total suspended solids (Haji Gholizadeh et al., 2016), total phosphorus (Stal et al., 2016), chromogenic dissolved organic matter (CDOM) (Chen et al., 2015), chlorophyll a (Hunter et al., 2010), water color (Watanabe et al., 2016), and water acidity (Qian et al., 2017). The research and development of small-scale special instruments (Piegari et al., 2011) have been enlightened, and relevant research has been gradually developed to verify the accuracy of individual indicators.
3.1.3 The third stage is the multi fields application stage (2018–2022)
The number of publications has increased steadily, from 48 in 2018 to 85 in 2021, and there is a high probability will exceed 100 in 2022. The research in the past 5 years has indicated two significant characteristics. Firstly, the data sources are more abundant, especially the rapid development of hyperspectral technology of UAV, which has dramatically reduced the application threshold of hyperspectral technology in the field of water quality monitoring; Secondly, machine learning algorithm has become the mainstream method to calculate water quality indicators. Hyperspectral data is integrated into the cloud, facilitating data acquisition and rapid calculation of results under this idea. The representative research results of the former include, the realization method of UAV hyperspectral push scan imager for ecological monitoring (Arroyo-Mora et al., 2019; Becker et al., 2019; Buters et al., 2019), the inversion of water quality parameters of typical river sections (LIN Jian-yuan et al.), water turbidity (Cao et al., 2018), algae pigments (Pyo et al., 2022), and cyanobacteria assessment (Moradinejad et al., 2019). UAV images in cities have been applied to the monitoring of black and odorous water (Huang and Zheng, 2019), transparency (Giardino et al., 2019), and water depth (Liu et al., 2020). The representative research achievements of the latter include the construction of several basic platforms, including the cloud network infrastructure (Mishra et al., 2018), the river system monitoring and early warning system (Esse et al., 2018), the shallow water color automatic observation system (Marcello et al., 2018), and the water quality of vulnerable inland ecosystems (Eugenio et al., 2019), which can monitor the global spread of harmful cyanobacterial blooms. In the calculation of chlorophyll concentration (Maier and Keller, 2019; Wang et al., 2020), total nitrogen concentration (Li et al., 2020), water quality parameters of urban rivers (Wei et al., 2019; 2020; Sarigai et al., 2021), river turbidity (Hong et al., 2021), and estimation of inactive inland water quality parameters (Niu et al., 2021) after integrating the machine learning algorithm.
3.2 Analysis of scientific research cooperation
Statistics on the number of books published by all countries can reflect the significant international cooperation countries in water quality hyperspectral research. The larger the circle, the greater the number of publications (Figure 2). Discharge the number of publications in a clockwise direction. The number of publications in 18 countries exceeded 8. The country with the largest international cooperation papers is China, with 157 publications. The following four countries are the United States (133), Germany (56), Italy (38), and the United Kingdom (33). According to the 2021 China Water Resources Bulletin, the total amount of water resources in China in 2021 was 2963.82 billion cubic meters. As stated by the US Environmental Protection Agency, the United States has approximately 300,000 freshwater lakes, 5,200 rivers, and thousands of miles of coastline. Germany has abundant groundwater and surface water resources, most of which are used for water supply and agricultural irrigation. Italy has abundant freshwater resources, including about 61,000 km of rivers, lakes, and groundwater reserves. According to the UK Environment Agency, the UK has some large reservoirs and water supply systems to meet the country’s water demand, as well as many small rivers and lakes. China and the United States have coauthored publications with most countries, representing the highest level in water quality hyperspectral research. One notable feature is that these two countries are the first to conduct relevant research. The results of other countries are delayed for about 2 years compared with China and the United States. The support for new technologies and the spirit of exploring new fields are the main reasons for the two countries’ outstanding development in this field.
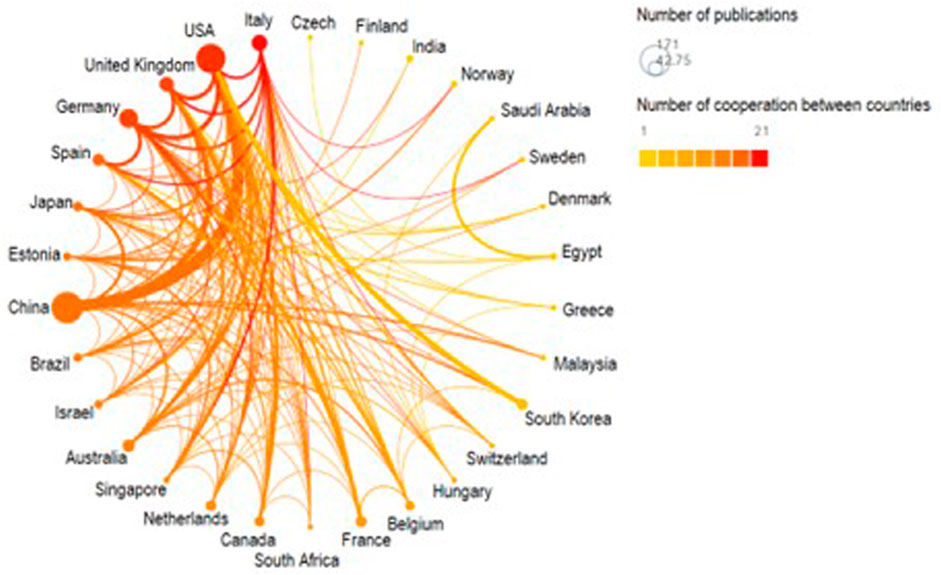
FIGURE 2. National cooperation network knowledge graph.
3.3 Keyword analysis
Drawing the frequency diagram of keywords and calculating their occurrence times after counting the keywords of all publications (Figure 3). It is worth noting that this is a “cloud words picture”, which is a visual highlight of the key words that appear frequently in the paper. The more they appear, the larger the font is displayed, the more prominent the keyword is. The color here is only used to distinguish from adjacent words, and has no representational meaning. The distribution of words is random and has no direct relationship with the geographical location of the response. The main research points and technologies of hyperspectral water quality monitoring can be obtained from the keywords (Table 1). The application scenario of hyperspectral technology for water quality monitoring, the organization format of hyperspectral data, the target of water quality monitoring, and the main algorithm ideas can be learned according to the top 20 words that appear most frequently. Firstly, the keywords “Water”, “Quality”, “Waters”, “Lake”, “Coastal” and “Inland” indicate that the application scenario of hyperspectral technology has covered the main water types on the Earth’s surface, including lakes, oceans, and rivers. The scholars designed the technical process of each field and drew valuable conclusions according to the needs of the application. Secondly, the keywords such as “Reflection”, “Hyperspectral”, “Remote”, “Imagery”, “Optical”, “Spectral”, “Data” indicate that as passive remote sensing technology, the image data format is mainly used in water quality monitoring application. Image data is acquired primarily through the spectrometer mounted on three platforms, such as satellite, airborne or UAV. In addition, the spectral range is visible to nearinfrared, which is the response band of the main substances in the water (Zhang D. et al., 2021). Thirdly, the keywords “Chlorophyll”, “Matter”, “Content”, “Blooms”, and “Color” indicate the material information that has been proved can be accurately extracted by hyperspectral technology repeatedly. Chlorophyll content has been widely studied as the most common substance in water. The study of water bloom and color, closely related to chlorophyll concentration, has also indirectly become a research hotspot (Song K. et al., 2010). The former mainly focuses on the distribution law in natural waters, while the latter focuses on urban malodorous black river water research. In addition, the research on total nitrogen, total phosphorus, ammonia nitrogen, and other substances has also yielded many results that can be popularized. Fourthly, the keywords “model” and “retrieval” indicate that the algorithm of hyperspectral technology is still based on inversion technology. Largearea information extraction combines limited in-situ data and spectral data to establish a correlation model has become a mainstream method (Wang et al., 2005). The machine learning algorithm has become the core of the new modeling algorithm and has received a lot of new research in this process.
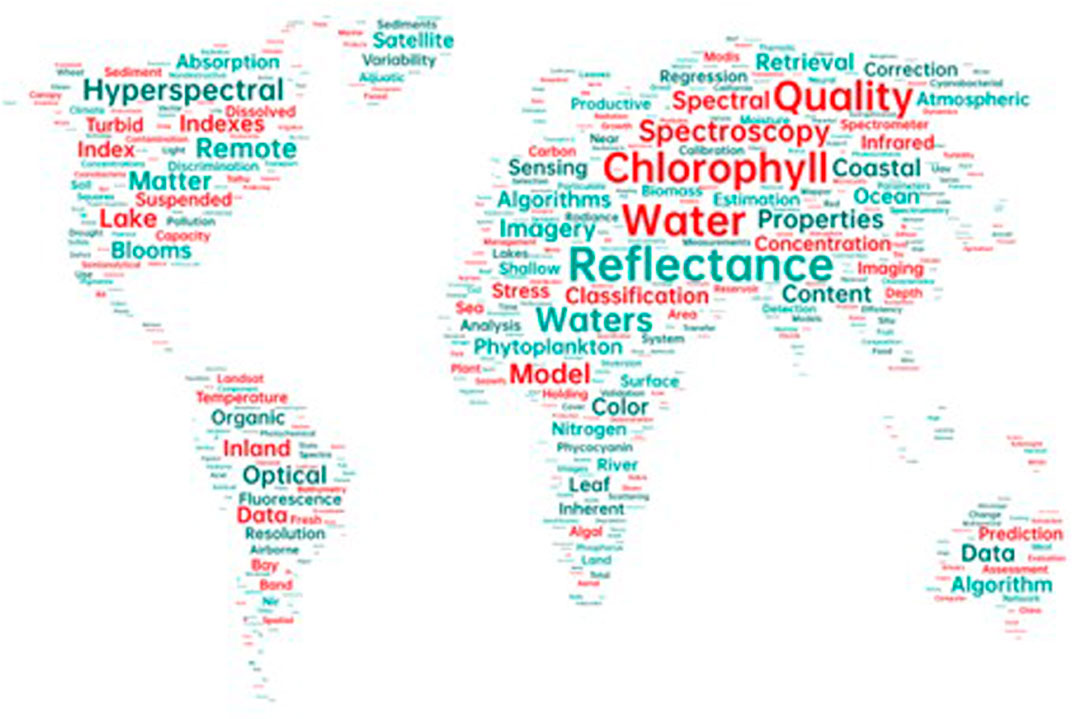
FIGURE 3. Frequency diagram of keywords.
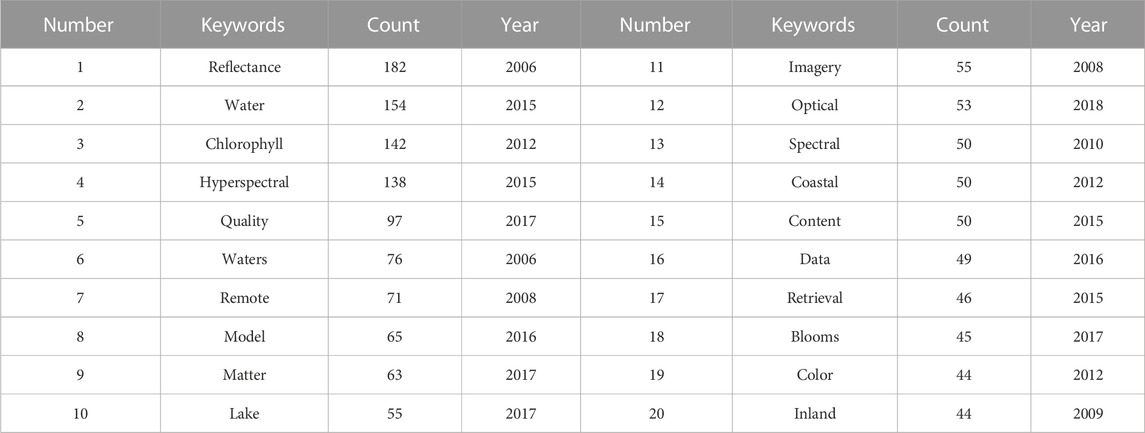
TABLE 1. Top 10 highfrequency keywords.
3.4 Analysis of Frontier trend
Draw a pennant plot with “water quality” as the goal, and infer the research trend according to the keywords (Figure 4). The idf value is an algorithm calculation result of tag words after clustering, which is used to infer mainstream research methods. The main contents of the literature are generated into cluster labels, and the research intensity of each research field is obtained after the weighted calculation. Usually, the idf is plotted after calculating the logarithm (Jianguang et al., 2005; Yan et al., 2005; Yan et al., 2006). Green, orange, and yellow in the figure, respectively, represent the most important keywords, the key keywords under study, and the trend distribution of follow-up studies taking idf value as the evaluation index. Keywords with higher idf values depend more on keywords with lower idf values. It can be obtained from the figure that spectral reflectance is one of the fundamental technologies for water quality monitoring, and subsequent research is developed based on the optical mechanism of water. It can be concluded from the orange area that the current research mainly focuses on specific application scenarios, including lakes, water colors, internal roads, and water bodies. The essential research difficulties are leaf green extraction, atmospheric correction, and inversion algorithm. The follow-up research trend shows an explosive state, with many keywords in the yellow area in the figure. In addition, some more complex issues have been paid attention to, including the research and development of optical instruments, the extraction of micro materials, the application of reservoirs, the application of UAV remote sensing, the development of fluorescence technology, and the research of numerical simulation technology (Lee et al., 2007). On the whole, the pennant plot shows the divergent research rules of water quality remote sensing monitoring from the spectroscopy principle to the application of different scenarios and then to the study of complex problems (Bresciani et al., 2017).
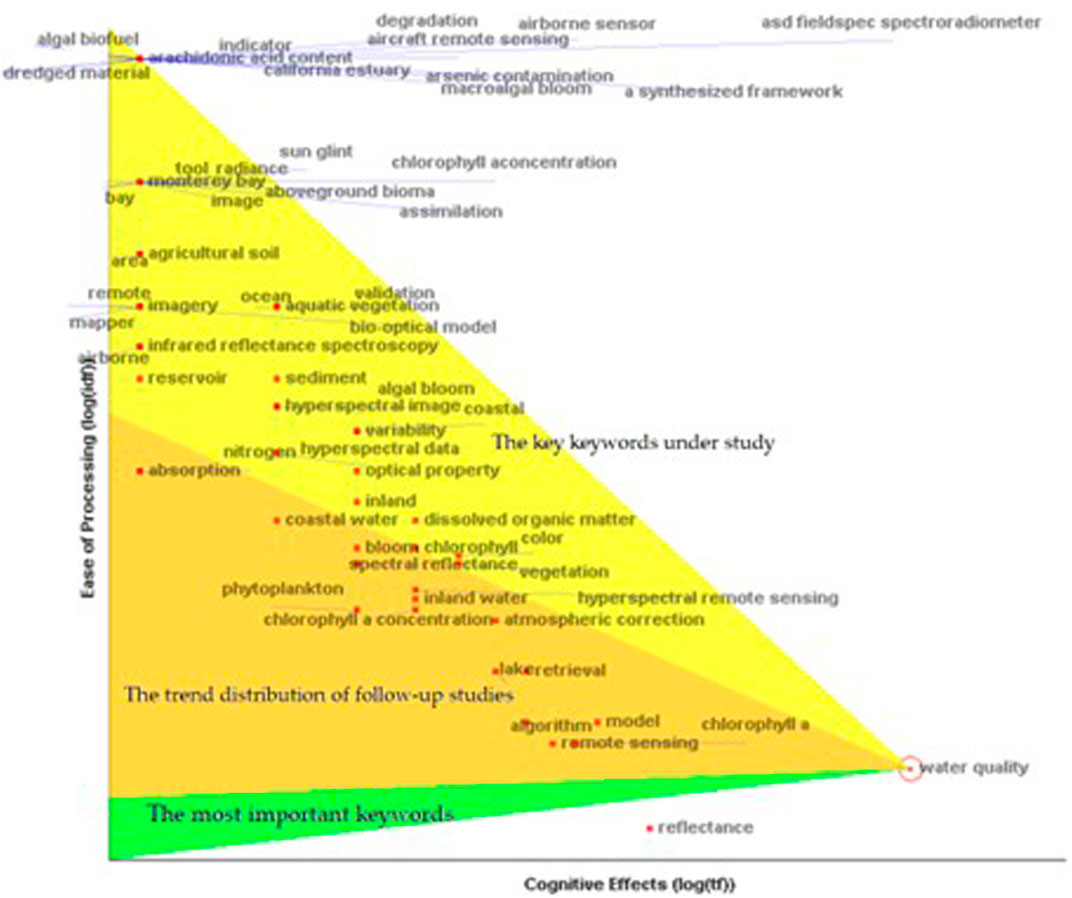
FIGURE 4. Analysis of pennant plot of water quality.
Burst chart can show the mutation law of keywords in the field of water quality hyperspectral monitoring (Table 2). The mutation represents the whole process that the research frequency of scholars began to increase over some time, and gradually tended to be stable and cool with time. The red line in the figure represents the rise and continuation of research. The results of calculating the top 24 keywords of the last 15 years indicate that.
(1) Data: Airborne sensors represented by CASI were the primary data acquisition form from 2009 to 2015 on the platform of hyperspectral sensors. Airborne sensors can obtain hyperspectral data of thousands of square kilometers within a few hours, making remarkable achievements in inland water and reservoir water quality monitoring. However, the high data acquisition costs limit this technology’s largescale promotion (Fenocchi et al., 2015). A large number of micro spectrometers have been studied from 2016 to 2019. Micro spectrometers have played a good role in monitoring cities’ odorous water bodies and coastal zones. Sensors mounted on UAVs can obtain hyperspectral data flexibly and at a low cost, becoming the most important data source with the promotion of UAV technology from 2019 to 2022.
(2) Algorithm: attention was paid to modeling spectral data and water quality parameters from 2010 to 2012. The traditional algorithm represented by the expression of the little square was studied from 2015 to 2020 to draw the thematic map of water pollution. Algorithms that can solve large data volumes have strong applicability and high computational efficiency and have become research hotspots with the increase of data volume and more and more hyperspectral water quality monitoring scenarios. The machine learning algorithm is undoubtedly the research hotspot in the last 3 years.
(3) Water quality parameters: people initially used hyperspectral technology to monitor water blooms due to the problem of water eutrophication from 2010 to 2012, and excellent application results were achieved. Subsequently, the research was transferred to calculating water quality parameters to obtain the total phosphorus, total nitrogen, and other parameters leading to water bloom (Villa et al., 2017). Therefore, the total nitrogen, turbidity, and suspended solids have been continuously emphasized from 2013 to 2020. As a result, a series of achievements have been made in applying inland water and ocean in this process. As a result, the research intensity of rivers closely related to human production and life, whether it is odorous water monitoring in cities or river pollution monitoring in rural areas, has been continuously enhanced in the last 3 years.
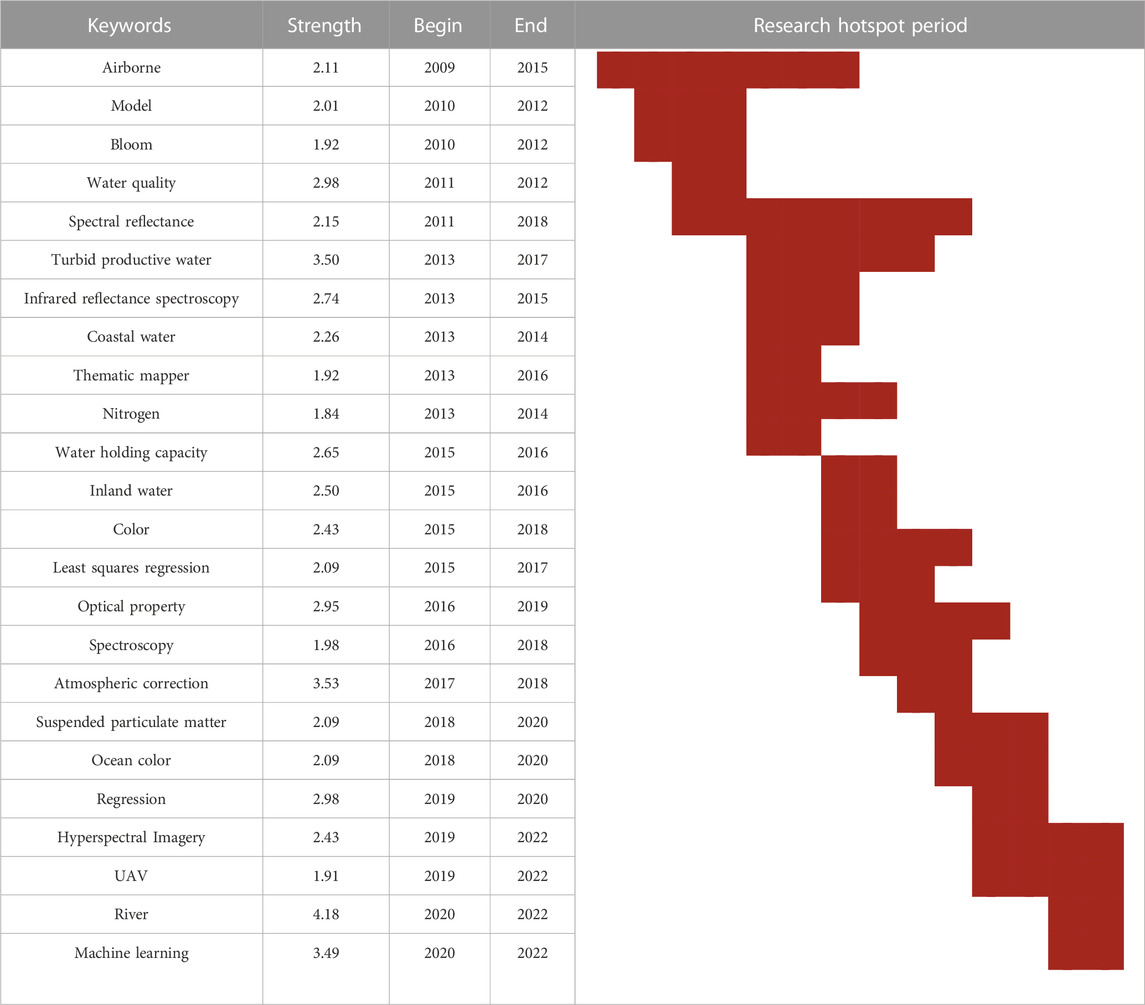
TABLE 2. Keywords mutation analysis.
4 Discussion
The core elements of hyperspectral water quality monitoring can be summarized into four points: scenarios, data sources, parameters, and algorithms. Each scholar tries to provide innovative solutions in four points. It can meet the application requirements through complex combinations. For example, excellent accuracy might be obtained by satellite, airborne or UAV platforms to calculate water quality parameters and select various algorithms in a fixed scenario (a reservoir). However, the error may be substantial with the same solution applied in lakes when monitoring urban water quality parameters, even if the data source, water, and algorithms are fixed. Magnanimous research needs to be researched to solve these problems, which is the difficulty of hyperspectral water quality monitoring and the significance of this work.
4.1 Monitoring scenarios
The main application scenarios can be classified as urban water, lake, natural river and ocean after the hyperspectral remote sensing technology is introduced into the water quality monitoring demand (Figure 5). The monitoring needs of urban water are concentrated on the assessment of reservoir water quality (Song K. et al., 2010), black-odor water management (Wei et al., 2019), sewage discharge monitoring (Pascucci et al., 2012), and flood warning (Lin et al., 2019). Hyperspectral data are acquired mainly by UAV and ground sensors, which meet the requirements of information extraction at the microscale. Lake’s monitoring needs are significantly different, and the study core is the chlorophyll evaluation (Katlane et al., 2020). In particular, a large number of studies have been carried out on the rapid identification of cyanobacteria outbreaks because the lake water body is close to the territory of human production and living, and the water flow is relatively poor, which is prone to water bloom (Pyo et al., 2021). The research on natural rivers is more complicated than in the previous two scenarios. The critical point of the study is how to make hyperspectral technology partially or entirely replace the traditional in-situ assay method (Hong et al., 2021). Although more than ten indicators are considered adequate, the leading indicators reported in academic publications are total phosphorus, total nitrogen, ammonia nitrogen, and dissolved organic matter. The most complex application scenario is the ocean. The water quality monitoring accuracy is insufficient only through hyperspectral technology due to the interference of salinity and sea waves. Lidar, fluorescence, and ultraviolet sensors are also introduced to realize the joint monitoring of multiple sensors (Gorkavyi et al., 2021). Good results have been achieved in monitoring seawater conductivity, water depth, and algae. Representative typical cases are listed in Table 3.
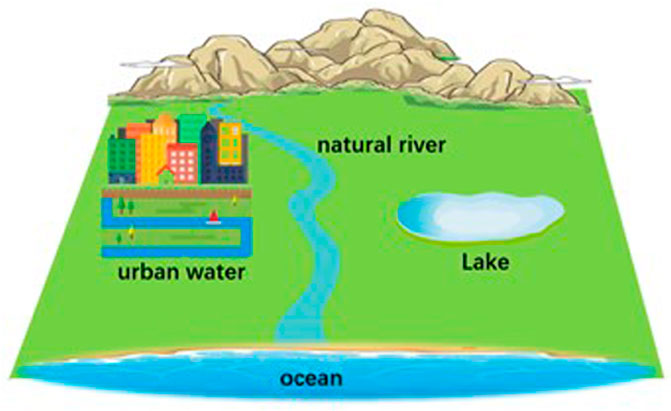
FIGURE 5. Main application scenarios of hyperspectral water quality monitoring.

TABLE 3. Typical cases of hyperspectral water quality monitoring scenarios.
4.2 Monitoring data sources
The hyperspectral sensors mentioned in the publication can be divided into three platforms: satellite, airborne, and UAV, according to statistics. Most of the higher-solution spectrometers are not specially designed for monitoring the water environment except for a few sensors. Spectral resolution refers to the ability of the sensor to distinguish different wavelengths, usually expressed in microns (μm). The main spectrum range is 0.401 μm and 0.402 μm, considering the application needs of vegetation, rock mining, and cities. All sensors covering a spectrum range of 0.400 μm can play a role in water quality monitoring since it is the main spectral response band of water quality parameters (Mielke et al., 2014). UAV hyperspectral sensors can usually reach the submeter level, and airborne sensors can get the meter level in spatial resolution. While the highest answer of hyperspectral satellite data is the OHS sensor of China Orbita company, which reaches 10 m. And the mainstream spatial resolution of other satellite sensors is 30 m, which is the result of balancing data transmission efficiency and monitoring effect. Various countries are actively launching new hyperspectral sensors, and there is a lot of research and development of sensors on multiple platforms. Therefore, the number of sensor classes is much more than those listed in Table 4.
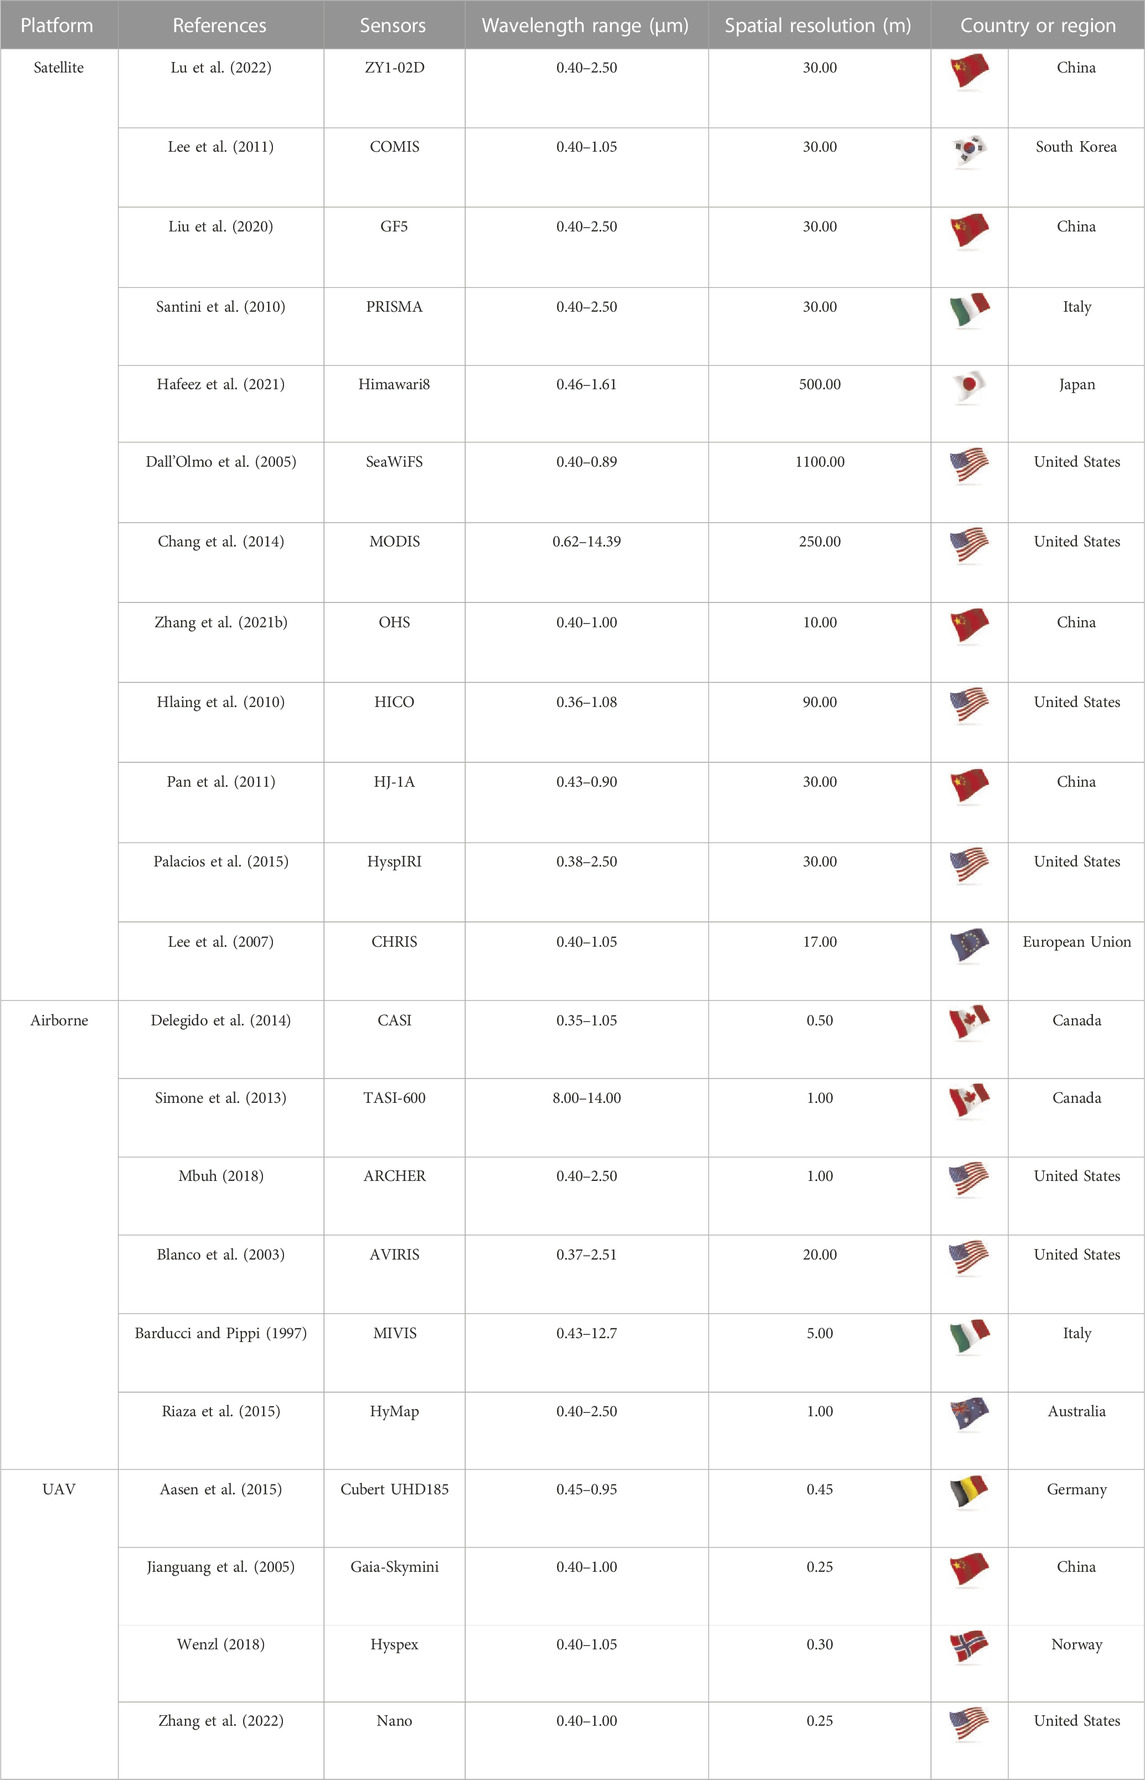
TABLE 4. Basic information of water quality hyperspectral monitoring sensors.
4.3 Monitoring parameters
Hyperspectral water quality monitoring parameters can be obtained by making statistics on the research objects of all publications and drawing thermodynamic maps. The more the color in the figure tends to be red, the higher the research concentration. Four clusters can be formed like “islands”, corresponding to the monitoring focus of different fields (Figure 6). Firstly, research about geometrical optics of water bodies. The research target generally has a significant characteristic spectrum based on the analysis of the optical mechanism of water, such as chlorophyll-a, phytoplankton, dissolved organic matter, CDOM, turbidity, segments, and water color. These indicators can significantly show different characteristics in the visible band with additional water content, so they have been studied extensively. Mature research technology, sufficient theoretical basis, and reliable conclusions are the characteristics of these studies. Secondly, research about water bloom outbreak monitoring. Focusing on monitoring cyanobacteria, phycocyanin, algal and suspended sectors, and the water quality changes in different seasons are focused. Multiperiod remote sensing data is generally used to identify the dynamic changes of water bloom in the water area. The rivers and lakes near the urban are the main areas of study. The transparency and water depth of the water area are evaluated. Thirdly, research about chemical parameters of water quality. It belongs to the quantitative analysis of water quality parameters. The indicators studied include carbon, fluorescence, organic matter, particulate matter, total phosphorus, biomass, vegetation indicators, pH, and temperature. The water-holding capacity of the water body is evaluated to guide the development of water quality based on the calculated content value. Fourthly, research about water quality evaluation and management. The water pollution investigation technology is studied under the premise of the first three explorations, including organic carbon, acid mine drainage, microplastics, and contamination. These pollutants have attracted worldwide attention, and hyperspectral technology is becoming one of the effective technologies (Table 5).
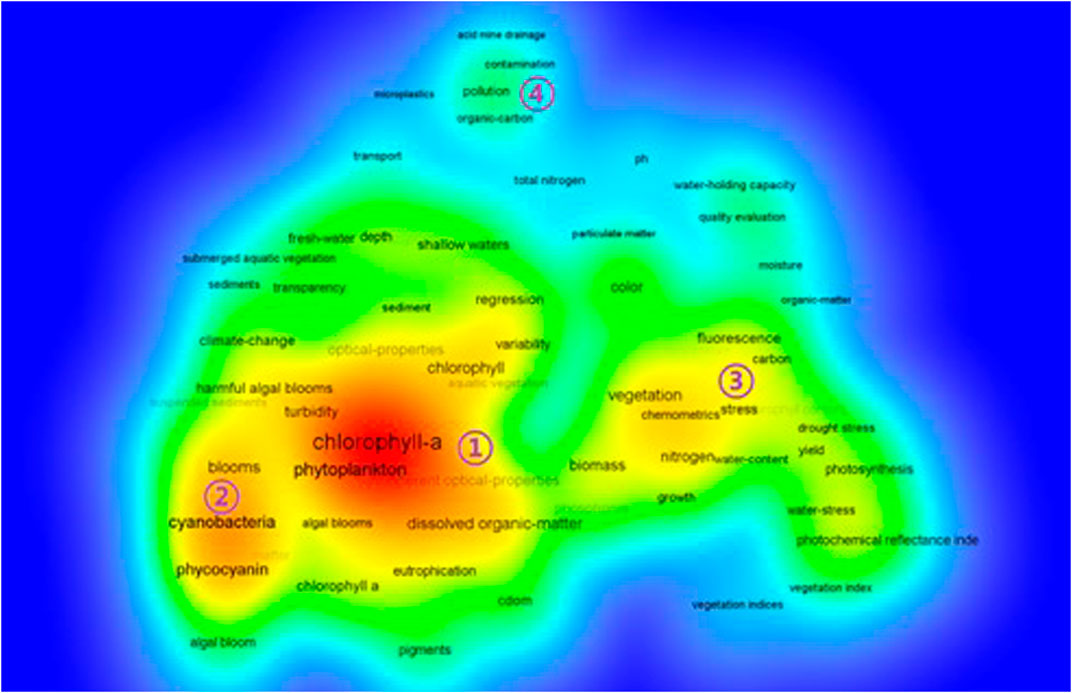
FIGURE 6. Thermodynamic diagram of parameters concerned in hyperspectral water quality monitoring.
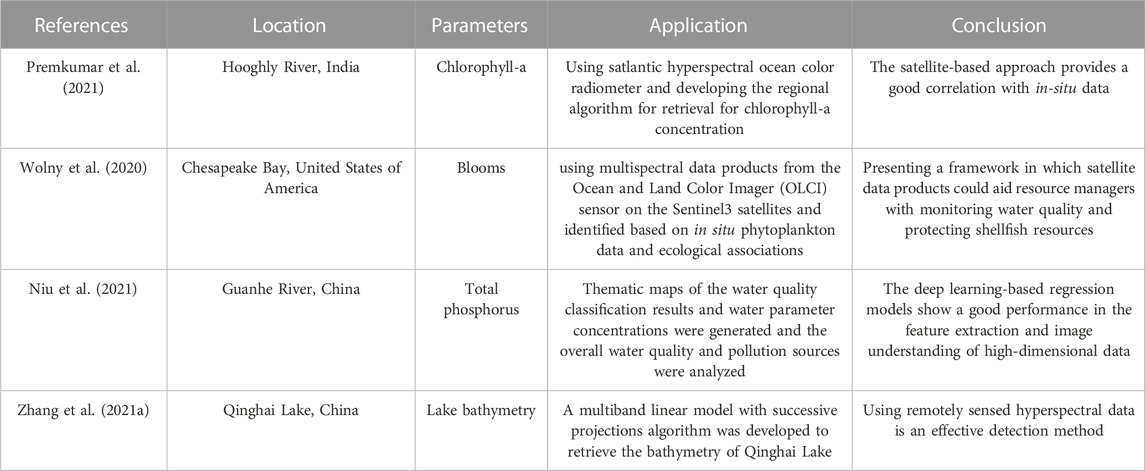
TABLE 5. Typical cases of hyperspectral water quality monitoring parameters.
4.4 Monitoring algorithms
The algorithms used in all publications are counted to obtain the most commonly used algorithms (Figure 7). The research generally requires a lot of preprocessing and pre-analysis of spectral data, “classification”, “atmospheric correction”, “spectral indexes” and “radial transfer” have appeared in abundant publications to illustrate this point. Cause accurate spectral identification and atmospheric correction can ensure the correctness of spectral data and provide data sets for water quality parameter modeling. After spectral preprocessing, the algorithms for calculating water quality parameters can be divided into regression and machine learning methods. The most commonly used regression methods are semiempirical models based on limited in-situ data. “Partial least squares”, “multiple linear regression”, “principal component analysis”, and “random forest” are all commonly used methods. The keywords that appear most frequently in machine learning methods include “neural network”, “artificial intelligence”, and “deep learning”. In recent years, machine learning is the most studied method. In addition, the terms of “calibration”, “visualization”, “prediction”, and “verification” also show that scholars attach importance to the accuracy of the algorithm (Table 6).
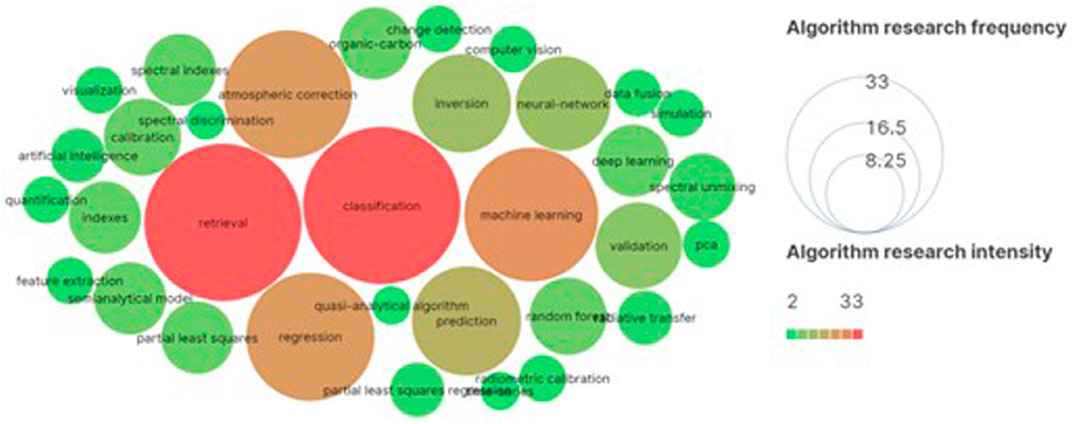
FIGURE 7. Frequency and intensity of algorithm research.
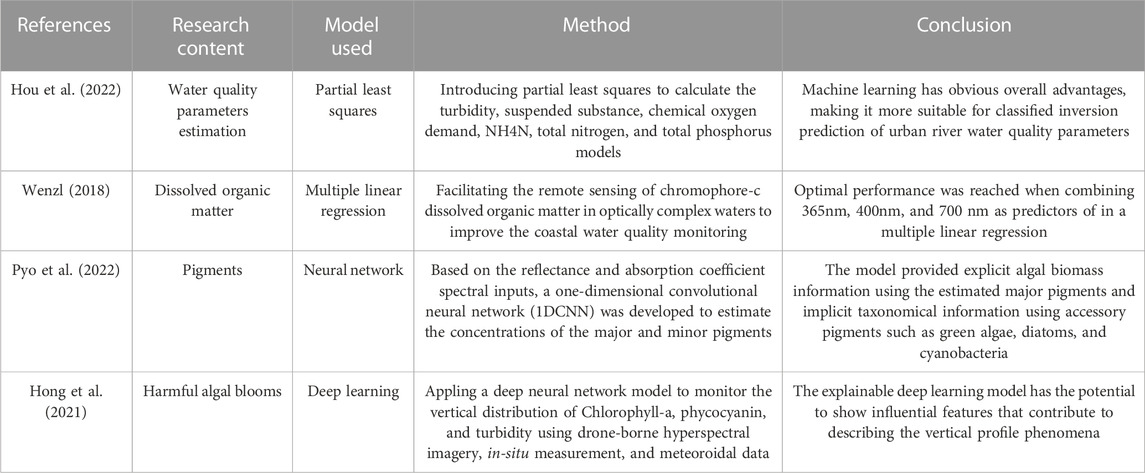
TABLE 6. Typical cases of hyperspectral water quality monitoring algorithms.
5 Conclusion
Spectrum refers to the pattern of dichroic light arranged according to the wavelength or frequency after being separated by the dispersion system (Tong et al., 2010; Wang et al., 2020). It can reflect the diagnostic absorption difference caused by the internal electronic transition and molecular vibration of matter, and it represents the intrinsic characteristics of objects. There were 4,852 satellites in orbit according to the USC (Union of concerned scientists) satellite database up to 30 March 2022. Three thousand one hundred thirty-four communication satellites (64%), 1,050 Earth observation satellites (21%), 411 technical experimental satellites (8%), 154 navigation and positioning satellites (3%), 124 Earth science satellites (2.5%), and 76 space observation satellites (1.5%) among them. Among the 1,050 Earth observation satellites, 32 are hyperspectral satellites, accounting for less than 4%. At present, the technical advantages have not been fully brought into play, and the application potential of hyperspectral satellites is huge (Xiong et al., 2012). There are two difficulties in the hyperspectral technology for water quality monitoring. Firstly, water’s material composition is complex, making it difficult to determine the transmission mechanism of spectral data. There are complex interaction processes such as superposition or subtraction among water quality parameters, and the interference of waves makes the extraction conclusions based on hyperspectral data lacking exact mechanism (Sarigai et al., 2021). This limits the model’s generalizability, making it challenging to form industrial technical standards. Secondly, traditional data processing and analysis techniques take weeks to reach a conclusion because hyperspectral data is a high-dimensional matrix with tremendous data volume, leading to the result that it cannot meet the real-time demand of water quality monitoring obviously (Rotkiske and Jr, 2018). Scholars have introduced machine learning algorithms, which can quickly calculate the water quality parameters concerned under the support of tag data, and have achieved initial success.
There are three development directions of hyperspectral technology for water quality monitoring under the guidance of difficulties. (1) the miniaturization of spectral instruments provides technical support for portable water quality monitoring. In 2015, Texas Instruments (TI) announced at Pittcon that it had added a new member to its near infrared (NIR) chipset product portfolio the industry’s first fully programmable micro electro mechanical system (MEMS) chipset, which supports ultraportable spectral analysis in the wavelength range of 700–2500 nm. In 2022, Shenzhen Hyper-Nano officially mass-produced the first generation of micro hyperspectral imaging MEMS chip, which is only one-thousandth of the volume of traditional products. There was a strong demand for miniaturization, portability, and onsite spectral instruments in the late last century to adapt to the global development situation, and the trend of miniaturization of spectral instruments has emerged. The research and development of miniaturized spectral instruments have become the focus of various countries’ scientific and technological departments and industrial departments. With the support of a microchip set, Tianjin Progoo Information Technology Co., Ltd. has developed a series of water quality monitoring hyperspectral products. The development of water quality monitoring technology urgently requires portable spectrometers for rapid onsite monitoring, which will obviously become the research and development focus of countries worldwide in the next few years. (2) Research on highly integrated technology of spectral technology and modern science. The achievements of modern science and technology in highly integrated device technology (such as chip technology), sensors, micro devices, and silicon technology are changing with each passing day. Modern information theory, mathematical processing methods, and computing software systems are also developing. These achievements will soon be absorbed into the continuous development process of new optical spectrum instruments. The spectrum instrument industry will continue to develop high-precision, multifunctional largescale spectrum analysis and detection instruments or corresponding systems to meet the analysis and detection requirements in modern aerospace, environmental and ecological protection, and global infectious disease control. More and more new practical spectrum instruments or systems that can work on the site, production lines, battlefields, unattended, and networked will appear, becoming online measurement and control. It is an indispensable analysis and detection means in environmental monitoring and other fields. The spectrum instrument must be out of the laboratory equipment, capable of withstanding the harsh working environment of the field and the area (including space) and the robust, chaotic, and changeable interference, unattended, long-term work away from the power grid, automatic monitoring, automatic adjustment of the best working state, and automatic network exchange of information. Therefore, largescale precision research and practical level spectrometers or systems for onsite and online measurement and control will be valued and significantly developed in the next 10 or 20 years. (3) The application of spectrum technology in water quality monitoring is a challenging broad band. In the future, the spectrum instrument will continue to develop in the direction of broadening and transferring the application area. It will expand from the traditional water quality indicator monitoring to the fields directly related to water safety, such as over-standard alarm, multi equipment linkage, water resource evaluation, pollution early warning and so on. The application of spectral water quality detection will be constantly updated under great development in many fields. The vast number of spectral analysis users will develop various new spectral analysis methods and put forward new application requirements and development requirements for new spectral instruments. We will be faced with an unprecedented situation of continuous development in which the spectral instrument industry continues to obtain new application results in all aspects of water quality monitoring. In brief, a more compact and stable instrument, coupled with a wide range of algorithms and more applications, will become the research trend in the future field of hyperspectral water quality monitoring.
Hyperspectral water quality monitoring is a technical process for measuring the types, concentrations, and changing trends of pollutants in water bodies to evaluate water quality. The monitoring scope includes natural water bodies at risk of pollution and having been polluted, as well as artificial water bodies discharged by industry, agriculture, and commerce (Fenocchi et al., 2015). Traditional water quality monitoring requires in-situ sampling, laboratory analysis, and rectification reports. The accuracy is guaranteed, but there are certain limitations, such as the event belongs to post-event monitoring, the spatial belongs to local monitoring, and the time belongs to cross-section monitoring (Mbuh, 2018). Modern hyperspectral technology can make up for these shortcomings partially. According to the research results in the past 30 years, it is indicated that the use of UAV technology to monitor the water quality of rivers has become a research hotspot through the analysis of all keywords, and the machine learning algorithm is the most concerning water quality parameter calculation method.
The research progress and trends in the four key subfields of hyperspectral water quality monitoring, including scene, data source, parameters, and algorithm, are sorted out on this basis. The difficulties encountered in each subfield and potential solutions are described and discussed. In conclusion, many studies have proved the method’s feasibility and reliability in hyperspectral water quality monitoring. As a result, it will become one of the mainstream technologies in the field of water quality monitoring with the continuous reduction of hardware cost and the constant iteration of the information extraction algorithm.
Author contributions
DZ: conceptualization, methodology, software, validation, formal analysis, investigation, data curation, writing original draft, and writing review and editing. XL, YH, LZ: conceptualization, methodology, validation, formal analysis, investigation, data curation, writing original draft, writing review, editing, project administration, and funding acquisition. ZZ, XS, ZL: Software, validation, formal analysis, investigation, and resources. WG: Methodology, software, resources, and editing, supervision, formal analysis, investigation, and data curation. All authors listed have made a substantial, direct, and intellectual contribution to the work and approved it for publication.
Funding
This research was funded by the National Natural Science Foundation of China (No. 41830108), the Innovation Team of XPCC’s Key Area (No. 2018CB004), Guangdong Yuehai Water Investment Co., Ltd. Multi Parameter Integrated Water Pollution Online Monitoring Technology and Demonstration Application Unveiling Project (No. JS-21-TJ-011), and the Major Projects of High-Resolution Earth Observation (No. 30-H30C01-9004-19/21).
Acknowledgments
We would like to thank the editors and reviewers for their valuable opinions and suggestions that improved this research.
Conflict of interest
DZ, YH, LZ, XS, and ZL were employed by the Tianjin Progoo Information Technology Co. Ltd. LZ was employed by the Xinjiang Production and Construction Corps. WG was employed by the Shenzhen Intelligence. Ally Technology Co. Ltd.
The remaining authors declare that the research was conducted in the absence of any commercial or financial relationships that could be construed as a potential conflict of interest.
Publisher’s note
All claims expressed in this article are solely those of the authors and do not necessarily represent those of their affiliated organizations, or those of the publisher, the editors and the reviewers. Any product that may be evaluated in this article, or claim that may be made by its manufacturer, is not guaranteed or endorsed by the publisher.
Supplementary material
The Supplementary Material for this article can be found online at: https://www.frontiersin.org/articles/10.3389/fenvs.2023.1133325/full#supplementary-material
References
Aasen, H., Burkart, A., Bolten, A., and Bareth, G. (2015). Generating 3D hyperspectral information with lightweight UAV snapshot cameras for vegetation monitoring: From camera calibration to quality assurance. ISPRS J. Photogrammetry Remote Sens. 108, 245–259. doi:10.1016/j.isprsjprs.2015.08.002
Ahmed, S., Harmel, T., Gilerson, A., Hlaing, S., Tonizzo, A., Davis, C., et al. (2011). “Hyperspectral and multispectral above-water radiometric measurements to monitor satellite data quality over coastal area,” in Ocean Sensing and Monitoring III (SPIE), 9–20. doi:10.1117/12.884674
Ahn, J. M., Kim, B., Jong, J., Nam, G., Park, L. J., Park, S., et al. (2021). Predicting cyanobacterial blooms using hyperspectral images in a regulated river. Sensors 21, 530. doi:10.3390/s21020530
Arabi, B., Salama, M. S., van der Wal, D., Pitarch, J., and Verhoef, W. (2020). The impact of sea bottom effects on the retrieval of water constituent concentrations from MERIS and OLCI images in shallow tidal waters supported by radiative transfer modeling. Remote Sens. Environ. 237, 111596. doi:10.1016/j.rse.2019.111596
Arroyo-Mora, J. P., Kalacska, M., Inamdar, D., Soffer, R., Lucanus, O., Gorman, J., et al. (2019). Implementation of a UAV–hyperspectral pushbroom imager for ecological monitoring. Drones 3, 12. doi:10.3390/drones3010012
Augusto-Silva, P. B., Ogashawara, I., Barbosa, C. C. F., De Carvalho, L. A. S., Jorge, D. S. F., Fornari, C. I., et al. (2014). Analysis of MERIS reflectance algorithms for estimating chlorophyll-a concentration in a Brazilian reservoir. Remote Sens. 6, 11689–11707. doi:10.3390/rs61211689
Barducci, A., and Pippi, I. (1997). “Environmental monitoring of the Venice lagoon using MIVIS data,” in IGARSS’97. 1997 IEEE International Geoscience and Remote Sensing Symposium Proceedings. Remote Sensing - A Scientific Vision for Sustainable Development, 888–890. doi:10.1109/IGARSS.1997.615288
Beck, R., Zhan, S., Liu, H., Tong, S., Yang, B., Xu, M., et al. (2016). Comparison of satellite reflectance algorithms for estimating chlorophyll-a in a temperate reservoir using coincident hyperspectral aircraft imagery and dense coincident surface observations. Remote Sens. Environ. 178, 15–30. doi:10.1016/j.rse.2016.03.002
Becker, R. H., Sayers, M., Dehm, D., Shuchman, R., Quintero, K., Bosse, K., et al. (2019). Unmanned aerial system based spectroradiometer for monitoring harmful algal blooms: A new paradigm in water quality monitoring. J. Gt. Lakes. Res. 45, 444–453. doi:10.1016/j.jglr.2019.03.006
Ben-Dor, E., Patkin, K., Banin, A., and Karnieli, A. (2002). Mapping of several soil properties using DAIS-7915 hyperspectral scanner data - a case study over clayey soils in Israel. Int. J. Remote Sens. 23, 1043–1062. doi:10.1080/01431160010006962
Blanco, A., Roper, W. E., and Gomez, R. B. (2003). “Surface-water quality assessment using hyperspectral imagery,” in Geo-Spatial and Temporal Image and Data Exploitation III (SPIE), 178–188. doi:10.1117/12.502418
Bresciani, M., Giardino, C., Lauceri, R., Matta, E., Cazzaniga, I., Pinardi, M., et al. (2017). Earth observation for monitoring and mapping of cyanobacteria blooms. Case studies on five Italian lakes. J. Limnol. 76. doi:10.4081/jlimnol.2016.1565
Buters, T. M., Bateman, P. W., Robinson, T., Belton, D., Dixon, K. W., and Cross, A. T. (2019). Methodological ambiguity and inconsistency constrain unmanned aerial vehicles as A silver bullet for monitoring ecological restoration. Remote Sens. 11, 1180. doi:10.3390/rs11101180
Calderón, R., Navas-Cortés, J. A., Lucena, C., and Zarco-Tejada, P. J. (2013). High-resolution airborne hyperspectral and thermal imagery for early detection of Verticillium wilt of olive using fluorescence, temperature and narrow-band spectral indices. Remote Sens. Environ. 139, 231–245. doi:10.1016/j.rse.2013.07.031
Cao, Y., Ye, Y., Zhao, H., Jiang, Y., Wang, H., Shang, Y., et al. (2018). Remote sensing of water quality based on HJ-1A HSI imagery with modified discrete binary particle swarm optimization-partial least squares (MDBPSO-PLS) in inland waters: A case in weishan lake. Ecol. Inf. 44, 21–32. doi:10.1016/j.ecoinf.2018.01.004
Chang, N.-B., Vannah, B., and Jeffrey Yang, Y. (2014). Comparative sensor fusion between hyperspectral and multispectral satellite sensors for monitoring microcystin distribution in lake erie. IEEE J. Sel. Top. Appl. Earth Observations Remote Sens. 7, 2426–2442. doi:10.1109/JSTARS.2014.2329913
Chen, P., Pan, D., Mao, Z., and Tao, B. (2015). Detection of water quality parameters in Hangzhou Bay using a portable laser fluorometer. Mar. Pollut. Bull. 93, 163–171. doi:10.1016/j.marpolbul.2015.01.023
Dall’Olmo, G., Gitelson, A. A., Rundquist, D. C., Leavitt, B., Barrow, T., and Holz, J. C. (2005). Assessing the potential of SeaWiFS and MODIS for estimating chlorophyll concentration in turbid productive waters using red and near-infrared bands. Remote Sens. Environ. 96, 176–187. doi:10.1016/j.rse.2005.02.007
Delegido, J., Van Wittenberghe, S., Verrelst, J., Ortiz, V., Veroustraete, F., Valcke, R., et al. (2014). Chlorophyll content mapping of urban vegetation in the city of Valencia based on the hyperspectral NAOC index. Ecol. Indic. 40, 34–42. doi:10.1016/j.ecolind.2014.01.002
Duan, H., Ma, R., Zhang, Y., and Zhang, B. (2009). Fluorescence peak shift corresponding to high chlorophyll concentrations in inland water. Spectrosc. Spectr. Analysis 29, 161–164. doi:10.3964/j.issn.1000-0593(2009)01-0161-04
Elsayed, S., Gad, M., Farouk, M., Saleh, A. H., Hussein, H., Elmetwalli, A. H., et al. (2021). Using optimized two and three-band spectral indices and multivariate models to assess some water quality indicators of qaroun lake in Egypt. Sustainability 13, 10408. doi:10.3390/su131810408
Esse, C., Fustos, I., González, K., Aguayo, C., Encina-Montoya, F., Figueroa, D., et al. (2018). Spectral characterization of didymosphenia geminata under laboratory conditions: Bases for a monitoring and early warning system in river systems of south central Chile. Manag. Biol. Invasions 9, 85–90. doi:10.3391/mbi.2018.9.2.02
Eugenio, F., Alfaro, M., Martin, J., and Marcello, J. (2019). “Multiplatform earth observation systems for the monitoring and conservation of vulnerable natural ecosystems,” in IGARSS 2019 - 2019 IEEE International Geoscience and Remote Sensing Symposium, 8230–8233. doi:10.1109/IGARSS.2019.8900425
Fenocchi, A., Pinardi, M., Sibilla, S., Giardino, C., Bartoli, M., and Bresciani, M. (2015). “Assessment of potential algal blooms in a shallow fluvial lake through hydrodynamic modelling and remote-sensed images,” in 18th International Workshop on Physical Processes in Natural Waters, Landau in der Pfalz, Germany.
Flink, P., Lindell, L. T., and Östlund, C. (2001). Statistical analysis of hyperspectral data from two Swedish lakes. Sci. Total Environ. 268, 155–169. doi:10.1016/S0048-9697(00)00686-0
Giardino, C., Brando, V. E., Gege, P., Pinnel, N., Hochberg, E., Knaeps, E., et al. (2019). Imaging spectrometry of inland and coastal waters: State of the art, achievements and perspectives. Surv. Geophys 40, 401–429. doi:10.1007/s10712-018-9476-0
Gong, S.-Q., Huang, J.-Z., Li, Y.-M., Lu, W.-N., Wang, H.-J., and Wang, G.-X. (2008). Preliminary exploring of hyperspectral remote sensing experiment for nitrogen and phosphorus in water. Guang Pu Xue Yu Guang Pu Fen Xi 28, 839–842.
Gorkavyi, N., Fasnacht, Z., Haffner, D., Marchenko, S., Joiner, J., and Vasilkov, A. (2021). Detection of anomalies in the UV–vis reflectances from the ozone monitoring instrument. Atmos. Meas. Tech. 14, 961–974. doi:10.5194/amt-14-961-2021
Govender, M., Chetty, K., and Bulcock, H. (2007). A review of hyperspectral remote sensing and its application in vegetation and water resource studies. Water sa. 33, 145–151. doi:10.4314/wsa.v33i2.49049
Gu, K., Zhang, Y., and Qiao, J. (2020). Random forest ensemble for river turbidity measurement from space remote sensing data. IEEE Trans. Instrum. Meas. 69, 9028–9036. doi:10.1109/TIM.2020.2998615
Guillaume, M., Minghelli, A., Deville, Y., Chami, M., Juste, L., Lenot, X., et al. (2020). Mapping benthic habitats by extending non-negative matrix factorization to address the water column and seabed adjacency effects. Remote Sens. 12, 2072. doi:10.3390/rs12132072
Hafeez, S., Wong, M. S., Abbas, S., and Jiang, G. (2021). Assessing the potential of geostationary himawari-8 for mapping surface total suspended solids and its diurnal changes. Remote Sens. 13, 336. doi:10.3390/rs13030336
Haji Gholizadeh, M., Melesse, A. M., and Reddi, L. (2016). Spaceborne and airborne sensors in water quality assessment. Int. J. Remote Sens. 37, 3143–3180. doi:10.1080/01431161.2016.1190477
Harmel, T., Gilerson, A., Tonizzo, A., Chowdhary, J., Weidemann, A., Arnone, R., et al. (2012). Polarization impacts on the water-leaving radiance retrieval from above-water radiometric measurements. Appl. Opt. AO 51, 8324–8340. doi:10.1364/AO.51.008324
Harringmeyer, J. P., Kaiser, K., Thompson, D. R., Gierach, M. M., Cash, C. L., and Fichot, C. G. (2021). Detection and sourcing of CDOM in urban coastal waters with UV-visible imaging spectroscopy. Front. Environ. Sci. 9. doi:10.3389/fenvs.2021.647966
Herut, B., Tibor, G., Yacobi, Y. Z., and Kress, N. (1999). Synoptic measurements of chlorophyll-a and suspended particulate matter in a transitional zone from polluted to clean seawater utilizing airborne remote sensing and ground measurements, haifa bay (SE mediterranean). Mar. Pollut. Bull. 38, 762–772. doi:10.1016/S0025-326X(99)00038-7
Hilton, F., Armante, R., August, T., Barnet, C., Bouchard, A., Camy-Peyret, C., et al. (2012). Hyperspectral earth observation from IASI: Five years of accomplishments. Bull. Am. Meteorological Soc. 93, 347–370. doi:10.1175/BAMS-D-11-00027.1
Hlaing, S., Harmel, T., Ibrahim, A., Ioannou, I., Tonizzo, A., Gilerson, A., et al. (2010). “Validation of ocean color satellite sensors using coastal observational platform in Long Island Sound,” in Remote Sensing of the Ocean, Sea Ice, and Large Water Regions 2010 (SPIE), 37–44. doi:10.1117/12.865123
Hong, S. M., Baek, S.-S., Yun, D., Kwon, Y.-H., Duan, H., Pyo, J., et al. (2021). Monitoring the vertical distribution of HABs using hyperspectral imagery and deep learning models. Sci. Total Environ. 794, 148592. doi:10.1016/j.scitotenv.2021.148592
Hou, Y., Zhang, A., Lv, R., Zhao, S., Ma, J., Zhang, H., et al. (2022). A study on water quality parameters estimation for urban rivers based on ground hyperspectral remote sensing technology. Environ. Sci. Pollut. Res. 29, 63640–63654. doi:10.1007/s11356-022-20293-z
Huang, Z., and Zheng, J. (2019). “Extraction of black and odorous water based on aerial hyperspectral CASI image,” in IGARSS 2019 - 2019 IEEE International Geoscience and Remote Sensing Symposium, 6907–6910. doi:10.1109/IGARSS.2019.8898314
Hunter, P. D., Tyler, A. N., Carvalho, L., Codd, G. A., and Maberly, S. C. (2010). Hyperspectral remote sensing of cyanobacterial pigments as indicators for cell populations and toxins in eutrophic lakes. Remote Sens. Environ. 114, 2705–2718. doi:10.1016/j.rse.2010.06.006
Jianguang, W., Qing, X., Qinhuo, L., and Yi, Z. (2005). “Extraction of chlorophyll-a concentration based on spectral unmixing model using field hyperspectral data in Taihu Lake,” in Proceedings. 2005 IEEE International Geoscience and Remote Sensing Symposium, 2005. IGARSS ’05, 5703–5705. doi:10.1109/IGARSS.2005.1526072
Jiao, H. B., Zha, Y., Gao, J., Li, Y. M., Wei, Y. C., and Huang, J. Z. (2006). Estimation of chlorophyll-a concentration in Lake Tai, China using in situ hyperspectral data. Int. J. Remote Sens. 27, 4267–4276. doi:10.1080/01431160600702434
Kallio, K., Kutser, T., Hannonen, T., Koponen, S., Pulliainen, J., Vepsäläinen, J., et al. (2001). Retrieval of water quality from airborne imaging spectrometry of various lake types in different seasons. Sci. Total Environ. 268, 59–77. doi:10.1016/S0048-9697(00)00685-9
Katlane, R., Dupouy, C., Berges, J. C., and Mannai, A. (2020). “Estimation of chlorophyll-A concentration in estuarine water of kneiss archipelago gulf of gabes using sentinel 2A and Eo1 data,” in 2020 Mediterranean and Middle-East Geoscience and Remote Sensing Symposium (M2GARSS), 180–183. doi:10.1109/M2GARSS47143.2020.9105257
Keith, D. J., Schaeffer, B. A., Lunetta, R. S., Gould, R. W., Rocha, K., and Cobb, D. J. (2014). Remote sensing of selected water-quality indicators with the hyperspectral imager for the coastal ocean (HICO) sensor. Int. J. Remote Sens. 35, 2927–2962. doi:10.1080/01431161.2014.894663
Kohler, D. D. R., Bissett, W. P., Steward, R. G., and Davis, C. O. (2004). New approach for the radiometric calibration of spectral imaging systems. Opt. Express, OE 12, 2463–2477. doi:10.1364/OPEX.12.002463
Kutser, T., Metsamaa, L., Strömbeck, N., and Vahtmäe, E. (2006). Monitoring cyanobacterial blooms by satellite remote sensing. Estuar. Coast. Shelf Sci. 67, 303–312. doi:10.1016/j.ecss.2005.11.024
Lee, J.-H., Jang, T.-S., Yang, H.-S., and Rhee, S.-W. (2008). Optical design of A compact imaging spectrometer for STSAT3. J. Opt. Soc. Korea, JOSK 12, 262–268. doi:10.3807/josk.2008.12.4.262
Lee, J. H., Kang, K. I., and Park, J. H. (2011). A very compact imaging spectrometer for the micro-satellite STSAT3. Int. J. Remote Sens. 32, 3935–3946. doi:10.1080/01431161003801328
Lee, J. H., Lee, C. W., Kang, K. I., Jang, T. S., Yang, H. S., Han, W., et al. (2007). “A compact imaging spectrometer (COMIS) for the microsatellite STSAT3,” in Sensors, Systems, and Next-Generation Satellites XI (SPIE), 333–340. doi:10.1117/12.747737
Leuven, R. S. E. W., Poudevigne, I., and Teeuw, R. M. (2002). Remote sensing and geographic information systems as emerging tools for riverine habitat and landscape evaluation: From concepts to models. Backhuys Publishers, 217–239.
Li, W., Dou, Z., Cui, L., Wang, R., Zhao, Z., Cui, S., et al. (2020). Suitability of hyperspectral data for monitoring nitrogen and phosphorus content in constructed wetlands. Remote Sens. Lett. 11, 495–504. doi:10.1080/2150704X.2020.1734247
Lin, J.-y., Zhang, C.-xing, and You, H.-jian (2019). Retrieval of water quality parameters of urban river network using hyperspectral date based on inherent optical parameters. Spectrosc. Spectr. Analysis 39, 3761–3768. doi:10.3964/j.issn.1000-0593(2019)12-3761-08
Liu, Y., Xiao, C., Li, J., Zhang, F., and Wang, S. (2020). Secchi disk depth estimation from China’s new generation of GF-5 hyperspectral observations using a semi-analytical scheme. Remote Sens. 12, 1849. doi:10.3390/rs12111849
Lu, L., Gong, Z., Liang, Y., and Liang, S. (2022). Retrieval of chlorophyll-a concentrations of class II water bodies of inland lakes and reservoirs based on ZY1-02d satellite hyperspectral data. Remote Sens. 14, 1842. doi:10.3390/rs14081842
Ma, S., Zhang, X., Huang, G., Xiong, Y., Lu, Y., Han, Y., et al. (2021). Inversion of ocean color constituents in the sea area around Dajin island based on CASI aerial hyperspectral data. Proc. SPIE 11763, 117637Z. doi:10.1117/12.2587496
Maier, P. M., and Keller, S. (2019). “Application of different simulated spectral data and machine learning to estimate the chlorophyll A concentration of several inland waters,” in 2019 10th Workshop on Hyperspectral Imaging and Signal Processing: Evolution in Remote Sensing (WHISPERS), 1–5. doi:10.1109/WHISPERS.2019.8921073
Marcello, J., Eugenio, F., Martín, J., and Marqués, F. (2018). Seabed mapping in coastal shallow waters using high resolution multispectral and hyperspectral imagery. Remote Sens. 10, 1208. doi:10.3390/rs10081208
Mbuh, M. J. (2018). Optimization of airborne real-time cueing hyperspectral enhanced reconnaissance (ARCHER) imagery, in situ data with chemometrics to evaluate nutrients in the shenandoah river, Virginia. Geocarto Int. 33, 1326–1349. doi:10.1080/10106049.2017.1343395
Mielke, C., Boesche, N. K., Rogass, C., Kaufmann, H., Gauert, C., and De Wit, M. (2014). Spaceborne mine waste mineralogy monitoring in south Africa, applications for modern push-broom missions: Hyperion/OLI and EnMAP/sentinel-2. Remote Sens. 6, 6790–6816. doi:10.3390/rs6086790
Mishra, D., Ramaswamy, L., Kumar, A., Bhandarkar, S., Kumar, V., and Narumalani, S. (2018). “A multi-cloud cyber infrastructure for monitoring global proliferation of cyanobacterial harmful algal blooms,” in IGARSS 2018 - 2018 IEEE International Geoscience and Remote Sensing Symposium, 9272–9275. doi:10.1109/IGARSS.2018.8519144
Moradinejad, S., Glover, C. M., Mailly, J., Seighalani, T. Z., Peldszus, S., Barbeau, B., et al. (2019). Using advanced spectroscopy and organic matter characterization to evaluate the impact of oxidation on cyanobacteria. Toxins 11, 278. doi:10.3390/toxins11050278
Mueksch, M. C. (1994). “Airborne hyperspectral algorithms to determine trophical and morphological status of lakes, rivers, and coastal waters,” in Algorithms for Multispectral and Hyperspectral Imagery (SPIE), 104–115. doi:10.1117/12.179771
Niu, C., Tan, K., Jia, X., and Wang, X. (2021). Deep learning based regression for optically inactive inland water quality parameter estimation using airborne hyperspectral imagery. Environ. Pollut. 286, 117534. doi:10.1016/j.envpol.2021.117534
O’Grady, J., Zhang, D., O’Connor, N., and Regan, F. (2021). A comprehensive review of catchment water quality monitoring using a tiered framework of integrated sensing technologies. Sci. Total Environ. 765, 142766. doi:10.1016/j.scitotenv.2020.142766
Östlund, C., Flink, P., Strömbeck, N., Pierson, D., and Lindell, T. (2001). Mapping of the water quality of lake erken, Sweden, from imaging spectrometry and landsat thematic mapper. Sci. Total Environ. 268, 139–154. doi:10.1016/S0048-9697(00)00683-5
Palacios, S. L., Kudela, R. M., Guild, L. S., Negrey, K. H., Torres-Perez, J., and Broughton, J. (2015). Remote sensing of phytoplankton functional types in the coastal ocean from the HyspIRI Preparatory Flight Campaign. Remote Sens. Environ. 167, 269–280. doi:10.1016/j.rse.2015.05.014
Palmer, S. C. J., Kutser, T., and Hunter, P. D. (2015). Remote sensing of inland waters: Challenges, progress and future directions. Remote Sens. Environ. 157, 1–8. doi:10.1016/j.rse.2014.09.021
Pan, B., Yi, W., Wang, X., Qin, H., Wang, J., and Qiao, Y. (2011). Inversion of the lake total nitrogen concentration by multiple regression kriging model based on hyperspectral data of HJ-1A. Guang pu xue yu guang pu fen xi = Guang pu 31, 1884–1888. doi:10.3964/j.issn.1000-0593(2011)07-1884-05
Pascucci, S., Belviso, C., Cavalli, R. M., Palombo, A., Pignatti, S., and Santini, F. (2012). Using imaging spectroscopy to map red mud dust waste: The Podgorica Aluminum Complex case study. Remote Sens. Environ. 123, 139–154. doi:10.1016/j.rse.2012.03.017
Piegari, A., Sytchkova, A., Bulir, J., Dami, M., Aroldi, G., and Harnisch, B. (2011). “Compact imaging spectrometer with visible-infrared variable filters for Earth and planet observation,” in Optical Complex Systems: OCS11 (SPIE), 320–327. doi:10.1117/12.897433
Premkumar, R., Venkatachalapathy, R., and Visweswaran, S. (2021). Bio-optical studies on chlorophyll-a concentration in Hooghly River, India. Mater. Today Proc. 47, 488–492. doi:10.1016/j.matpr.2021.05.034
Pyo, J., Cho, K. H., Kim, K., Baek, S.-S., Nam, G., and Park, S. (2021). Cyanobacteria cell prediction using interpretable deep learning model with observed, numerical, and sensing data assemblage. Water Res. 203, 117483. doi:10.1016/j.watres.2021.117483
Pyo, J., Hong, S. M., Jang, J., Park, S., Park, J., Noh, J. H., et al. (2022). Drone-borne sensing of major and accessory pigments in algae using deep learning modeling. GIScience Remote Sens. 59, 310–332. doi:10.1080/15481603.2022.2027120
Qian, S.-E., Bergeron, M., Djazovski, O., Maszkiewicz, M., Girard, R., Kappus, M., et al. (2017). “A spaceborne coastal and inland water color hyperspectral imager,” in 2017 IEEE International Geoscience and Remote Sensing Symposium (IGARSS), 447–450. doi:10.1109/IGARSS.2017.8126990
Reuter, M., Buchwitz, M., Schneising, O., Noël, S., Bovensmann, H., and Burrows, J. P. (2017). A fast atmospheric trace gas retrieval for hyperspectral instruments approximating multiple scattering—Part 2: Application to XCO2 retrievals from OCO-2. Remote Sens. 9, 1102. doi:10.3390/rs9111102
Riaza, A., Buzzi, J., García-Meléndez, E., Carrère, V., Sarmiento, A., and Müller, A. (2015). Monitoring acidic water in a polluted river with hyperspectral remote sensing (HyMap). Hydrological Sci. J. 60, 1064–1077. doi:10.1080/02626667.2014.899704
Rotkiske, T. A., and Jr, C. R. B. (2018). “Influence of bottom depths and bottom types on water surface reflectance,” in Remote Sensing of the Ocean, Sea Ice, Coastal Waters, and Large Water Regions 2018 (SPIE), 72–82. doi:10.1117/12.2515669
Salama, S., and Monbaliu, J. (2002). “Atmospheric correction algorithm for CHRIS images application to CASI,” in Imaging Spectrometry VIII (SPIE), 120–131. doi:10.1117/12.451618
Santini, F., Alberotanza, L., Cavalli, R. M., and Pignatti, S. (2010). A two-step optimization procedure for assessing water constituent concentrations by hyperspectral remote sensing techniques: An application to the highly turbid Venice lagoon waters. Remote Sens. Environ. 114, 887–898. doi:10.1016/j.rse.2009.12.001
Sarigai, Y. J., Zhou, A., Han, L., Li, Y., and Xie, Y. (2021). Monitoring urban black-odorous water by using hyperspectral data and machine learning. Environ. Pollut. 269, 116166. doi:10.1016/j.envpol.2020.116166
Schmid, T., Koch, M., and Gumuzzio, J. (2004). “Application of spectroscopial, hyperspectral and multispectral data to study wetlands in semi-arid environments (Central Spain),” in IGARSS 2004. 2004 IEEE International Geoscience and Remote Sensing Symposium, 1563–1564. doi:10.1109/IGARSS.2004.1370612
Seidel, M., Hutengs, C., Oertel, F., Schwefel, D., Jung, A., and Vohland, M. (2020). Underwater use of a hyperspectral camera to estimate optically active substances in the water column of freshwater lakes. Remote Sens. 12, 1745. doi:10.3390/rs12111745
Sharp, S. L., Forrest, A. L., Bouma-Gregson, K., Jin, Y., Cortés, A., and Schladow, S. G. (2021). Quantifying scales of spatial variability of cyanobacteria in a large, eutrophic lake using multiplatform remote sensing tools. Front. Environ. Sci. 9. doi:10.3389/fenvs.2021.612934
Shen, Q., Zhang, B., Li, J., Wu, Y., Wu, Y., Zhang, H., et al. (2011). “Retrieval total suspended substance concentration of Three Gorges based on CHRIS/PROBA remote sensing images,” in 2011 IEEE International Geoscience and Remote Sensing Symposium, 1736–1739. doi:10.1109/IGARSS.2011.6049454
Simone, P., Angelo, P., Nicola, P., Stefano, P., Federico, S., and Lorenzo, F. (2013). “Karst water resources detection through airborne thermal data: MIVIS and TASI-600 imagery,” in 2013 IEEE International Geoscience and Remote Sensing Symposium - IGARSS, 4550–4553. doi:10.1109/IGARSS.2013.6723848
Song, K., Dongmei, L., Liu, D., Wang, Z., Li, L., Zhang, B., et al. (2010). “Retrival of total suspended matter (TSM) using remotely sensed images in Shitoukoumen Reservior, Northeast China,” in 2010 IEEE International Geoscience and Remote Sensing Symposium, 405–408. doi:10.1109/IGARSS.2010.5652728
Song, K., Li, L., Li, S., Tedesco, L., Hall, B., and Li, L. (2012). Hyperspectral remote sensing of total phosphorus (TP) in three central Indiana water supply reservoirs. Water Air Soil Pollut. 223, 1481–1502. doi:10.1007/s11270-011-0959-6
Song, K., Zhang, B., Duan, H., and Wang, Z. (2005). “Establishing a ann model with in-situ hyperspectral data for estimation chlorophyll-a concentrations in Nanhu Lake of Changchun, China,” in Proceedings. 2005 IEEE International Geoscience and Remote Sensing Symposium, 2005. IGARSS ’05, 5343–5346. doi:10.1109/IGARSS.2005.1525944
Song, Y., Song, X., Guo, Q., and Tang, L. (2011). Remote sensing monitoring and pre-alarming of algal blooms in taihu lake. Spectrosc. Spectr. Analysis 31, 753–757. doi:10.3964/j.issn.1000-0593(2011)03-0753-05
Song, Y., Song, X., Jiang, H., Guo, Z., and Guo, Q. (2010). Quantitative remote sensing retrieval for algae in inland waters. Spectrosc. Spectr. Analysis 30, 1075–1079. doi:10.3964/j.issn.1000-0593(2010)04-1075-05
Stal, C., De Maeyer, P., De Schrijver, A., Paelinck, M., Goossens, R., and De Wulf, A. (2016). “Estimating grondwater nutrients using hyperspectral satellite imagery in the flemish meuse-valley,” in 2016 IEEE International Geoscience and Remote Sensing Symposium (IGARSS), 3114–3117. doi:10.1109/IGARSS.2016.7729805
Tong, X., Xie, H., Qiu, Y., Zhang, H., Song, L., Zhang, Y., et al. (2010). Quantitative monitoring of inland water using remote sensing of the upper reaches of the Huangpu River, China. Int. J. Remote Sens. 31, 2471–2492. doi:10.1080/01431160902994440
Villa, P., Pinardi, M., Tóth, V. R., Hunter, P. D., Bolpagni, R., and Bresciani, M. (2017). Remote sensing of macrophyte morphological traits: Implications for the management of shallow lakes. J. Limnol. 76. doi:10.4081/jlimnol.2017.1629
Wang, J., Shi, T., Yu, D., Teng, D., Ge, X., Zhang, Z., et al. (2020). Ensemble machine-learning-based framework for estimating total nitrogen concentration in water using drone-borne hyperspectral imagery of emergent plants: A case study in an arid oasis, NW China. Environ. Pollut. 266, 115412. doi:10.1016/j.envpol.2020.115412
Wang, S., Yan, F., Zhou, Y., Zhu, L., Wang, L., and Jiao, Y. (2005). “Water quality monitoring using hyperspectral remote sensing data in Taihu Lake China,” in Proceedings. 2005 IEEE International Geoscience and Remote Sensing Symposium, 2005. IGARSS ’05, 4553–4556. doi:10.1109/IGARSS.2005.1526679
Watanabe, S., Vincent, W. F., Reuter, J., Hook, S. J., and Schladow, S. G. (2016). A quantitative blueness index for oligotrophic waters: Application to Lake Tahoe, California–Nevada. Limnol. Oceanogr. Methods 14, 100–109. doi:10.1002/lom3.10074
Wei, L., Huang, C., Wang, Z., Wang, Z., Zhou, X., and Cao, L. (2019). Monitoring of urban black-odor water based on nemerow index and gradient boosting decision tree regression using UAV-borne hyperspectral imagery. Remote Sens. 11, 2402. doi:10.3390/rs11202402
Wei, L., Wang, Z., Huang, C., Zhang, Y., Wang, Z., Xia, H., et al. (2020). Transparency estimation of narrow rivers by UAV-borne hyperspectral remote sensing imagery. IEEE Access 8, 168137–168153. doi:10.1109/ACCESS.2020.3023690
Wenzl, M. (2018). Bathymetry estimates and bottom classification using hyperspectral data in the baltic sea. Available at: https://elib.dlr.de/126033/(Accessed December 28, 2022).
Wolny, J. L., Tomlinson, M. C., Schollaert Uz, S., Egerton, T. A., McKay, J. R., Meredith, A., et al. (2020). Current and future remote sensing of harmful algal blooms in the chesapeake bay to support the shellfish industry. Front. Mar. Sci. 7. doi:10.3389/fmars.2020.00337
Xie, H., Tong, X. H., Qiu, Y. L., Zhang, H. E., Zhao, J. F., Huan, X. I. E., et al. (2006). Monitoring model and temporal-spatial changes of dissolved oxygen based on remote sensing: A case study in huangpu river. Spectrosc. Spectr. Anal. 27, 1574–1579.
Xiong, Y. J., Qiu, G. Y., Chen, X. H., Tan, S. L., and Feng, H. X. (2012). “Hyperspectral characteristics of seawater intrusion in Pearl River Delta, China based on laboratory experiments,” in 2012 IEEE International Geoscience and Remote Sensing Symposium, 4825–4828. doi:10.1109/IGARSS.2012.6352533
Yan, F. L., Wang, S. X., Zhou, Y., Xiao, Q., and Jiao, Y. Q. (2006). Monitoring the water quality of taihu lake by using hyperion hyperspectral data. J. Infrared Millim. Waves 25, 460–464.
Yan, F., Wang, S., Zhou, Y., Zhu, L., Wang, L., and Jiao, Y. (2005). “Inherent optical properties and hyperspectral remote sensing in Taihu Lake China,” in Proceedings. 2005 IEEE International Geoscience and Remote Sensing Symposium, 2005. IGARSS ’05, 3579–3582. doi:10.1109/IGARSS.2005.1526621
Zhang, B., Zhang, H., Li, J.-S., Guo, W. S., Xia, S. L., Shi, Q., et al. (2009). On-flight calibration and atmospheric correction over city water for wide-field -of-view Hypersepctral Imager. Jt. Urban Remote Sens. Event 30, 1–5. doi:10.1109/URS.2009.5137556
Zhang, D., Guo, Q., Cao, L., Zhou, G., Zhang, G., and Zhan, J. (2021a). A multiband model with successive projections algorithm for bathymetry estimation based on remotely sensed hyperspectral data in qinghai lake. IEEE J. Sel. Top. Appl. Earth Observations Remote Sens. 14, 6871–6881. doi:10.1109/JSTARS.2021.3093624
Zhang, D., Zhang, L., Sun, X., Gao, Y., Lan, Z., Wang, Y., et al. (2022). A new method for calculating water quality parameters by integrating space–ground hyperspectral data and spectral-in situ assay data. Remote Sens. 14, 3652. doi:10.3390/rs14153652
Zhang, R., Zheng, Z., Liu, G., Du, C., Du, C., Lei, S., et al. (2021b). Simulation and assessment of the capabilities of Orbita hyperspectral (OHS) imagery for remotely monitoring chlorophyll-a in eutrophic plateau lakes. Remote Sens. 13, 2821. doi:10.3390/rs13142821
Keywords: hyperspectral remote sensing, water quality monitoring, knowledge graph analysis, VOSviewer, CiteSpace, Bibliometrics
Citation: Ma T, Zhang D, Li X, Huang Y, Zhang L, Zhu Z, Sun X, Lan Z and Guo W (2023) Hyperspectral remote sensing technology for water quality monitoring: knowledge graph analysis and Frontier trend. Front. Environ. Sci. 11:1133325. doi: 10.3389/fenvs.2023.1133325
Received: 28 December 2022; Accepted: 25 April 2023;
Published: 16 August 2023.
Edited by:
Min Luo, Zhejiang University, ChinaReviewed by:
Vahid Hadipour, K. N. Toosi University of Technology, IranKun Tan, East China Normal University, China
Copyright © 2023 Ma, Zhang, Li, Huang, Zhang, Zhu, Sun, Lan and Guo. This is an open-access article distributed under the terms of the Creative Commons Attribution License (CC BY). The use, distribution or reproduction in other forums is permitted, provided the original author(s) and the copyright owner(s) are credited and that the original publication in this journal is cited, in accordance with accepted academic practice. No use, distribution or reproduction is permitted which does not comply with these terms.
*Correspondence: Donghui Zhang, emhhbmdkb25naHVpQGFsdS5jZHV0LmVkdS5jbg==