 Hong Jiang
 Zhenhuan Chen
 Wencheng Zhao
 Fayao Wang
 Jing Xia
 Zhenyu Chen6
95% of researchers rate our articles as excellent or good
Learn more about the work of our research integrity team to safeguard the quality of each article we publish.
Find out more
ORIGINAL RESEARCH article
Front. Environ. Sci. , 03 April 2023
Sec. Environmental Economics and Management
Volume 11 - 2023 | https://doi.org/10.3389/fenvs.2023.1132294
This article is part of the Research Topic Low-Carbon Transformation for Sustainable Development View all 14 articles
Improving energy efficiency is an effective way to achieve carbon neutrality in the context of growing advocacy for a green economy in both academia and government. In this study, we analyzed the impact mechanism of the manufacturing agglomeration on total factor energy efficiency. Based on this work, we identified 30 provinces (autonomous regions and municipalities) in China using 2002 to 2017 panel data. We used the data envelopment analysis game cross-efficiency model to calculate the interprovincial current state of energy efficiency. We constructed a spatial Durbin model and used an adjacent space weight matrix, geographic distance weight matrix, and economic distance weight matrix to study the impact of manufacturing agglomeration on total factor energy efficiency. The results showed that under different spatial weights, the interprovincial total factor energy efficiency had a significant spatial dependence; under the three spatial weights, we identified a U-shaped relationship between manufacturing agglomeration and total factor energy efficiency. Industrial agglomeration had obvious spatial spillover effects on total factor energy efficiency, and the spillover effects under the weight of geographic distance were higher than other spatial weights. During the sample period, the direct, indirect, and total effects of the manufacturing industry had an impact on energy efficiency. It all had a negative number indicating that there was a crowding effect in manufacturing agglomeration, and it had an inhibitory effect on energy efficiency.
Achieving carbon neutrality is an important goal for governments to pursue economic development and environmental protection. Since the reform and opening up, China’s economy has continued to grow rapidly and has received world attention. Looking back on the history of China’s economic development, this rapid economic growth has been accompanied by an increase in the industrial agglomeration level, especially the manufacturing industry. The long-term growth pattern characterized by high energy dependence, however, has made China the world’s largest carbon emitter. A 20th National Congress of the Chinese government report emphasized that promoting economic and social green and low-carbon development is the key link to achieving high-quality development. The massive consumption of traditional fossil energy (coal, oil) is the primary source of carbon emissions. Improving energy efficiency has become an efficient way to alleviate the contradiction between economic growth and environmental constraints, and it is an inevitable choice for achieving sustainable economic development and carbon neutrality in China (Pu et al., 2022; Wang and Liang, 2022; Yu and Shi, 2022). The academic community, however, has not reached a consensus on how to improve energy efficiency. Many studies have shown that industrial agglomeration can have a profound external impact on economic growth through agglomeration effects. Krugman (1991) and Fujita et al. (2001) noted that industrial agglomeration has produced positive externalities to enterprises in the same areas through technology spillover and knowledge diffusion effects. Understanding whether the positive externalities of industrial agglomeration have a positive or negative impact on energy efficiency is an important issue in the current process of China’s economic development. From the perspective of industrial economic theory, and under the guidance of a market mechanism, industrial agglomeration with the goal of maximizing profits is conducive to promoting the optimal allocation of resources and economic growth. Under China’s fiscal decentralization system, however, local governments tend to provide high-quality policy support and services to enterprises within their jurisdictions to improve growth performance, thus forming policy rents. To obtain more policy rents, enterprises unite and form a superficial industrial agglomeration. This kind of industrial agglomeration formed in the pursuit of policy rent cannot produce technology spillover and sharing effects. On the contrary, this superficial industrial agglomeration easily leads to market segmentation, industry convergence, and distortion of resource allocation. Against this backdrop, in this study, we selected manufacturing industrial agglomeration as the starting point to explore whether the positive externalities of manufacturing industrial agglomeration have a positive or negative impact on energy efficiency. This is an important issue in the current process of China’s economic development.
By combining many previous studies, most scholars have attributed the key influencing factors of energy efficiency changes to technological progress. Technological progress promotes the improvement of energy efficiency in direct and indirect ways. An example of a direct effect is that, with the advancement of technology, the efficiency of equipment in the production department can be improved, thereby reducing the intensity of energy consumption. An example of an indirect effect is that, with the advancement of technology, the quality of the labor force and the level of science and technology in the whole society can be improved. As a result, the phenomenon of energy waste in the production process is effectively suppressed, and energy efficiency is improved (Einhorn, 1982; Anderson, 1995). Some scholars, however, believe that although technological progress can improve energy efficiency and promote economic growth in the short term, in the long term, rapid economic growth will bring about more energy consumption, which will offset the delayed savings brought by efficiency improvements. This results in a rebound effect of technological progress (Hu, 2014). Some scholars later studied the impact of industrial structure changes on energy efficiency. Denison (1967) and Maddison (1987) found that in accordance with the productivity level, energy factors transferred from low-level industries to high-level industries, and their utilization efficiency in the entire national economy was improved. This is also called a “structural dividend.” According to the basic idea of a “hypothesis,” the industrial structure acts on energy efficiency through externalities. A phenomenon closely related to industrial externalities is industrial agglomeration. Research on industrial agglomeration began in the 1990s (Kim, 1995), and externalities are considered to be an important cause of industrial agglomeration (Henderson, 1974). Marshall (1920) noted that the formation of industrial geographic agglomeration (agglomeration) is largely due to the external economy generated by agglomeration, that is, the creation of a skilled labor market, professional service-oriented intermediate industries, and technology spillovers. By analogy, energy is an input element, and its utilization efficiency is likely to be affected by the spillover of other companies’ energy use technology. Wang and Chen (2010) used empirical methods to verify the hypothesis that industrial agglomeration and the resulting externalities effectively improved total-factor energy efficiency and single-factor energy efficiency. Pan et al. (2017) found that industrial agglomeration significantly promoted the improvement of total factor energy efficiency and identified a stable inverted U-shaped relationship between the two. Liu et al. (2017) used a dynamic spatial panel model to analyze the impact of industrial agglomeration on energy efficiency and found that the agglomeration of producer services and the coaggregation of manufacturing and producer services were beneficial to the improvement of energy efficiency. Guo and sun. (2019) explored the impact of different types of industrial agglomeration on energy efficiency. The study found significant differences in the effects of different types of industrial agglomeration on energy efficiency. Shao et al. (2019) proved that economic agglomeration directly affected carbon emissions through its various positive externalities, and at the same time, it also has an indirect impact on carbon emissions through energy intensity. Carbon emissions and energy intensity had a significant “snowball” effect in the time dimension and also had a clear strategic competitive effect in the space dimension.
In addition, some recent studies also focused on the impact of industrial agglomeration on energy efficiency. Hou et al. (2022) took China’s provincial-level energy-intensive industries from 2004 to 2017 as the research object and used a multidimensional panel fixed-effect model to study the impact of industrial agglomeration on energy efficiency and its mechanism. According to the study, industrial agglomeration had a significant inverted U-shaped relationship with energy efficiency, and industrial agglomeration improved energy efficiency by increasing human capital and promoting investment in fixed assets. Utilizing data for China from 2006 to 2018, Sun and Guo (2022) used a variety of spatial Dubin models with near-neighbor weights to test the spillover effects of environmental regulation, industrial agglomeration, and integrated development on energy efficiency. They found that industrial agglomeration (specialization and diversification) effectively boosted the energy efficiency of China and its neighboring regions (geographical proximity and economic interaction). The spatial spillover effect of environmental regulation and industrial agglomeration on energy efficiency was not only caused by geographical proximity but was also the result of coordination between geographical proximity and economic interaction between regions. The integrated development of environmental regulation and specialized agglomeration inhibited the positive effect of specialization, whereas the integrated development of environmental regulation and diversified agglomeration had a stronger effect on promoting the improvement of energy efficiency. Liu et al. (2022) empirically studied the non-linear impact of spatial agglomeration on energy efficiency of enterprises and further tested its heterogeneity and mechanism based on panel data from the China Industrial Enterprise Database and the China Industrial Enterprise Pollutant Emission Database from 2003 to 2012. They found a significant U-shaped relationship between spatial agglomeration and enterprise energy efficiency, which suggested that enterprises made full use of the benefits introduced by spatial agglomeration.
In summary, domestic and foreign scholars have carried out a significant amount of research on the impact of industrial agglomeration on energy efficiency and have obtained valuable research results, which have established a solid theoretical foundation for this study. Some aspects, however, require further research. First, from the existing research, most of the total factor energy efficiency evaluation methods have been based on the data envelopment analysis (DEA) model. The DEA model, however, has a non-unique solution, and when the efficiency values of multiple decision-making units are less than 1, they can no longer be sorted. Additionally, in the process of calculating the efficiency value of the decision-making unit, the weight coefficient is often artificially enlarged, resulting in the false validity of a disadvantaged decision-making unit DEA in the mutual evaluation process. Second, in the process of quantitative analysis of energy efficiency influencing factors in the existing literature, the spatial spillover effect is often ignored. To account for the deficiencies of previous studies, in this study, we investigated breakthroughs in the following aspects: First, in the process of model construction, we considered the competitive relationship between decision-making units and adopted the DEA game cross-efficiency model to improve the scientific basis of the energy efficiency calculation and the results. Second, considering that the energy consumption demand of manufacturing is significantly higher than that in other industries, we constructed a spatial measurement model of energy-efficiency influencing factors and used the adjacent space weight matrix, geographic distance weight matrix, and economic distance weight matrix to spatially correlate an energy efficiency analysis. We constructed a spatial Durbin model to analyze the impact of manufacturing agglomeration on energy efficiency, and we identified direct effects and spillover effects. Third, although many studies have discussed the spatial spillover effects of industrial agglomeration on energy efficiency, we analyzed this issue from a non-linear perspective rather than from the linear perspective commonly used in previous studies to provide a more accurate basis for policymakers to formulate economic policies.
Under the long-term extensive economic growth mode, local governments often pay too much attention to gross domestic product (GDP) growth during their tenure, and ignore the long-term growth factors of sustainable economic development, resulting in rapid economic development in the short term with excessive resource consumption and serious environmental load. For the price, given the study of the impact of manufacturing agglomeration on energy efficiency, we referred to the Gowri et al. (2015) model and included first industrial agglomeration in the short-term production function of manufacturers, as follows:
where
Manufacturers need to pay interest to obtain capital to purchase machinery and equipment. Considering the sharing effect of infrastructure brought about by industrial agglomeration, in this study, we assumed that the remuneration
where
We calculated the first-order condition for maximizing the manufacturer’s profit according to formula (2):
Then, the optimal capital stock in equilibrium is as follows:
The optimal energy efficiency investment is as follows:
Further analysis of the relationship between energy efficiency and industrial agglomeration and interest rates shows the following:
According to an analysis of Eq. 6, when
As stated, industrial agglomeration with the goal of maximizing profits can achieve optimal allocation under the regulation of a pure market mechanism, promote economic growth, and improve energy efficiency. Under the system of fiscal decentralization, the alienation of local government goals has led to the emergence of differentiated policy rents (credits, subsidies, tax reductions), which are aimed at protecting local interests and intervening in corporate investment behavior, in turn inducing the pursuit of policy rents. An “industrial cluster” indicates areas where enterprises connect. Qian et al. (2019) found that the phenomenon of enterprise clustering driven by policy rents not only failed to produce technology spillovers and sharing effects but also caused repeated construction, convergence of industrial structure, and distortion of resource allocation because of market segmentation.
Although industrial agglomeration affects the energy efficiency of the region, it can also produce positive or negative externalities as well as spillover effects on neighboring and other regions. In this study, we analyzed these effects from the perspectives of external economies of scale and external economies of scope. First, external economies of scale may improve energy efficiency and also may increase environmental load and inhibit energy efficiency. Conversely, high-industry agglomeration and high-quality development areas can play a demonstrative role in promoting the spread of advanced energy-saving technologies among regions, thereby driving the improvement of energy-saving technologies in neighboring areas and improving overall energy efficiency. Additionally, the positive industrial agglomeration externalities can attract more foreign investors, intensify market competition in the region, and force companies to accelerate innovation in energy utilization technologies to maintain their competitive advantage, thereby bringing about improvements in energy efficiency. The wealth demonstration effect caused by industrial agglomeration, however, also may lead to the occurrence of enterprise clustering and industrial homogeneity, leading to the crowding effect (Wang and Qiu, 2017). This crowding, in turn, can trigger vicious competition and inhibit the improvement of energy efficiency. Second, external economies of scope may improve energy efficiency and also may inhibit energy efficiency in neighboring or other regions. Industrial agglomeration has brought about an increase in the number of enterprises. To realize the positive externalities of agglomeration, enterprises have established a “forward association” and “backward association” among enterprises. This vertical association has improved the division of labor and specialization among enterprises within the region and also has improved the quality and energy efficiency of the value chain in the region. At the same time, to obtain external economies of scope, companies have established a collaboration and division of labor relations with surrounding areas, forming close forward and backward relationships, improving the quality and efficiency of the value chain between different regions, and ultimately achieving energy efficiency. Of course, industrial agglomeration also may trigger a “race to the bottom” (Esty and Dua, 1997), inhibiting the improvement of energy efficiency. Areas with a higher level of economic development will inevitably eliminate low-efficiency and high-emission enterprises in the initial stage of agglomeration as the industrial agglomeration becomes more mature, whereas neighboring or other areas with a lower level of economic development will promote the spillover effect of industrial agglomeration. Economic development will lower the threshold of environmental regulation and absorb low-end industries eliminated from areas with higher economic development levels, resulting in increased environmental pollution and reduced energy efficiency, as shown in Figure 1.
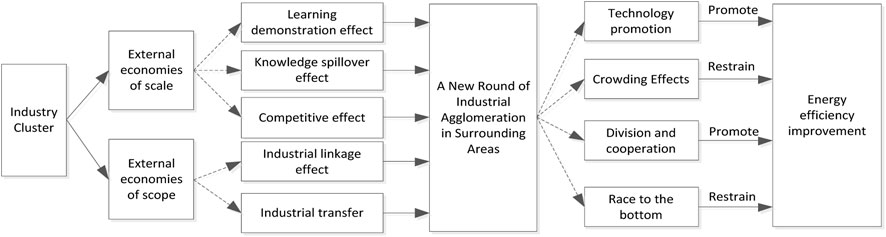
FIGURE 1. The path map of the impact of industrial agglomeration on energy efficiency.
To investigate manufacturing agglomeration spatial spillover effects of all factors of energy efficiency, we built a spatial panel data model to test the relationship between the two. Given that the spatial Durbin model contains spatial lag terms of both independent and dependent variables, it can reflect the influence of spatial autocorrelation on regression results more comprehensively. Therefore, we selected this model to test the relationship between industrial agglomeration and total factor energy efficiency. The model is set as follows:
where
If there is a spatial lag term, the regression coefficient cannot reflect the true influence between the variables, resulting in deviation. To overcome the impact of space lag, in this study, we referred to the research results of Lesage and Pace (2009) and decomposed the impact of energy efficiency into overall effects, direct effects, and indirect effects. The overall effect reflected the average influence of the independent variable on the dependent variables in all regions; the direct effect reflected the average influence of the independent variable on the dependent variable in the region; the indirect effect reflected the average influence of the independent variable in the region on the dependent variable in other regions. To this end, we transformed the spatial Doberman model into the following:
The overall effect is the mean value of all elements in the matrix, which is expressed as follows:
The direct effect is the mean value of the diagonal elements in the matrix, which is expressed as follows:
The indirect effect is the mean value of the off-diagonal elements in the matrix, that is, the difference between the overall effect and the direct effect, which is expressed as follows:
The DEA method is a non-parametric method often used in efficiency estimation, which can solve the problem of relative efficiency evaluation of multiple inputs and outputs. Traditional DEA methods, however, fail to consider the unexpected outputs—that is, when the output index values are all positive (Chen et al., 2021). In this study, based on the DEA game crossover efficiency model proposed by Liang et al. (2008), we incorporated carbon emission into the energy efficiency evaluation model as a non-desirable output. If the energy efficiency value of the decision-making unit
where
where
Based on this analysis, we used the following steps to solve the regional energy efficiency value based on game intersection under the carbon emission constraint.
Step 1:. Let
Step 2:. Calculate Eq. 16 to solve the optimal weight. Let
Step 3:. If there is a decision-making unit
At present, research on industrial agglomeration has been abundant, and the selection of indicators for industrial agglomeration also is different. Given the degree of the manufacturing industry’s impact on energy efficiency, this study draws on the practice of Tang et al. (2018) and uses the location entropy method to calculate the following:
where
The level of technological progress (
The data used for these variables are all from the “China Statistical Yearbook” (2003–2018), “Statistical Yearbook of Provinces and Municipalities” (2003–2018), “China Environmental Statistical Yearbook” (2003–2018), “China Population and Employment Statistical Yearbook” (2003–2018), and “China Energy Statistical Yearbook” (2003–2018).
In this study, we used Moran’s I index to test the spatial correlation of total factor energy efficiency from the global spatial level. Moran’s I index is used to estimate the similarity of total factor energy efficiency observations in spatially adjacent area units, which can reveal whether there is a spatial agglomeration trend in total factor energy efficiency (Chen et al., 2021). The results are given in Table 1.
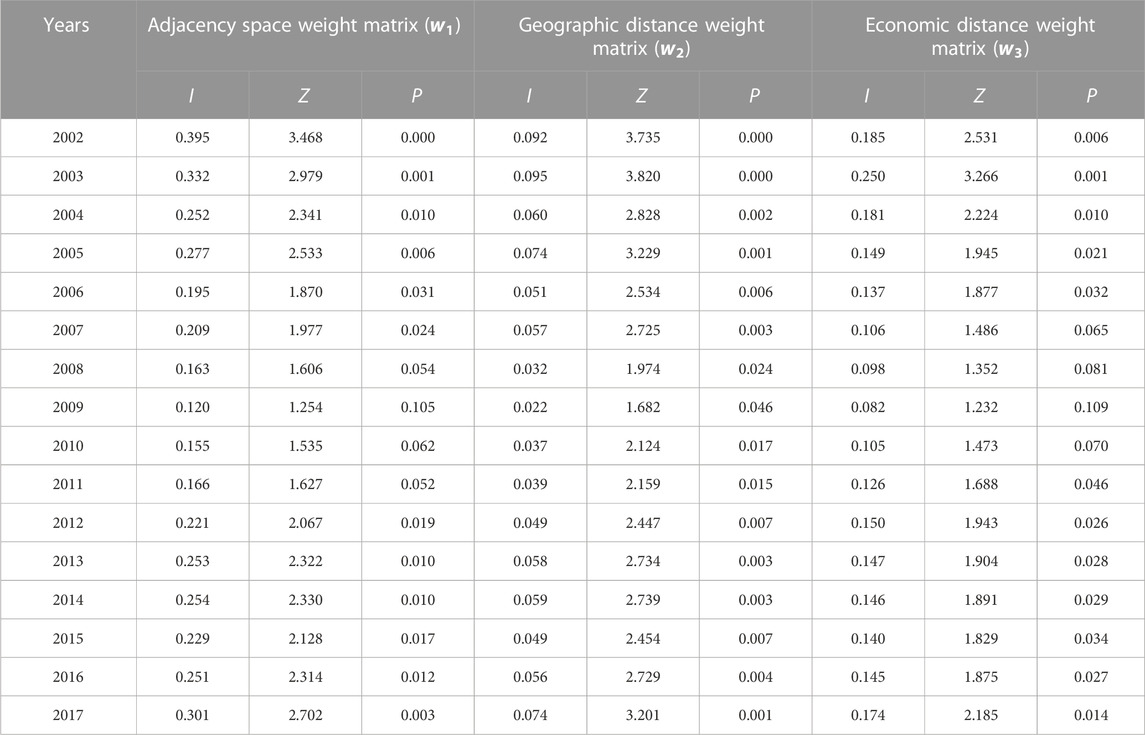
TABLE 1. Chinese interprovincial energy efficiency Moran’s I inspection, 2002–2017.
From the results in Table 1, we calculated the p-values of the Moran index test based on the three spatial weight matrices, except for the critical value of 0.5 in 2009, which significantly rejected the null hypothesis of “no spatial autocorrelation” in other years. China had a significant spatial autocorrelation in interprovincial energy efficiency. At the same time, it was apparent that the index of the spatial weight matrix of economic distance Moran’s I was greater than the spatial weight matrix of geographic distance. This result indicated that geographic distance reduced the positive spatial dependence of energy efficiency in various regions to a certain extent, whereas economic factors increased this positive direction. We drew the scatter plot in Figure 2 according to the indices calculated by the three weight matrices Moran’s I.
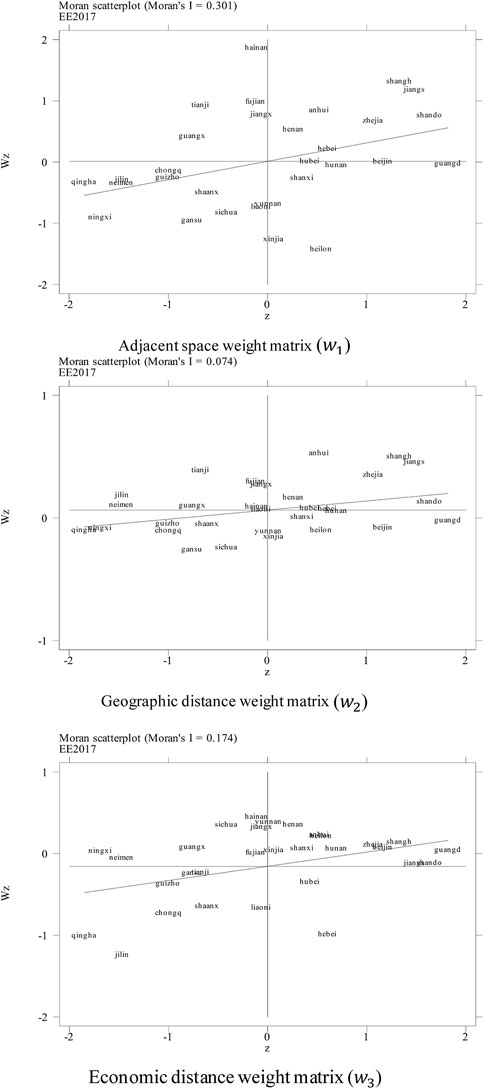
FIGURE 2. Interprovincial Moran’s I energy efficiency scatter plot, 2017.
Adjacent space weight matrix (
Geographic distance weight matrix (
The results, as shown in Figure 2, demonstrate that based on the scatter plot of the three weight matrices, most provinces fall in the first and third quadrants. The spatial weight matrix of economic distance was particularly significant, with 12 provinces and cities falling in the first quadrant; seven provinces and cities falling in the second quadrant; eight provinces and cities falling in the third quadrant; and two provinces and cities falling in the second quadrant. The first and third quadrants included most provinces and cities, indicating that low-energy-efficiency provinces and cities were surrounded by high-energy-efficiency provinces and cities; low-energy-efficiency provinces and cities were surrounded by low-energy-efficiency provinces and cities; and energy efficiency spatial autocorrelation characteristics were significant. The six provinces and cities of Shanghai, Jiangsu, Zhejiang, Guangdong, Shandong, and Beijing were located far away from the origin in the first quadrant, further showing that these six provinces and cities were in a leading position of energy efficiency in the country and promoted the improvement of energy efficiency of neighboring provinces and cities. Jilin and Qinghai Provinces were in the third quadrant far from the origin, which indicated that they were at a lower level of national energy efficiency, and neighboring provinces and cities had a weaker driving effect on their energy efficiency.
We used the Hausman test to verify the results of this study and used the LR test and model selection test to determine the model type. The specific test results are given in Tables 2, 3, 4.
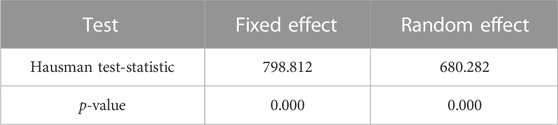
TABLE 2. Hausman test results.
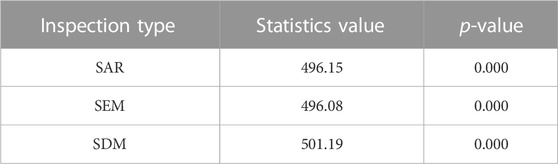
TABLE 3. LR test results.
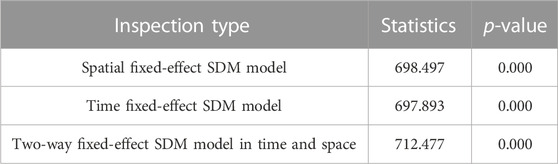
TABLE 4. Model selection test result.
The results in Table 2 show that the Hausman test result value was 0.000, indicating that it passed the hypothesis test at a significance level of 1%, and the statistic of the fixed-effects model was 798.812, which was significantly larger than the statistic of the random-effects model of 680.282. Therefore, we constructed a fixed-effect panel model. To determine whether or not the SDM model degenerated into the SAR model or the SEM model, we performed a degradation test. The results are given in Table 3.
The results in Table 3 show that the test results of the SAR model and the SEM model were both 0.000, which indicated that they passed the hypothesis test at a significance level of 1%, and the statistics were 496.15 and 496.08, respectively, which were significantly less than the test result of the SDM model 501.19. This result indicated that the SDM model should be used. We then tested which type of SDM model should be used for model selection. The results are given in Table 4.
According to the previous test results, and based on the adjacent space weight matrix, geographic distance weight matrix, and economic distance weight matrix, we used the space-time two-way fixed-effect spatial Durbin model to estimate the spatial spillover effects of energy efficiency. The results are given in Table 5.
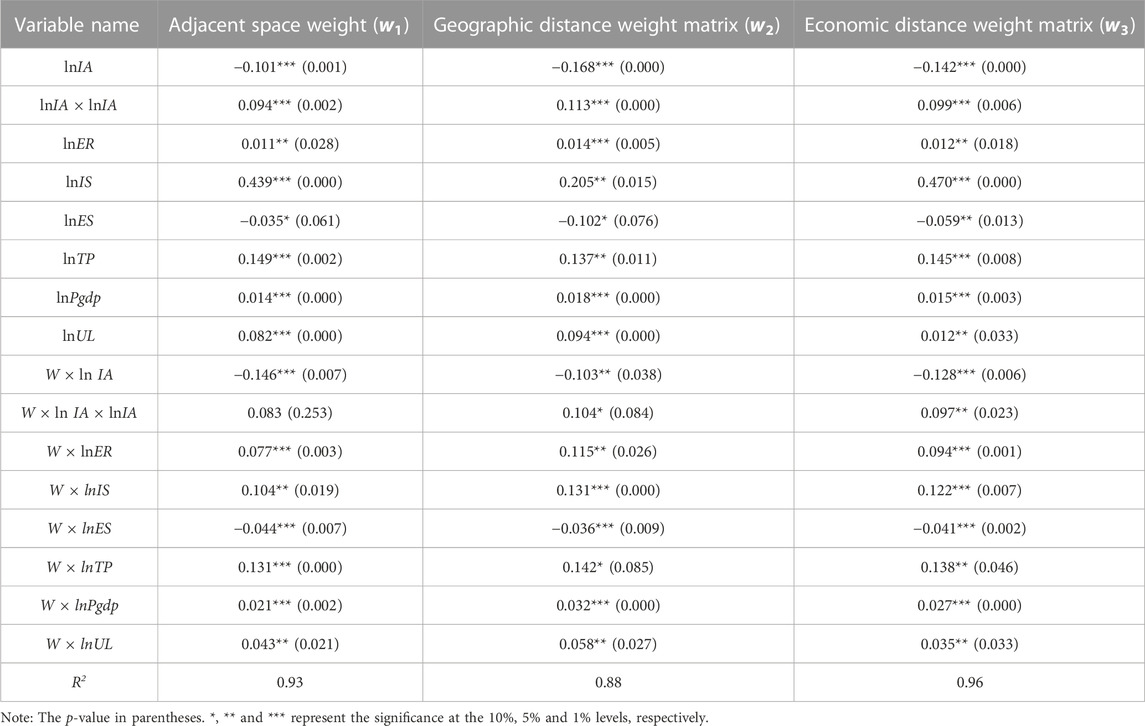
TABLE 5. Spatial SDM model estimation results based on different weight matrices.
According to the estimated results in Table 5, under the three spatial weight matrices, the regression coefficients of the spatial lags of the explanatory variables of total factor energy efficiency were all positive, and all passed the test at the 1% significance level. At the same time, the explanatory variables’ spatial lag terms W×lnIA, W×lnER, and W×lnIS all passed the test at the 5% significance level, indicating that the total factor energy efficiency had a strong spatial dependence and was not independent. Because the regression coefficient of the variable spatial lag term was not zero, the regression coefficient of the explanatory variable and its spatial lag term could not be used to explain the change of the explained variable, and the regression coefficient of the explanatory variable indicated the degree of its direct influence on the explained variable. In the spatial econometric model, the regression coefficients of explanatory variables included not only direct effects but also feedback effects. Therefore, it was necessary to eliminate the feedback effect and further decompose the spillover effect into direct and indirect effects. The results are given in Table 6.
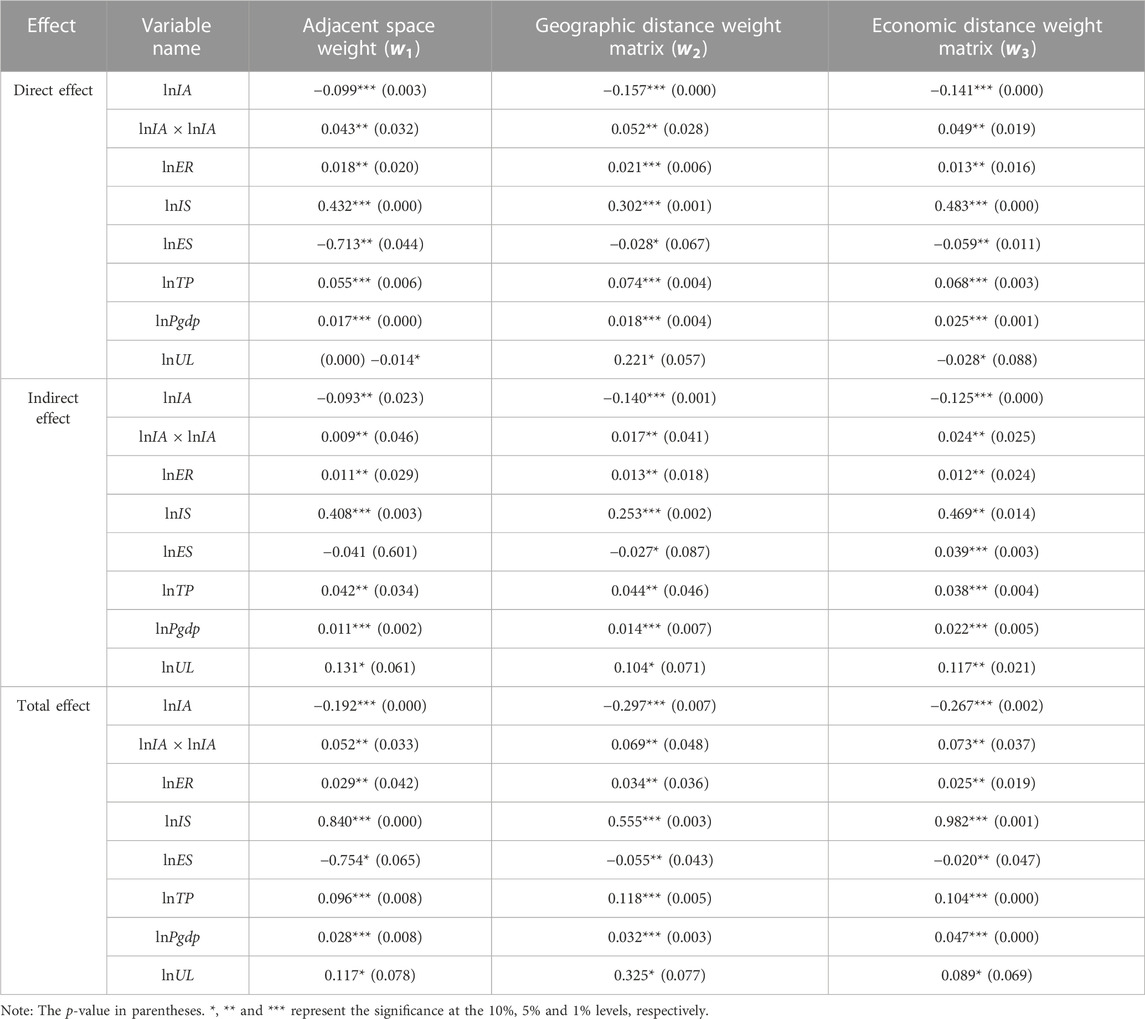
TABLE 6. Decomposition of direct effects and spillover effects of spatial SDM model.
Table 6 shows the total effect, direct effect, and indirect effect of manufacturing agglomeration on total factor energy efficiency under the weight of neighboring space, geographical distance, and economic distance. Under the adjacent space weight matrix, the spillover effect of manufacturing agglomeration was −0.099, and the direct effect was −0.093, and they passed the test at 5% and 1% significance levels, respectively. The regression coefficient of the quadratic spillover effect of manufacturing agglomeration was 0.009, the direct effect was 0.043, and all passed the test at the 5% significance level. Under the spatial weight matrix of geographic distance, the spillover effect of manufacturing agglomeration was −0.57, and the direct effect was −0.140, and both passed the test at a significant level of 1%. The regression coefficient of the quadratic spillover effect of manufacturing agglomeration was 0.017, the direct effect was 0.052, and all passed the test at the 5% significance level. Under the economic distance spatial weight matrix, the spillover effect of manufacturing agglomeration was −0.125, and the direct effect was −0.141, and both passed the test at a significant level of 1%. The regression coefficient of the quadratic spillover effect of manufacturing agglomeration was 0.024, the direct effect was 0.049, and all passed the test at the 5% significance level. These results showed that under the three spatial weight matrices, a U-shaped relationship existed between manufacturing agglomeration and total factor energy efficiency. Before manufacturing agglomeration reached a critical point, the degree of agglomeration had a negative spatial spillover to total factor energy efficiency. In other words, the agglomeration of manufacturing industries in the region would have an inhibitory effect on the total factor energy efficiency of other neighboring regions. When the agglomeration degree of manufacturing in the region crossed the critical point, the increase in the degree of agglomeration would have an impact on the overall factor energy efficiency and thus have a promoting effect. Manufacturing agglomeration had a significant spatial spillover effect on total factor energy efficiency. This conclusion verified the results of the previous theoretical analysis that a non-linear relationship existed between manufacturing agglomeration and total factor energy efficiency. Thus, proper manufacturing agglomeration was conducive to the improvement of total factor energy efficiency and had a spatial spillover effect.
Among other explanatory variables, under the three spatial weight matrices, the direct effects of environmental regulation, technological progress, economic development level, and industrial structure on total factor energy efficiency were all positive, which indicated that these factors had a positive impact on energy efficiency in the region. The regression coefficients of energy consumption structure and urbanization level were negative, however, which indicated that these factors had an inhibitory effect on energy efficiency in the region. This conclusion was related to the proxy indicators selected in this study. We selected the proportion of coal consumption in total energy consumption as a proxy indicator for the energy structure. Coal had low calorific value and high carbon and oxidation factors, and the increase in its consumption inevitably led to a decrease in energy efficiency. In this study, we selected urbanized population, and the proportion of the total population was used as a proxy indicator for the level of urbanization. This indicator reflected only the quantity of urbanization and not its quality. The suppression of energy efficiency caused by the rapid increase in the level and speed of urbanization in the western region offset the promotion of energy efficiency cause by the improvement of urbanization quality in the eastern region, and finally showed a suppression effect of urbanization level on energy efficiency. Previous scholars have called this the “rebound effect.” In terms of spillover effects, the regression coefficients of most explanatory variables had no change in the direction and were smaller than the direct effects, which indicated that the spillover effects of these factors between regions were smaller than those within regions. Note that the spillover effect of the level of urbanization was positive, contrary to the direct effect, which indicated that areas with high levels of urbanization had a positive spillover effect on the energy efficiency of neighboring areas. At the initial stage when low-level urbanization areas absorb the spillover effects of high-level urbanization areas, the number and speed of urbanization have not yet reached the turning point that affects energy efficiency, and thus it has a positive effect on energy efficiency. From the perspective of overall effects, industrial structure optimization had the largest overall effect on energy efficiency, followed by the level of urbanization. This result was also in line with the current status of China’s economic development. The current central supply-side structural reform and the promotion of urbanization will promote the steady improvement of regional energy efficiency.
In this study, we used China’s interprovincial panel data from 2002 to 2017, selected the spatial Durbin model, and considered the influence of adjacent spatial distance weights, geographic distance weights, and economic distance weights on spatial effects. We decomposed the impact of manufacturing agglomeration on total factor energy efficiency as well as its direct effect, indirect effect, and total effect. The study results showed the following: 1) Under different spatial weights, the agglomeration of interprovincial manufacturing had a significant spatial dependence on total factor energy efficiency. 2) Under the three spatial weights, there was both agglomeration of manufacturing and total factor energy efficiency. A U-shaped relationship with manufacturing agglomeration had clear spatial spillover effects on total factor energy efficiency, and the spillover effect under the weight of geographic distance was higher than other spatial weights. The spillover effect under the geographical distance weight was higher than that of other spatial weights, which indicated that the spatial spillover effect of industrial agglomeration on energy efficiency in China’s provinces was generated mainly by geographical proximity during the sample period. This further indicated that the direct effect of industrial agglomeration drove the improvement of energy efficiency in regions close to it through the form of demonstration imitation, and interprovincial economic interaction should be further strengthened to jointly promote the improvement of energy efficiency. 3) Both the direct effect of manufacturing on energy efficiency during the sample period and the indirect effect were negative, which indicated that the agglomeration of the manufacturing industry had an inhibitory effect on energy efficiency, which was the crowding effect noted in the previous analysis.
Based on these research conclusions, we propose the following policy implications: First, the Chinese government should formulate differentiated regional industrial development policies. China has a vast territory, and regional economic development, technological innovation, and resource endowments are quite different. Each regional government should combine its own development stage and regional characteristics, cultivate competitive industries, and actively promote the coordinated development of manufacturing and producer services to stimulate the positive externalities of industrial agglomeration. Second, the government should formulate a reasonable industrial transfer policy. Given the imbalance of economic development and industrial structure in the eastern, central, and western regions of China, and to overcome the crowding effect in the eastern region where the manufacturing concentration level is relatively high, part of the marginal manufacturing industry should be transferred to the central and western regions. The development of the producer service industry in the region would provide more space to promote industrial upgrading and improve energy efficiency. Third, the government should formulate a reasonable ecological environment monitoring policy, establish a cross-regional and cross-industry cooperation mechanism, implement division of labor and coordination within and between regions, monitor each other, identify the threshold of industrial access, implement strict environmental regulations, restrict the entry of high-energy consumption and high pollution enterprises, and ensure the promotion of industrial agglomeration. In addition to economic development, the efficiency of energy utilization should be improved to minimize the environmental load. Fourth, the government should promote local industries to actively embed global value chains. Technological progress is an effective way to improve energy efficiency. Through high-frequency external contacts, we can obtain external advanced knowledge and technology, improve the technical content, add value of products, and strive to overcome low technology levels and low-end value chain lock-in, as the global value chain continues to climb toward higher value-added links.
The results in Table 4 show that the three fixed-effects models all passed the test at the 1% significance level, and the statistics of the spatial fixed-effects model and the temporal fixed-effects model were both smaller than the statistics of the two-way spatiotemporal fixed-effects model. Therefore, in this study, we selected a two-way fixed-effect model of time and space.
The original contributions presented in the study are included in the article/supplementary material, further inquiries can be directed to the corresponding author.
Conceptualization, HJ and ZHC; methodology, HJ, ZHC, and WZ; software, HJ, ZHC, and WZ; validation, FW and JX; formal analysis, FW and JX; investigation, ZHC, WZ, FW, and JX; resources, HJ; data curation, HJ, ZHC, WZ, FW, and JX; writing–original draft preparation, HJ and ZHC; writing–review and editing, WZ, FW, ZYC, and JX; visualization, FW and ZHC; supervision, HJ and WZ; project administration, HJ; funding acquisition, HJ. All authors have read and agreed to the published version of the manuscript.
We thank LetPub (www.letpub.com) for its linguistic assistance during the preparation of this manuscript.
The authors declare that the research was conducted in the absence of any commercial or financial relationships that could be construed as a potential conflict of interest.
All claims expressed in this article are solely those of the authors and do not necessarily represent those of their affiliated organizations, or those of the publisher, the editors and the reviewers. Any product that may be evaluated in this article, or claim that may be made by its manufacturer, is not guaranteed or endorsed by the publisher.
Anderson, D. (1995). Energy efficiency and the economists: The case for a policy based on economic principles. Annu. Rev. Energy Environ. Manag. 1, 495–511. doi:10.1146/annurev.eg.20.110195.002431
Chen, Z., Zhu, H., and Li, G. (2021). Evaluating the safety production efficiency of forestry based on super-efficiency SBM-DEA. Fresenius Environ. Bull. 10, 11246–11253.
Chen, Z., Zhu, H., Zhao, W., Zhao, M., and Zhang, Y. (2021). Spatial agglomeration of China’s forest products manufacturing industry: Measurement, characteristics and determinants. Forests 8, 1006. doi:10.3390/f12081006
Einhorn, M. (1982). Economic implications of mandated efficiency standards for household appliances. Energy J. 1, 103–109.
Esty, D. C., and Dua, A. (1997). Sustaining the asia pacific miracle: Environmental protection and economic integration. Washington: Peterson Institute Press.
Fujita, M., Krugman, P. R., and Venables, A. (2001). The spatial economy: Cities, regions, and international trade. MIT press.
Gowrisankaran, G., He, C., Lutz, E. A., and Burgess, J. L. (2015). Productivity, safety, and regulation in underground coal mining: Evidence from disasters and fatalities (No. w21129). National Bureau of Econ. Res. Working. Paper Series No. 21129. doi:10.3386/w21129
Guo, J., and Sun, H. (2019). Is specialized agglomeration of China's manufacturing industry more conducive to improving energy efficiency than diversified agglomeration. J. Nanjing Audit. Univ. 7, 93–102. (In Chinese).
Hou, J., Hou, Y., Wang, Q., and Yue, N. (2022). Can industrial agglomeration improve energy efficiency? Empirical evidence based on China’s energy-intensive industries. Environ. Sci. Pollut. Res. 53, 80297–80311. doi:10.1007/s11356-022-21429-x
Hu, Q. (2014). Major industries selection based on the rebound effects and energy efficiency policy. Econ. Res. J. 2, 128–140. (In Chinese).
Kim, S. (1995). Expansion of markets and the geographic distribution of economic activities: The trends in US regional manufacturing structure, 1860–1987. Q. J. Econ. 4, 881–908. doi:10.2307/2946643
Krugman, P. (1991). Increasing returns and economic geography. J. Polit. Econ. 3, 483–499. doi:10.1086/261763
Li, S. (2016). The impact of environmental regulations on employment skill structure: Based on the analysis of industrial industry dynamic panel data. China Popul. Sci. 10, 90–100. (In Chinese).
Liang, L., Wu, J., Cook, W. D., and Zhu, J. (2008). The DEA game cross-efficiency model and its Nash equilibrium. Oper. Res. 5, 1278–1288. doi:10.1287/opre.1070.0487
Liu, J., Cheng, Z., and Zhang, H. (2017). Does industrial agglomeration promote the increase of energy efficiency in China? J. Clean. Prod. 164, 30–37. doi:10.1016/j.jclepro.2017.06.179
Liu, K., Liu, X., Long, H., Wang, D., and Zhang, G. (2022). Spatial agglomeration and energy efficiency: Evidence from China's manufacturing enterprises. J. Clean. Prod. 380, 135109. doi:10.1016/j.jclepro.2022.135109
Maddison, A. (1987). Growth and slowdown in advanced capitalist economies: Techniques of quantitative assessment. J. Econ. Lit. 2, 649–698.
Pan, Y., Chen, Z., and Luo, L. (2017). The non-linear character research of industry agglomeration’s influence on total factor energy efficiency: An empirical analysis based on the data from China’s energy industry. East China Econ. Manag. 11, 121–126.
Pu, Z., Liu, J., and Yang, M. (2022). Could green technology innovation help economy achieve carbon neutrality development–evidence from Chinese cities. Front. Environ. Sci. 468. doi:10.3389/fenvs.2022.894085
Qian, C., Zheng, R., and Yu, D. (2011). The impact of China’s industrial structure changes on economic growth and fluctuations. Econ. Res. J. 5, 4–16. (In Chinese).
Qian, X., Zhang, J., and Mao, H. (2019). Vertical structure, resource misallocation and industrial policy. Econ. Res. J. 2, 54–67. (In Chinese).
Shao, S., Zhang, K., and Du, J. (2019). The energy conservation and emission reduction effects of economic agglomeration: Theory and Chinese experience. J. Manag. World. 1, 36–60. (In Chinese).
Tang, H., Wang, Y., Wang, D., and He, Z. (2018). Study on the influence of transportation infrastructure in Western China on manufacturing agglomeration. China Soft Sci. 8, 137–147. (In Chinese).
Wang, C., and Qiu, M. (2017). The heterogeneity of scale and the effect of agglomeration. Sci. Res. Manag. 4, 348–354. (In Chinese).
Wang, H., and Chen, Y. (2010). Industrial agglomeration and industrial energy efficiency: Empirical analyses based on 25 industries in China. J. Financ. Econ. 87, 235–244. (In Chinese).
Wang, P., and Liang, S. (2022). Environmental regulations and energy efficiency: The mediating role of climate change and technological innovation. Front. Environ. Sci. 620. doi:10.3389/fenvs.2022.909082
Keywords: energy efficiency, DEA game cross-efficiency model, manufacturing agglomeration, spatial overflow, spatial Durbin mode
Citation: Jiang H, Chen Z, Zhao W, Wang F, Xia J and Chen Z (2023) Toward carbon neutrality: The impact of manufacturing agglomeration on total factor energy efficiency. Front. Environ. Sci. 11:1132294. doi: 10.3389/fenvs.2023.1132294
Received: 30 December 2022; Accepted: 20 March 2023;
Published: 03 April 2023.
Edited by:
Gul Jabeen, Harbin Institute of Technology, ChinaReviewed by:
Yantuan Yu, Guangdong University of Foreign Studies, ChinaCopyright © 2023 Jiang, Chen, Zhao, Wang, Xia and Chen. This is an open-access article distributed under the terms of the Creative Commons Attribution License (CC BY). The use, distribution or reproduction in other forums is permitted, provided the original author(s) and the copyright owner(s) are credited and that the original publication in this journal is cited, in accordance with accepted academic practice. No use, distribution or reproduction is permitted which does not comply with these terms.
*Correspondence: Zhenhuan Chen, Y3poMjAxN0BuZWZ1LmVkdS5jbg==
Disclaimer: All claims expressed in this article are solely those of the authors and do not necessarily represent those of their affiliated organizations, or those of the publisher, the editors and the reviewers. Any product that may be evaluated in this article or claim that may be made by its manufacturer is not guaranteed or endorsed by the publisher.
Research integrity at Frontiers
Learn more about the work of our research integrity team to safeguard the quality of each article we publish.