 Xiaodong Li
 Tingjun Zhang2†
 Guanxin Wang
95% of researchers rate our articles as excellent or good
Learn more about the work of our research integrity team to safeguard the quality of each article we publish.
Find out more
ORIGINAL RESEARCH article
Front. Environ. Sci. , 14 February 2023
Sec. Atmosphere and Climate
Volume 11 - 2023 | https://doi.org/10.3389/fenvs.2023.1130443
This article is part of the Research Topic Impact of Climate Changes on Groundwater Resources View all 6 articles
Lake water level reflects the dynamic balance of water input and output/loss and is a sensitive indicator of climate change and variation. Studying the relationship between the closed Qinghai Lake water level and watershed climate change is important for understanding regional climate change and its impacts on the lake. The objective of this study was to investigate changes in Qinghai Lake water level/area and environmental factors during 1961–2019, using ground-based measurements data, hydrological balance model and statistical methods. The results revealed two primary phases: during the first phrase (1961–2004), the lake water level lowered by 0.80 m/ decade (p < 0.01), while in the second phase (2004–2019), it rose markedly by 1.80 m/decade (p < 0.01). The lake area increased in April and September between 1990 and 2019, but since 2004 the increases have been more significant. Air temperature near the lake during 1961–2019 warmed by 0.39°C/decade and precipitation increased by 17 mm/decade. Annual river runoff increased at 14.3 mm/decade from 1961 to 2019, however, runoff decreased (−6.8 mm/decade) during the first phase from 1961 to 2004 and increased significantly (84.7 mm/decade) during the second phase from 2004 to 2019. The increases in precipitation and river runoff were the predominant factors contributing to lake water level rises and area expansion, while a decreasing lake water level and area reduction corresponded to reduced precipitation and river runoff and increased evaporation. As a sensitive indicator of regional climate change, the fluctuations of lake water level and surface area provide a comprehensive reflection of climate change in the Qinghai Lake watershed.
Climate change has significantly affected river and lake hydrological processes in many regions of the world. The hydrological processes in cold regions, such as the Tibetan Plateau (TP) and the high latitudes, are very sensitive to climate change (Yang et al., 2010; Wu et al., 2019; Zhang et al., 2019a; Zhang et al., 2019b). There are approximately 1,400 lakes with water surface areas greater than 1 km2 over the TP and these are primary water resources besides glaciers and rivers (Lehner and Döll 2004; Zhang et al., 2014a; Zhang et al., 2019c). Lakes are extremely sensitive to climate, responding rapidly to environmental changes in their catchment (Adrian et al., 2009). During recent decades, lakes in TP have experienced significant changes, including fluctuations in lake water level and lake surface area (Wang et al., 2008; Zhang et al., 2014b; Zhang et al., 2020). The relatively limited human activities in TP mean fluctuations in lake water level offer a clear indicator of climate change. Qinghai Lake is within a large, closed basin and lies in the northeastern TP within a transitional zone between the East Asian and Indian monsoons and the Westerlies (An et al., 2017; Wang et al., 2019). The unique geographical location of Qinghai Lake makes it one of the sensitive regions to climate change in TP (Liu et al., 2011; Zhang et al., 2014a).
Many studies have reported a severe decrease in the water level and surface area of Qinghai Lake over the past few decades. During 1959 to 2000, the water level of Qinghai Lake experienced a 3.35 m decline (Li et al., 2007). Studies also showed that Qinghai Lake was significantly shrinking and provided abundant sediments for aeolian erosion (Li et al., 2004; Sun et al., 2008; Yi et al., 2010; Wang et al., 2013; Fang et al., 2019). However, some lakes in TP have significantly increased in water level and surface area since 2000 (Liu et al., 2009; Duo et al., 2010; Zhang et al., 2011; Kropáček et al., 2012; Lei et al., 2013; Zhang et al., 2020), indicating that lakes in TP have the characteristics of rising water level and increasing surface area in the 21st century when climate change gradually intensifies. Lake storage and water level showed an increasing tendency in the wet years (Shen et al., 2005). Studies of water level changes using remote sensing data for 74 lakes showed that the levels of 62 (84%) lakes rose from 2003 to 2009, including Qinghai Lake (Zhang et al., 2011). Because many lake basins in TP include glaciers in their catchments, it has been hypothesized that the increase in glacier melt water has contributed significantly to the growth of inland lakes (Yao et al., 2007). However, some lakes without glacier contributions have also expanded significantly in recent years, which indicates that other climatic factors—such as precipitation increases and lake evaporation decreases—may also affect recent lake growth (Liu et al., 2009a). Changes in precipitation, temperature, evaporation, and permafrost are potential factors influencing the water levels of Qinghai Lake (Lee et al., 2011). Regional climate changes such as temperature and precipitation have been reported to directly impact the water level of Qinghai Lake (Qin and Huang, 1998). Qinghai Lake is the largest inland closed lake in China. It is located in the confluence aire of East Asian monsoon, Indian monsoon and Westerly wind, and is very sensitive to climate change (Li et al., 2007; An et al., 2017). Qinghai Lake is a closed lake with only inflow but no outflow. It is an ideal place to study the impact of climate changs on the lake water body. Studying the relationship between Qinghai Lake water level and watershed climate change is important for understanding regional climate change and its impacts on the lake.
Previous studies have in general, used relatively short periods of data records for water level and surface area. Moreover, it is not clear which is the key factor that has caused Qinghai Lake hydrology to change so dramatically over time. Insufficient data of precipitation, river runoff, water level, and area data mean the attribution of lake change and variation for Qinghai Lake is poorly understood. To fill this knowledge gap, this study aimed to investigate changes and variabilities of Qinghai Lake level and area from 1961 through 2019 using the updated datasets of in-situ measurements and satellite remote sensing images. The results will provide reliable data and knowledge for local and regional water resources assessment, evaluation of climate change, environmental protection, and socio-economic developments.
Qinghai Lake is located in a semi-arid and cold region of the northwestern TP, at an elevation of 3,194 m (Figure 1). From 1961 to 2019, mean annual air temperature was −0.6°C and annual precipitation was 367 mm. More than 80% of annual precipitation falls as rain from May to September (Xu et al., 2007). The average water depth, lake surface area, lake water volume, and entire basin drainage area of Qinghai Lake are approximately 21 m, 4,591 km2 (2019), 85 m3 × 109 m3, and 29,660 km2, respectively (Li et al., 2007). The lake surface is ice-covered from mid-December to late March (Cai et al., 2019; Dong et al., 2019). There are more than 40 rivers (some seasonal) flowing into Qinghai Lake, but most are relatively small and intermittent. The largest river in Qinghai Lake basin is the Buha River, with a runoff accounting for almost 50% of the total runoff to Qinghai Lake; the Shaliu River is the second largest river with a discharge accounting for 14.5% of the total runoff (Li et al., 2007). Water consumption by humans is responsible for only 1% of the evaporation loss of the lake and has little effect on lake water level change (Li et al., 2007). Most of the lake catchment is covered by grazing land, alpine shrubs, and meadows (Zhang et al., 2014a). There are not many glaciers in the basin (Qin and Huang, 1998), except a small one in the upper Buha River basin (Colman et al., 2007). There is a large range of permafrost regions, comprising approximately 42% of the total basin area (Cao et al., 2019). The entire lake basin experiences seasonal freezing and thawing.
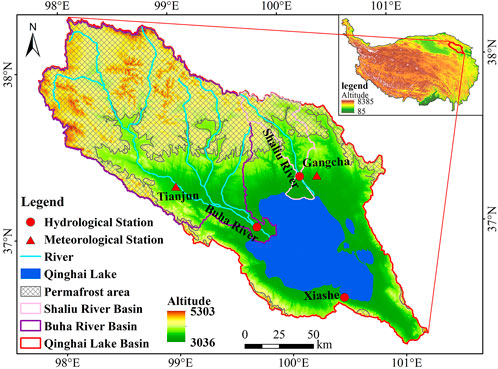
FIGURE 1. Geographical location and drainage map of Qinghai Lake basin.
The datasets used in this study are from ground-based measurements and satellite remote sensing images. Meteorological data, such as daily mean air temperature and daily precipitation, were collected from TianJun (TJ) and GangCha (GC) meteorological stations within Qinghai Lake basin during 1961–2019 (Figure 1), and monthly and annual mean air temperature and precipitation were calculated from daily data. The mean meteorological conditions in Qinghai Lake basin are reflected by the average value from the two meteorological stations. The lake water level was obtained by measuring 5 min with bubble water level gauge and the data were calibrated at the XiaShe hydrological station on the south shore of the lake. Discharges of Buha and Shaliu rivers were measured from hydrologic stations during 1961–2019 (Figure 1). These data have been quality controlled by hydromet services; annual data were derived from monthly or daily data. Evaporation was estimated by the Penman-Monteith Equation, daily ET0 was calculated for two stations by means of the FAO 56 p.m. equation (Allen et al., 1998):
where ETo is reference evapotranspiration rate (mm d−1), T is mean air temperature (°C), Rn is the net radiation at the surface (MJ m−2 day−1), G is the soil heat-flux density (MJ m−2 day−1), µ2 is the wind speed at a height of 2 m (m s−1), es is the saturation vapor pressure (kPa), ea is the actual vapor pressure (kPa),
Satellite remote sensing images were used in this study to examine lake surface area changes. Landsat image series are the most widely used data for lake surface area monitoring because of the high spatial resolution, long availability, and free access (Pekel et al., 2016; Sheng et al., 2016; Verpoorter et al., 2014). Spatial resolution of selected images is 30 m. Data for April and September were used to represent the and wet season in Qinghai Lake watershed, respectively; if data were unavailable in April or September, data from May or October were selected. In order to better reflect the charateristics of lake water level and area changes in dry season and wet season, satellite data in April and September were used. The normalized difference water index (NDWI) (McFeeters, 1996) was applied to distinguish water from land with the Otsu method (Otsu, 1979). Because Landsat data were unavailable and discontinuous from 1972 to 1989, images from 1990 to 2019 were selected to explore variation of the lake area.
Qinghai Lake is a closed catchment, thus the hydrological balance model for Qinghai Lake can be expressed as follows:
Where
Where Hi and Hi−1 are the lake water level at ith month and (i−1)th month, N = 12, respectively.
Long-term hydro-climatic changes have been determined by a linear trend analysis (Li et al., 2000). Pearson correlation analyses (two-tailed) and statistical significance tests were used to assess the associations among climatic and hydrological variables. The
Where
Long-term water level data reveals two phases of change from 1961 to 2019 (Figure 2). During the first phase from 1961 to 2004, the lake water level decreased, on average by 0.80 m/decade. The lake water level was 3,196.10 m in 1961 and 3,192.86 m in 2004, which is a decline of 3.24 m in 43 years. Within this first period, there were fluctuations in the lake water level. These fluctuations included two major increase events—one in the late 1960s and one the late 1980s (Figure 2)—with the largest increase of 0.33 m in 1989. Conversely, the largest annual decline in water level was 0.34 m in 1980. Major decline events occurred in the early 1960s, from the early 1970s through the late 1990s, and from the early 1990s through the mid-2000s (Figure 2).
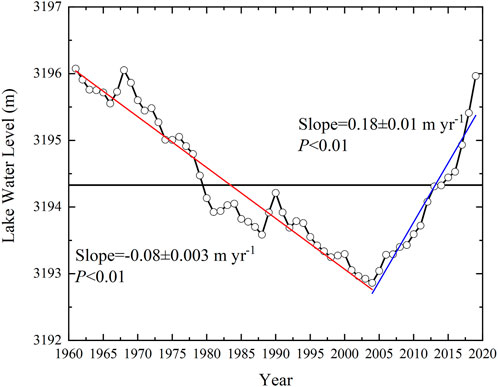
FIGURE 2. Annual lake water level (black circles) and mean vaule of 1961–2019 (3,194.33 m) lake water level (black solid line) based on lake water level measured at the hydrological station. Also included are the linear trend from 1961 to 2004 (red line), and the linear trend from 2004 to 2019 (blue line).
During the second phase (2004–2019), the lake water level increased dramatically and continuously with relatively weak oscillations. On average, the lake water level increased by 1.80 m/decade, which was approximately 2.25 times greater than the decreasing rate during the first phase (Figure 2). The lake water level was 3,192.86 m in 2004 and 3,195.97 m in 2019, an increase of 3.11 m in 15 years. The largest increase was 0.48 m in 2019 (Figure 2).
Over the 58 years of recorded data, there were 25 years when the annual lake water level was above the 1961–2019 mean value (3,194.33 m), although it has not yet returned to the original level recorded in 1961 (Figure 2). There were 34 years when the annual lake water level gradually decreased to less than 3,194.33 m in each year until 2013, before persistently increasing to more than 3,195.00 m again in 2018, close to the lake water level of 1962 (Figure 2). Overall, the water level showed a continuous increasing trend, which accelerated since 2013 with a rate of about 2.72 m/decade (Figure 2).
The average monthly lake water level change revealed a general rise from May to September and a decrease from October to April during the first phase (1961–2004) (Figure 3A). During the second phase (2004–2019), the water level rose from April to October and declined from November to March (Figure 3A). The increase in lake water levels from April to October during the second phase (2004–2019) was significantly greater than that of the first phase (1961–2004) (Figure 3A). The rise in lake water level predominantly occurred in summer, while the decline mainly occurred in autumn, winter, and early spring. Monthly records of lake water levels show a low water level period from October to April, and a high water level period from May to September (Figure 3A).
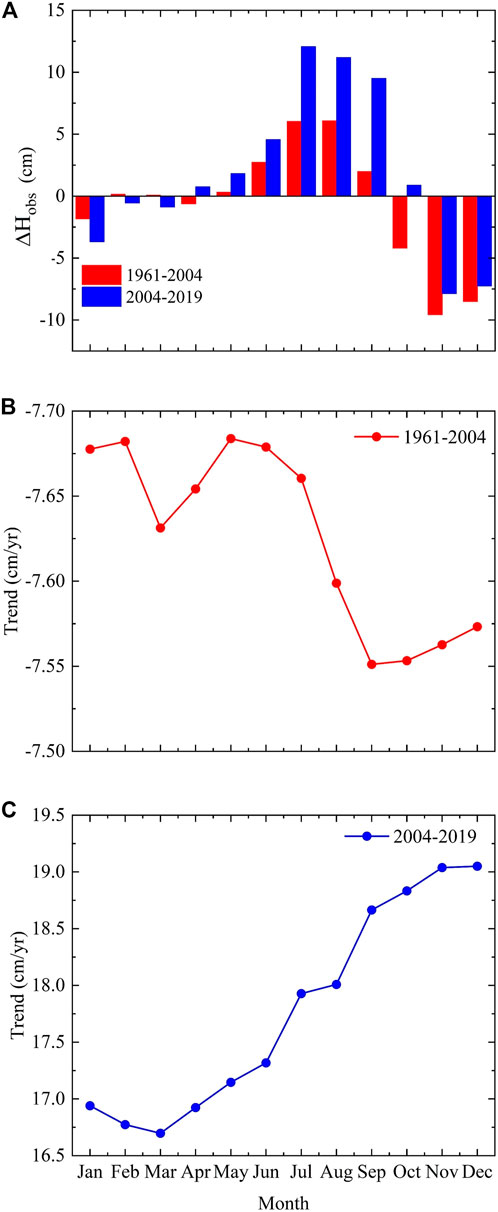
FIGURE 3. Variation of
The rates of monthly lake water level change during the two phases were different. The lake water level exhibited a significant downward trend with an average decreasing trend of 7.60 cm/year for each month during the first phase (Figure 3B). Although the difference among monthly lake water level declining rates was small (∼0.13 cm/year) during the first period, high magnitudes of water level lowering occurred in February and May, while the lowest magnitude was in September (Figure 3B). The lake water level showed an obvious upward trend with an average increasing rate of 17.8 cm/year during the second phase (2004–2019) (Figure 3C), approximately 2.3 times the absolute magnitude of the first phase. The highest was in November and December (19.10 cm/year) and the lowest in March (16.70 cm/year) (Figure 3C). From February through April, lake level changes were relatively small (Figure 3A), owing to minimum river runoff and snowfall, and weeks to months of lake ice cover.
Lake water surface area was obtained by using satellite remote sensing data. Available Landsat images from 1990 to 2019 were used to obtain the lake surface area in April and September for each year. Fluctuations in lake water surface area were synchronous with the variation in lake water level in April (Figure 4A) and September (Figure 4C) from 1990 through 2019. During 1990 to 2019, the lake water surface increased by approximately 203.40 km2 in April with an increasing rate of 44.70 km2/decade, and by approximately 237.40 km2 in September with an increasing rate of 47.80 km2/decade. However, since 2004, the increases in lake water surface area have been more significant with increasing rates of 174.50 km2/decade and 182.70 km2/decade for April and September, respectively. Lake water level and lake surface area from 1990 to 2019 showed a strong positive correlation, with a coefficient of 0.98 for April and 0.99 for September, respectively, and p < 0.01 (Figures 4B, D). The extremes in lake water surface area and water level do not always fully agree each other, and this is mainly owing to the difference in coastal slopes around the lake.
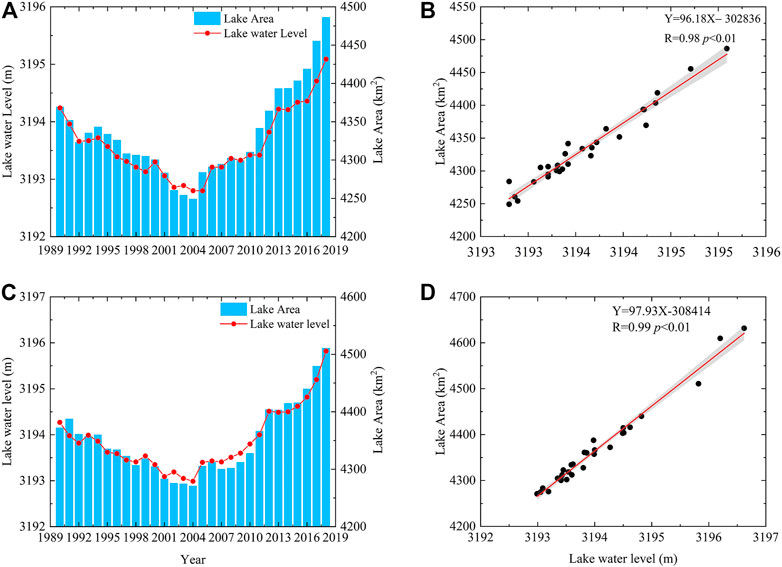
FIGURE 4. Variation of monthly lake water level and surface area for April (A) and September (C), and linear correlations between lake water level and surface area for April (B) and September (D).
Ⅰ and Ⅱ present the first phase (1961–2004) and the second phase (2004–2019), respectively. The first phase (Ⅰ) of lake area is 1990–2004, and the second phase (Ⅱ) is same as other variables.
Changes in lake water level are affected by many factors, such as precipitation, river runoff, evaporation, and air temperature. The effect of precipitation on lake water level includes two aspects: first, rain falls directly onto the lake surface, and thus lake water level rise; second, precipitation falls across the lake basin, generates river runoff, and then flowing into the lake. Air temperature records showed that precipitation varied from −1.99°C to 1.37°C from 1961 to 2019, with an overall mean of −0.43°C. There is a strong warming tendency of 0.39°C/decade during 1961–2019 over the Qinghai Lake basin (Figure 5A). Precipitation records from 1961 to 2019 showed that precipitation varied from 257 to 527 mm, with an overall mean of 378 mm. There were large inter-annual fluctuations and a weak increasing tendency of approximately 16.90 mm/decade during 1961–2019 over the Qinghai Lake basin (Figure 5B). However, precipitation showed a slight increase of 3.00 mm/decade, with large inter-annual variability during the first phase (1961–2004), while a continuously increasing tendency was detected during the second phase (2004–2019) with an increasing rate of 62.4 mm/decade (Table 1), approximately 21 times that of the first phase. The increase in precipitation during the second phase alone contributes approximately 35% of the lake water level rise. More specifically, precipitation decreased by about 250 mm from the late 1960s through the late 1970s (Figure 5B), while the lake water level declined by approximately 200 cm (Figure 2). During the second phase, precipitation exhibited a gradual increase from approximately 250 mm around 1990 to approximately 525 mm in the late 2010s (Figure 5B). However, the lake water level only started to rebound around the mid-2000s (Figure 2), more than a decade after the precipitation began increasing (Figure 5B).
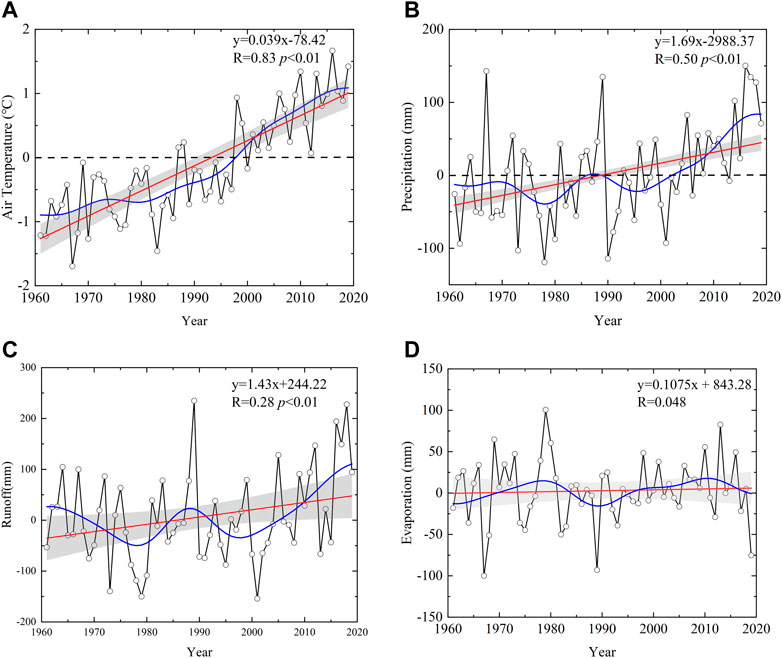
FIGURE 5. Anomalies of mean annual air temperature (A), precipitation (B), river runoff (C), and lake surface evaporation (D) with respect to the 1981–2010 mean in Qinghai Lake basin from 1961 through 2019. The 1981–2010 mean air temperature was −0.3°C, precipitation was 376.3 mm, river runoff was 280.9 mm, and evaporation was 924.4 mm, respectively. Also included are individual annual anomalies (black lines with open circles), the linear trend from 1961 to 2019 (red lines), the Fast Fourier Transform smoothing (blue lines), and 0.95 confidence interval of linear trend (gray shading).
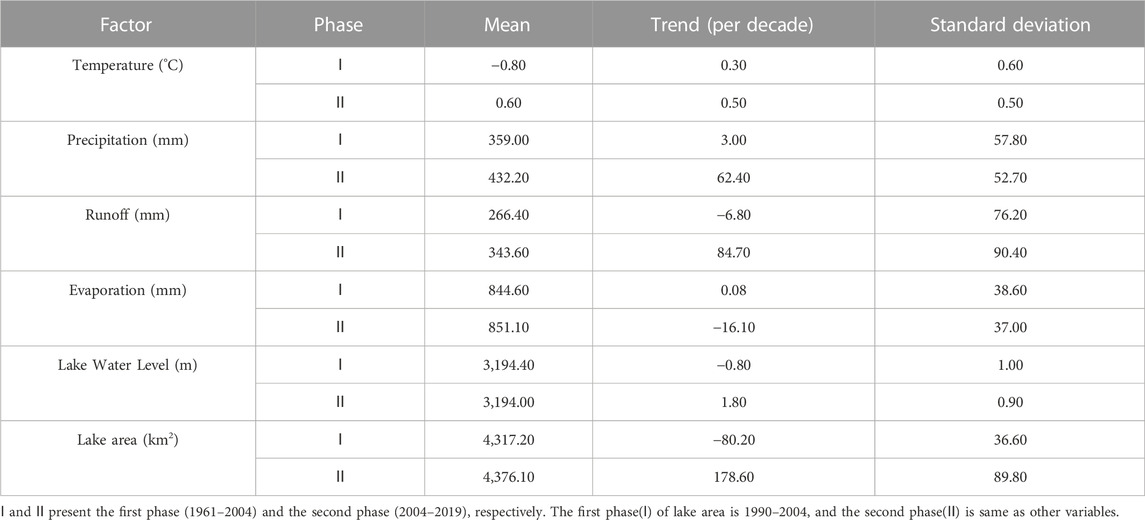
TABLE 1. Statistics of factors affecting the water balance of Qinghai Lake.
River runoff in Qinghai Lake basin exhibited large inter-annual fluctuations (127–516 mm) with a weak increasing tendency over the entire study period (1961–2019) (Figure 5C). River runoff tended to decrease during the first phase (1961–2004) at a rate of −6.80 mm/decade, and markedly increased during the second phase (2004–2019) at a rate of 84.70 mm/decade (Table 1). The decrease in river runoff during the first phase alone can partially explain the decline in lake water level (Table 1). Simultaneously, the marked increase in river runoff from the early 2000s through the end of the record period contributed substantially to the rise in lake water level.
Evaporation exhibited an inconspicuous upward trend in the period of 1961–2019 (Figure 5D; Table 1). The two phases of evaporation exhibited different tendencies. During the first phase, evaporation displayed a weak increasing trend, on average, by 0.80 mm/decade from 1961 to 2004. In contrast, evaporation in the second phase (2004–2019) showed a decreasing trend, and the decreasing rate was approximately 16.10 mm/decade after 2004 (Table 1), about 20 times that of the first phase (0.80 mm/decade) (Figure 5D; Table 1). The substantially decreased rate of evaporation during the second phase contributed significantly to the rise in lake water level. Consequently, the decrease in lake water level (Figure 2) during the first phase was predominantly because of the decrease in river runoff, relatively little evaporation loss, and little or no contribution from precipitation change. The rising lake water level during the second phase (Figure 2) corresponded to increasing precipitation (Figure 5B) and river runoff (Figure 5C), and decreasing evaporation (Figure 5D). More specifically, changes in precipitation and river runoff were essentially in the same trends as shown by the smoothed curves using the low-pass filters (Figures 5B, C), while evaporation showed an opposite trend (Figure 5D) and air temperature showed a relatively weak linkage (Figure 5A).
Changes in water balance for Qinghai Lake were evaluated by using observed and calculated values (Figure 6A). Calculated water level changes essentially capture the major changes from in-situ measurements. Further analysis was conducted by using simulated values against the ground-based measurements (Figure 6B) and showed that the observed and simulated values were closely related, with R = 0.91 (Figure 6B). These results demonstrated that the simulated lake level changes were reliable and could be used for further investigation of the Qinghai Lake basin hydrology.
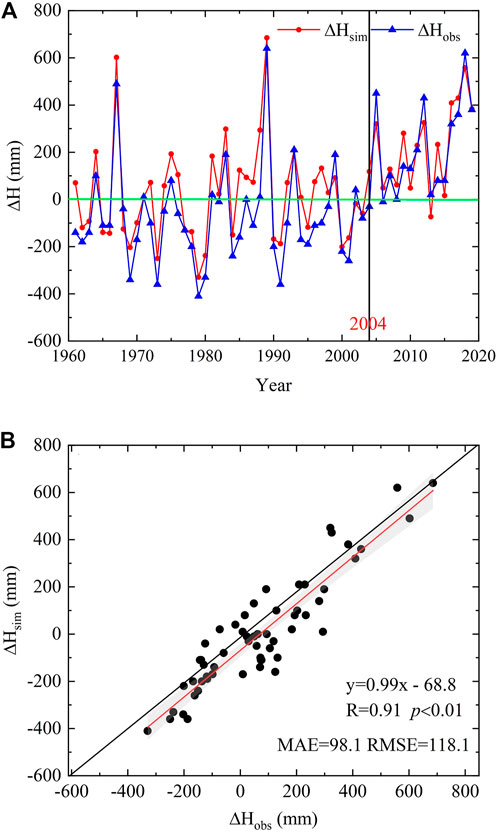
FIGURE 6. Time series of annual water balance of Qinghai Lake (A) and correlation (B) between ∆Hobs and ∆Hsim from 1961 through 2019. ∆Hobs was calculated from Eq. 3 with hydrological station observation data, and ∆Hsim was calculated from Eq. 2 with water level balance. The red solid line is the regression fit between the simulated and observed values, and gray shading is the 0.95 confidence interval of the fitting line.
Major climate variables have a substantial impact on lake water level changes, and thus lake hydrological processes. Overall, changes in lake water level were strongly controlled by precipitation, river runoff, and evaporation. However, these variables are also strongly inter-connected and interact with each other. River runoff is closely correlated with precipitation (Figure 7A) and lake water level (Figure 7C), resulting in changes in precipitation as the major factor for a rise in lake water level (Figure 7B). The negative correlation between lake water level and evaporation demonstrated that loss of water from the lake surface substantially affected lake water balance (Figure 7D). In addition, changes in air temperature may have a direct influence on evaporation.
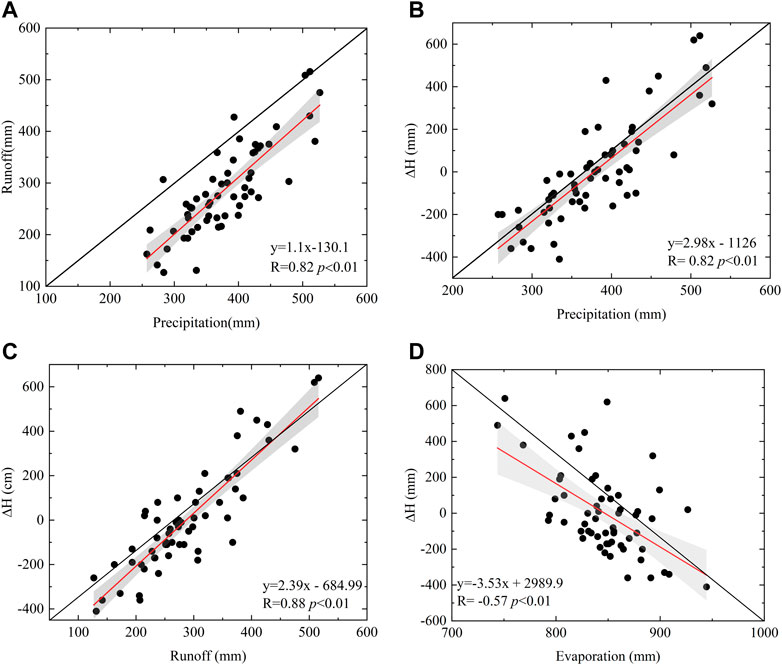
FIGURE 7. Relationship between precipitation and runoff (A), precipitation and ΔH (obtained from Eq. 3) (B), river runoff and ΔH (C), and evaporation and ΔH (D). The black solid line is the 1:1 line, while the red solid line is the regression fit between variables, gray shading is the 0.95 confidence interval of the fitting line.
The continued changing trend of Qinghai Lake basin hydrology is consistent with climate change during the last 60 years over the TP (An et al., 2017) and globally (IPCC, 2013; 2021). Ongoing global changes will strengthen the hydrological cycle on the regional scale in the TP, which will impact river and lake water cycles (Zhang et al., 2020; Chen et al., 2022). The measured results in this study showed distinct increases in air temperature (0.39°C/decade) and precipitation (16.90 mm/decade) from 1961 to 2019 in Qinghai Lake basin. Compare with precipitation, river runonff, temperature has a different perspective on the lake water level because changes in air temperature directly affect lake surface evaporation. As the air temperature increases, it is generally expected that evaporation from lakes will be enhanced. However, evaporation showed a decreasing trend from 1961 to 2019 in Qinghai Lake. The contrast between expectations and observations is known as the pan evaporation paradox (Roderick and Farquhar, 2002), and has been reported in Northwest China (Liu et al., 2004) and in the Qilian Mountains next to Qinghai Lake (Jia et al., 2009). Another study demonstrated that increases in air temperature predominantly occurred during winter months over the TP (An et al., 2017), when the lake surface was covered by lake ice and evaporation was therefore at its minimum level. During the summer months, the air temperature increase was relatively small, and heavier precipitation implied that there were more cloudy days with higher relative humidity, thus less evaporation would occur. This may partially explain why the air temperature increases while evaporation decreases in Qinghai Lake basin. The tendencies in both precipitation and number of days with precipitation increased during 1961–2007 in the TP (Li et al., 2010). Precipitation recorded in the TP exhibited an increasing trend in other studies (Xu et al., 2008; Li et al., 2010; Zhang et al., 2019a), supporting that the predominant factor for the lake fluctuations was precipitation increases; in contrast, the contribution of evaporation to lake water balance was minor (Gao et al., 2015; Ma et al., 2016; Zhang et al., 2019b). Therefore, the main characteristics of climate change in the Qinghai Lake basin are warming and wetting, with decreasing evaporation accompanied by increasing precipitation. Variation in all these climatic factors had direct effects on the rising of the lake water level.
The water level curve for Qinghai Lake from 1961 to 2019 can be split into two phases: an obvious decreasing phase (1961–2004, first phase) and a significant increasing phase (2004–2019, second phase) (Figure 2). The average values of air temperature, precipitation, and river runoff in the first phase were markedly smaller compared with those of the second phase, while there was no significant difference in evaporation between the two phases. Examination of the rates of changes of different variables (including lake water level, air temperature, precipitation, and river runoff) clearly showed increasing trends during the second phase (Table 1), although these parameters displayed decreasing trends during the first phase (Table 1). Rising lake water level and expanding lake surface area were positively correlated to increasing precipitation, increasing river runoff, and decreasing evaporation during the second phase. This may suggest that lake water level dynamics are generally controlled by the balance of precipitation, evaporation, and river runoff.
Lake water level are particularly sensitive to climate changes, primarily driven by changes in precipitation. This study showed that the peaks of lake water level rises corresponded to the highest precipitation in Qinghai Lake, suggesting that the increasing precipitation is closely related to increasing river runoff and lake water level. In general, precipitation can be a direct water source for lakes, but conversely, precipitation on land becomes runoff to rivers, which flow into the lake as a non-negligible part of its water source. Variations in discharge are strongly related to precipitation changes in cold regions (Krasovskaia, 1995; Yang et al., 2004; DeRy, 2005). Data analyses in this study show that precipitation was more than 450 mm in 1967, 1989, 2005, 2014, 2016, 2017, and 2018, and extremely low (<300 mm) in 1962, 1973, 1978, 1980, 1990, and 2001. Moreover, river runoff was more than 400 mm in 1989, 2005, 2012, 2016, 2017, and 2018. Similar to other studies (Qu, 1994; Qin and Huang, 1998; Li et al., 2007), this study also found that precipitation and river runoff have a significant correlation, with a correlation coefficient of R = 0.82 and p < 0.01 (Figure 7A). The correlation analyses suggest that the changes in precipitation, especially in the summer, directly impact hydrological processes through river discharge and lake water level in Qinghai Lake, as summer rainfall accounts for a large proportion of annual precipitation in the TP (Wu et al., 2019). Furthermore, summer precipitation has significant impact on lake water level change on different time scales (Duo et al., 2009; Jin et al., 2010; Lee et al., 2011). Recent studies on lake water storage changes (Yao et al., 2018; Treichler et al., 2019) also revealed that a continual increase in precipitation has sustained rising lake water levels, expansion of lake areas, and growth of lake water storage.
The rising lake water level and expanding lake area suggest the presence of an enhanced hydrological cycle in the TP (Zhang et al., 2020). The significant positive correlation between precipitation and lake water level indicated that the increase in precipitation in the Qinghai Lake basin is beneficial to the rise of lake water level. This study clearly reveals the linkage and process between precipitation and lake water level change, especially the positive feedback on lake water level lift owing to extreme runoff caused by extreme precipitation. However, linkage between climate warming and lake water level is much more complex. In general, temperature increasing will not only intensify water loss (e.g., higher evaporation) but will also increase water gain (e.g., higher permafrost degradation and snow/glacier melting rate). Qinghai Lake has a closed lake basin geometry with no outflow, meaning precipitation and meltwater from snow/glacier melting and permafrost degradation may contribute additional water to the lake. There are large areas of permafrost and seasonally frozen ground, accounting for 83% of the total area of the Qinghai Lake basin (Zou et al., 2017; Cao et al., 2019). The distribution of permafrost has a certain influence on the hydrological process of the basin, and the freezing and thawing processes of the active layer over permafrost and seasonally frozen ground could have an important role in the hydrological cycle in the TP (Zhao et al., 2019; Zhang et al., 2008; Zhang, 2012; Liu et al., 2009; Li et al., 2020; Peng et al., 2020). Therefore, the contributions of precipitation in upstream areas, evaporation, river runoff, permafrost degradation, melt water from glaciers, and human activities needs further research under climate warming in the Qinghai Lake basin.
Changes in water level/area and environmental parameters in the Qinghai Lake basin were investigated using ground-based measurements and satellite remote sensing data from 1961 through 2019. The results demonstrated that the lake water level changes could be split into two phases: a decreasing phase (1961–2004) and an increasing phase (2004–2019). The lake water level decreased at an average rate of 0.80 m/decade from 1961 to 2004, and then increased persistently and dramatically at an average rate of 1.80 m/decade from 2004 to 2019. The longest period of continuous uplift in the lake water level since 1961 was the 15 years from 2004 to 2019. The lake water area increased between 1990 and 2019, with average rates of 44.70 km2/decade and 47.80 km2/decade for April and September, respectively; however, since 2004, the increases have been more significant, with average rates of 174.5 0 km2/decade for April and 182.70 km2/decade for September. There was a strong warming tendency and a weak increasing tendency in precipitation and air temperature from 1961 to 2019, but since 2004 annual precipitation has increased rapidly with a trend of 62.40 mm/decade. Annual river runoff tended to decrease from 1961 to 2004 at an average rate of −7.00 mm/decade, and generally exhibited a marked increase during 2004–2019 at average rate of 85 mm/decade. The variation process of evaporation is not a continuous decline, but presents a fluctuating change. The changes in precipitation, river runoff, and evaporation in the lake basin strongly affected the lake water level, and lake water level was significantly positively correlated to precipitation and river runoff and negatively correlated to evaporation.
It is clear that changes in Qinghai Lake hydrology depends mainly on climatic factors, especially precipitation and river runoff. Precipitation, river runoff, and evaporation had direct impacts on the lake, while climatic factors such as air temperature had indirect effects on the lake. Precipitation and river runoff had significantly positive effects on lake water level, while conversely, evaporation negatively impacted lake water level. Variations in precipitation directly impact hydrological processes through river discharge and lake water level in Qinghai Lake. The linkage and process of precipitation change, particularly extreme events, and the impact on river runoff and water level variation was clear. The tendency towards a warmer–drier climate might be the main reason for the observed decrease in lake water level during the first phase. The recent continuous increase in lake water level during the second phase may be attributed to enough precipitation, and abundant runoff from snow/glacier and permafrost melt as a result of climate warming in the Qinghai Lake basin. As a sensitive indicator of regional climate change, the fluctuations of lake water level and lake surface area provide a comprehensive reflection of climate change in the Qinghai Lake basin.
The raw data supporting the conclusion of this article will be made available by the authors, without undue reservation.
XL collected data, conducted preliminary studies, and prepared draft manuscript; TZ designed and supervised the research; DY, GW, ZH, and LL participated to conduct field work and collect data. All co-authors participated writing and revising the manuscript.
This study was supported by The National Natural Science Foundation of China (Grant No. 41961012), West Light Foundation of The Chinese Academy of Sciences (Grant No. 2020-1-1) and The Second Tibetan Plateau Scientific Expedition and Research (STEP) program (Grant No. 2019QZKK0106).
We thank CMA (http://cdc.cma.gov.cn/) for providing the air temperature and precipitation datasets. We would like to thank Associate Editor and three reviewers for their suggestions.
The authors declare that the research was conducted in the absence of any commercial or financial relationships that could be construed as a potential conflict of interest.
All claims expressed in this article are solely those of the authors and do not necessarily represent those of their affiliated organizations, or those of the publisher, the editors and the reviewers. Any product that may be evaluated in this article, or claim that may be made by its manufacturer, is not guaranteed or endorsed by the publisher.
Adrian, R., O'Reilly, C. M., Zagarese, H., Baines, S. B., Hessen, D. O., Keller, W., et al. (2009). Lakes as sentinels of climate change. Limnol. Oceanogr. 54, 2283–2297. doi:10.4319/lo.2009.54.6_part_2.2283
Allen, R., Pereia, L., Raes, D., and Smith, M. (1998). Crop evapotranspiration- guidelines for computing crop water requirements–FAO irrigation and drainage Paper 56. FAO Rome 300, D05109
An, W., Hou, S., Zhang, Q., Zhang, W., Wu, S., Xu, H., et al. (2017). Enhanced recent local moisture recycling on the northwestern Tibetan Plateau deduced from ice core deuterium excess records. J. Geophys. Res. Atmos. 122, 12541–12556. doi:10.1002/2017jd027235
Cai, Y., Ke, C., Li, X., Zhang, G., Duan, Z., and Lee, H. (2019). Variations of lake ice phenology on the Tibetan plateau from 2001 to 2017 based on MODIS data. J. Geophys. Res. Atmos. 124 (2), 825–843. doi:10.1029/2018jd028993
Cao, B., Zhang, T., Wu, Q., Sheng, Y., Zhao, L., and Zou, D. (2019). Permafrost zonation index map and statistics over the Qinghai-Tibet Plateau based on field evidence. Permafr. Periglac Process 30, 178–194. doi:10.1002/ppp.2006
Chen, Q., Liu, W., and Huang, C. (2022). Long-term 10 m resolution water dynamics of Qinghai Lake and the driving factors. Water 14 (14), 671. doi:10.3390/w14040671
Colman, S. M., Yu, S., An, Z., Shen, J., and Henderson, A. (2007). Late cenozoic climate changes in China's Western interior: A review of research on lake Qinghai and comparison with other records. Quat. Sci. Rev. 26 (17-18), 2281–2300. doi:10.1016/j.quascirev.2007.05.002
DeRy, S. J. (2005). Decreasing river discharge in northern Canada. Geophys. Res. Lett. 32, L10401. doi:10.1029/2005gl022845
Dong, H., Song, Y., and &Zhang, M. (2019). Hydrological trend of Qinghai Lake over the last 60 years: Driven by climate variations or human activities? J. Water Clim. Change 10 (3), 524–534. doi:10.2166/wcc.2018.033
Duo, B., Baciren, B., Ba, L., Wang, C., and Chen, T. (2010). The response of water level of Selin Co to climate change during 1975-2008. Acta Geogr. Sin. 65 (3), 313–319.
Duo, B., Baciren, B., Lin, L., Wei, W., and Zhaxi, Y. (2009). The response of lake change to climate fluctuation in north Qinghai-Tibet plateau in last 30 years. J. Geogr. Sci. 19 (2), 131–142. doi:10.1007/s11442-009-0131-z
Fang, J., Li, G., Rubinato, M., Ma, G., Zhou, J., Jia, G., et al. (2019). Analysis of long-T erm water level V ariations in Qinghai Lake in China. Water 11, 2136. doi:10.3390/w11102136
Gao, Y., Leung, L. R., Zhang, Y., and Cuo, L. (2015). Changes in moisture flux over the Tibetan plateau during 1979–2011: Insights from a high-resolution simulation. J. Clim. 28, 4185–4197. doi:10.1175/jcli-d-14-00581.1
IPCC (2013). Climate change 2013: The physical science basis:contribution of working group I to the fifth assessment report of the intergovernmental panel on climate change[M]. Cambridge: UK: Cambridge University Press.
IPCC (2021). Climate change 2021: The physical science basis: Future global climate: scenario-42 based projections and near-term information. Cambridge: Cambridge University Press, 1–195.
Jia, W., He, Y., Wang, X., and Li, Z. (2009). Temporal and spatial change of the potential evaporation over Qilian mountains and Hexi corridor from 1960 to 2006. Adv. Water Sci. 20 (3), 159–167.
Jin, Z., You, C., Wang, Y., and Shi, Y. (2010). Hydrological and solute budgets of Lake Qinghai, the largest lake on the Tibetan plateau. Quat. Int. 218 (1-2), 151–156. doi:10.1016/j.quaint.2009.11.024
Krasovskaia, I. (1995). Quantification of the stability of river flow regimes. Hydrological Sci. J. 40 (5), 587–598. doi:10.1080/02626669509491446
Kropáček, J., Braun, A., Kang, S., Feng, C., Ye, Q., and Hochschild, V. (2012). Analysis of lake level changes in Nam Co in central Tibet utilizing synergistic satellite altimetry and optical imagery. Int. J. Appl. Earth Observation Geoinformation 17, 3–11. doi:10.1016/j.jag.2011.10.001
Lee, H., Shum, C. K., Tseng, K., Guo, J. Y., and Kuo, C. Y. (2011). Present-day lake level variation from Envisat altimetry over the northeastern Qinghai-Tibetan plateau: Links with precipitation and temperature. Terr. Atmos. Ocean. Sci. 22 (2), 169–175. doi:10.3319/tao.2010.08.09.01(tibxs)
Lehner, B., and Döll, P. (2004). Development and validation of a global database of lakes, reservoirs and wetlands. J. Hydrology 296 (1-4), 1–22. doi:10.1016/j.jhydrol.2004.03.028
Lei, Y., Yao, T., Bird, B. W., Yang, K., Zhai, J., and Sheng, Y. (2013). Coherent lake growth on the central Tibetan plateau since the 1970s: Characterization and attribution. J. Hydrology 483, 61–67. doi:10.1016/j.jhydrol.2013.01.003
Li, F., Li, L., and Shen, F. (2004). Evolution of lakeshore shape of Qinghai Lake and its causes. Resour. Sci. 26 (1), 38–44.
Li, J., Yuan, Y., and You, X. (2000). Research and application of tree-ring hydrology. Beijing: Science Press, 115–116.
Li, J., Wang, W., Wang, D., Li, J., and Jie, D. (2020). Hydrochemical and stable isotope characteristics of lake water and groundwater in the Beiluhe basin, Qinghai-Tibet Plateau. Water 12 (8), 2269. doi:10.3390/w12082269
Li, L., Yang, S., Wang, Z., Zhu, X., and Tang, H. (2010). Evidence of warming and wetting climate over the qinghai-tibet plateau. Antarct. Alp. Res. 42 (4), 449–457. doi:10.1657/1938-4246-42.4.449
Li, X., Xu, H., Sun, Y., Zhang, D. S., and Yang, Z. P. (2007). Lake-level change and water balance analysis at Lake Qinghai, west China during recent decades. Water Resour. Manag. 21 (9), 1505–1516. doi:10.1007/s11269-006-9096-1
Liu, B., Xu, M., Henderson, M., and Gong, W. (2004). A spatial analysis of pan evaporation trends in China, 1955–2000. J. Geophys. Res. Atmos. 109 (D15), D15102. doi:10.1029/2004jd004511
Liu, J., WangYu, S. S., Yang, D., and Zhang, L. (2009). Climate warming and growth of high-elevation inland lakes on the Tibetan Plateau. Glob. Planet. Change 67, 209–217. doi:10.1016/j.gloplacha.2009.03.010
Liu, X., Lai, Z., Madsen, D., Yu, L., Liu, K., and Zhang, J. (2011). Lake level variations of Qinghai lake in northeastern Qinghai-Tibetan plateau since 3.7 ka based on OSL dating. Quat. Int. 236 (1-2), 57–64. doi:10.1016/j.quaint.2010.08.009
Ma, N., Szilagyi, J., Niu, G., Zhang, Y., Zhang, T., Wang, B., et al. (2016). Evaporation variability of Nam Co Lake in the Tibetan Plateau and its role in recent rapid lake expansion. J. Hydrol. 537, 27–35. doi:10.1016/j.jhydrol.2016.03.030
McFeeters, S. K. (1996). The use of the normalized difference water index (NDWI) in the delineation of open water features. Int. J. Remote Sens. 17, 1425–1432. doi:10.1080/01431169608948714
Otsu, N. (1979). A threshold selection method from gray-level histograms. IEEE Trans. Syst. Man. Cybern. 9, 62–66. doi:10.1109/tsmc.1979.4310076
Pekel, J.-F., Cottam, A., Gorelick, N., and Belward, A. S. (2016). High-resolution mapping of global surface water and its long-term changes. Nature 540, 418–422. doi:10.1038/nature20584
Peng, X., Zhang, T., Frauenfeld, O. W., Wang, S., Qiao, L., Du, R., et al. (2020). Northern Hemisphere greening in association with warming permafrost. J. Geophys. Res. Biogeosciences 125 (1). doi:10.1029/2019jg005086
Qin, B., and Huang, Q. (1998). Evaluation of the climatic change impacts on the inland lake – A case study of lake Qinghai, China. Clim. Change 39, 695–714. doi:10.1023/a:1005319616456
Qu, Y. (1994). Water balance and forecasting of water level change in Qinghai Lake. J. Lake Sci. 6 (4), 298–307. doi:10.18307/1994.0402
Roderick, M. L., and Farquhar, G. D. (2002). The cause of decreased pan evaporation over the past 50 years. Science 298 (5597), 1410–1411. doi:10.1126/science.1075390-a
Shen, J., Liu, X., Wang, S., and Matsumoto, R. (2005). Palaeoclimatic changes in the Qinghai lake area during the last 18,000 years. Quat. Int. 136, 131–140. doi:10.1016/j.quaint.2004.11.014
Sheng, Y ., Song, C., Wang, J., Lyons, E. A., Knox, B. R., Cox, J. S., et al. (2016). Representative lake water extent mapping at continental scales using multi-temporal Landsat-8 imagery. Remote Sens. Environ. 185, 129–141. doi:10.1016/j.rse.2015.12.041
Sun, Y., Li, X., Liu, L., Xu, H., and Zhang, D. (2008). Climate change and sandy land development in Qinghai lake watershed, China. Front. Environ. Sci. Eng. China 2 (3), 340–348. doi:10.1007/s11783-008-0045-5
Treichler, D., Kääb, A., Salzmann, N., and Xu, C. Y. (2019). Recent glacier and lake changes in High Mountain Asia and their relation to precipitation changes. Cryosphere 13 (11), 2977–3005. doi:10.5194/tc-13-2977-2019
Verpoorter, C., Kutser, T., Seekell, D. A., and Tranvik, L. J. (2014). A global inventory of lakes based on high-resolution satellite imagery. Geophys Res. Lett. 41, 6396–6402. doi:10.1002/2014GL060641
Wang, B., Bao, Q., Hoskins, B., Wu, G., and Liu, Y. (2008). Tibetan plateau warming and precipitation changes in East Asia. Geophys. Res. Lett. 35 (L14702), L14702. doi:10.1029/2008GL034330
Wang, B., Ma, Y., Wang, Y., Su, Z., and Ma, W. (2019). Significant differences exist in lake atmosphere interactions and the evaporation rates of high-elevation small and large lakes. J. Hydrol. 573, 220–234. doi:10.1016/j.jhydrol.2019.03.066
Wang, X., Gong, P., Zhao, Y., Xu, Y., Cheng, X., Niu, Z., et al. (2013). Water-level changes in China's large lakes determined from ICESat/GLAS data. Remote Sens. Environ. 132, 131–144. doi:10.1016/j.rse.2013.01.005
Wu, Y., Huang, A., Yang, B., Dong, G., Wen, L., La, Z., et al. (2019). Numerical study on the climatic effect of the lake clusters over Tibetan Plateau in summer. Clim. Dyn. 53 (9-10), 5215–5236. doi:10.1007/s00382-019-04856-4
Xu, H., Hou, Z., Ai, L., and Tan, L. (2007). Precipitation at Lake Qinghai, ne Qinghai–Tibet plateau, and its relation to Asian summer monsoons on decadal/interdecadal scales during the past 500 years. Palaeogeogr. Palaeoclimatol. Palaeoecol. 254 (3-4), 541–549. doi:10.1016/j.palaeo.2007.07.007
Xu, Z. X., Gong, T. L., and Li, J. Y. (2008). Decadal trend of climate in the Tibetan plateau—Regional temperature and precipitation. Hydrol. Process. 22, 3056–3065. doi:10.1002/hyp.6892
Yang, D., Ye, B., and Shiklomanov, A. (2004). Discharge characteristics and changes over the Ob river watershed in Siberia. J. Hydrometeorol. 5, 595–610. doi:10.1175/1525-7541(2004)005<0595:dcacot>2.0.co;2
Yang, Z., Ou, Y., Xu, X., Zhao, L., Song, M. h., and Zhou, C. p. (2010). Effects of permafrost degradation on ecosystems. Acta Ecol. Sin. 30 (1), 33–39. doi:10.1016/j.chnaes.2009.12.006
Yao, F., Wang, J., Yang, K., Wang, C., Walter, B. A., and Cretaux, J. F. (2018). Lake storage variation on the endorheic Tibetan Plateau and its attribution to climate change since the new millennium. Environ. Res. Lett. 13 (6), 064011. doi:10.1088/1748-9326/aab5d3
Yao, T., Pu, J., Lu, A., Wang, Y., and Yu, W. (2007). Recent glacial retreat and its impact on hydrological processes on the Tibetan Plateau, China, and surrounding regions. Arct. Antarct. Alp. Res. 39 (4), 642–650. doi:10.1657/1523-0430(07-510)[yao]2.0.co;2
Yi, W., Li, X., Cui, B., and Ma, Y. (2010). Climate change and impact on water level of the Qinghai lake watershed. Arid. Meteorol. 28 (4), 375–383.
Zhang, C., Tang, Q., Chen, D., van der Ent, R. J., Liu, X., Li, W., et al. (2019b). Moisture source changes contributed to different precipitation changes over the Northern and Southern Tibetan Plateau. J. Hydrometeorol. 20, 217–229. doi:10.1175/jhm-d-18-0094.1
Zhang, G., Chen, W., and Xie, H. (2019a). Tibetan Plateau’s lake level and volume changes from NASA’s ICESat/ICESat-2 and Landsat missions. Geophys. Res. Lett. 46 (22), 13107–13118. doi:10.1029/2019gl085032
Zhang, G., Luo, W., Chen, W., and Zheng, G. (2019c). A robust but variable lake expansion on the Tibetan Plateau. Sci. Bull. 64 (18), 1306–1309. doi:10.1016/j.scib.2019.07.018
Zhang, G., Xie, H., Kang, S., Yi, D., and Ackley, S. F. (2011). Monitoring lake level changes on the Tibetan Plateau using icesat altimetry data (2003–2009). Remote Sens. Environ. 115 (7), 1733–1742. doi:10.1016/j.rse.2011.03.005
Zhang, G., Xie, H., Yao, T., Li, H., and Duan, S. (2014a). Quantitative water resources assessment of Qinghai lake basin using snowmelt runoff model (SRM). J. Hydrology 519, 976–987. doi:10.1016/j.jhydrol.2014.08.022
Zhang, G., Yao, T., Xie, H., Qin, J., Ye, Q., Dai, Y., et al. (2014b). Estimating surface temperature changes of lakes in the Tibetan Plateau using MODIS LST data. J. Geophys. Res. Atmos. 119 (14), 8552–8567. doi:10.1002/2014jd021615
Zhang, G., Yao, T., Xie, H., Yang, K., Zhu, L., Shum, C., et al. (2020). Response of Tibetan Plateau lakes to climate change: Trends, patterns, and mechanisms. Earth-Science Rev. 208, 103269. doi:10.1016/j.earscirev.2020.103269
Zhang, T., Barry, R. G., Knowles, K., Heginbottom, J. A., and Brown, J. (2008). Statistics and characteristics of permafrost and ground-ice distribution in the Northern Hemisphere. Polar Geogr. 31 (1), 47–68. doi:10.1080/10889370802175895
Zhang, T. (2012). Progress in global permafrost and climate change studies. Quat. Sci. 32 (1), 27–38.
Zhao, L., Hu, G., Zou, D., Wu, X., Ma, L., Sun, Z., et al. (2019). Permafrost changes and its effects on hydrological processes on Qinghai-Tibet Plateau. Bulletin of Chinese Academy of Sciences 34 (11), 1233–1246.
Keywords: lake water level, lake area, water balance, climate change, Qinghai Lake
Citation: Li X, Zhang T, Yang D, Wang G, He Z and Li L (2023) Research on lake water level and its response to watershed climate change in Qinghai Lake from 1961 to 2019. Front. Environ. Sci. 11:1130443. doi: 10.3389/fenvs.2023.1130443
Received: 23 December 2022; Accepted: 30 January 2023;
Published: 14 February 2023.
Edited by:
Jing Luo, Northwest Institute of Eco-Environment and Resources (CAS), ChinaReviewed by:
Lei Guo, Cold and Arid Regions Environmental and Engineering Research Institute (CAS), ChinaCopyright © 2023 Li, Zhang, Yang, Wang, He and Li. This is an open-access article distributed under the terms of the Creative Commons Attribution License (CC BY). The use, distribution or reproduction in other forums is permitted, provided the original author(s) and the copyright owner(s) are credited and that the original publication in this journal is cited, in accordance with accepted academic practice. No use, distribution or reproduction is permitted which does not comply with these terms.
*Correspondence: Xiaodong Li, NTUwMzgxbHhkQDE2My5jb20=
†Deceased, January 2022
Disclaimer: All claims expressed in this article are solely those of the authors and do not necessarily represent those of their affiliated organizations, or those of the publisher, the editors and the reviewers. Any product that may be evaluated in this article or claim that may be made by its manufacturer is not guaranteed or endorsed by the publisher.
Research integrity at Frontiers
Learn more about the work of our research integrity team to safeguard the quality of each article we publish.