 Yipeng Yao1,2†
 Yuhong Liu
94% of researchers rate our articles as excellent or good
Learn more about the work of our research integrity team to safeguard the quality of each article we publish.
Find out more
ORIGINAL RESEARCH article
Front. Environ. Sci., 24 March 2023
Sec. Toxicology, Pollution and the Environment
Volume 11 - 2023 | https://doi.org/10.3389/fenvs.2023.1128303
This article is part of the Research TopicBiodiversity Protection and Pollution Control on the Mongolian PlateauView all 7 articles
The Daihai Lake, the third largest lake in Inner Mongolia Autonomous Region, is the cornerstone to maintain the ecosystem balance in this region, which is facing some problems including size shrinking, water quality declining and biodiversity decreasing largely in recent years. In order to quantify the N purification amount of submerged plants, Stella software was used in this study to construct a nitrogen dynamic model to simulate the nitrogen cycle process in the Daihai Lake and the participation of submerged plants in this cycle process. The results showed that based on the submerged plant growth area in 2019 in the Daihai Lake, the N uptake by submerged plants this year was 5.13t, accounting for 4.8% of all exogenous pollution (107.895t), Moreover, our model also predicted that the purification capacity of the restored submerged plants with a large area of 9.91 km2 in the Daihai Lake was significantly higher than before restoration. And the N pollution load of 107.892t in the Daihai Lake could be purified by this stored pattern in 12 years, while during this process a regular cleaning of submerged plant residues was required. Therefore, only large area restoration of submerged plant would benefit for improving water quality.
The Daihai Lake is located in Ulanqab City, Inner Mongolia Autonomous Region, which is located in the transitional zone of semi-humid and semi-arid (Yunkai et al., 2006). It is a typical inland lake on the Mongolian Plateau, and an important barrier to maintain the ecological balance of the Mongolian Plateau. It is of great significance to maintain regional groundwater stability, atmospheric humidity, and curb desertification of the surrounding grassland (Zhou and Jia, 2009). In recent years, due to the interaction of human activities and climate change, some problems such as shrinking lake surface, decreasing water volume, increasing eutrophication and decreasing ecological diversity have gradually occurred in Daihai lake. Moreover, algal blooms, vanishing fish and a decline in submerged plant species are further aggravating the deterioration of the lake’s ecosystem (Shen et al., 2001; Liang et al., 2021). Nitrogen is an important indicator of pollution monitoring and eutrophication in lakes in the Mongolian Plateau (Huang et al., 2020), and then one of the most vital elements required for the growth of submerged plants (Zixian et al., 2011; Chen et al., 2013). Submerged plants can absorb a large amount of nitrogen from water during their growth, which play an excellent role in purifying water quality (Wu and Zhao, 2015). The nitrogen cycle in shallow lakes is relatively complex, and some relevant mathematical models can quantitatively analyze the nitrogen flow in lakes (Small et al., 2014; Wu et al., 2018). At present, the widely used nitrogen cycle models include WAPS model (Wang, 2022), Monod model (Saeed and Sun, 2011), CW2D model (Langergraber et al., 2009), etc., These models have strong analytical ability, while their structures are very complex and difficult to popularize and apply in the Daihai lake. Stella software with a friendly user interface can quickly transform the nitrogen cycle concept map into a model and also support the input of various kinetic formulas (Costanza et al., 1998; Mecca et al., 2004). At present, most of the models to describe the nitrogen cycle constructed by Stella software are mainly applied to study the mechanism of nitrogen removal of wetland plants based on the law of conservation of mass (Mayo et al., 2018; Dong et al., 2020), which show the nitrogen removal effects of plants on wetland restoration.
It is generally realized that two alternative states exist in the shallow lakes with average depth less than 3 m, which include a clear-water state dominated by macrophytes and a turbid water state dominated by phytoplankton (Moss et al., 1990; Van den Berg et al., 1996; Scheffer et al., 2003; Scheffer and Jeppesen, 2007), and a transition may occur between the two states under a special level of nutrient loading (Janse, 1997). Presently, a considerably general improvement in water quality, by bio-manipulation over the past decades, is witnessed in the shallow lakes, as induced the big growth area of submerged plant. The restoration of submerged plants is of great significance to the treatment of lake eutrophication, and a reasonable restoration area of submerged plants is a key step to solve the eutrophication of the Daihai Lake. Therefore, in this paper, an ecological dynamics model was established by Stella software to simulated the nitrogen cycling process including nitrification, mineralization, denitrification, diffusion and plant assimilation as well as litter decomposition after submerged plant death in the Daihai Lake and focused on the following goals: 1) To determine annual N purification amount before and after recovery of submerged plants. 2) To predict the purification time of pollution load by submerged plant under the assumption of constant external input.
The Daihai Lake (40°32′-40 36′N, 112 37'−112° 45′E) is a typical inland closed saline lake in the central and southern Mongolian Plateau and located in a temperate semi-arid region (Figure 1). The rivers entering the Daihai Lake are seasonal rivers, which flow into the Daihai Lake in rainy summer and cut off in winter. The average annual temperature is 5.1°C.
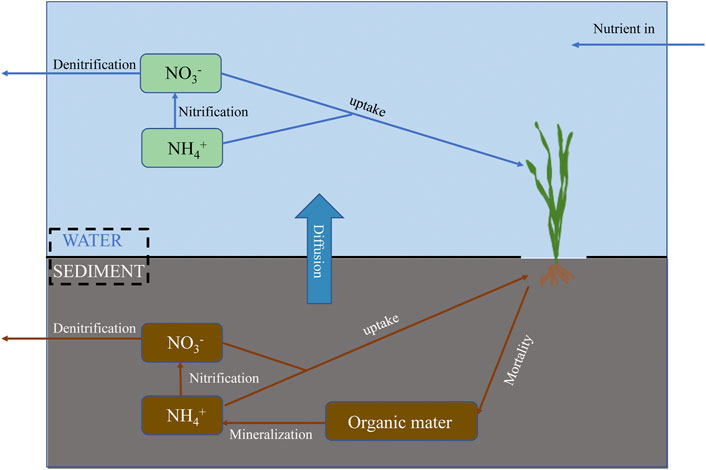
FIGURE 1. Model Concept map.
The state variables in the model are mainly about different nitrogen contents in the lake and plants, which are shown in Figure 1. These state variables are connected to each other by the flow of nitrogen. This model is divided into three parts based on nitrogen state variables and related parameters (Table 1) including nitrogen transformations in water and soil, submerged plant growth processes and the effects of temperature on some processes. The nitrogen transformation module simulates the processes of nitrification, denitrification and the diffusion of nitrogen from the sediment to the water, as well as the effect of exogenous pollution on nitrogen concentrations in water column. The submerged plant growth module described plant growth by its photosynthesis and absorption of nutrients from water and soil. The effects of temperature on a number of nitrogen transformation processes are obtained by the temperature effect module.

TABLE 1. The parameters and constants in the model.
The state variables in the model include ammonia nitrogen content in water (Eq 1), nitrate nitrogen content in water (Eq 2), ammonia nitrogen content in soil (Eq 3), nitrate nitrogen content in soil (Eq 4), nitrogen content of plant carcasses located in the above ground portion (Eq 5), nitrogen content of plant carcasses located in the below ground portion (Eq 6), and nitrogen content stored in plants (Eq 7). The parameters that appear in the equations are detailed in Table 1.
The Eq 1 for the state variable representing the amount of ammonia nitrogen in the water is as follows:
where NH4_W represents the concentration of ammonia in water; in1, le, di1, niw and up1 represent the increase in ammonia concentration in water due to surface pollution, and the leaching rate, diffusion rate, nitrification rate in water, and the rate of ammonia uptake by plants, respectively. The leaching rate, ammonia diffusion rate and nitrification rate are all simulated using first-order reaction kinetics (Martin and Reddy, 1997; van der Peijl and Verhoeven, 1999; Huang et al., 2020; Wang, 2022), as shown in Eqs 1b–d.
The Eq 2 for the state variable representing the nitrate-nitrogen content of the water is as follows:
where NO3_W is the concentration of nitrate-nitrogen in water; In 2 represents the increase in nitrate-nitrogen concentration in water brought about by surface source pollution, similar to that produced by surface source pollution in Eq 1, with the introduction of a time-step function Tk, which, according to the actual situation in Daihai (Chapter 4.1), reinforces the effect of seasonal changes on the state variables in the model (Zheng and Men, 2020), as detailed in Eq 1a, Eq 2a.
where up2, di2 and dnw represent the rate of nitrate nitrogen uptake by plants, which are the rate of nitrate nitrogen diffusion and the rate of denitrification (Boyd, 1970; van der Peijl and Verhoeven, 1999; Wang, 2022),respectively. The nitrate diffusion rate and denitrification rate are simulated using first-order reaction kinetics, as detailed in Eqs 2b, c.
The Eq 3 for the state variable representing the amount of ammonia nitrogen in the sediment is as follows:
where NH4_S is the concentration of ammonia nitrogen in the sediment; dec, up3 and nis represent the rate of mineralisation, the rate of ammonia nitrogen uptake by plants, and the rate of nitrification in the sediment, respectively. The mineralization rate was simulated using first-order kinetics (Mayo et al., 2018), and the nitrification in the sediment introduced the effect of dissolved oxygen on the rate (Brown and Barnwell, 1987; Brix et al., 2002). as detailed in Eqs 3a, b
The Eq 4 for the state variable representing the nitrate-nitrogen content of the sediment is as follows:
Where NO3_S is the concentration of nitrate nitrogen in the sediment mg/L; up4 and dns are the rate of nitrate nitrogen uptake by plants and denitrification rate respectively. Denitrification rates were simulated using first-order reaction kinetics (Ying et al., 2009), as detailed in Eq 4a.
The state variables representing the nitrogen content of the plant carcasses were divided into an above-ground and below-ground fraction, with the following Eqs 5, 6.
where N_LITTER_S and N_LITTER_W represent plant residues in sediment and water, respectively, and desh, frw, dero and fes represent the rate of nitrogen reduction in submerged plants and the rate of decomposition of submerged plant residues due to submerged plant mortality (van der Peijl and Verhoeven, 1999; Zhang et al., 2003; Gao et al., 2018), respectively, as detailed in Eq 5a, Eq 6a, Eq 5b, Eq 6b
Equation 7 for the state variable representing the nitrogen content of submerged plants per unit area is as follows.
Where N_plant represents the nitrogen content of submerged plants (Nmg/L), and up2, up1, up3 and up4 represent the rates at which submerged plants absorb ammonia and nitrate nitrogen from water and soil, respectively. Considering the relationship between plant growth rate and required nutrients, and considering the growth mechanism, the growth rate of a plant can be expressed by the photosynthetic rate of a plant, that is, the rate at which a plant absorbs solar radiation for photosynthesis and converts it into its own biomass (Eqs 8, 9) (Mankin and Fynn, 1996; Ahn and Mitsch, 2002; Brix et al., 2002; McAndrew and Ahn, 2017). The specific equation is as follows: Eqs 7a–d.
In order to make the rate of most of the reactions in the model change with the season, temp_airK, which can describe the annual temperature, is introduced in the model. The relationship between temperature and process rate used in the model (Eq 10) is based on the absolute reaction rate theory, but some parameter values are verified in this paper, so that the change of reaction rate is more in tune with the seasonal change (Schoolfield et al., 1981; van der Peijl and Verhoeven, 1999).
In 2019, 118 sampling sites were set up and corresponding samples were collected in the Daihai (Figure 2), which covered the entire lake area as much as possible in order to study the exogenous pollution in summer. Submerged plant samples were collected by a submerged plant collection rake and weighed on site. After returning to the laboratory, the samples were weighed after over-dried at 105°C for about 30 min and then dried to constant weight at 70°C, and grinded into powder for detection of total nitrogen, ammonia nitrogen and nitrate nitrogen contents. Water samples with a 0.5 m water depth were collected by using a water sample collector and a total of five indicators in them were measured: Turbidity, PH, dissolved oxygen content, and nitrate nitrogen, ammonia nitrogen and total nitrogen concentration. The total nitrogen, the ammonia nitrogen and the nitrate nitrogen concentrations were measured by SKALAR Continuous Flow Analyzer. Dissolved oxygen, Turbidity and PH were measured on site with a portable instrument. All measurements were made in accordance with standard methods (Rice et al., 2012). In addition, the area of submerged plants in the Daihai Lake used in this study were obtained from “Concluding Report on the Construction of Water Ecological Security Assessment and Management Decision Support System of One Lake and Two Seas”, and the meteorological data used were collected from the local meteorological stations.
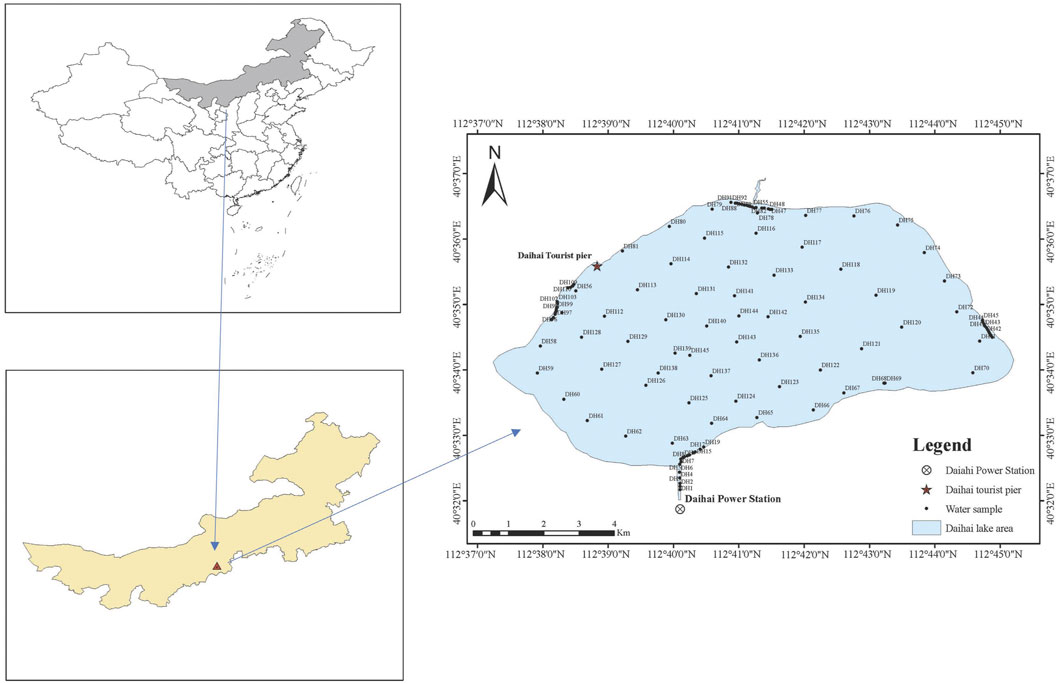
FIGURE 2. Location of the study area, transects and sampling points in Daihai Lake.
The calculation of the total nitrogen pollution load into Daihai Lake is divided into five main components: Rural living, livestock breeding, agricultural cultivation, atmospheric deposition, and soil erosion (Zheng and Men, 2020). According to the statistics of the Daihai watershed and related research literature, the rural population of the Daihai watershed in 2019 was 94,000 and the rural arable land was 63,000 hm2; and the livestock stock was 559,000, including 53,000 cattle, 500,000 sheep as well as 0.6 million pigs (Tang, 2021).
The formulae for calculating the total nitrogen pollution load for rural living, livestock breeding and agricultural cultivation is shown in Eq 11.
Where, W1 is the total nitrogen load into the lake, N1 is the quantity in the region (all livestock stock is converted into pigs for calculation, such that one cow is converted into five pigs, three sheep are converted into one pig). α1 is pollution production coefficient with 1.5g/(person*d) in rural domestic pollution, 1.27kg/(n*a) in livestock and 2.64 kg/(hm2*a) in farmland (Council, 2009). β1 is lake input coefficient with 0.15% for rural household pollution, 10% for livestock breeding pollution, and 7% for farmland pollution (Zhu, 2011).
The formula for calculating the total nitrogen pollution load from atmospheric deposition is expressed in Eq 12.
Where W2 is the total nitrogen load to the lake, A is the total area of the Daihai Lake, α2 is the atmospheric nitrogen deposition flux with 532.53kg/(km2*a) (Lu et al., 2015).
The formula for calculating the total nitrogen pollution load for soil erosion is described in Eq 13.
Where W3 is the total nitrogen load into the lake from soil erosion. SDR is the sediment transport ratio, which in China varies little between 0.1 and 0.4, and is taken as 0.25 (Jiang and Xi, 2011). X is the amount of soil erosion. C is the background content of nitrogen and phosphorus in the soil at 0.9 g/kg (Kalin and Hantush, 2006). η is the soil enrichment ratio of nitrogen (dimensionless). α3 is the coefficient of entry into the lake with 0.7% (Zhu, 2011).
Theil’s Inequality Coefficient (TIC) is used as the evaluation index of the calibration results of the evaluation model, which can be used to quantitatively describe the degree of coincidence between model simulation results and measured data and shown in Eq 14 (Min et al., 2010). TIC is generally between 0 and 1 and 0 represents a perfect fitting with the actual monitoring value. In general, when TIC is less than 0.5, it can be considered that the simulation value is in good agreement with the monitoring value. The concentrations of NO3 and NH4 in water were verified in our study.
Ci,sim is the model simulation value at time i; Ci,obs is the actual monitoring value at time i; n is the number of data points used for model verification.
The final calculated TIC of NH4 is 0.018 and TIC of NO3 is 0.25. This shows that the simulated values of the model are in good agreement with the measured values, and the calibration of the model is successful.
It was calculated that the N pollution load in the Daihai Lake in 2019 was 107.895t (Figure 3), which were mainly contributed by soil erosion, atmospheric deposition, agricultural cultivation, livestock breeding and rural living and carried by rivers into the lake. Among the pollution source, livestock raising was the largest contributor of the total N pollution load, which produced 52.44 tN pollution load accounting for 48.6% of the total annual N pollution load. Rural life was the least contributor of the total N pollution load with 0.055t, which only occupied 0.05% of the annual total N. These implied that external pollution would being the main pressures in the lake ecosystem health.
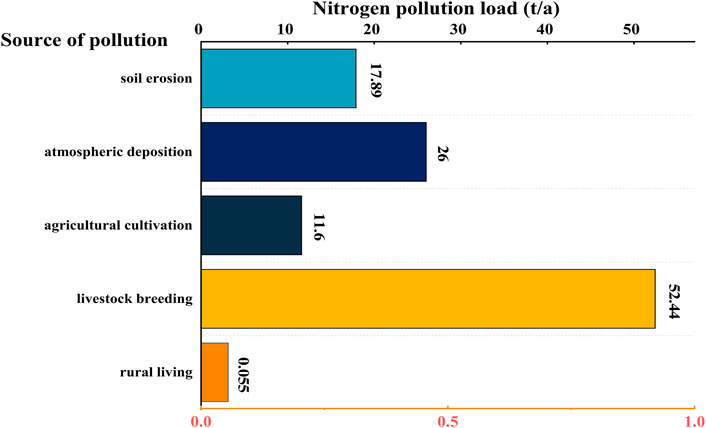
FIGURE 3. Pollution load calculation results.
Based on Figure 4A, it can be seen that the NH4+-N and NO3−-N contents in the water column of the Daihai Lake increased more rapidly after July, reached a maximum and then decreased after October, which was confirmed by the measured data, because of exogenous pollution entering the lake by rivers in summer. NH4+-N and NO3−-N contents in the soil column of the Daihai Lake were higher in the dry season than in the wet season, and this was possible for N absorption by plants in the wet season.
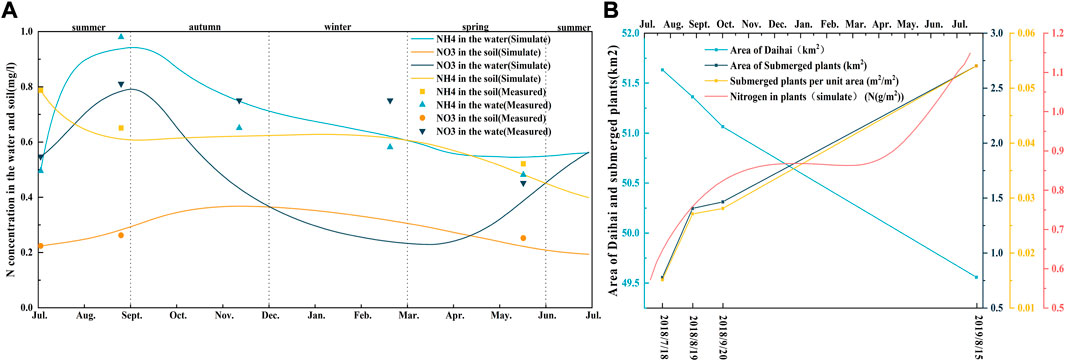
FIGURE 4. Varification of model (A) Verification of nitrogen concentration (B) Verification of submerged plant area.
The N content of submerged plants relied on nutrient uptake from the water and soil. The N content of submerged plants per unit area could to some extent reflect the growth and quantity of submerged plants. According to Figure 4B, the area of the Daihai decreased continuously and the area of submerged plants increased constantly. By comparison, the nitrogen uptake rate of submerged plants was highest from May to July, with the rate gradually decreasing towards the end of August and gradually ceasing to grow from November.
In this study, the purification amount of submerged plants referred to the difference between the amount absorbed by submerged plants and released by the decomposition of death plant residues in water. Based on Figure 5A, the N absorption amount of submerged plants mainly occurred during the growing season from May to October. Due to a relatively simple mortality rate being positively correlated with the biomass of submerged plants, the N release amount of submerged plants was almost always in an increasing state except for the time of winter growth stagnation (Figure 5B). The variation trend of the N purification amount of submerged plants was almost similar to that of the N absorption amount of submerged plants, as gradually decreased from October to January and then gradually increased. And this N purification amount was negative in January because the N release amount was greater than the N absorption amount for submerged plants (Figure 5C). Therefore, the N purification capacity of submerged plants depended on the biomass of the submerged plants in this lake.
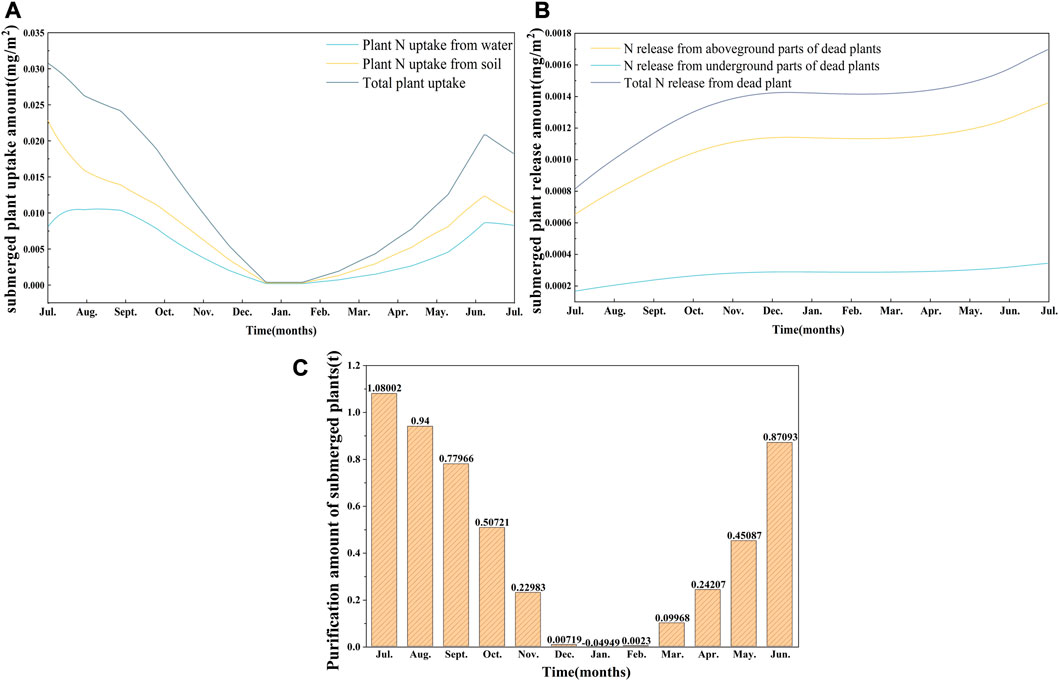
FIGURE 5. Simulation results from July 2019–July 2020 (A) Simulation results of submerged plants uptake amount. (B) Simulation results of submerged plant release amount. (C) Simulation results of submerged plant purification amount.
In this study, the expansion of submerged plant area and the decrease of turbidity in the Daihai Lake caused by increased submerged plant area were mainly considered in the ecological restoration of submerged plants in the Daihai Lake. In this model, the area of submerged plant restored from 4.95 km2 to 9.91 km2, and light utilization increased from 0.02 to 0.022. The variation trend of NO3− concentration in water column was similar before and after recovery, while the NO3− concentration after recovery was significantly lower than before recovery (Figure 6A). The concentrations of NH4+ before and after recovery gradually kept stable after the third year, and the NH4+ concentrations after recovery were lower than before recovery (Figure 6B).
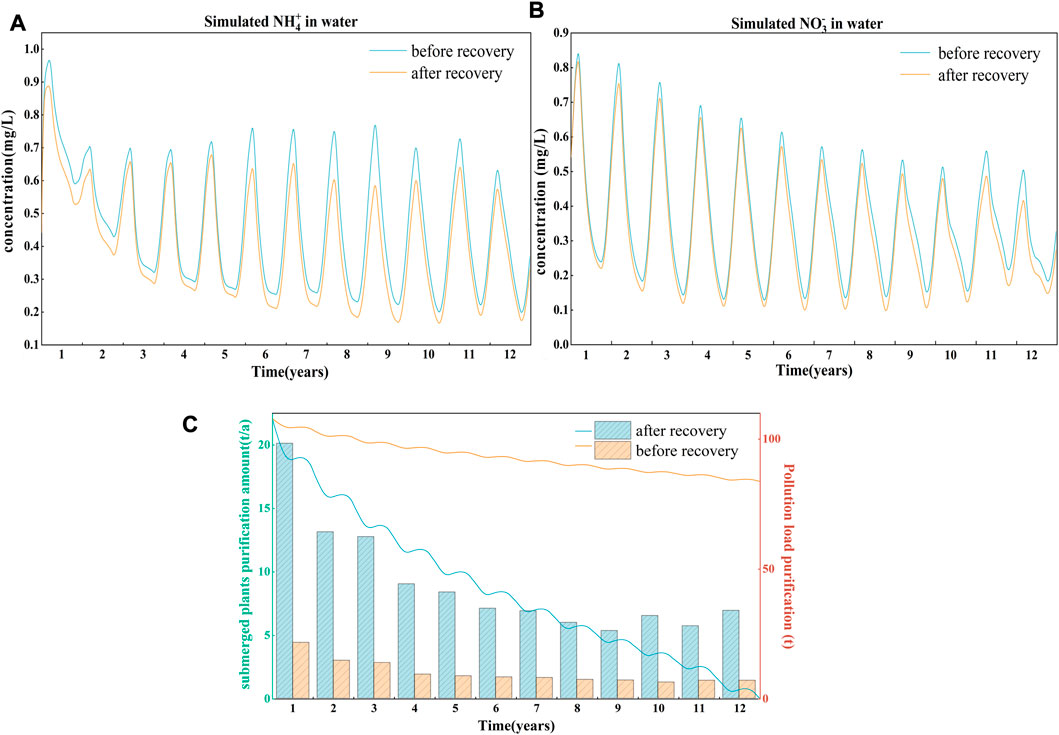
FIGURE 6. 12-year simulation results of before and after recovery (A) NO3+ concentration before and after recovery (B) NH4+ concentration before and after recovery (C) Pollution load reduction and annual purification of submerged plants.
In order to better compare the purification capacity of submerged plants before and after restoration, when the external non-point source N pollution load is only 107.895t, it can be seen that the restored submerged plants will spend 12 years on purifying 107.895t of N pollution load (Figure 6C). However, the purification speed of submerged plants before recovery is very slow, and the time required before recovery is much longer than after restoration. Under the two conditions, the annual purification amount of submerged plants decrease basically with time, which is basically consistent with the variations of N concentration in water column.
By comparison, the N pollution load of the Daihai Basin in 2019 calculated in this study was similar to that in 2017 referenced from the study of (Wu and Zhao, 2015). This indicated that non-point source pollution has been reduced to some extent in rural life, atmospheric subsidence and soil erosion. We found that the loss of population in the villages and towns around the Daihai Lake led to the reduction of N pollution load brought by rural life (Zheng and Men, 2020; Tang, 2021), with the decreasing of the Daihai Lake’s area year by year, the N pollution load caused by atmospheric subsidence would become reduction, and N pollution load caused by soil erosion also reduced for the depletion of river channels and the decrease of rainfall. However, because of increasing in farmland and livestock raised in the countryside, N pollution load from both agricultural cultivation and livestock raising would increase obviously (Tang, 2021), which was proved by our conclusion, too. Therefore, how to controlling N pollution load from both agricultural cultivation and livestock raising was important for the management of the Daihai Lake ecosystem.
In this study, due to the impact factors being complex and difficult to simulate perfectly in the model, we adopted some parameters from some references such that the growth of submerged plants was expressed by using the plant growth coefficient (Guan, 2021; Li et al., 2021), and a relatively simple mortality rate was used to calculate the N release amount of submerged plants (van der Peijl and Verhoeven, 1999). Therefore, the N release amount of submerged plants was positively correlated with the biomass of submerged plants, which would have a certain impact on annual purification amount of submerged plants. This also led to the amount of purification in the front growing season being higher than that in the back growing season.
The restoration of submerged plants would be realized by changing their area and light utilization efficiency. In this model, the area of submerged plants will affect the total amount of light absorbed by submerged plants, and the light utilization efficiency will affect the N absorption efficiency of submerged plants, which was very important for restoration of submerged plants. Because the growth of submerged plants was largely restricted by the water depth (Li et al., 2021), and the area suitable for submerged plant growth during the water depth less than 2.5 m in the Daihai Lake accounted for 23% of the lake area (Zhao et al., 2020), we chose 20 percent of the Daihai area (9.91 km2) to restore submerged plants. In addition, the turbidity of lake water in Daihai Lake would decrease due to the expansion of submerged plants, and the light utilization efficiency would be further improved due to the decrease of turbidity. According to the influence of turbidity on photosynthesis, the photosynthetic rate increased by about 5%–10% when turbidity recovered from 60NTU to 30NTU (Li et al., 2006; Xue et al., 2007). According to the field investigation, the turbidity in the whole Daihai Lake was between 15.6–75.8NTU, and between 40–70NTU in most of the areas where submerged plants grew, which need to increase photosynthesis rates to reduced turbidity by submerged plants (Li et al., 2006; Xue et al., 2007). Ultimately, the simulation results showed that an increase in the area of submerged plants in Daihai Lake can significantly increase the total amount and rate of N uptake by submerged plant.
Liu et al. (2020) found that the assemblage of three or more submerged macrophyte species only significantly improved water clarity, but not water quality. Our findings were that it can be seen that annual N purification amount in the water of the Daihai Lake before and after restoration was different, the purification speed of submerged plants before recovery was very slow, and the recovery time required before recovery was much longer than after restoration. This also proved that small area submerged plant could not improve water quality obviously and only restoration of large area submerged plant benefited for the nutrient N absorption of submerged plants.
In addition, the death parameters of submerged plants used in the model only generally calculated the normal death and loss of each part of submerged plants in the natural growth process, and other biomass of submerged plants would be not considered next year, which indicated that most submerged plants would be removed from the lake and not re-pollute the lake water. Therefore, it is necessary to carry out the salvage work of plant residues in winter every year to maintain normal plant growth and prevent from submerged plant nutrient N releasing into the water.
Endogenous pollution was also one of the main reasons for the deterioration of water quality in Daihai Lake (Zheng and Men, 2020). Submerged plants could fix and absorb various types of N in the sediment, which was an effective means to control endogenous pollution in the lake (Jingbo et al., 2007; Huang et al., 2019). In this study, because the N in the sediment lacked exogenous recharge, it was found that the concentration of various types of N in the sediment continuously decreased, which was continuously consumed by submerged plants. As the N concentration in the sediment decreased, the nitrogen concentration in the water would also decrease accordingly, which was the main reason why the model simulated a gradual decrease in purification capacity before reaching stability. Therefore, the restoration of submerged plants in the Daihai Sea could effectively slow down the release of endogenous N pollutants to water, which was of a great important role in N purification in sediments.
The ecological dynamics model of nitrogen flow in the Daihai Lake was constructed to simulate the growth and nitrogen uptake of the submerged plants in the Daihai Lake. In 2019, the pollution load into Daihai Lake was calculated to be 107.895 t/a. The nitrogen purification by submerged plants in Daihai Lake in 2019 was obtained by model simulation to be 5.13 t/a, accounting for 4.8% of the total exogenous pollution. The purification capacity of the restored submerged plants with a large area of 9.91 km2 in the Daihai Lake was significantly higher than before restoration. It would spend 12 years on purifying 107.895 t of nitrogen pollution for the restored submerged plants under the conditions of regular cleaning of submerged plant residues.
The original contributions presented in the study are included in the article/supplementary material, further inquiries can be directed to the corresponding author.
All authors listed have made a substantial, direct, and intellectual contribution to the work and approved it for publication.
This research is funded by Science and Technology Major Project of Inner Mongolia (Nos. ZDZX2018054 and 2022YFHH0017), China and by the National Natural Science Funds of China (31370474 and 32160279).
The author thanked Hohai University for its support for the article, and the students in the laboratory for their help in the experiment.
The authors declare that the research was conducted in the absence of any commercial or financial relationships that could be construed as a potential conflict of interest.
All claims expressed in this article are solely those of the authors and do not necessarily represent those of their affiliated organizations, or those of the publisher, the editors and the reviewers. Any product that may be evaluated in this article, or claim that may be made by its manufacturer, is not guaranteed or endorsed by the publisher.
Ahn, C., and Mitsch, W. J. (2002). Evaluating the use of recycled coal combustion products in constructed wetlands: An ecologic-economic modeling approach. Ecol. Model. 150 (1-2), 117–140. doi:10.1016/s0304-3800(01)00477-x
Boyd, C. E. (1970). Amino acid, protein, and caloric content of vascular aquatic macrophytes. Ecology 51 (5), 902–906. doi:10.2307/1933986
Brix, H., Dyhr-Jensen, K., and Lorenzen, B. (2002). Root-zone acidity and nitrogen source affects Typha latifolia L. growth and uptake kinetics of ammonium and nitrate. J. Exp. Bot. 53 (379), 2441–2450. doi:10.1093/jxb/erf106
Brown, L. C., and Barnwell, T. O. (1987). The enhanced stream water quality models QUAL2E and QUAL2E-UNCAS: Documentation and user model. Washington, D.C: U.S. Environmental Protection Agency.
Chen, D. Q., He, H., and Chen, Y. Q. (2013). Purification of Nitrogen and Phosphorus in lightly Polluted Landscape River by effective microorganisms combined with submerged plants. Hangzhou, China: Trans Tech Publications Ltd, 430. -+.
Costanza, R., Duplisea, D., and Kautsky, U. (1998). Ecological modelling and economic systems with STELLA - introduction. Ecol. Model. 110 (1), 1–4.
Council, C. S. (2009). Office of the State Council Leading Group for the First National Pollution Source Survey. The first national Pollution source survey of livestock and poultry industry source pollutant discharge coefficient manual.
Dong, Y., Xu, B., Wang, P., and Hua, Z. (2020). An ecological kinetic model of nitrogen cycle in the wetland based on Stella and R language. China Environ. Sci. 40 (01), 198–205.
Gao, H., Cheng, H., Zhan, M., and Wang, B. (2018). Research advances in submerged macrophytes numerical modeling: A review. Environ. Sci. Technol. 41 (8), 59–65.
Guan, X. (2021). Study on the removal of nitrogen and phosphorus from wastewater by potamogeton pectinatus. Environ. Prot. Xinjiang 43 (01), 46–50.
Huang, W., Liu, X., Zhao, L., Chen, J., Zheng, S., Jiang, X., et al. (2020). Release characteristics of phosphorus in sediment from Daihai Lake. Res. Environ. Sci. 33 (9), 2094–2102.
Huang, X., Guo, Y., Zhang, Y., Wu, C., and Liu, J. (2019). Controlling of internal phosphorus and nitrogen loading in lake sediment by submerged macrophytes and its application. J. Ecol. Rural Environ. 35 (12), 1524–1530.
Janse, J. H. (1997). A model of nutrient dynamics in shallow lakes in relation to multiple stable states. Hydrobiologia 342, 1–8.
Jiang, T., and Xi, B. (2011). Simulation of soil erosion and its application in the assessment of absorbed nitrogen and phosphorus load in hubei province. Res. Environ. Sci. 24 (11), 1249–1255.
Jingbo, C. a. I., Xuefeng, D., Hongyun, P., Huiqing, C., Xiao'e, Y., and Peimin, P. U. (2007). Impact of eenvironmental factors and submerged plant on phosphate release from sediment. J. Soil Water Conservation 21 (2), 151–154.
Kalin, L., and Hantush, M. M. (2006). Hydrologic modeling of an eastern Pennsylvania watershed with NEXRAD and rain gauge data. J. Hydrologic Eng. 11 (6), 555–569. doi:10.1061/(asce)1084-0699(2006)11:6(555)
Langergraber, G., Giraldi, D., Mena, J., Meyer, D., Peña, M., Toscano, A., et al. (2009). Recent developments in numerical modelling of subsurface flow constructed wetlands. Sci. Total Environ. 407 (13), 3931–3943. doi:10.1016/j.scitotenv.2008.07.057
Li, Q. S., Han, Y. Q., Chen, K. Q., Huang, X. L., Li, K. Y., and He, H. (2021). Effects of water depth on the growth of the submerged macrophytes vallisneria natans and hydrilla verticillata: Implications for water level management. Water 13 (18), 2590. doi:10.3390/w13182590
Li, Q., Wang, G., Pan, G., Wang, W., and Ma, T. (2006). Influence of water turbidity on germination of Potamogeton crispus and growth of germinated seedling. Acta Ecol. Sin. 11, 3594–3601.
Liang, X., Liu, H., Ji, M., Chang, M., Wen, L., Yu, R., et al. (2021). Effects of land use/cover change on lake water quality in the semi-arid region of northern China: A case study in lake Daihai Basin (2000-2018). J. Lake Sci. 33 (3), 727–736. doi:10.18307/2021.0309
Lu, J., Ma, T., Zhang, X., Liu, T., and Yu, S. (2015). Reservoir pollution by dry and wet deposition of atmospheric nitrogen in typical sand area. J. Agro-Environment Sci. 34 (12), 2357–2363.
Mankin, K., and Fynn, R. (1996). Modeling individual nutrient uptake by plants: Relating demand to microclimate. Agric. Syst. 50 (1), 101–114. doi:10.1016/0308-521x(94)00054-u
Martin, J. F., and Reddy, K. (1997). Interaction and spatial distribution of wetland nitrogen processes. Ecol. Model. 105 (1), 1–21. doi:10.1016/s0304-3800(97)00122-1
Mayo, A. W., Muraza, M., and Norbert, J. (2018). Modelling nitrogen transformation and removal in mara river basin wetlands upstream of lake Victoria. Phys. Chem. Earth, Parts A/B/C 105, 136–146. doi:10.1016/j.pce.2018.03.005
Mcandrew, B., and Ahn, C. (2017). Developing an ecosystem model of a floating wetland for water quality improvement on a stormwater pond. J. Environ. Manag. 202, 198–207. doi:10.1016/j.jenvman.2017.07.035
Mecca, S., Severino, C., and Barber, R. (2004). Pollution flushing models in Stella. Ancona, ITALY: Wit Press, 125–134.
Min, F-Y., Yang, M., and Wang, Z-C. (2010). Knowledge-based method for the validation of complex simulation models. Simul. Model. Pract. Theory 18 (5), 500–515. doi:10.1016/j.simpat.2009.12.006
Moss, B., Stansfield, J., and Irvine, K. (1990). Problems in the restoration of A hypertrophic lake by diversion of A nutrient-rich inflow. Munich, Fed. Rep. Ger. E Schweizerbart'sche Verlagsb. 24, 568–572. doi:10.1080/03680770.1989.11898801
Ouyang, Y., Luo, S., and Cui, L. (2011). Estimation of nitrogen dynamics in a vertical-flow constructed wetland. Ecol. Eng. 37 (3), 453–459. doi:10.1016/j.ecoleng.2010.11.008
Rice, E. W., Baird, R. B., Eaton, A. D., and Clesceri, L. S. (2012). Standard methods for the examination of water and wastewater. Washington, DC: American public health association.
Saeed, T., and Sun, G. (2011). Kinetic modelling of nitrogen and organics removal in vertical and horizontal flow wetlands. Water Res. 45 (10), 3137–3152. doi:10.1016/j.watres.2011.03.031
Scheffer, M., and Jeppesen, E. (2007). Regime shifts in shallow lakes. Ecosystems 10 (1), 1–3. doi:10.1007/s10021-006-9002-y
Scheffer, M., Straile, D., Van Nes, E. H., and Hosper, H. (2003). Climatic effects on regime shifts in lakes: A reply. Limnol. Oceanogr. 48 (3), 1353–1356. doi:10.4319/lo.2003.48.3.1353
Schoolfield, R. M., Sharpe, P., and Magnuson, C. E. (1981). Non-linear regression of biological temperature-dependent rate models based on absolute reaction-rate theory. J. Theor. Biol. 88 (4), 719–731. doi:10.1016/0022-5193(81)90246-0
Shen, J., Matsumoto, R., Wang, S. M., and Zhu, Y. X. (2001). Quantitative reconstruction of the paleosalinity in the Daihai Lake, inner Mongolia, China. Chin. Sci. Bull. 46 (1), 73–76. doi:10.1007/bf03183214
Small, G. E., Sterner, R. W., and Finlay, J. C. (2014). An ecological network analysis of nitrogen cycling in the laurentian great lakes. Ecol. Model. 293, 150–160. doi:10.1016/j.ecolmodel.2014.02.001
Tang, Y. (2021). Research on the development model of rural collective economy in liangcheng county master. Inner Mongolia: Agricultural University.
Van Den Berg, M. S., Coops, H., Meijer, M. L., Scheffer, M., and Simons, J. (1996). Clear water associated with a dense Chara vegetation in the shallow and turbid Lake Veluwemeer, The Netherlands. Freshwater Ctr. Silkeborg, Denmark: Springer, 339–352.
van der Peijl, M. J., and Verhoeven, J. T. A. (1999). A model of carbon, nitrogen and phosphorus dynamics and their interactions in river marginal wetlands. Ecol. Model. 118 (2-3), 95–130. doi:10.1016/s0304-3800(99)00014-9
Wang, J. (2022). Water quality simulation based on wasp model and attribution analysis in Daihai. Inner Mongolia, China: Inner Mongolia University.
Wu, M., and Zhao, Q. (2015). The growth of three submerged plants in different polluted water and its impact on water quality. J. Biol. 32 (4), 43.
Wu, Z., Wu, S., Liu, Y., Zhang, Y., Xie, S., and Guo, H. (2018). Key processes and mechanisms of nitrogen and phosphorus cycling in lakes. Acta Sci. Nat. Univ. Pekin. 54 (1), 218–228.
Xue, Y., Wang, G., and Li, Q. (2007). The influence of suspended sands on photosynthetic fluorescesce characteristics of vallisneria natans in turbidity waters. Plant Sci. J. 01, 70–74.
Ying, S. U. N., Jiang, H. E., Chang-Wei, L. V., Er-Dong, L. I. U., and Li-Li, S. (2009). The simulation research of ammonium nitrogen release from the surface sediments of the Daihai Lake. J. Agro-Environment Sci. 28 (7), 1464–1468.
Yunkai, Z., Jiahu, J., and Qun, H. (2006). Water quality analysis and assessment of Daihai Lake in inner Mongolia. J. Arid Land Resour. Environ. 20 (6), 74–77.
Zhang, J. J., Jorgensen, S. E., Tan, C. O., and Beklioglu, M. (2003). A structurally dynamic modelling - lake Mogan, Turkey as a case study. Ecol. Model. 164 (2-3), 103–120. doi:10.1016/s0304-3800(03)00051-6
Zhao, L., Yi, J., Jiang, X., Zheng, S., and Wang, S. (2020). Temporal and spatial distribution characteristics and difference analysis of nitrogen and phosphorus in Daihai Lake. Environ. Sci. 41 (04), 1676–1683. doi:10.13227/j.hjkx.201909090
Zheng, T., and Men, Y. (2020). Pollution load estimation and control countermeasures in the Dai Hai basin. Beijing Water 02, 32–37.
Zhou, Y., and Jia, J. (2009). Changes in the ecological environment in the Daihai Lake basin over the last 50 years. Arid Zone Res. 26 (2), 162–168. doi:10.3724/sp.j.1148.2009.00162
Zhu, M. (2011). Study on agricultural NPS loads of haihe basin and assessment on its environmental impact. Doctor. Beijing China: Chinese Academy of Agricultural Sciences.
Keywords: Daihai lake, submerged plant, modelling, nitrogen removal, ecological restoration
Citation: Yao Y, Jiang Y, Liu Y, Meng S, Hu B and Chen Y (2023) Stimulating effects of submerged plants on removing of N from the water in the Daihai lake of inner Mongolia autonomous region, China. Front. Environ. Sci. 11:1128303. doi: 10.3389/fenvs.2023.1128303
Received: 20 December 2022; Accepted: 14 March 2023;
Published: 24 March 2023.
Edited by:
Juanle Wang, Institute of Geographic Sciences and Natural Resources Research (CAS), ChinaCopyright © 2023 Yao, Jiang, Liu, Meng, Hu and Chen. This is an open-access article distributed under the terms of the Creative Commons Attribution License (CC BY). The use, distribution or reproduction in other forums is permitted, provided the original author(s) and the copyright owner(s) are credited and that the original publication in this journal is cited, in accordance with accepted academic practice. No use, distribution or reproduction is permitted which does not comply with these terms.
*Correspondence: Yuhong Liu, eWhsaXVAaGh1LmVkdS5jbg==
†These authors share first authorship
Disclaimer: All claims expressed in this article are solely those of the authors and do not necessarily represent those of their affiliated organizations, or those of the publisher, the editors and the reviewers. Any product that may be evaluated in this article or claim that may be made by its manufacturer is not guaranteed or endorsed by the publisher.
Research integrity at Frontiers
Learn more about the work of our research integrity team to safeguard the quality of each article we publish.