 Yuxian Wang
 Yingying Xu1
95% of researchers rate our articles as excellent or good
Learn more about the work of our research integrity team to safeguard the quality of each article we publish.
Find out more
ORIGINAL RESEARCH article
Front. Environ. Sci. , 20 February 2023
Sec. Soil Processes
Volume 11 - 2023 | https://doi.org/10.3389/fenvs.2023.1127043
This article is part of the Research Topic Soil Degradation and Restoration in Arid and Semi-Arid Regions View all 10 articles
Slope erosion in the black soil region of Northeast China is complex and specific. In order to effectively control soil erosion and protect scarce black soil resources, it is necessary to reveal the law of soil erosion and the influence of basic units of soil structure on its erosion process. This paper used three treatments in the Le Bissonnais (LB) method to determine soil aggregate stability parameters and soil erodibility K values based on particle size composition. By establishing a mathematical fitting of the slope erosion rate along the slope length, it is found that the sinusoidal function fitting can better characterize the periodic law of the slope erosion rate of the long and gentle slope cultivated land in the typical black soil region. The research shows that the primary mechanism of black soil aggregate breakage is dissipation and mechanical disturbance, while the damage caused by clay expansion is the least.
Soil erosion is a significant soil degradation phenomenon that threatens the sustainable use of land productivity and, thus, food security. The problem of water and soil erosion in the Yangtze River Economic Belt, the Loess Plateau, and the black soil area in Northeast China is still severe. Among them, the phenomenon of soil and water loss in sloping farmland in the black soil region of Northeast China is particularly prominent and needs to be solved urgently(Chen et al., 2021).
Cultivated land is the fundamental guarantee for human survival and development. As an essential link in the transformation process of land resource utilization, nature has become the focus of the current human population, resources, and environmental issues(van den Bergh et al., 1999; Bromley, 1995). The area of cultivated land in the black soil region of Northeast China is about 18.5 million hectares. Sloping cultivated land is a vital cultivated land resource in the black soil region, accounting for 59.3% of the cultivated land area in the black soil region of Northeast China. It is widely distributed and has long gentle slopes. Due to its natural advantages, such as fertile soil and reasonable structure, it has become an essential agricultural soil (Rana et al., 2022), which is significant to China’s food security. However, due to extensive development and utilization, high-quality cultivated land resources have been degraded, and the thickness of the black soil layer in Northeast China is decreasing year by year (Fan et al., 2004; Xu et al., 2018; Zhizhen et al., 2018). Compared with other soil erosion regions in China, the soil erosion in the black soil region of Northeast China is mainly affected by various external forces of erosion that are replaced by seasons and superimposed in space. In addition, the ubiquitous topography of rivers and hills in the black soil area and the everyday use of farming along the ridges leading to the complexity and particularity of slope erosion in the black soil area. Therefore, it is urgent to reveal the law of soil erosion and the influence of the basic units of soil structure on its erosion process, effectively control soil erosion and protect the scarce black soil resources.
Many scholars believe that the Le Bissonnais (LB) method is more suitable for analyzing the stability of soil aggregates than other methods (Lal et al., 2000) believe that the degradation of any soil is first manifested in the destruction of the soil aggregate structure (Ojeda et al., 2008) studied the stability of calcareous soil aggregates. Many studies in China have used the LB method to study the stability of soil aggregates in iron-rich soils and hilly loess areas (Ma et al., 2022). Furthermore, discuss the stability of water-stable soil aggregates under different vegetation types in loess hilly areas, showing the applicability of the Le Bissonnais method in this soil type (An et al., 2013; Jakšík et al., 2015; Wu et al., 2017).
The occurrence of slope soil erosion is accompanied by the destruction of aggregates (Roth and Eggert, 1994; Bissonnais, 1996). The breakage of soil aggregates significantly impacts the whole process of soil erosion, and the stability of aggregates is closely related to the degree of soil erosion. In particular, it significantly impacts the slope erosion process, surface runoff seepage storage and erosion resistance (Madari et al., 2005; Hu et al., 2007). Aggregate fragmentation plays an essential role in soil separation, providing primary material for raindrop splash erosion and runoff erosion, but erosion sediment is also the primary carrier of soil nutrients (Wuddivira et al., 2009; Shen et al., 2019). In addition, studies on the effects of tillage erosion, wind erosion, and most water erosion on soil aggregate fragmentation and physical and chemical properties are mainly based on surface soil (Breshears et al., 2003; Wirtz et al., 2012).
Many scholars have researched the relationship between the slope erosion process and soil aggregate stability and the mutual influence mechanism (Huang et al., 2022; Mo et al., 2022). (Fang, 2005) research shows that soil erosion mainly destroys surface macro aggregates and increases the loss rate of macro aggregates. Due to the runoff migration on the slope, the content of macro aggregates in the sedimentary area is high (Zhang et al., 2011) pointed out that the stability of surface soil aggregates along the longitudinal slope showed fluctuations, but the rules were not obvious. The variation of aggregate stability parameters along the slope length shows apparent differences caused by the different soil erosion resistance at different parts of the slope. In the erosion process of black soil, hydraulic erosion mainly destroys macroaggregates and preferentially migrates macroaggregates (Yan et al., 2008). Aggregates with a diameter >1.0 mm are less susceptible to migration. Raindrops will break up aggregates of >1.0 mm in size, and the loss characteristics will change with the loss ratio of aggregates of each size (Yang et al., 2008). The aggregates with a particle size of <1.0 mm are prone to displacement under raindrops, showing prominent enrichment characteristics.
Many scholars have researched the relationship between the slope erosion process and the stability of soil aggregates and the mutual influence mechanism. The stability of surface soil aggregates along the longitudinal slope shows fluctuations, but the law is not apparent. This study takes the soil of slope farmland in a typical black soil area as the research object. This paper uses three processing operations in the LB method to simulate heavy rain, slight rainfall, raindrop splash and runoff disturbance, respectively. Moreover, the stability of slope cultivated land’s surface and subsurface soil aggregates was measured and analyzed. Discuss the fragmentation characteristics of soil aggregates under different wet treatments, and analyze the soil aggregates of typical eroded black soil. To clarify slope soil aggregate stability distribution characteristics and its relationship with soil physical and chemical properties. The soil erodibility K value and soil organic carbon content were calculated based on the geometric particle size to clarify the variation characteristics of the leading quality factors of black soil slope cultivated land. It provides a scientific basis for revealing the dynamic change mechanism of soil erodibility and provides particular theoretical support for preventing and controlling soil and water loss in sloping farmland in black soil areas.
The typical black soil area in Northeast China is an important agricultural production area in China. From west to east, it is divided into typical black soil sub-regions of Eastern Mongolia, Sonnen and Sanjiang, accounting for 28.5%, 63.8% and 7.7% of the typical black soil area, respectively. The reclamation period is 30–100 years. The terrain is higher in the northeast than in the southwest, and the typical terrain is full of mountains and rivers. Corn and soybeans are mainly grown. It has the remarkable characteristics of a typical compound erosion area in the world, and high-intensity rainfall in summer, autumn and early spring are prone to high-intensity soil erosion. Freezing and thawing are frequent in late autumn and early winter, followed by snowmelt erosion. The thickness of the black soil layer in China in the 1950 s was 50–80 cm, and now it is decreasing at a rate of 3–10 mm per year, down to 20–40 cm in 2000. In some severe areas, the soil parent material is exposed, and the production capacity is lost.
Keshan Farm belongs to the Qiqihar Branch of Heilongjiang Land Reclamation Bureau. It was originally a large-scale mechanical farm of the Mechanical Corps, located in Nehe City and Keshan County. Keshan Farm is located in the northern part of the typical black soil sub-region of Songnen, and belongs to the core area of the typical black soil region transitioning from the southwestern foot of the Lesser Khingan Mountains to the Songnen Plain. The geographic location is 125°07′40″–125°37′30″east longitude, 48°11′15″–48°24′07″north latitude. The altitude is between 250 and 383 m. The slope is long and gentle, and the slope of the sloping cultivated land is mostly 1°–3°, and the slope length is mostly 500–2000 m, and the longest is 4,000 m. Chuanmangang has obvious landform features. The temperate continental monsoon climate has a large temperature difference between the four seasons, the annual average temperature is 1.9°C, and the average annual precipitation is 503 mm. The precipitation from June to September accounts for 80.4% of the annual precipitation. The soil texture is silty clay with a particle composition (United States Department of Agriculture) sand, silt, and clay content of 14.2%, 40.7%, and 45.2%, respectively. The average thickness of the black soil layer is 20–40 cm, which is a typical thick-bed black soil area.
The fifth subfield of Keshan Farm was selected for reclamation for nearly 70 years, with an average slope length of about 2,200 m and a typically long and gentle slope farmland with an average slope of 1.5° along the slope direction. Based on remote sensing images and topographical features, the cultivated land with long and gentle slopes adjacent to space was selected for an on-the-spot investigation. Straight slopes, concave slopes, and concave-straight compound slopes with the same planting history, adjacent spatial locations, and a slope length of 1,020 m were selected as the research objects (Figure 1). The slope is ridged and cultivated in rotation along the slope. The rotation crops are potatoes (Solanum tuberosum) and corn (Zea mays). The tillage direction is the same as the runoff direction, the soil is prepared in autumn, and the seeds are sown on demand in spring.
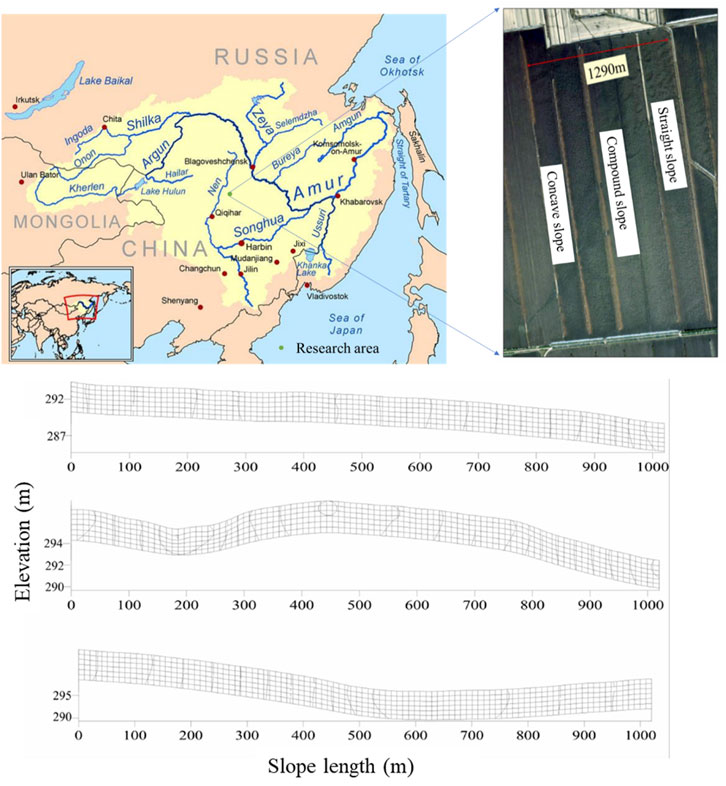
FIGURE 1. Location and slope topography of the study area.
Soil samples were collected in early May 2019 (before planting), after the spring thaw period. Straight slopes, concave slopes and concave-straight compound slopes were sampled every 30 m along the longitudinal section of the slope. The sampling depth is 30 cm, the sampling length is 1,020 m, and 34 sampling points are collected on each slope (Zhang et al., 2009) determined through statistical analysis of many experiments that soil samples with a distance of 0.75–5 m between sampling points are independent. The mixed sample composed of more than five independent soil samples can represent the attributes of the sampling point, and the sampling diameter does not affect its representativeness when the diameter of the sampler is 38–86 mm. Therefore, in this study, a soil drill with a diameter of 5 cm was used to drill into the slope perpendicular to the horizontal plane to collect soil samples.
Given that the plots are adjacent in space and have the same planting history, there is no significant difference in soil thickness. The soil was collected by ring cutter to measure soil bulk density, total porosity, capillary porosity and soil moisture content. The LB method was used to determine soil water-stable aggregates’ content to measure cultivated land soil quality.
Determination steps of Le Bissonnais method (Guo et al., 2010a): Collect undisturbed soil samples and put them into disposable plastic boxes. After being brought back to the laboratory, the soil was gently peeled along the gaps in the natural structure of the soil into a soil mass with a diameter of about 10–12 mm, and the thick root system and stones of the plants were removed. The soil samples were sieved, and the 5–3 mm particle size was taken for testing. In order to eliminate the influence of initial water content, the prepared soil samples were dried at 40°C for 24 h before determining aggregate stability to standardize their water content. The FW treatment simulated the disintegration of aggregates in the soil under the condition of rapid wetting (such as summer rainstorms, irrigation, etc.). It mainly reflected the dissipation mechanism of aggregate disintegration. The SW treatment reflects the disintegration of aggregates caused by soil clay swelling during slow soil wetting. WS treatment applies ethanol to wet the agglomerates. Because of the characteristics of ethanol itself and its interaction with soil, the dispersion of aggregates and the swelling of clay particles were significantly reduced, mainly reflecting the disintegration of aggregates under mechanical disturbance.
① Fast wet treatment (FW). Weigh 5–10 g of soil aggregates that have been pre-dried and passed through a 5–3 mm sieve. Pour 50 mL of deionized water into a 250 mL beaker, pour the soil sample into the beaker slowly, and immerse it in the deionized water. After standing for 10 min, remove the supernatant, and use a washing bottle filled with ethanol to gently flush the treated soil sample into a 0.05 mm sieve submerged in ethanol. Simultaneously, shake the sieve helically in ethanol five times with even force to separate the soil aggregates. Subsequently, the agglomerates on the sieve were washed into an evaporating dish and dried at 40°C for 48 h. The dried soil samples were passed through 2, 1, 0.5, 0.2, 0.1, and 0.05 mm sieves and weighed to the nearest 0.0001 g.
② slow wet treatment (SW). Samples are consistent as FW. Place the aggregates on filter paper on a 3 cm sponge pad. Control the height of the water surface to be 0.2–0.5 cm lower than the surface of the sponge, and saturate it for 60 min (the specific saturation time is determined according to the nature of the soil). Then wash it into a 0.05 mm sieve submerged in ethanol with a washing bottle filled with ethanol, and the rest of the sieving steps are the same as above.
③ Mechanical shock treatment (WS). Samples are consistent as FW. Inject 50 mL of ethanol into a beaker with a capacity of 250 mL, slowly pour the prepared soil sample into the beaker, and immerse it in ethanol. After standing for 10 min, the supernatant was removed, and the treated soil sample was transferred to a 250 mL Erlenmeyer flask with 50 mL of deionized water, and the deionized water was added to 200 mL. Subsequently, the Erlenmeyer flask was shaken ten times by inversion, and the supernatant was removed after standing for 30 min. Using a washing bottle filled with ethanol, gently wash the treated soil sample into a 0.05 mm sieve submerged in ethanol, and the rest of the steps are the same as above.
Determination of physical and chemical properties of soil: Soil bulk density, capillary porosity (ring knife method), Soil organic carbon (hydration thermal potassium dichromate sulfuric acid method) (McBride, 2022).
The mean mass diameter (MWD) and geometric mean diameter (GMD) are calculated by Eqs 1, 2 formula (Khan et al., 2022):
In the formula,
The formula for calculating the fractal dimension of soil aggregates is as follows Eqs 3, 4:
Take the base 10 logarithm of both sides:
In the formula: D is the fractal dimension of each particle size distribution of soil water-stable aggregates; W is the cumulative mass with a diameter less than
Soil erodibility factor K adopts a model of global soil erodibility (without considering soil particle size composition, in the case of organic matter, soil infiltration and other indicators), only the geometric mean particle size (GMD) is considered to estimate the soil erodibility K value, and the specific calculation formula is as follows:
After correction, it is used to estimate the soil erodibility value in eastern China.
The Relative Dissipation Index (RSI) and the Relative Mechanical Fragmentation Index (RMI) respectively represent the degree of destruction of soil aggregates by dissipation and mechanical destruction. The higher the values of RSI and RMI, the higher the sensitivity of soil aggregates to the effects of dissipation and mechanical oscillations (Wang et al., 2022).
where:
On straight slopes, concave slopes, and concave-straight compound slopes, there were significant differences in the particle size distribution of soil aggregates with different treatments of the LB method (Figure 2). Except for the aggregate percentage of 2–1 mm particle size did not reach a significant level between SW and WS treatments, there were significant differences in the aggregate content of other particle sizes (p < 0.01). After FW treatment, the particle size distribution of water-stable aggregates is relatively dispersed, mainly 1–0.5 mm, 0.5–0 mm and 0.1–0.05 mm. The percentages ranged from 12.6% to 24.0%, 32.5%–38.8% and 15.9%–37.3%, respectively. Compared with the SW and WS methods, the difference is most evident in the particle size distribution of 0.1–0.05 mm, and the content of aggregates broken into the 0.1–0.05 mm particle size is 11.17 and 4.2 times that of the SW and WS treatments, respectively. After WS treatment, the water-stable aggregates were mainly concentrated in the 1–0.5 mm particle size, and the percentage ranged from 31.6% to 36.5%. The second was concentrated at 2–1 mm, with a percentage range of 20.3%–36.2%. The primary performance is that the particle size of the >2 mm aggregate is broken down to the particle size of 2–0.5 mm. After SW treatment, the particle size of soil aggregates was relatively concentrated, mainly distributed in >2 mm particle size, and the percentage ranged from 29.5% to 40.3%. It is the most significant percentage of >2 mm particle size among the three treatments, four times and 21 times that of WS and FW treatments, respectively. The percentage of <0.2 mm particle size is tiny, ranging from 2.4% to 5.9%. Under the three treatments of the LB method, the proportion of soil aggregates with particle size >2 mm after aggregate crushing was SW > WS > FW. The proportion of aggregates mainly broken into the 2–1 mm size fraction is WS > SW > FW, the same as that of the aggregates broken into the 1–0.5 mm size fraction. The proportion of 0.5–0.2 mm size aggregates is FW > WS > SW, which is the same as that of <0.2 mm size aggregates. It indicated that the FW treatment disintegrated most large aggregates into smaller ones. The FW treatment had the most significant effect on aggregate disintegration, while the SW treatment had the most negligible effect. Because of this, torrential rain or heavy rain is the most fundamental driving force for the loss of cultivated land or bare land in the black soil region of Northeast China.
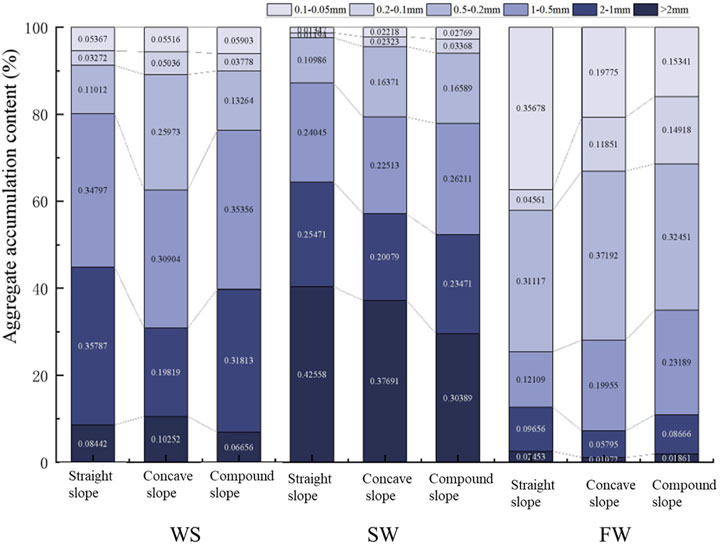
FIGURE 2. Size distribution of aggregates under different treatment methods of LB method: Cumulative particle size content of aggregates under different treatment methods.
A particle size >0.25 mm is generally believed to be an important indicator of soil erodibility. However, previous studies have shown that under simulated rainfall conditions, runoff depth, soil erosion volume and soil stability >0.2 mm aggregate content are negatively correlated after 30 min(Barthès and Roose, 2002). The LSD test showed that at the three particle size levels of >0.2 mm, >0.5 mm, and >1 mm, there were significant differences (p < 0.01) among the accumulated aggregate content of each corresponding size under the three treatments. Judging from the accumulation content of aggregates at the three particle size levels, the SW and WS treatments differed significantly from the FW treatments. At the >0.2 mm particle size, the difference between SW and WS is minimal. Nevertheless, as the particle size increases, the difference becomes more considerable. This law of soil aggregate fragmentation is reflected in the minor variation between different slope shapes. The three treatment methods were paired with T-tests among the three slopes, and the significant differences were 0.677, 0.861 and 0.876, respectively. It shows that different slope shapes have no significant effect on the percentage content of the particle size after the aggregates are broken, so the straight slope is used for the analysis below.
Since the runoff on the slope is mainly concentrated in the surface soil, the 0–10 cm soil layer on the slope is now analyzed (Figure 3). The SW in the LB method was used to simulate the SW process of light rain on the slope. The soil aggregates were broken into aggregates >0.2 mm, and the fluctuation along the slope length was noticeable. The central particle size distribution along the slope length was 1–0.5 mm size and >2 mm size alternately, which indicated the difference in slope soil resistance to dissipation. Among them, the 1–0.5 mm and 0.5–0.2 mm particle size distributions showed consistent fluctuations on the slope, and both showed the opposite fluctuation trend to the >2 mm particle size distribution along the slope length. The content of 0.2–0.05 mm particle size is less, and the distribution along the slope is more uniform, with less fluctuation. WS simulated the process of raindrop splashing and runoff disturbance on the slope. The soil aggregates were mainly broken at the 2–0.2 mm particle size, and the 2–1 mm and 0.5–0.2 mm particle size distribution along the slope length fluctuated more than SW. The distribution of >2 mm and <0.2 mm particle size fragmentation along the slope length showed a consistent pattern, both relatively gentle. The >2 mm particle size was less on the slope, indicating that the >2 mm particle size aggregates were mainly split under the impact of raindrops.
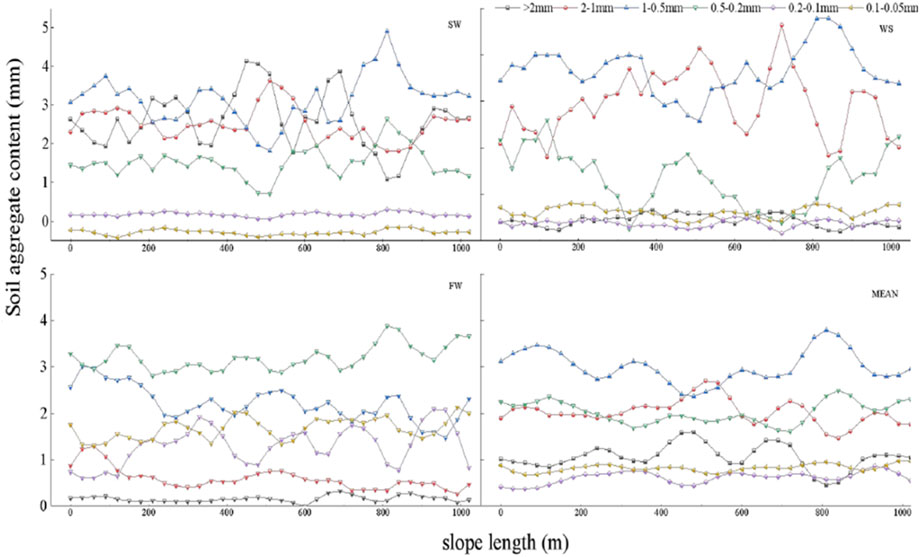
FIGURE 3. The distribution of the particle size content of soil water-stable aggregates along the slope length.
Compared with the clay expansion and mechanical crushing effects of SW and WS treatments, the dissipation effect of simulated rainstorms under FW treatment significantly increased the content of 0.2–0.1 mm and 0.1–0.05 mm grain size on the slope, and there were fluctuations along the slope length. Trend. The contents of >2 mm and 2–1 mm particle size were small, and the soil aggregates were mainly concentrated in <1 mm. It shows that under the action of air explosion, the aggregates of slope aggregates are mainly broken down to <1 mm particle size. The ability of aggregates to resist damage is relatively weak, and the resistance ability of all points on the slope is relatively consistent with that of light rain, raindrop splash and runoff disturbance. Furthermore, the more small particle aggregates on the slope surface, the more substances that can be splashed and carried by raindrops are more likely to be transported and migrated by runoff, resulting in severe soil erosion. However, under the action of SW and WS, the broken particle size distribution of surface aggregates showed undulating changes along the slope length, indicating that the soil in different parts of the slope is susceptible to uneven expansion and mechanical breakage; there are differences between the two.
After the slope soil experienced a series of freeze-thaw cycles, the stability of aggregates showed noticeable differences under simulated rainfall erosion conditions. Furthermore, with the change in slope length, the stability of aggregates showed a fluctuating trend with the slope length (Figure 4). Under SW treatment, the stability of aggregates on the slope surface was the most stable (1.09 mm ≤ MWD < 1.69 mm). However, the stability was the lowest under FW treatment (0.40 mm ≤ MWD < 0.73 mm). Under the WS treatment, the erosion was moderate (0.99 mm ≤ MWD<1.31 mm), and the entire slope showed a uniform change trend. The stability of soil aggregates in slope soil was the worst under air explosion, but the stability fluctuation trend was relatively gentle. It shows that the results of resistance to dissipation at each position on the slope are the smallest and equal. During the wetting process, the soil aggregates are due to the compression of the enclosed air inside the aggregates, resulting in an increase in the internal pressure of the aggregates and the breakdown of the aggregates. The characteristic index of soil porosity (adequate capillary pore size and total pore size) and the increase of soil porosity will provide more places for the confined air required for “air explosion”, thus promoting the trend of aggregate fragmentation. That is, the distribution of soil pores directly affects the strength of aggregate stability. There was a clear negative correlation between aggregate stability (MWDFW) and soil pore condition. As capillary porosity increases, the stability of soil aggregates decreases. To a certain extent, it proves the existence of the “air explosion” phenomenon. Along the slope length direction, the total and capillary porosity variability on the slope is 2.9% and 9.0%, respectively, which belongs to weak variability. The variability of the porosity of the aggregates on the slope before breaking is small, so the distribution of aggregates broken along the slope due to the difference in pore size under the action of FW is small. The fluctuation trend of soil aggregate stability on the slope surface is slight.
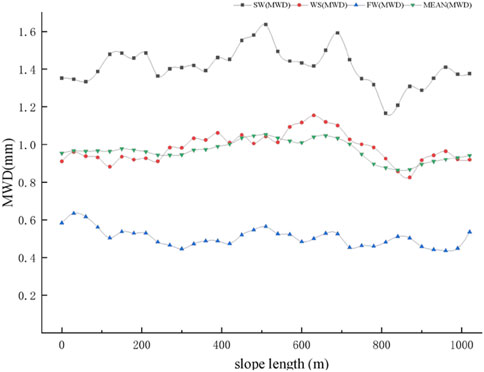
FIGURE 4. Distribution of soil aggregate stability along slope length.
Table 1 shows the relationship between soil properties and aggregate stability under different methods. Under the fast-wetting treatment of the LB method (FW, simulating the summer rainstorm scenario), the aggregates of each soil layer depth (0–10 cm, 10–20 cm and 20–30 cm) on the slope were damaged to a certain extent, and the large aggregates collapsed. A solution to finer aggregates (Figure 5). The particle size of aggregates is mainly concentrated in <1 mm, and the cumulative percentages in the 0–10 cm, 10–20 cm, and 20–30 cm soil layers are 91.86%, 87.16% and 84.29%, respectively, and the particle size >2 mm only accounts for 2.45%. The content of aggregates >0.2 mm in each soil layer was not significantly different, indicating that soil aggregates at all depths were destroyed after FW treatment. However, with the increase of soil depth, the conversion ratio of >0.5 mm soil aggregates to large aggregates increased. The 0–20 cm soil aggregates were broken in the same way under the FW treatment, but the 20–30 cm soil aggregates were broken differently than the upper soil. It shows that the effect of air explosion on the soil damage of the 0–20 cm soil layer in the black soil region of Northeast China is more prominent.
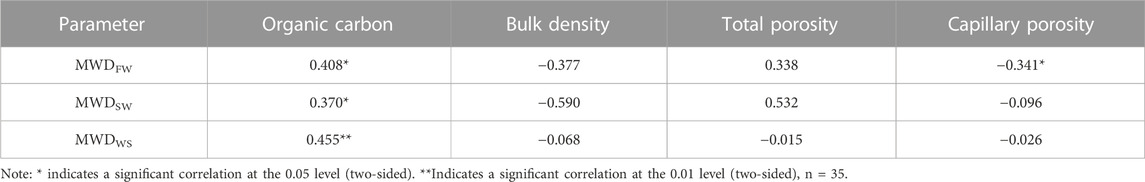
TABLE 1. The stability of soil aggregates and the correlation of each parameter.
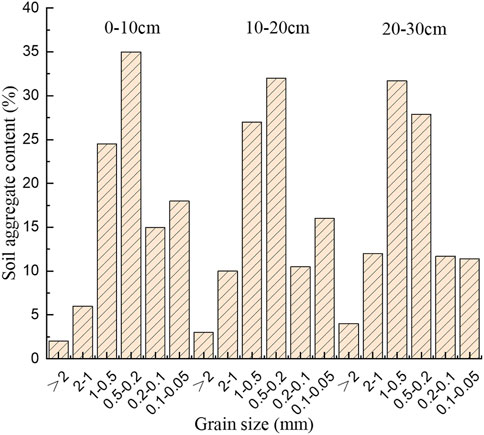
FIGURE 5. Size composition of soil aggregates under FW treatment.
The aggregates treated with SW have apparent advantages in the proportion of >2 mm, 2–1 mm, 1–0.5 mm, and 0.5–0.2 mm, accounting for 97% of the total. It shows that the original 5–3 mm large aggregates were mainly broken into >0.2 mm aggregates under SW treatment (Figure 6). The particle size of >2 mm aggregates increased significantly with soil depth. In the 20–30 cm soil layer, the particle size of aggregates >2 mm accounted for more than 50%, and the distribution of aggregates was relatively uniform except for the soil aggregates >0.2 mm in the 0–10 cm soil layer. The damage of the soil aggregates in the lower layer decreased step by step and broke down step by step, indicating that it was under the action of clay expansion. The soil aggregates in the upper layer were more easily broken than in the lower layer, and the transformation ratio of soil aggregates in the lower layer to macroaggregates was significantly higher than that in the upper layer.
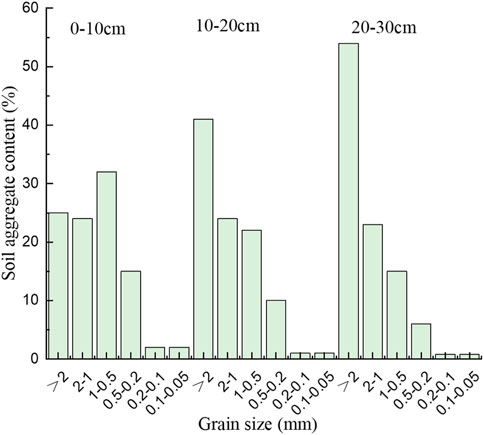
FIGURE 6. Size composition of soil aggregates under SW treatment.
The water-stable aggregates in the WS treatment were mainly concentrated in the 2–0.5 mm particle size, and the cumulative proportions of each soil layer were 70.58%, 71.14%, and 72.79%, respectively. It shows that the original 5–3 mm large aggregates are mainly broken down to 2–0.5 mm aggregates under WS treatment (Figure 7). Under each depth of soil layer, the aggregate content tends to be normally distributed, that is, there are more aggregates with a size of 2–0.5 mm. Furthermore, with it as the centre, it decreases step by step to both sides, but with the increase of soil layer, it also shows the trend of shifting to large particle size. Overall, the distribution of crushed aggregates was relatively similar, indicating that the impact of mechanical vibration treatment on each soil layer of cultivated soil aggregates was equivalent. The difference from the SW treatment was that the mechanically disturbed soil aggregates severely damaged the particle size aggregates >2 mm, mainly breaking down to <2 mm particle size. Unlike the FW treatment, the proportion of <0.2 mm aggregates was small. It shows that under the action of disintegration under mechanical disturbance, the degree of fragmentation of cultivated soil aggregates is moderate.
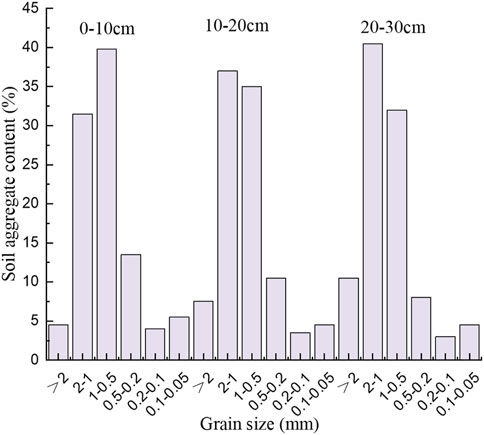
FIGURE 7. Size composition of soil aggregates under WS treatment.
The stable state of soil aggregates in different soil layers was different due to different treatments of aggregates (Table 2). Under FW treatment, the stability of soil aggregates at different depths was mostly at an unstable level (0.4 < MWDFW < 0.8). Under the WS and SW treatments, except for the 0–10 cm soil layer, the aggregate stability was above the stable level (MWDsw, MWDws > 0.8). The results showed that the stability of soil aggregates was the strongest after the SW treatment. The second is the pre-wetting and shaking treatment. After the rapid wetting treatment, the stability and corrosion resistance of the aggregates are the weakest. It can be seen that the dissipation effect caused by rapid wetting and the mechanical disturbance effect caused by pre-wetting oscillation are the main effects of soil aggregate destruction.
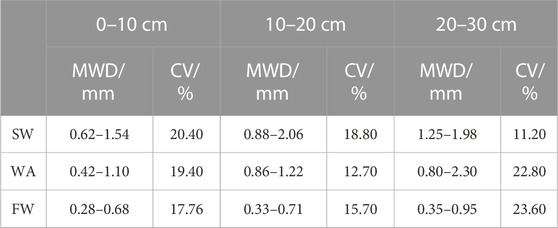
TABLE 2. Aggregate stability at different soil depths.
Among all the soil samples on the slope, 95% had the largest MWD after SW treatment, and 5.88% had the largest aggregate MWD after WS treatment. However, only 0.98% of the samples had the largest MWD after FW treatment. The performance is MWDSW > MWDWS > MWDFW. The aggregates treated with FW had the lowest MWD, i.e., the aggregates were most destructive. The aggregate MWD value of SW treatment was the largest, and the aggregate damage was the least. There were significant differences in the MWD values of the aggregates treated with FW, WS and SW in the Le Bissonnais method. However, the MWD values of aggregates in different soil layers have the same variation after treatment. The MWD0-10 cm < MWD10-20 cm < MWD20-30 cm among different soil layers under the three failure mechanisms showed that the structure of soil aggregates in the 20–30 cm soil layer was the most stable, while the 0–10 cm soil layer had the worst stability.
Under SW treatment, the average weight diameters (MWD0-10 cm, MWD10-20 cm and MWD20-30 cm) of soil aggregates in each soil layer were 1.18, 1.44, and 1.66, respectively. The soil aggregates in the lower layer increased by 21.8% and 11.2%, respectively compared with the upper layer. It shows that the 10–20 and 20–30 cm soil layers are less sensitive to aggregate breakage caused by simulating the wetness of light rain in the field than the 0–10 cm soil layer, that is, the soil erosion resistance of the 10–30 cm soil layer is significantly better than that of 0–10 cm soil layer. Under the FW treatment, the average weight diameters of aggregates in the 0–10, 10–20, and 20–30 cm soil layers were 0.42, 0.51, and 0.62, respectively, and the stability was the worst. The soil aggregate stability of the lower layer was 11.9% and 22.2% higher than that of the upper layer, respectively, and the difference was most evident between 0–20 cm and 20–30 cm. It shows that the 20–30 cm soil layer is less sensitive to air explosion than the 0–20 cm soil layer. That is, the corrosion resistance is significantly enhanced. Under WS processing, the mean weight diameters (MWD0-10 cm, MWD10-20 cm and MWD20-30 cm) of the aggregates in each soil layer were 0.86, 0.98 and 1.1, respectively. The soil aggregate stability of the lower layer was 14.0% and 11.9% higher than that of the upper layer. The susceptibility of different soil layers to soil erosion was comparable under simulated field mechanical disturbance. That is, relative to the pre-wetting disturbance, and there is no noticeable difference in the corrosion resistance of each soil layer. It shows that the soil aggregates in the 0–10 cm soil layer are more sensitive to the damage of light rain in the field, and the soil aggregates in the 0–20 cm soil layer are more sensitive to air explosion. Each soil layer’s susceptibility to soil aggregate damage was equivalent under mild mechanical vibration and other conditions.
There were differences in the fractal dimension of soil aggregates among different soil layers among the treatments. However, the variation trends were not the same (Figure 8). The average fractal dimensions of the 0–10, 10–20, and 20–30 cm soil layers under the SW treatment were 2.36, 1.95, and 1.85, respectively. The average fractal dimensions of the 0–10, 10–20, and 20–30 cm soil layers under WS treatment were 2.47, 2.39, and 2.36, respectively. The average fractal dimensions of the 0–10, 10–20, and 20–30 cm soil layers under the FW treatment were 2.73, 2.70, and 2.70, respectively. Both showed a decreasing trend with the increase of the soil layer. It indicated that the degree and effects of the three treatments on the soil structure were different and changed with the depth of the soil layer. However, in the soil profile under FW treatment, the soil fractal dimension D) was unchanged in each soil layer, and the value range was small. However, the fractal dimension of the soil in the slow-moisture treatment gradually decreases and changes obviously with the depth of the profile.
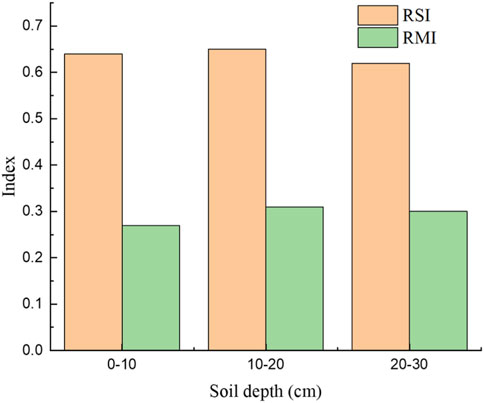
FIGURE 8. Soil fractal dimension at different soil depths.
The soil erodibility K value in the black soil region of Northeast China was estimated using the modified geometric particle size model, which can be used as an estimation model for soil erodibility K value in eastern China. As a comprehensive relative index of soil water erosion resistance, the more significant the K value, the more unstable the aggregates and the more prone to erosion. Conversely, the stronger the soil erosion resistance. The soil erodibility of the slopes in the study area was analyzed (Table 3), and it was found that the soil erodibility of each slope showed that the K value of the straight slope was the smallest. The variability was the most minuscule (14.8%). Composite and concave slopes had similar K values, with a variability of 22.4% and 21.0%, respectively. The variation range of soil K value of the three slopes is 0.008–0.043, and the average value is 0.018 (Keli et al., 2007) research shows that China’s K value of soil erodibility is relatively concentrated in the 0.001–0.04. The overall soil erodibility in the study area belongs to medium variation (16%–32%), and the K value of soil erodibility decreases significantly with the increase of soil depth. It shows that with the increase of the depth of the soil layer, the ability of soil erosion resistance is gradually enhanced.
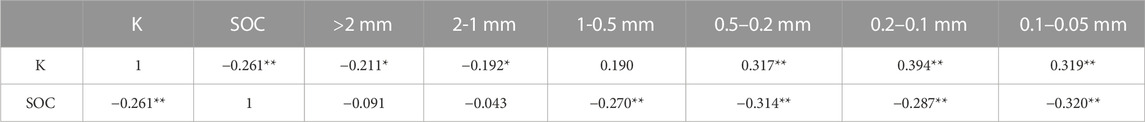
TABLE 3. Correlation between slope soil erodibility K value, SOC and each particle size.
The K value of soil erodibility is closely related to aggregates, and rainfall erosion further affects the potential erodibility of soil and the final soil erosion process (Zhu et al., 2022). The Pearson correlation analysis was performed on the soil erodibility, aggregate size and SOC, as shown in Table 3. The soil erodibility K value was positively correlated with the aggregate content of 0.5–0.2 mm, 0.2–0.1 mm, and 0.1–0.05 mm, and the correlation coefficients were 0.317, 0394, and 0.319, respectively (p < 0.01). The results showed that fine particles could clog soil pores during precipitation when the <0.5 mm particle size content increases. In turn, it hinders the infiltration of soil moisture, increases surface runoff, accelerates surface runoff and sand production, and enhances soil erosion capacity. The erodibility K value was negatively correlated with the particle size of >2 mm and 2–1 mm aggregates, and the correlation coefficients were 0.211 and 0.192, respectively (p < 0.01). It shows that the large particles have intense anti-erosion media stripping and transport ability, and the soil’s anti-corrosion ability is strong. The erodibility K value was significantly negatively correlated with the organic carbon content (Table 3), with a correlation coefficient of 0.261 (p < 0.01). This shows that soil organic carbon can enhance the bonding between soil particles and water, mainly showing a significant negative correlation between the <1 mm particle size and SOC content. It shows that SOC promotes soil water stability and the formation of aggregates, which is beneficial to the stability of soil structure and enhances soil erosion resistance.
According to the average value of the particle size distribution on the slope under the three treatments, the particle composition is mainly >2 mm. Among them, the 1–0.5 mm and 0.5–0.2 mm particle sizes showed similar fluctuation trends. >2 mm, 2-1 mm particle size showed a similar trend. The particle size distribution of >1 mm and the particle size distribution of 1–0.2 mm showed opposite trends in the slope fluctuation trend. It shows that rainfall erosion mainly breaks>2 mm, 2-1 mm grain size into 1–0.2 mm grain size. Thus, abundant loose aggregate particles are provided for raindrop splash erosion and runoff erosion, which is the primary source of erosion materials in soil erosion. The particle size distribution of aggregates on the slope surface after crushing directly affects the impact of raindrops and runoff on the initiation and transportation of soil particles. The difference in particle size distribution will lead to the difference in the sediment carried by the runoff scouring process, leading to the erosion-sedimentation fluctuation law on the slope surface. There is a periodic change law of ebb and flow or similarity among the grain fractions on the slope along the slope length. Although it does not precisely match the fluctuation trend of erosion intensity of slope farmland, the fundamental trends reflected by the two are similar.
Under simulated light rain conditions, the stability of aggregates on the slope surface fluctuated most obviously along the slope length. Agglomerates break up due to uneven expansion and contraction of soil clay particles. Studies have shown that the fracture mechanism can only be expressed when the soil contains many clay minerals with expansive lattices. The internal structure of the agglomerates produces fine cracks (cracks), which leads to the breakage of the agglomerates. The clay mineral montmorillonite and clay content (37%) in the soil are relatively high; the main clay mineral is montmorillonite. Its expansion and contraction are substantial, and montmorillonite aggregates are more sensitive to the stress generated by expansion. Although less destructive, it is better than rapid wetting for differentiating unstable soils between different locations on a slope.
Under the conditions of simulated raindrop impact and runoff disturbance, the stability of aggregates on the slope surface is between the two. When the external mechanical damage kinetic energy is significant enough, soil aggregates combined with dissipation or clay expansion will disperse and break aggregates. It shows that the cementation effect of soil organic matter on aggregates is dominant (excluding the destruction effect of dissipation and clay expansion). Thick-layer black soil has a high content of organic matter and clay, both cementing substances. It dramatically enhances the cementation ability between soil aggregates and plays an essential role in the formation and stability of soil aggregate structure. Analysis of the correlation between aggregate stability parameters and soil organic carbon content showed that organic carbon was significantly correlated with its stability (MWDWS) under mechanical disturbance. It is confirmed that the soil aggregates on the slope will destroy the cohesion of soil organic matter during mechanical disturbance and crushing. The organic carbon content enhances its ability to resist mechanical damage. Along the slope length direction, the variability of organic carbon on the slope is 8.7%, which is weak variability. Therefore, under mechanical disturbance, there is little difference in the distribution of aggregate breakage along the slope.
Regardless of the destruction method, after the aggregates experienced rainfall, the aggregates were broken into smaller particles. Nutrients mainly exist in the soil in an adsorption or organic state, and most soil flow is fine particles. Since the fine particles have a larger specific surface area, they have a more substantial adsorption effect on nutrients. Therefore, it can be inferred that the enormous loss of fine particles in the slope runoff accompanies the enormous loss of soil nutrients. In the long-term rainfall erosion process, with the continuous development of runoff, the sediment content carried by it has been in the mutual conversion state of “saturated-unsaturated”. Due to the combined effect of erosion and deposition, the nutrient content inevitably erodes and deposits continuously with the runoff and sediment on the slope, and finally presents a trend of fluctuating changes.
By analyzing the changes of organic carbon along the length of the three slopes: straight slope, concave slope and compound slope, it was found that the average value of soil organic carbon content (SOC) on the slope was 46.58 g·kg-1. The variation range is 26.76–68.09 g·kg-1. There was a significant difference in the content of SOC in different slope shapes (p ≤ 0.01). The SOC content of each slope shape is mainly as follows: open slope < compound slope < straight slope. The SOC content of the straight slope is 1.04 and 1.11 times that of the composite and concave slopes. The soil SOC content of the concave slope with the highest soil erosion rate is the lowest. Straight slopes with the lowest soil erosion rates have the highest average concentrations. The erosion intensity and SOC content of the composite slope is in between. In terms of the change along the slope length, the soil SOC content generally showed a high-low-high variation trend. Contrary to the change in soil erosion rate along the slope length, the site with a higher soil erosion rate corresponds to lower soil SOC content and vice versa (Figure 9).

FIGURE 9. Distribution characteristics of soil SOC and soil erosion rate along the slope length.
The variation trend of slope soil SOC and soil erosion intensity is opposite to that of slope distribution, reflecting that the spatial distribution of soil erosion intensity directly affects the distribution of slope soil organic carbon distribution. Analyzing the reasons, soil organic carbon mainly exists in soil aggregates in a close combination of organic and inorganic substances. The migration and transformation of soil particles mainly accompany it. The study of slope soil is mainly based on the erosion-transport process, and the soil erosion-transport process is also the process of soil SOC transport. The SOC accumulated on the soil surface is easily lost with the migration of the surface soil. This will cause a large amount of fertile soil on the surface of the cultivated land, and the soil and its nutrients will be lost through runoff and sediment. The remaining content of cultivated land is reduced, and the black soil layer is thinned, resulting in barren soil and a decline in cultivated land quality.
This paper uses three processing methods of the LB method to clarify the crushing characteristics of soil aggregates under different damage effects. The breaking mechanism of typical black soil aggregates was clarified, and the distribution characteristics of the stability of soil aggregates in different parts and layers along the slope were analyzed. Furthermore, the response of slope soil erodibility K value and soil SOC content loss to slope surface was discussed. The main conclusions are as follows.
(1) Overall, the aggregate stability showed MWDSW > MWDWS > MWDFW.
(2) The analysis of the aggregates in the topsoil layer (0–10 cm) found that the fluctuation trends along the slope length among the various grain sizes on the slope did not completely match. However, the fundamental trends reflected by the two were similar.
(3) Under the three failure mechanisms, MWD0-10 cm < MWD10-20 cm < MWD20-30 cm is reflected among different soil layers.
The original contributions presented in the study are included in the article/supplementary material, further inquiries can be directed to the corresponding author.
All authors were responsible for designing the framework of the entire manuscript from topic selection to solution to experimental verification.
Heilongjiang Academy of Agricultural Sciences Innovation Project Grant (CX23GG11, 2020FJZX029), Qiqihar Science and Technology Program Key Project (ZDGG-202208).
The authors declare that the research was conducted in the absence of any commercial or financial relationships that could be construed as a potential conflict of interest.
All claims expressed in this article are solely those of the authors and do not necessarily represent those of their affiliated organizations, or those of the publisher, the editors and the reviewers. Any product that may be evaluated in this article, or claim that may be made by its manufacturer, is not guaranteed or endorsed by the publisher.
An, S. S., Darboux, F., and Cheng, M. (2013). Revegetation as an efficient means of increasing soil aggregate stability on the Loess Plateau (China)[J]. Geoderma 209, 75–85. doi:10.1016/j.geoderma.2013.05.020
BarthèS, B., and Roose, E. (2002). Aggregate stability as an indicator of soil susceptibility to runoff and erosion; validation at several levels. Catena 47, 133–149. doi:10.1016/S0341-8162(01)00180-1
Bissonnais, Y. L. (1996). Aggregate stability and assessment of soil crustability and erodibility: I. Theory and methodology. Eur. J. Soil Sci. 47, 425–437. doi:10.1111/j.1365-2389.1996.tb01843.x
Breshears, D. D., Whicker, J. J., and Johansen, M. P., (2003). Wind and water erosion and transport in semi-arid shrubland, grassland and forest ecosystems: Quantifying dominance of horizontal wind-driven transport. Earth Surf. Process. Landforms 28, 1189–1209. doi:10.1002/esp.1034
D. W. Bromley (1995). Handbook of environmental economics. 1st Edition. Elsevier. Available at: https://www.amazon.com/Handbook-Environmental-Economics-Daniel-Bromley/dp/1557866414.
Chen, R., Yan, D., Wen, A., Shi, Z., Chen, J., Liu, Y., et al. (2021). The regional difference in engineering-control and tillage factors of Chinese Soil Loss Equation[J]. J. Mt. Sci. 18 (3), 658–670. doi:10.1007/s11629-020-6268-z
Fan, H., Cai, Q., and Wang, H. (2004). Soil erosion environment in the black soil region of NortheastNortheast China. J. Soil Water Conservation 18, 5. doi:10.1016/j.envsci.2010.07.004
Fang, H. (2005). Study on erosion and sedimentation characteristics of black soil in slope cultivated land by 137Cs tracing technique. J. Ecol. 25, 7. doi:10.1016/S1002-0160(06)60044-1
Guo, M., Zheng, F., An, S., Liu, Y., Wang, B., and Darboux, F. (2010a). Application of Le Bissonnais method to study soil aggregate stability in the Hilly-gully region. Sci. Soil Water Conservation 8, 68–73. doi:10.5846/stxb201301160103
Hu, Z., Yizhong, L., Zhichen, Y., and Baoguo, L. (2007). Effects of conservation tillage on soil aggregate characteristics in north China plain. Chin. Agric. Sci. 40, 7. doi:10.1016/j.still.2012.06.007
Huang, B., Zhu, M., Liu, Z., Sheng, M., Chen, M., Yang, Q., et al. (2022). The formation of small macro-aggregates induces soil organic carbon stocks in the restoration process used on cut slopes in alpine regions of China. Land Degrad. Dev. 33, 3283–3293. doi:10.1002/ldr.4388
Jakšík, O., Kodešová, R., Kubiš, A., Stehlíková, I., Drábek, O., and Kapička, A. (2015). Soil aggregate stability within morphologically diverse areas[J]. Catena 127, 287–299. doi:10.1016/j.catena.2015.01.010
Keli, Z., Wenying, P., and Hongli, Y. (2007). Soil erodibility value and its estimation in China. Acta Soil Sci. 44, 7.
Khan, F. U., Khan, A. A., Li, K., Xu, X., Adnan, M., Fahad, S., et al. (2022). Influences of long-term crop cultivation and fertilizer management on soil aggregates stability and fertility in the loess plateau, northern China. J. Soil Sci. Plant Nutr., 1–12. doi:10.1007/s42729-021-00744-1
Lal, R., Lal, L., and Lal, S. (2000). Physical management of soils of the tropics: Priorities for the 21st century. Soil Sci. 165, 191–207. doi:10.1097/00010694-200003000-00002
Ma, R., Hu, F., Xu, C., Liu, J., and Zhao, S. (2022). Response of soil aggregate stability and splash erosion to different breakdown mechanisms along natural vegetation restoration. Catena 208, 105775. doi:10.1016/j.catena.2021.105775
Madari, B., Machado, P., Torres, E., Andrade, A., and Valencia, L. (2005). No tillage and crop rotation effects on soil aggregation and organic carbon in a Rhodic Ferralsol from southern Brazil. Soil. Tillage Res. 80, 185–200. doi:10.1016/j.still.2004.03.006
Mcbride, M. B. (2022). Estimating soil chemical properties by diffuse reflectance spectroscopy: Promise versus reality. Eur. J. Soil Sci. 73, e13192. doi:10.1111/ejss.13192
Mo, J., Feng, J., He, W., Liu, Y., Cao, N., Tang, Y., et al. (2022). Effects of polycyclic aromatic hydrocarbons fluoranthene on the soil aggregate stability and the possible underlying mechanism. Environ. Sci. Pollut. Res. 7, 1–11. doi:10.1007/s11356-022-22855-7
Ojeda, G., Alcaniz, J. M., and Bissonnais, Y. L. (2008). Differences in aggregate stability due to various sewage sludge treatments on a Mediterranean calcareous soil. Agric. Ecosyst. Environ. 125, 48. doi:10.1016/j.agee.2007.11.005
Rana, S., Cheng, X., Wu, Y., Hu, C., Jemim, R. S., Liu, Z., et al. (2022). Evaluation of soil and water conservation function in the Wugong mountain meadow based on the comprehensive index method[J]. Heliyon 8 (12), e11867. doi:10.1016/j.heliyon.2022.e11867
Roth, C. H., and Eggert, T. (1994). Mechanisms of aggregate breakdown involved in surface sealing, runoff generation and sediment concentration on loess soils. Soil. Tillage Res. 32, 253–268. doi:10.1016/0167-1987(94)90024-8
Shen, C., Wang, Y., Zhao, L., Xu, X., Yang, X., and Liu, X. (2019). Characteristics of material migration during soil erosion in sloped farmland in the black soil region of Northeast China[J]. Trop. Conserv. Sci. 12, 1940082919856835. doi:10.1177/1940082919856835
Van Den Bergh, J., Jeroen, C., and Verbruggen, H. (1999). Spatial sustainability, trade and indicators: An evaluation of the 'ecological footprint. Ecol. Econ. 29, 61–72. doi:10.1016/s0921-8009(99)00032-4
Wang, J., Deng, Y., Li, D., Liu, Z., Wen, L., Huang, Z., et al. (2022). Soil aggregate stability and its response to overland flow in successive Eucalyptus plantations in subtropical China. Sci. Total Environ. 807, 151000. doi:10.1016/j.scitotenv.2021.151000
Wirtz, S., Seeger, M., and Ries, J. B. (2012). Field experiments for understanding and quantification of rill erosion processes. Catena 91, 21–34. doi:10.1016/j.catena.2010.12.002
Wu, X., Wei, Y., Wang, J., Di, W., and Cai, C. (2017). Effects of soil physicochemical properties on aggregate stability along a weathering gradient. Catena 156, 205–215. doi:10.1016/j.catena.2017.04.017
Wuddivira, M. N., Stone, R. J., and Ekwue, E. I. (2009). Clay, organic matter, and wetting effects on splash detachment and aggregate breakdown under intense rainfall. Soil Sci. Soc. Am. J. 73, 226–232. doi:10.2136/sssaj2008.0053
Xu, X., Zheng, F., Wilson, G. V., He, C., Lu, J., and Bian, F. (2018). Comparison of runoff and soil loss in different tillage systems in the Mollisol region of Northeast China. Soil Tillage Res. 177, 1–11. doi:10.1016/j.still.2017.10.005
Yan, S., Xiaoping, Z., Aizhen, L., Wenfeng, L., and Xueming, Y. (2008). Soil loss form analysis of black soil slope cultivated land——taking a rainfall as an example. Dryland Agric. Res. 26, 6.
Yang, Z., Enheng, W., and Xiangwei, C. (2008). Characteristics of black soil splash erosion and aggregate sorting under simulated rainfall conditions. J. Soil Water Conservation 22, 4. doi:10.1371/journal.pone.0154591
Zhang, G. H., Liu, Y. M., Han, Y. F., and Zhang, X. C. (2009). Sediment transport and soil detachment on steep slopes: I. Transport capacity estimation. Soil Sci. Soc. Am. J. 73, 1291–1297. doi:10.2136/sssaj2008.0145
Zhang, X., Zheng, F., Bin, W., and Juan, A. (2011). Relationship between soil aggregate stability and organic matter in sloping cultivated land in black soil area with different reclamation years. J. Shaanxi Normal Univ. 34, 695. doi:10.1081/CSS-120018969
Zhizhen, F., Fenli, Z., Wei, H., Li, G., and Xu, X. (2018). Impacts of mollic epipedon thickness and overloaded sediment deposition on corn yield in the Chinese Mollisol region. Agric. Ecosyst. Environ. 257, 175. doi:10.1016/j.agee.2018.02.010
Keywords: black soil, soil erosion, combined erosion, cultivated land with long gentle slope, slope length, aggregate
Citation: Wang Y, Xu Y, Yang H, Shen H, Zhao L, Zhu B, Wang J and Guo L (2023) Effect of slope shape on soil aggregate stability of slope farmland in black soil region. Front. Environ. Sci. 11:1127043. doi: 10.3389/fenvs.2023.1127043
Received: 19 December 2022; Accepted: 19 January 2023;
Published: 20 February 2023.
Edited by:
Kaibo Wang, Institute of Earth Environment (CAS), ChinaReviewed by:
Xingyi Zhang, Key Laboratory of Mollisols Agroecology, Northeast Institute of Geography and Agroecology (CAS), ChinaCopyright © 2023 Wang, Xu, Yang, Shen, Zhao, Zhu, Wang and Guo. This is an open-access article distributed under the terms of the Creative Commons Attribution License (CC BY). The use, distribution or reproduction in other forums is permitted, provided the original author(s) and the copyright owner(s) are credited and that the original publication in this journal is cited, in accordance with accepted academic practice. No use, distribution or reproduction is permitted which does not comply with these terms.
*Correspondence: Huibo Shen, c2hlbmh1aWJvQDE2My5jb20=
Disclaimer: All claims expressed in this article are solely those of the authors and do not necessarily represent those of their affiliated organizations, or those of the publisher, the editors and the reviewers. Any product that may be evaluated in this article or claim that may be made by its manufacturer is not guaranteed or endorsed by the publisher.
Research integrity at Frontiers
Learn more about the work of our research integrity team to safeguard the quality of each article we publish.