
94% of researchers rate our articles as excellent or good
Learn more about the work of our research integrity team to safeguard the quality of each article we publish.
Find out more
ORIGINAL RESEARCH article
Front. Environ. Sci., 11 April 2023
Sec. Soil Processes
Volume 11 - 2023 | https://doi.org/10.3389/fenvs.2023.1123510
This article is part of the Research TopicAgricultural Non-Point Source Pollution and Greenhouse Gas: Emission, Control, and ManagementView all 7 articles
 Connie T. F. Wong1,2*
 Mia Falcone2
 Geovan Rich2Craig Stubler2Bwalya Malama2
 Cristina Lazcano1
 Charlotte Decock2
Compost application is commonly considered by winegrape producers to improve soil health while sequestering carbon (C) and mitigating climate change. However, inputs of available C and nitrogen (N) as nutrients can induce emissions of greenhouse gases (GHG) such as carbon dioxide (CO2) and nitrous oxide (N2O). A 2-year field experiment in a Mediterranean vineyard on the California Central Coast was conducted to investigate the short-term effects of compost application at four different rates on soil C dynamics and greenhouse gas emissions. Two years of greenhouse gas sampling were performed using static chambers at vineyard management events in two functional locations (tractor row and under the vines). Soil samples were collected annually in spring at the same locations at 0–15, 15–30 and 30–60 cm depth, and during greenhouse gas sampling at 0–15 cm. The increasing compost application rate did not increase soil C stock, cumulative greenhouse gas emissions and global warming potential. The increase in active soil C observed to the depth of 60 cm suggests that increasing the compost application rate up to the rate of 13.5 Mg ha-1 year-1 can facilitate the early stages of C stabilization and sequestration. Compost application did not have a significant effect on grape yield or cover crop growth during the study. Our results provided important information on the potential environmental tradeoffs as greenhouse gas emissions from compost applications, which should be taken into account when considering the vineyard C budget.
Over the past decades, soils have been increasingly suffering from erosion loss, or threatened by problems related to human activities and agricultural production (Marras et al., 2015). Many regional, national and international incentives aimed at promoting conservation of soil health and mitigating climate change have been introduced to the industry in recent years, including the international “4 per 1000” initiative announced at the Climate Summit in France in 2015 (Minasny et al., 2017), and the Healthy Soils Program launched by the California Department of Food and Agriculture (CDFA) in 2017 (Ross, 2016). Under these initiatives, many conventional cropping systems across the globe began to adopt management practices that promote soil organic matter (SOM), soil carbon (C) sequestration and potentially mitigate greenhouse gas (GHG) emissions (Paustian et al., 2019).
Grapevine cultivation for winemaking has long been rooted in European culture and has vastly expanded worldwide (International Organization of Vine and Wine, 2017); as of 2021, there are more than 300,000 ha of harvested grapevines in California according to the CDFA. Traditional vineyard operations require intensive agricultural practices, most notably the use of mechanical tillage and the application of synthetic fertilizers, herbicides, or pesticides. The deterioration of vineyard soil is evident in literature, with observed trends of soil erosion, organic matter depletion, and loss of biodiversity (Le Bissonnais et al., 2007; Martínez-Casasnovas et al., 2009; Komárek et al., 2010; Polge de Combret - Champart et al., 2013), and is particularly threatening vineyard soil health and functions (Salomé et al., 2016). Efforts to restore and improve health and productivity of vineyard soils are therefore of utmost importance to maintain sustainability of this cropping system.
Compared to annual crops, perennial grapevines have a larger potential for C sequestration (Carlisle et al., 2010). The woody biomass and extensive deep root systems in grapevines provide a great soil C storage potential (Kroodsma and Field, 2006; Agnelli et al., 2014), which can be further enhanced with appropriate soil management practices (Lal, 2011). In vineyards, compost application is a common soil and nutrient management practice that is often used to provide a direct input of C and other nutrients to the soil (Lal, 2004). The addition of C triggers an increase in microbial activity which promotes aggregate formation (Six et al., 2004), thereby facilitating stabilization and sequestration of C. A large amount of scientific literature has shown the positive effects of compost application on not only SOM and C sequestration (Pinamonti, 1998; Korboulewsky et al., 2002; Morlat and Chaussod, 2008; Brown and Cotton, 2011; Mugnai et al., 2012; Peregrina et al., 2012; Rubio et al., 2013; Calleja-Cervantes et al., 2015a; Calleja-Cervantes et al., 2015b; Gaiotti et al., 2017; Mondini et al., 2018), but also other chemical and physical properties such as nutrient availability, moisture retention, and aggregate stability (Morlat and Chaussod, 2008; Calleja-Cervantes et al., 2015a; Calleja-Cervantes et al., 2015b; Ramos, 2017; Mondini et al., 2018). Increases in soil stabilized C can have a lasting effect after one single compost application (Ryals et al., 2014) or repetitive annual additions of compost over two decades (Morlat and Chaussod, 2008). Moreover, positive effects on other soil C sequestration indicators that are sensitive to management-induced changes, such as permanganate oxidizable carbon (POXC) and mineralizable C (Min C), can be observed in short term (Culman et al., 2013; Hannam et al., 2016; Hurisso et al., 2016). Long-term compost application can result in an increase in the large macroaggregate (LM) fraction, reflecting the tendency of C sequestration (Liu et al., 2021). It can be assumed that increasing compost application rate increases SOM, and hence provides more soil health benefits and leads to an increase in C sequestration, until the soil reaches an equilibrium where C inputs are roughly equal to losses through mineralization processes after long-term practice (Morlat and Chaussod, 2008).
However, the labile organic C addition from compost application can potentially result in the subsequent increase of microbial activity and release of carbon dioxide (CO2) (Calleja-Cervantes et al., 2015a; Calleja-Cervantes et al., 2015b) and nitrous oxide (N2O) (Bustamante et al., 2011; Lazcano et al., 2013; Verhoeven et al., 2017). Aerobic nitrification of ammonium (NH4+) to nitrate (NO3−) and anaerobic denitrification are the two main processes that produce nitrous oxide (N2O) as a by-product, and are greatly dependent on oxygen, moisture contents and water filled pore space (WFPS; Verhoeven et al., 2017). These drivers of soil N2O emissions are often affected by agricultural management practices, such as fertilization and irrigation (Oertel et al., 2016). N2O emissions have been found to increase with increasing soil mineral nitrogen (N) concentration following fertilizer application (Dobbie et al., 1999). While perennial crops such as grapevines can act as C storage facilities and climate change mitigating systems, the results from these studies suggest that the use of compost in vineyards may have short-term environmental tradeoffs between soil health benefits and greenhouse gas (GHG) emissions (Lazcano et al., 2013; Cheng et al., 2015). These environmental tradeoffs may be influenced by compost application rate (Fabrizio et al., 2009; Martínez-Blanco et al., 2013; Chenu et al., 2019).
Here we evaluated whether the soil health benefits from compost application increase with increasing application rates, and whether these benefits observed in a vineyard soil outweigh the potential environmental impacts in the form of GHG emissions, by investigating 1) soil C dynamics, 2) N2O and CO2 emissions and global warming potential (GWP), and 3) cover crop C and N contents, and grape yield after two annual compost applications. We hypothesized that total soil C stocks would not change after two years of compost application, due to the short-term treatments and the low input of C compared to the initial soil C content. However, POXC, Min C and aggregate stability were expected to increase with increasing compost application rate, indicating a trend toward C stabilization, and an increase in microbial activity. We expected no significant differences in GHG emissions between treatments. We further hypothesized that the increase in compost application rate would increase cover crop growth after two compost applications, while grape yield would remain unaffected.
This study was conducted in a commercial vineyard (Vitis vinifera, var. Cabernet Sauvignon) located in the Paso Robles American Viticultural Area (AVA), California between October 2018—November 2020 (Figure 1). This region has a warm Mediterranean climate with hot, dry summers; the average temperature and annual precipitation of the region are 18°C and 385 mm, respectively. During the experimental period, the recorded average temperature at the site was 15.1°C with an average annual precipitation of 318 mm (Figure 2). The experimental site location has both the San Ysidro series (Fine, smectitic, thermic Typic Palexerolls) and the Arbuckle-San Ysidro complex, which consists of 40% of Arbuckle series (Fine-loamy, mixed, superactive, thermic Typic Haploxeralfs) and 20% of San Ysidro series (Soil Survey Staff, 2021). The soil texture is sandy loam, with 20% clay and 40% sand. The average bulk densities are 1.24 and 1.45 g cm-3 at 0–15 and 15–30 cm depth respectively, based on our pre-treatment baseline measurements.
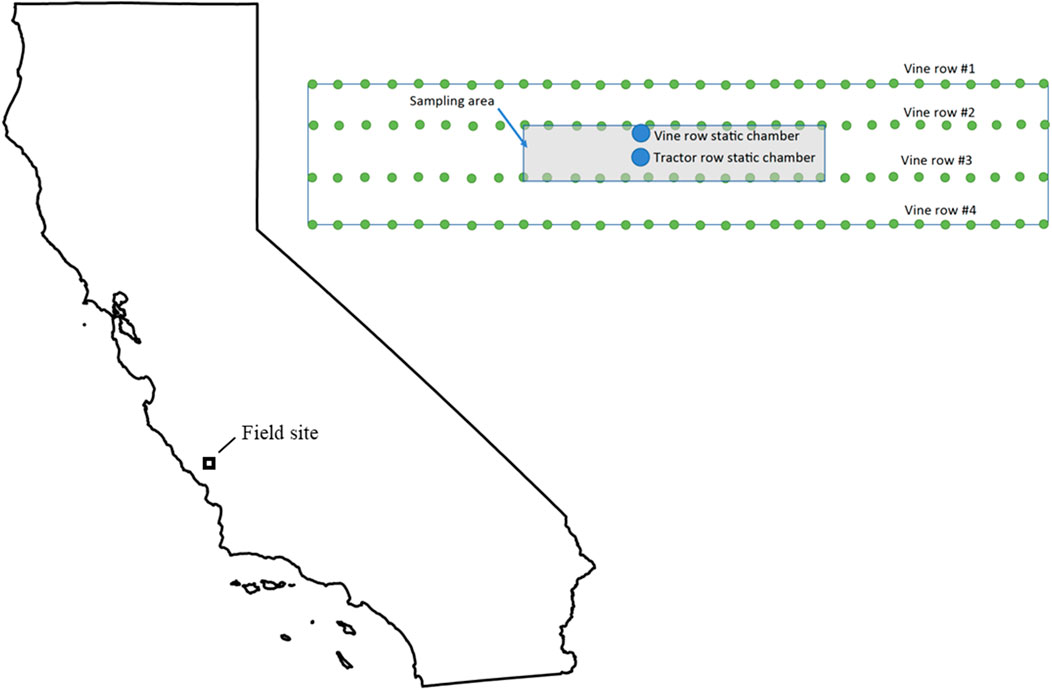
FIGURE 1. A geographical map of the field site located in Paso Robles, CA, and a schematic of the experimental design of the study illustrating the sampling area and the functional locations.
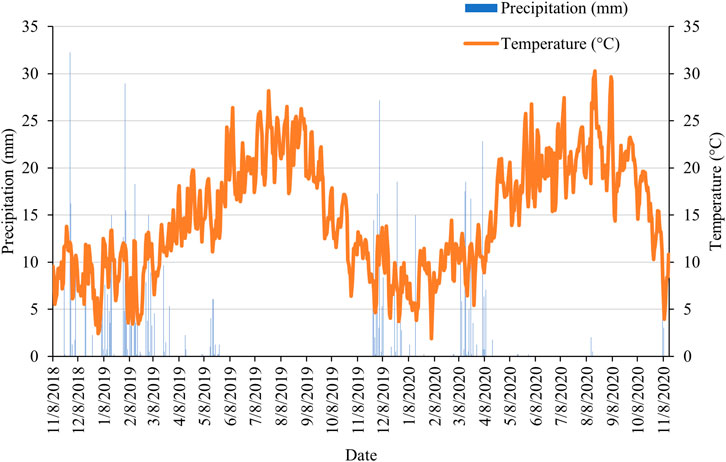
FIGURE 2. Precipitation and temperature recorded at the experimental site over the course of the study.
The grafted vines at this site are clone eight Cabernet Sauvignon on 5C rootstock planted in 1989. Vines are arranged in rows with a spacing of 1.8 m between vines and 3 m between rows. Cover crop consisted of 15% foxtail (Bromus hordeaceus) and 85% Zorro Fescue (Vulpia myuros) and was allowed to reseed naturally every year. The vineyard was under no-till management and drip irrigation. No fertilizers were added to the experimental site during the project timeline, while herbicides were sprayed under the vines as needed.
The experimental setup was a randomized complete block design with four blocks and four treatments randomly distributed within each block: 0 (control), 4.5, 9.0, and 13.5 Mg ha-1 year-1 (fresh weight) compost application rates, resulting in a total of 16 plots. The selection of treatments was based on the CDFA Healthy Soils Incentives Program recommendation for compost application on tree crops with compost C:N ratios of ≤11, the practical range of compost application rate commonly found in the area, and the local growers’ concern of excessive soil N level caused by high compost application rates based on personal communication with growers and vineyard advisors in the region. The plots were 55 m long and 9 m wide, including four rows of 30 vines and three interrow areas (tractor rows) each, with a total plot area of 485 m2. Soil, GHG, cover crop and grape sampling were only done in the two middle vine rows and the middle tractor row, with two sampling (functional) locations designated as under the vines, and the tractor row.
Organic compost (certified through CDFA’s Organic Input Materials Program) used in this study was made of processed livestock manure and green waste, with a C:N ratio of about 9–10. (Table 1). In year 1, the compost was applied between harvest and the first occurrence of fall precipitation, on November 9th and 10th, 2018. In year 2, compost was applied on 10 January 2020. Compost was broadcasted over the entire vineyard floor.
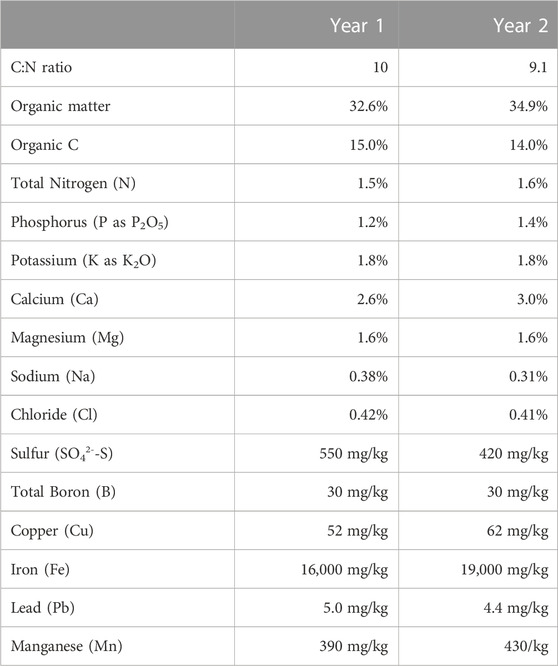
TABLE 1. Properties of the certified organic compost applied in November 2018 (Year 1) and January 2020 (Year 2). Values represent the dry weight of each nutrient contained in the compost.
Soil samples were collected from the two functional locations of each plot on April 23–24th, 2018 to establish baseline soil data prior to compost application, and subsequently on April 10th, 2019 and April 24th, 2020, for analysis of treatment effects. Soil samples were collected at depths of 0–15 cm, 15–30 cm and 30–60 cm. Additionally, topsoil samples were collected at the 0–15 cm depth during GHG sampling for determination of WFPS (the volumetric ratio of soil water content to porosity) and plant-available N (ammonium, NH4+-N, and nitrate, NO3−-N) concentrations. All soil samples were transferred to the soil laboratory and stored at 4°C for analysis.
A sampling of cover crop aboveground biomass occurred immediately before the mowing event in spring 2019 using a 1 m2 quadrant, and the samples were transported to the lab for biomass (2019 only) and total C and N content measurements. Grapes were harvested on October 19th, 2019, and October 17th, 2020, at approximately 23 °Brix. All clusters from ten randomly selected vines were hand-picked. The average number of clusters per vine and the average fresh weight of cluster per vine were determined to calculate grape yield in ton ha-1. Around 250 individual berries were randomly collected from vines within the sampling areas to determine average fresh berry weight.
Gas samples were collected on the day before and 4 days after main management events (Verhoeven and Six, 2014). Fluxes were assessed through the static chamber technique (Hutchinson and Mosier, 1981; Parkin and Venterea, 2010), where 20 mL of gas samples were taken at 15-min intervals (0, 15, 30, and 45 min after closure of chamber) using an air-tight polypropylene syringe. Temperatures within the closed chambers were measured by a Fisherbrand™ Traceable™ total-range thermocouple thermometer (Pittsburgh, PA, United States). Gas samples were stored in pre-evacuated 12-mL glass Exetainers® vials (Labco, Buckinghamshire, England), and analyzed using Shimadzu GC-2014 Ga Chromatograph (GC; Columbia, MD, United States). Fluxes of CO2 (kg CO2-C ha-1 day-1) and N2O (g N2O-N ha-1 day-1) were calculated using the ideal gas law based on the chamber temperature, volume, and surface area. The fluxes of both gases were set to zero if the difference between maximum and minimum concentrations measured during chamber closure was smaller than the detection limit.
Linear and non-linear regressions were computed to determine the flux value, and the latter used the quadratic output of the LINEST function in Excel (Verhoeven and Six, 2014). Daily CO2 and N2O fluxes were used to calculate cumulative area-scaled CO2 and N2O emissions using trapezoidal integration of fluxes versus time, assuming that the changes of fluxes were linear between measurement dates. The reported cumulative emissions of CO2 and N2O were determined by season. We defined that the dry season started on the first day of cover crop mowing (early to mid-April) and overlapped with the vine growing season (April–October), while the wet season started after the harvest event (November–March) when the associated N2O fluxes had subsided to background level, overlapping with vine dormancy.
Net global warming potential (GWP) was calculated using the changes in soil C stock (ΔSOC) over the 2-year experimental period and cumulative annual N2O emissions transformed, both converted to CO2 equivalents (Six et al., 2004). The ΔSOC and N2O emissions were adjusted based on the area occupied by tractor row (approximately 52.6%) and vine row (approximately 47.4%). The global warming potential for N2O emissions was adopted from IPCC AR6 (IPCC, 2021), where 1 kg N2O = 273 kg CO2 for a given 100-year time horizon.
Prior to analysis, soil samples were sieved to 8 mm. Gravimetric soil moisture content was determined by drying at 105°C for 24 h, and was then used to calculate oven-dried mass of the undisturbed soil core for bulk density (g cm-3) determination. Remaining soil subsamples were air-dried for subsequent soil analyses. Total soil C (%) and N (%) were determined by combustion in a Vario Max CNS elemental analyzer (Elementar, Langenselbold, Hesse, Germany) at 900°C. POXC was determined colorimetrically using the revised protocol described in Weil et al. (2003), where 2.5 g air-dried soil samples reacted with 0.2 M potassium permanganate solution, and the resulted solution absorbance was measured by a Spectronic 20 spectrophotometer (Milton Roy, Houston, Texas, United States) at 550 nm. Min C was determined by rewetting air-dried soil samples to 50% water-holding capacity and measuring CO2 concentration (mg CO2-C kg-1 soil hr-1) with a Li-COR Li-850 CO2/H2O gas analyzer (Lincoln, NE, United States) after a 48-h incubation. Aggregate fractionation was measured only after the second compost application because the effects of compost on aggregation may not be detected immediately. Approximately 80 g of air-dried soil were wet-sieved based on the methodology described in Six et al. (2000) to separate into four aggregate-size fractions: silt and clay (S + C; <53 μm), microaggregate (m; 53–250 μm), small macroaggregate (SM; 250–2000 μm), and large macroaggregate (LM; 2000–8000 μm). Aggregate stability was determined by mean weight diameter (MWD) and geometric mean diameter (GMD) calculated from the equations:
where n is the number of size fractions,
Soil samples collected at the time of GHG sampling were analyzed for WFPS and plant-available N concentrations. To determine plant-available N concentrations, samples were extracted with 2 M potassium chloride solution and analyzed using a colorimetric method with a Thermo Scientific Evolution 201 UV-visible spectrophotometer (Madison, WI, United States) (Doane and Horwáth, 2003).
All cover crop samples were oven-dried at 60°C for 24 h for determination of dry biomass. The dry plant tissue was analyzed for C (%) and N (%) using a Vario Max CNS elemental analyzer at 900°C. Average fresh grape berry weight (g) was measured from the berry samples collected during harvest.
Linear mixed effects analysis was performed using the package lme4 (Bates et al., 2014) in R version 4.1.3 to assess the effects of various factors for each response variable. Three-way split-plot-factorial ANOVA was used with compost application rate as main factor, and location and depth as subplot factors on the following variables: total C and N content, POXC and Min C concentrations, bulk density, MWD, GMD, and aggregate fractionation. Two-way split-plot-factorial ANOVA was used with rate as main factor and location as subplot factor on seasonal cumulative CO2 and N2O emissions. One-way repeated measures ANOVA was used with rate as the only factor on GWP, cover crop and grape yield measurements. Normal distribution of residuals and homogeneity of variance were tested using the Shapiro-Wilk and Levene’s test. We used the non-parametric Spearman’s rank correlation test to assess the relationship between daily N2O fluxes and variables driving N2O emissions, including daily CO2 fluxes, NO3−-N and NH4+-N concentrations, WFPS, as residuals of Pearson correlations were not normally distributed, and there was no suitable data transformation to meet the assumptions.
Total C stocks to 60 cm depth were higher in the tractor row (33.3 Mg C ha-1) than that in the vine row (24.9 Mg C ha-1; Depth: p < 0.001), however, no statistical differences were found among compost application rates. Soil C stocks in 2020 after two compost applications were also the highest in the tractor row topsoil across all treatments when compared to the vine row and subsoil depths (Table 2A).
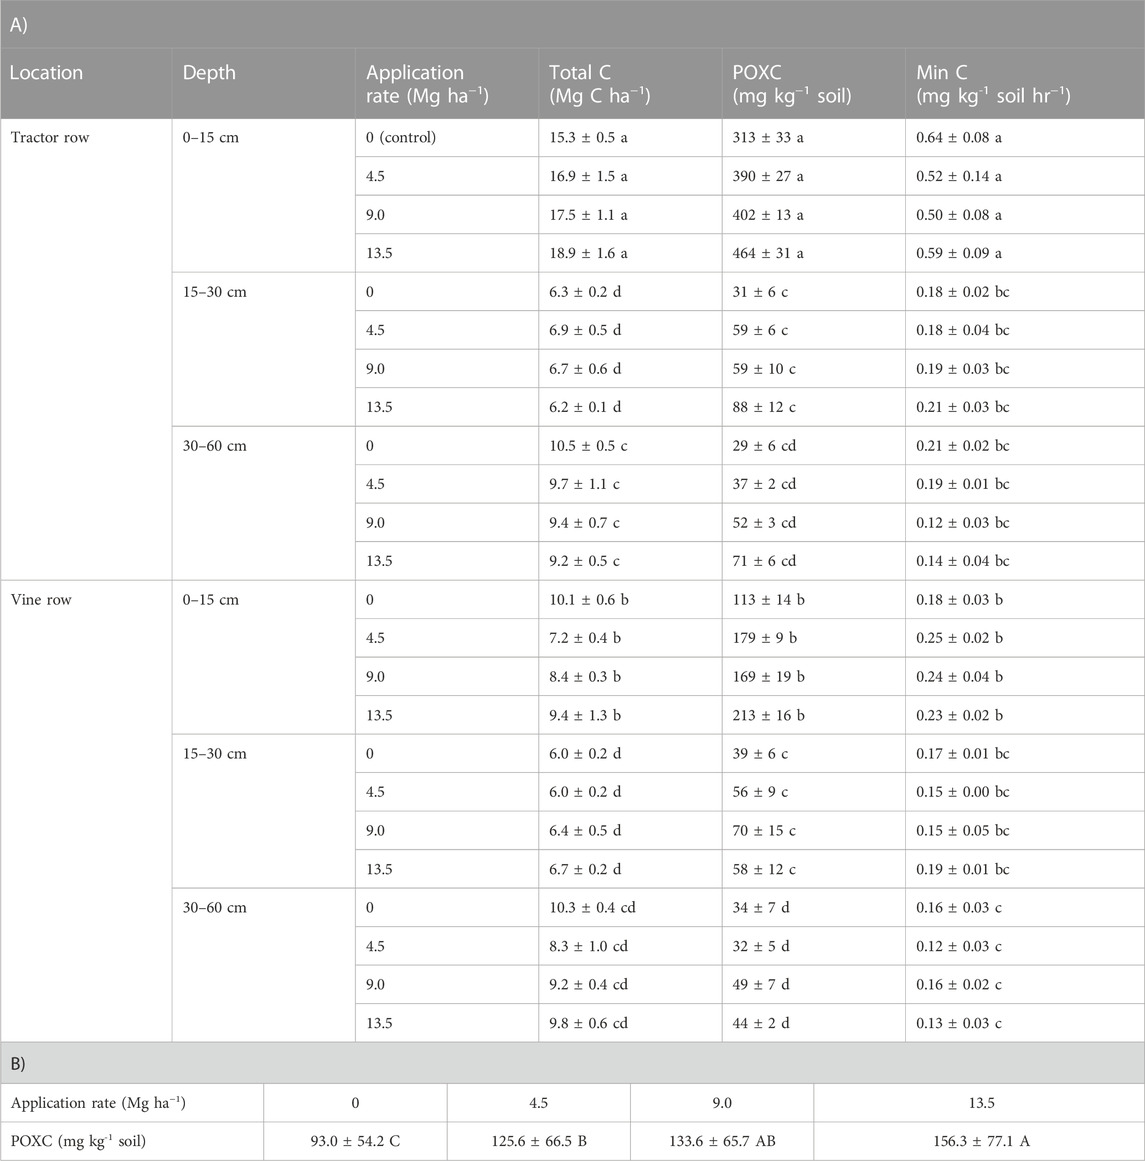
TABLE 2. A) Total soil C, POXC and Min C ± standard errors of the means (n = 4) as affected by compost application rate, functional location and depth in April 2020. Lowercase letters within the same column indicate significant interactive effects of location and depth at p < 0.05. B) Averages of POXC ± standard errors of the means (n = 4) by compost application rate in April 2020. Uppercase letters indicate significant main effect of the treatments at p < 0.05.
Compost application rate had a significant effect on POXC concentrations after two consecutive annual applications (Rate: p < 0.001; Table 2B). The average POXC concentration in 2020 was 156.3 mg C kg-1 soil at the rate of 13.5 Mg ha-1, which was significantly higher than that at the rates of 4.5 and 0 (control) Mg ha-1 (125.6 and 93.0 mg C kg-1 soil, respectively). In addition, both POXC and Min C concentrations were higher in the tractor row topsoil than the subsoil, and higher than all depths in the vine row (Location × Depth: p < 0.001, Table 2A). Min C, unlike POXC, did not significantly increase with the increasing compost application rate (Table 2A). After two years of compost application, Min C concentration was higher in the topsoil than the 15–30 cm and 30–60 cm depths (Location × Depth interaction: p < 0.001).
The distribution of the large macroaggregates (LM) fraction was subjected to a significant interactive effect of location and depth (Figure 3). There were significantly more LM in the tractor row topsoil than the subsoil (Location × Depth: p < 0.001) as well as both depths in the vine row (p < 0.001). Note that there were more LM in the tractor row topsoil with 9.0 and 13.5 Mg ha-1 compost application rates than the control (Rate × Location × Depth: p = 0.0755), which indicates a marginal positive effect of compost application on LM formation in the topsoil. Significant differences were found between the two depth increments in small macroaggregates (SM) (Depth: p = 0.048; Figure 3), microaggregates (m) (Depth: p = 0.013; Figure 3), and silt and clay (S + C) fractions (Depth: p = 0.019; Figure 3). More SM were found in the topsoil than in the subsoil at both locations, but the opposite trend was observed in the m and S + C fractions at both locations.
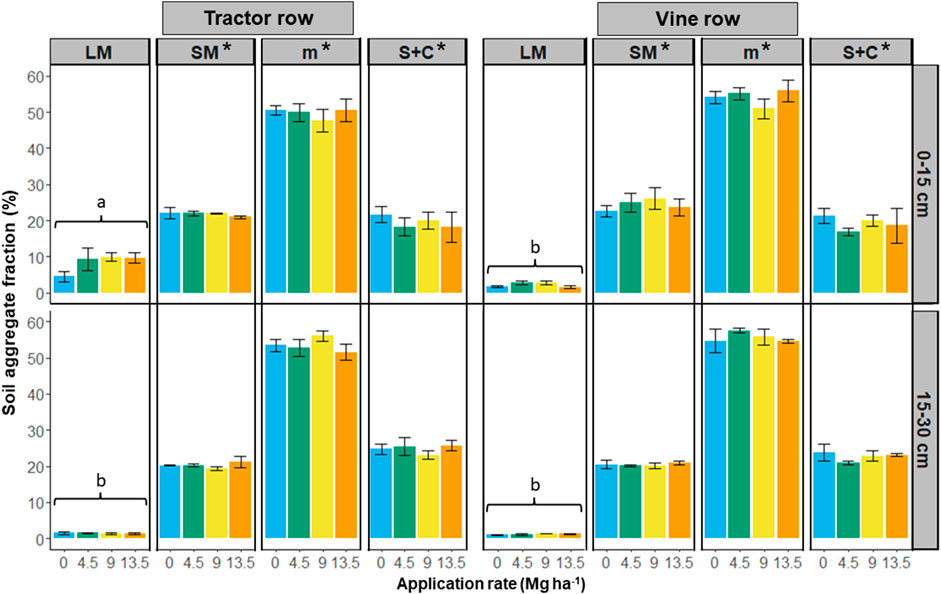
FIGURE 3. Fractions (%) of soil aggregates by size and functional location at the depths of 0–15 and 15–30 cm after two years of compost application. LM, SM, m, and S + C represent: large macroaggregate, small macroaggregate, microaggregate, and silt and clay, respectively. Error bars are standard errors of the means (n = 4). Lowercase letters indicate significant differences between locations and depths, while asterisks (*) indicate significant differences between depths at p < 0.05 within each aggregate size category.
Aggregate stability parameters (MWD and GMD) were higher in the tractor row topsoil than the subsoil or the vine row (Location × Depth: p < 0.001 (MWD); p = 0.002 (GMD); Table 3). When compost was applied at 9.0 Mg ha-1, MWD was significantly higher in the topsoil than that with no compost applied (Rate × Depth: p = 0.020).
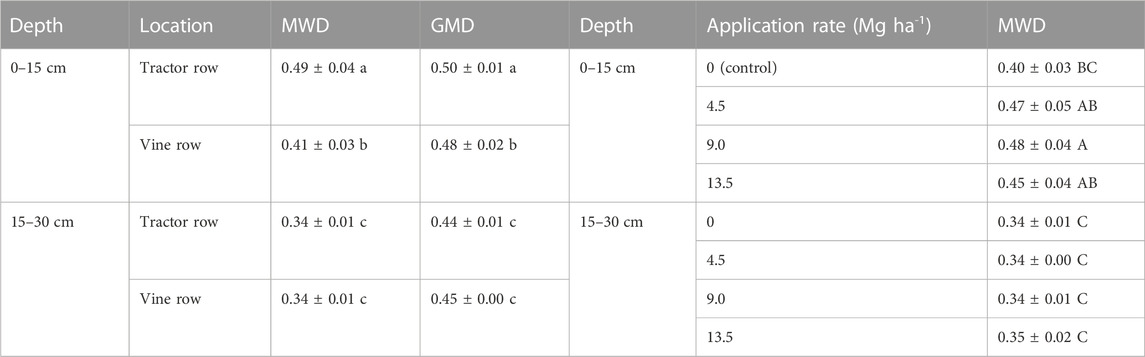
TABLE 3. Mean weight diameter (MWD) and geometric mean diameter (GMD) of soil aggregates, and the respective standard errors of means (n = 4) by functional location and depth (left), and by compost application rate and depth (right, shaded) in April 2020. Lowercase letters indicate significant differences between depths and locations, uppercase letters indicate significant differences between depth and rates.
Daily N2O fluxes ranged from −3.9–55.9 g N2O-N ha-1 day-1, and no significant differences were observed between treatments (Figure 4). The average annual cumulative N2O emissions were 0.47 ± 0.11 kg N2O-N ha-1 year-1 for the first post-compost application year, and 0.81 ± 0.15 kg N2O-N ha-1 year-1 for the second year. The seasonal cumulative emissions across all treatments and locations ranged from 0.10 ± 0.05 to 0.24 ± 0.07 kg N2O-N ha-1 season−1 throughout the entire experimental period and were significantly higher in the vine row than the tractor row during the first dry season (Location: p < 0.001; Figure 5). Average daily N2O fluxes in the tractor row were positively and significantly correlated with the average daily CO2 flux, soil NO3−-N and WFPS and were negatively and significantly correlated with the daily fluxes of NH4+-N (Table 4). In the vine row, average daily N2O fluxes were positively and significantly correlated with the daily nitrate-N fluxes only.
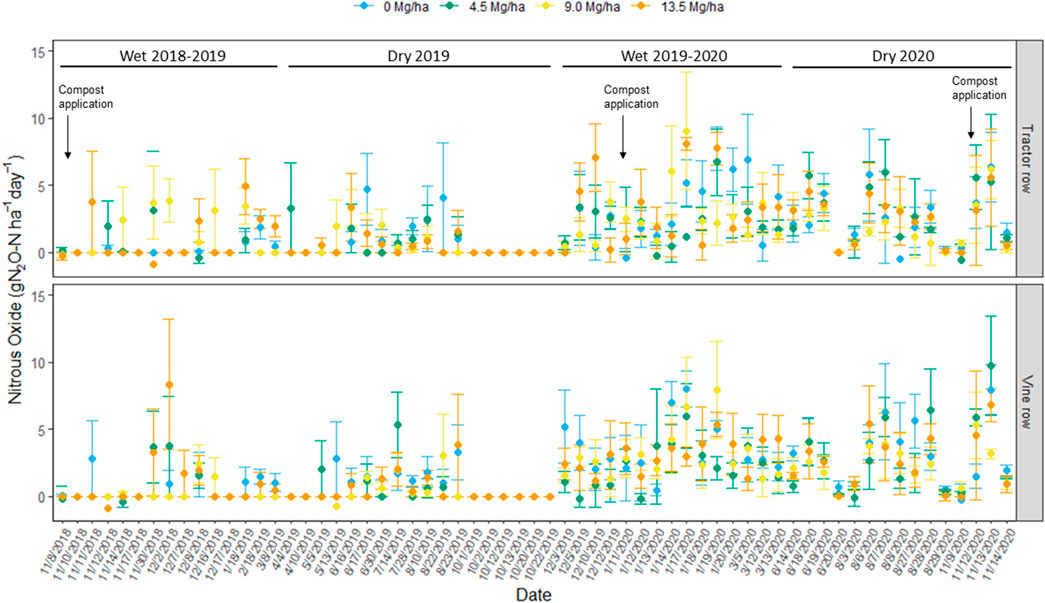
FIGURE 4. Average N2O daily fluxes ± standard errors (n = 4) in the tractor row and under the vines at the four compost application rates studied during November 2018—November 2020.

FIGURE 5. Cumulative N2O emissions by functional location under compost application treatments (0, 4.5, 9.0 and 13.5 Mg ha-1) during two wet and two dry seasons from 2018 to 2020. Error bars represent standard errors of the mean (n = 4). Asterisk (*) indicate significant differences between locations at p < 0.05 within the dry season.
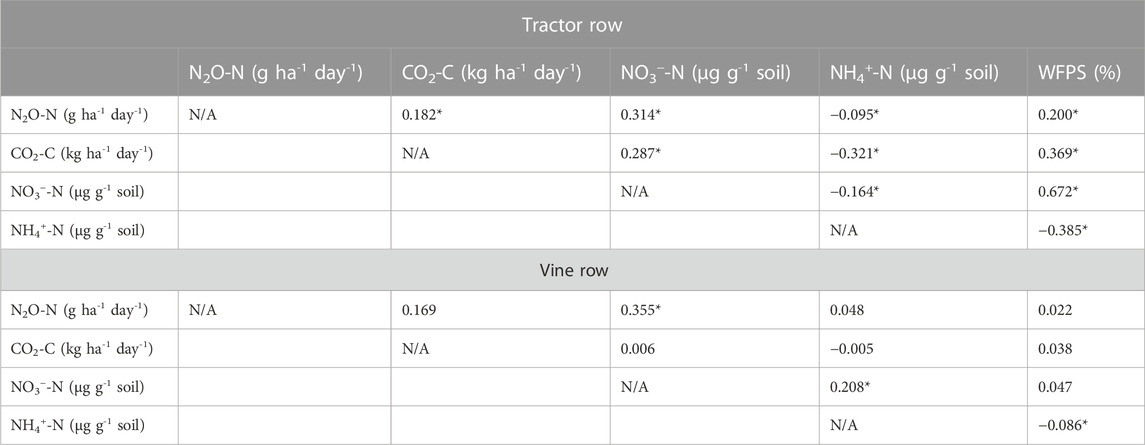
TABLE 4. Non-parametric Spearman correlation test on N2O daily flux vs. water-filled pore space (WFPS), soil mineral nitrogen concentrations (NH4+-N and NO3−-N), and CO2 daily flux by functional locations in October 2018—March 2020. Asterisks (*) indicate the significant correlations at p < 0.05.
Daily CO2 fluxes ranged from −2.9–123.5 kg CO2-C ha-1 day-1 (Figure 6) and were positively and significantly correlated with soil NO3−-N and WFPS, but negatively and significantly correlated with soil NH4+-N (Table 4). The annual cumulative CO2 emissions were 4980 ± 367 kg CO2-C ha-1 year-1 and 6510 ± 463 kg CO2-C ha-1 year-1 in the first and second year of the study, respectively. Seasonal cumulative CO2 emissions across all treatments and locations ranged from 900 ± 162 to 2500 ± 292 kg CO2-C ha-1 season−1 (Figure 7). During both wet seasons of the study, there were significantly higher CO2 emissions in the tractor row than in the vine row (Location: p < 0.001 for both wet seasons; Figure 6), while the trend was the opposite during the first dry season (Location: p < 0.001; Figure 6).
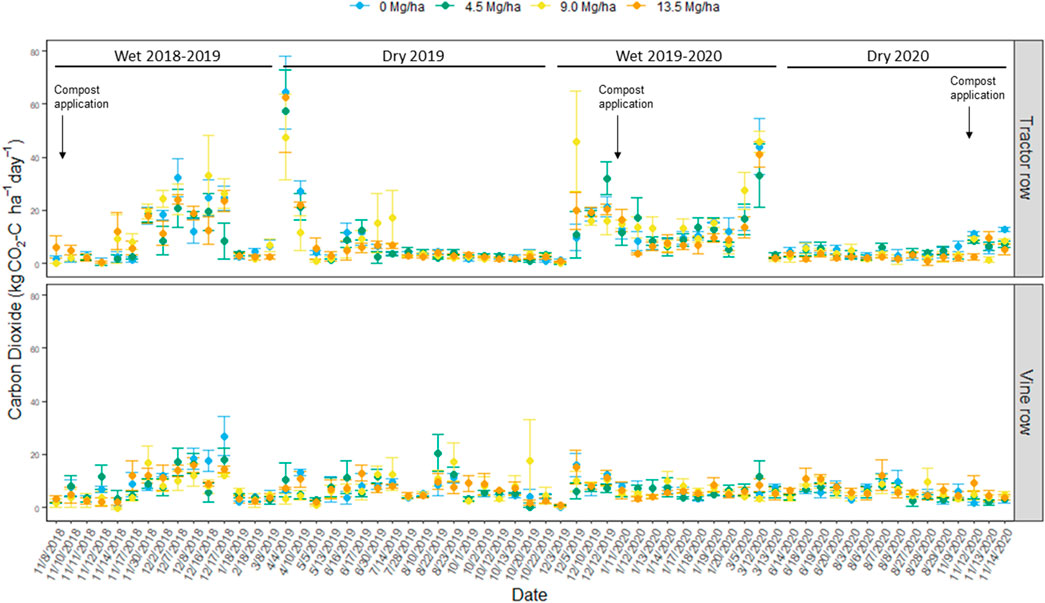
FIGURE 6. Average CO2 daily fluxes ± standard errors (n = 4) in the tractor row and under the vines at the four compost application rates during November 2018—November 2020.
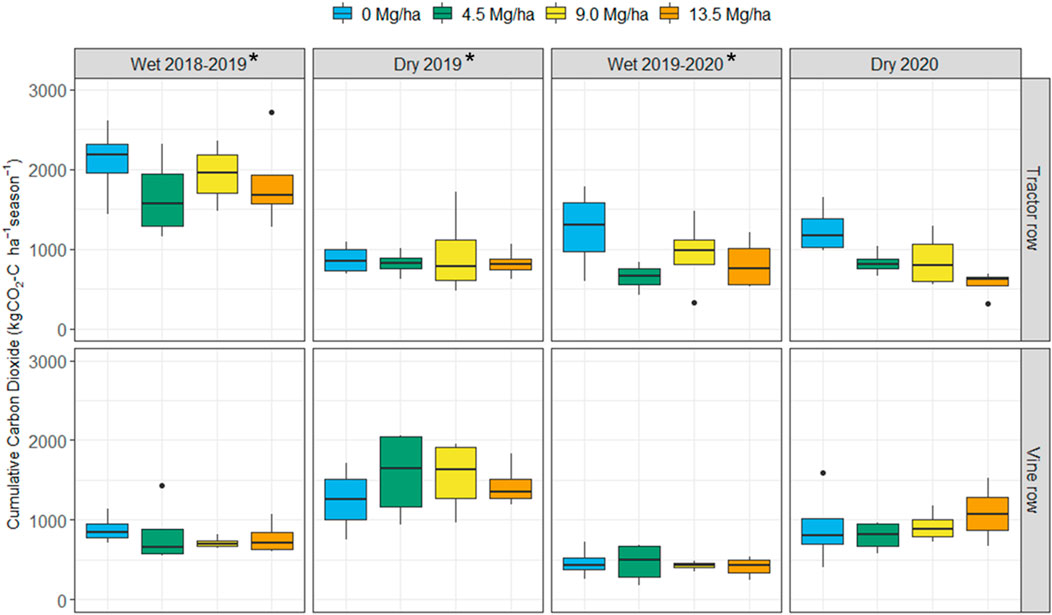
FIGURE 7. Cumulative CO2 emissions by functional location under compost application treatments (0, 4.5, 9.0 and 13.5 Mg ha-1) during two wet and two dry seasons from 2018 to 2020. Error bars represent standard errors of the mean (n = 4). Asterisks (*) indicate significant differences between locations within the same season and application rate at p < 0.05.
Based on the soil C and GHG emissions, soil C sequestration outpaced the N2O emissions, making this vineyard a net C sink. Yet, changes in total soil C stock, cumulative N2O emissions and global warming potential (GWP) were not significantly different between the four compost application treatments (Table 5).
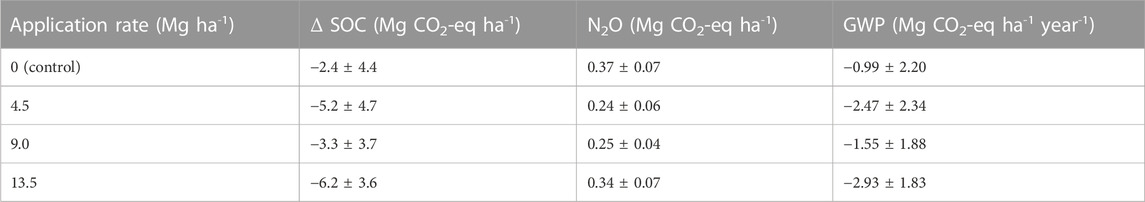
TABLE 5. Changes in SOC stocks, cumulative N2O emissions and global warming potential (GWP) evaluated in the study by compost application rate over the 2-year experimental period (2018–2020). Values are means (n = 4) ± standard errors.
No significant differences were found in cover crop biomass, C and N content, and C:N between the compost application rates (Table 6). The average cover crop biomass ranged between 227 and 316 g/m2 among the four treatments in 2019. Cover crop C was around 42% in 2019 and between 40% and 41% in 2020, while N content ranged between 1.27% and 1.82% in 2019, and between 1.30% and 1.67% in 2020. The resulting C:N ratios were between 24.2 and 33.4, and between 25.1 and 32.4 for 2019 and 2020, respectively. Similarly, there were no significant differences between treatments within each year of 2019 and 2020 (Table 6). Grape yield ranged between 10.6 and 11.5 tons ha-1 in 2019, and between 6.6 and 8.0 tons ha-1 in 2020.
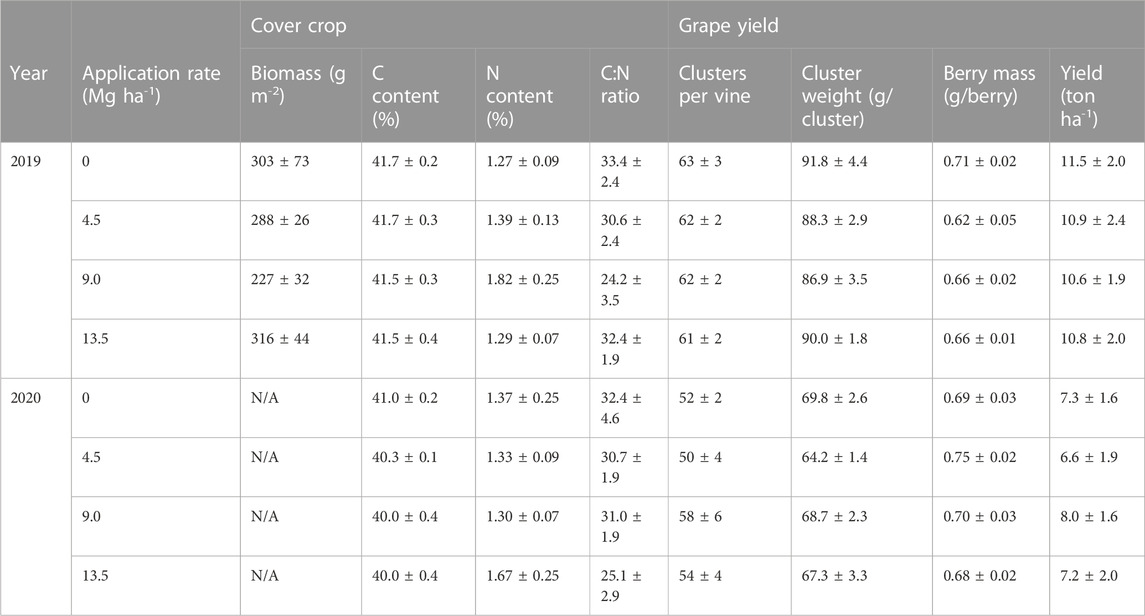
TABLE 6. Dry biomass and C content of cover crop, grape yield components, and the respective standard errors of the means (n = 4) by compost application rate in 2019 and 2020. Note that cover crop biomass was only measured in April 2019 after the first compost application.
Although increases in SOM and SOC from compost application have been widely reported (Pinamonti, 1998; Korboulewsky et al., 2002; Morlat and Chaussod, 2008; Brown and Cotton, 2011; Peregrina et al., 2012; Rubio et al., 2013; Calleja-Cervantes et al., 2015a; Calleja-Cervantes et al., 2015b; Hannam et al., 2016; Gaiotti et al., 2017), our results did not show a significant effect of compost addition on total soil C stock, confirming our initial hypothesis. This is likely due to the changes in C content from compost input being too small compared to the inherent C stock, and the slow C turnover rates in soil might cause any management-related fluctuations to take years or even decades to be detected.
The significant effect of compost application rate observed in POXC up to the 60 cm, depth, but not in Min C, suggests that applying compost up to the rate of 13.5 Mg ha-1 in a vineyard for two years can lead to stabilizing and potentially sequestering new C in soil without increasing C mineralization (Hurisso et al., 2016). Other studies such as Hannam et al. (2016) studied the interactive effects of three annual compost applications at rates equivalent to 15 g of available N per vine (C content unknown) on soil nutrient dynamics in a young Merlot vineyard, and found similar increase in total C and POXC in the compost-treated plots. Applying compost bi-yearly in an uncultivated grassland at a rate of 108.7 Mg ha-1 for eight years was also found to significantly increase POXC up to the depth of 30 cm, which agreed with our results (Liu et al., 2021). The significant increase in POXC with increasing compost input observed up to 60 cm depth in this study was an indication of C sequestration not only in topsoil, but also in the upper subsoil layer (Tautges et al., 2019). As Min C measures the flush of CO2 from rewetting soils through a short-term aerobic incubation (Haynes, 2005), the differences of Min C between top- and subsoil depths were likely attributed to the decrease in microbiological activity as soil depth increases (Tautges et al., 2019; Yost and Hartemink, 2020).
The greater macroaggregate fractions (LM + SM) but smaller m and S + C fractions in the topsoil than the subsoil could be explained by the natural distribution of soil organic matter and fauna populations, which promote soil aggregate formation (Six et al., 2004). The positive trend observed in the LM fraction from the two highest application rates matches with the marginally significant increase in the LM fraction after long-term (8 years) compost application found in Liu et al. (2021). Moreover, the presence of cover crop and roots in the tractor row could potentially be an extra C input through root exudation, which might further enhance microbial growth and LM formation (Tisdall and Oades, 1982; Six et al., 2004; Sokol et al., 2019; Schaefer et al., 2020).
Furthermore, soil structure stability generally increases with increasing average particle size of aggregation, which is indicated by increased value of MWD and GMD (Nimmo and Perkins, 2002). A 5-year study of compost application at 22 Mg ha-1 on semi-arid Mediterranean soil observed increased soil aggregate stability in response to compost application (Celik et al., 2004); however, another 4-year study investigating the effects of annual compost application at 8 and 25 Mg ha-1 in a semi-arid vineyard did not find any significant changes on soil stability (Peregrina et al., 2012). Our results suggest that the extra C input from compost could promote aggregate stability by influencing the drivers of aggregate formation such as biological activities of soil microorganisms and plant roots. Based on our findings, C inputs from compost application could increase the active C pool which was involved in the early stages of C stabilization in vineyard soil, while further confirmation is required to investigate the influence of the fibrous fine root system of cover crop coupling with the effects of compost application on indicators of soil C sequestration, such as soil respiration, aggregation and stability.
The lack of treatment effect on N2O fluxes and annual emissions could be due to the application rates with low N inputs, and the potential interference of any background N2O emissions from the soil ecosystem (Zhu-Barker et al., 2019). The average annual cumulative N2O emissions were also found to be comparatively lower than previously reported for California vineyards (Zhu-Barker et al., 2019). In agreement with our initial hypothesis, insignificant differences among the four compost treatments suggest that the environmental tradeoff in the form of N2O emissions may be minimal in vineyards. This finding partially resembled the study by Calleja-Cervantes et al. (2015a) and Calleja-Cervantes et al. (2015b), which reported insignificant changes in N2O emissions following the long-term application of sheep manure compost at the rate of 4.63 Mg ha-1, while N2O emissions increased significantly with the pelletized organic compost treatment. Our annual cumulative N2O emissions were also near the low limit of the annual N2O emissions of 0.56 ± 0.11 to 3.92 ± 0.65 kg N2O-N ha-1 year-1 documented in studies that have investigated GHG emissions in California vineyards (Garland et al., 2014; Verhoeven and Six, 2014). Studies on N2O emissions following organic fertilization in other California cropping systems such as walnut orchards also found relatively low ranges of annual N2O emissions from 1.09 ± 0.24 to 1.61 ± 0.15 kg N2O-N ha-1 year-1, with the exceptions of a rain-fed annual ryegrass system and dairy forage production fields, which showed annual N2O emissions of 19.00 ± 3.00 kg N2O-N ha-1 year-1 and 6.12–13.93 ± 0.64–3.81 kg N2O-N ha-1 year-1, respectively (Verhoeven et al., 2017). A study in a California almond orchard using synthetic N fertilizer at 258–280 kg N ha-1 year-1 also found similar annual N2O emissions value (0.73 ± 0.13 kg N2O-N ha-1) (Decock et al., 2017). Soil properties such as coarse texture and low organic C content have been found to play a significant role in low N2O emissions (Stehfest and Bouwman, 2006; Decock, 2014), and may explain the relatively low emissions in this study.
The significantly higher N2O emissions in the vine row during the first dry season were likely due to the irrigation events through the drip irrigation system under the vines, as changes in soil moisture and dry-wet cycles play a key role in the production of N2O (Hutchinson and Mosier, 1981; Dobbie and Smith, 2003; Congreves et al., 2018). During the wet seasons, soil moisture fluctuations during rainfall events caused temporary spikes in N2O emissions in both tractor row and vine row; however, because the rainwater was received by the entire vineyard, the differences in N2O emissions between the functional locations were minimized. Previous research suggests that the episodic changes in soil oxygen and moisture content influence the relative contribution to N2O production by nitrification and denitrification (Granli and Bøckman, 1995; Dobbie et al., 1999; Dalal et al., 2003; Congreves et al., 2018). As N2O emissions mainly originate from nitrification when WFPS is below 40%, and from denitrification when WFPS is above 60%–70% (Dalal et al., 2003), our results may imply that nitrification is likely the major pathway of N2O production in this vineyard during the dry (growing) seasons, while denitrification is the main source of N2O emissions in wet (dormant) seasons, as suggested by Garland et al. (2011).
Seasonal patterns of CO2 emissions vary largely depending on vineyard management practices, such as the use of cover crop and irrigation system (Longbottom and Petrie, 2015) as well as precipitation events (Steenwerth et al., 2010). In this vineyard, the cover crop was active in the wet season while the vines went into dormancy. Root and microbial respiration along with decomposition of organic matter induced by compost application in the beginning of the wet season would likely boost CO2 emissions from the tractor row (Marras et al., 2015). On the contrary, during the dry season, the cover crop had been terminated and was inactive, while the vines entered the productive stages of their life cycle and received irrigation, thereby increasing CO2 emissions at the vine row.
Comparing the three compost treatments with the control, the more net negative GWP suggested that compost application promoted C sequestration in soil. While there is a lack of data on the GWP budget of winegrape vineyards, our results aligned with other studies on sustainable practices in vineyards (Wolff et al., 2018) or other perennial system such as poplar (Robertson et al., 2000). Wolff et al. (2018) investigated the effects of minimum tillage on soil C, N2O emissions and crop production, and found a negative net GWP only from the alternative tillage practice with the presence of cover crop, which was known to promote soil C storage. Robertson et al. (2000) also reported a negative or neutral net GWP from poplar cropping systems. However, we acknowledged that another common GHG, methane (CH4), is often included in net GWP calculations. In our study, CH4 was not included because the emissions were consistently lower than the detection limit. Our estimate on GWP of a vineyard should also be revised with consideration of fuel consumption, which may vary depending on vineyard compost application practices, to obtain a comprehensive GWP analysis for this cropping system.
The lack of effect of compost application on cover crop biomass in the first year of our study contradicted the results of previous studies. Rose et al. (2014) reported increases on plant growth with applications of humic substances that were originated from organic amendments including green waste-based composts. Compost and phosphate-enriched compost treatments were found to increase ryegrass shoots and roots biomass in two arable soils when compared to the control and mineral fertilizer treatments (Khan and Joergensen, 2012). Morlat (2008) found significantly higher yield of ryegrass in composted treatments (18–45 Mg ha-1) compared to a control with no compost applied after long-term compost application, which also contradicted our results. Ryals and Silver (2013) also suggested the indirect positive effects of a single application of compost at the rate equivalent to 14.2 Mg C ha-1 on C sequestration through increased aboveground net primary productivity. The compost application rates used in our study (4.5–13.5 Mg ha-1, equivalent to 0.45–1.36 Mg C ha-1), however, were much lower than the rates applied in Morlat (2008) and Ryals and Silver (2013), thus, the plant growth promoting effect of SOM input on aboveground biomass and subsequent C sequestration from compost might become insignificant at low rates.
Grape yield across all treatments was significantly lower in 2020 than that in 2019 possibly due to the variability in vineyard productivity across vintages, the old age of the vines (30+ years), and the existence of Eutypa Dieback. The lack of significant difference in yield between treatment was in accordance with previous studies by Morlat, (2008) and Mugnai et al. (2012). However, other studies such as Rubio et al. (2013) and Gaiotti et al. (2017) showed a positive effect on grape yield one and five years after compost application, respectively. Long-term vineyard trials by Conradie and Saayman (1989) and Morlat (2008) both suggested that the low grapevine demand on mineral N at 30–40 kg N ha-1 can be the reason for the minimal yield response to compost application. The N supply from all compost treatments in our study ranged between 67.5 and 216 kg N ha-1 in the two applications. While only about 10% of this N is expected to be mineralized and become plant available in the first year after compost application, the inherent soil N mineralization alone could be a sufficient supply to the vines in the growing season (Conradie and Saayman, 1989). It was possible that in both years the vines had met their production capacity with the N supply by the soil and through fertigation, and other external factors such as vine health, age, and climate might play a significant role in the year-to-year variability in yield during the whole experiment.
Our study provided evidence on the lack of environmental tradeoff in the form of GHG emissions by increasing the annual application rate of a livestock manure and green waste-based compost up to 13.5 Mg ha-1, which is useful information when considering balancing C budget in a California perennial vineyard system under Mediterranean climate conditions. Compost application at various rates in a California vineyard over two years did not increase total soil C stock, N2O and CO2 emissions and GWP significantly, but had a positive effect on POXC to the depth of 60 cm, suggesting an early trend of C stabilization in both top- and subsoil across functional locations in the vineyard. Despite seasonal fluctuations of N2O and CO2 emissions, cumulative emissions were not significantly different between treatments, implying that the GHG fluxes induced by compost application were minimal when compared to the background soil emissions. Compost application also did not increase crop yield, which agrees with our initial hypothesis. The observed changes in soil C and GHG indicators in the tractor row topsoil may suggest that the cover crop also play a major role in the C dynamics and GHG emissions. It is recommended that, instead of focusing on the effects of one particular soil management practice at a time, researchers may further investigate any synergistic effects from combination of practices on C sequestration and GHG mitigation.
The raw data supporting the conclusions of this article will be made available by the corresponding author, without undue reservation.
All authors listed have made a substantial, direct, and intellectual contribution to the work and approved it for publication.
This work was supported by the California Department of Food and Agriculture (CDFA) Healthy Soils Initiative (Grant number 17-0624-000-HS); the Agricultural Research Institute (ARI) of the California State University (Grant number 19-03-104), and the Research, Scholarly and Creative Activities Program awarded by the Cal Poly division of Research, Economic Development and Graduate Education.
The authors would like to express gratitude to the funding agencies, Anji Perry and the staff at J. Lohr Vineyard and Wines for their support and collaboration in the project.
The authors declare that the research was conducted in the absence of any commercial or financial relationships that could be construed as a potential conflict of interest.
All claims expressed in this article are solely those of the authors and do not necessarily represent those of their affiliated organizations, or those of the publisher, the editors and the reviewers. Any product that may be evaluated in this article, or claim that may be made by its manufacturer, is not guaranteed or endorsed by the publisher.
GHG, greenhouse gas; GMD, geometric mean weight; GWP, global warming potential; LM, large macroaggregate fraction; m, microaggregate fraction; Min C, mineralizable carbon; MWD, mean weight diameter; POXC, permanganate oxidizable carbon; S + C, fraction of silt and clay; SM, small macroaggregate fraction; ΔSOC, changes in soil C stock; SOM, soil organic matter; WFPS, water-filled pore space.
Agnelli, A., Bol, R., Trumbore, S. E., Dixon, L., Cocco, S., and Corti, G. (2014). Carbon and nitrogen in soil and vine roots in harrowed and grass-covered vineyards. Agric. Ecosyst. Environ. 193, 70–82. doi:10.1016/j.agee.2014.04.023
Brown, S., and Cotton, M. (2011). Changes in soil properties and carbon content following compost application: Results of on-farm sampling. Compost Sci. Util. 19 (2), 87–96. doi:10.1080/1065657X.2011.10736983
Bustamante, M. A., Said-Pullicino, D., Agulló, E., Andreu, J., Paredes, C., and Moral, R. (2011). Application of winery and distillery waste composts to a Jumilla (SE Spain) vineyard: Effects on the characteristics of a calcareous sandy-loam soil. Agric. Ecosyst. Environ. 140 (1), 80–87. doi:10.1016/j.agee.2010.11.014
Calleja-Cervantes, M. E., Fernández-González, A. J., Irigoyen, I., Fernández-López, M., Aparicio-Tejo, P. M., and Menéndez, S. (2015a). Thirteen years of continued application of composted organic wastes in a vineyard modify soil quality characteristics. Soil Biol. Biochem. 90, 241–254. doi:10.1016/j.soilbio.2015.07.002
Calleja-Cervantes, M. E., Menéndez, S., Fernández-González, A. J., Irigoyen, I., Cibriáin-Sabalza, J. F., Toro, N., et al. (2015b). Changes in soil nutrient content and bacterial community after 12 years of organic amendment application to a vineyard. Eur. J. Soil Sci. 66 (4), 802–812. doi:10.1111/ejss.12261
Carlisle, E. A., Smart, D. R., Williams, L. E., and Summers, M. (2010). California vineyard greenhouse gas emissions: Assessment of the available literature and determination of research needs. California Sustainable Winegrowing Alliance. Available at: https://www.sustainablewinegrowing.org/docs/CSWA%20GHG%20Report_Final.pdf (Accessed April 03, 2023)
Celik, I., Ortas, I., and Kilic, S. (2004). Effects of compost, mycorrhiza, manure and fertilizer on some physical properties of a Chromoxerert soil. Soil Tillage Res. 78 (1), 59–67. doi:10.1016/j.still.2004.02.012
Cheng, Y., Zhang, J.-B., Müller, C., and Wang, S.-Q. (2015). 15N tracing study to understand the N supply associated with organic amendments in a vineyard soil. Biol. Fertil. Soils 51 (8), 983–993. doi:10.1007/s00374-015-1044-x
Chenu, C., Angers, D. A., Barré, P., Derrien, D., Arrouays, D., and Balesdent, J. (2019). Increasing organic stocks in agricultural soils: Knowledge gaps and potential innovations. Soil Tillage Res. 188, 41–52. doi:10.1016/j.still.2018.04.011
Congreves, K. A., Wagner-Riddle, C., Si, B. C., and Clough, T. J. (2018). Nitrous oxide emissions and biogeochemical responses to soil freezing-thawing and drying-wetting. Soil Biol. Biochem. 117, 5–15. doi:10.1016/j.soilbio.2017.10.040
Conradie, W. J., and Saayman, D. (1989). Effects of long-term nitrogen, phosphorus, and potassium fertilization on chenin blanc vines. II. Leaf analyses and grape composition. Am. J. Enology Vitic. 40 (2), 91–98. doi:10.5344/ajev.1989.40.2.91
Culman, S. W., Snapp, S. S., Green, J. M., and Gentry, L. E. (2013). Short- and long-term labile soil carbon and nitrogen dynamics reflect management and predict corn agronomic performance. Agron. J. 105 (2), 493–502. doi:10.2134/agronj2012.0382
Dalal, R. C., Wang, W., Robertson, G. P., and Parton, W. J. (2003). Nitrous oxide emission from Australian agricultural lands and mitigation options: A review. Soil Res. 41 (2), 165–195. doi:10.1071/sr02064
Decock, C., Garland, G., Suddick, E. C., and Johan, S. (2017). “Season and location-specific nitrous oxide emissions in an almond orchard in California,” in Nutrient cycling in agroecosystems, 1–17.
Decock, C. (2014). Mitigating nitrous oxide emissions from corn cropping systems in the midwestern U.S.: Potential and data gaps. Environ. Sci. Technol. 48 (8), 4247–4256. doi:10.1021/es4055324
Doane, T. A., and Horwáth, W. R. (2003). Spectrophotometric determination of nitrate with a single reagent. Anal. Lett. 36 (12), 2713–2722. doi:10.1081/AL-120024647
Dobbie, K. E., and Smith, K. A. (2003). Nitrous oxide emission factors for agricultural soils in Great Britain: The impact of soil water-filled pore space and other controlling variables. Glob. Change Biol. 9 (2), 204–218. doi:10.1046/j.1365-2486.2003.00563.x
Dobbie, K. E., McTaggart, I. P., and Smith, K. A. (1999). Nitrous oxide emissions from intensive agricultural systems: Variations between crops and seasons, key driving variables, and mean emission factors. J. Geophys. Res. Atmos. 104 (D21), 26891–26899. doi:10.1029/1999JD900378
Fabrizio, A., Tambone, F., and Genevini, P. (2009). Effect of compost application rate on carbon degradation and retention in soils. Waste Manag. 29 (1), 174–179. doi:10.1016/j.wasman.2008.02.010
Gaiotti, F., Marcuzzo, P., Belfiore, N., Lovat, L., Fornasier, F., and Tomasi, D. (2017). Influence of compost addition on soil properties, root growth and vine performances of Vitis vinifera cv Cabernet sauvignon. Sci. Hortic. 225, 88–95. doi:10.1016/j.scienta.2017.06.052
Garland, G. M., Suddick, E., Burger, M., Horwath, W. R., and Six, J. (2011). Direct N2O emissions following transition from conventional till to no-till in a cover cropped Mediterranean vineyard (Vitis vinifera). Agric. Ecosyst. Environ. 144 (1), 423–428. doi:10.1016/j.agee.2011.11.001
Garland, G. M., Suddick, E., Burger, M., Horwath, W. R., and Six, J. (2014). Direct N2O emissions from a Mediterranean vineyard: Event-related baseline measurements. Agric. Ecosyst. Environ. 195, 44–52. doi:10.1016/j.agee.2014.05.018
Granli, T., and Bøckman, O. C. (1995). Nitrous oxide (N2O) emissions from soils in warm climates. Fertilizer Res. 42 (1), 159–163. doi:10.1007/BF00750510
Hannam, K. D., Neilsen, G. H., Forge, T. A., Neilsen, D., Losso, I., Jones, M. D., et al. (2016). Irrigation practices, nutrient applications, and mulches affect soil nutrient dynamics in a young Merlot (Vitis vinifera L.) vineyard. Can. J. Soil Sci. 96 (1), 23–36. doi:10.1139/cjss-2014-0118
Haynes, R. J. (2005). “Labile organic matter fractions as central components of the quality of agricultural soils: An overview,” in Advances in agronomy (Academic Press), 85, 221–268. doi:10.1016/S0065-2113(04)85005-3
Hurisso, T. T., Culman, S. W., Horwath, W. R., Wade, J., Cass, D., Beniston, J. W., et al. (2016). Comparison of permanganate-oxidizable carbon and mineralizable carbon for assessment of organic matter stabilization and mineralization. Soil Sci. Soc. Am. J. 80 (5), 1352–1364. doi:10.2136/sssaj2016.04.0106
Hutchinson, G. L., and Mosier, A. R. (1981). Improved soil cover method for field measurement of nitrous oxide fluxes. Soil Sci. Soc. Am. J. 45 (2), 311–316. doi:10.2136/sssaj1981.03615995004500020017x
Kemper, W. D., and Rosenau, R. C. (1986). “Aggregate stability and size distribution,” in Methods of soil analysis (John Wiley and Sons), 425–442. doi:10.2136/sssabookser5.1.2ed.c17
Khan, K. S., and Joergensen, R. G. (2012). Compost and phosphorus amendments for stimulating microorganisms and growth of ryegrass in a Ferralsol and a Luvisol. J. Plant Nutr. Soil Sci. 175 (1), 108–114. doi:10.1002/jpln.201100127
Komárek, M., Čadková, E., Chrastný, V., Bordas, F., and Bollinger, J.-C. (2010). Contamination of vineyard soils with fungicides: A review of environmental and toxicological aspects. Environ. Int. 36 (1), 138–151. doi:10.1016/j.envint.2009.10.005
Korboulewsky, N., Dupouyet, S., and Bonin, G. (2002). Environmental risks of applying sewage sludge compost to vineyards. J. Environ. Qual. 31 (5), 1522–1527. doi:10.2134/jeq2002.1522
Kroodsma, D. A., and Field, C. B. (2006). Carbon sequestration in California agriculture, 1980–2000. Ecol. Appl. 16 (5), 1975–1985. doi:10.1890/1051-0761(2006)016[1975:csica]2.0.co;2
Lal, R. (2004). Soil carbon sequestration impacts on global climate change and food security. Science 304 (5677), 1623–1627. doi:10.1126/science.1097396
Lal, R. (2011). Sequestering carbon in soils of agro-ecosystems. Food Policy 36, S33–S39. doi:10.1016/j.foodpol.2010.12.001
Lazcano, C., Gómez-Brandón, M., Revilla, P., and Domínguez, J. (2013). Short-term effects of organic and inorganic fertilizers on soil microbial community structure and function. Biol. Fertil. Soils 49 (6), 723–733. doi:10.1007/s00374-012-0761-7
Le Bissonnais, Y., Blavet, D., De Noni, G., Laurent, J.-Y., Asseline, J., and Chenu, C. (2007). Erodibility of Mediterranean vineyard soils: Relevant aggregate stability methods and significant soil variables. Eur. J. Soil Sci. 58 (1), 188–195. doi:10.1111/j.1365-2389.2006.00823.x
Liu, J., Calderón, F. J., and Fonte, S. J. (2021). Compost inputs, cropping system, and rotation phase drive aggregate-associated carbon. Soil Sci. Soc. Am. J. 85 (3), 829–846. doi:10.1002/saj2.20252
Longbottom, M. l., and Petrie, P. r. (2015). Role of vineyard practices in generating and mitigating greenhouse gas emissions. Aust. J. Grape Wine Res. 21 (S1), 522–536. doi:10.1111/ajgw.12197
Marras, S., Masia, S., Duce, P., Spano, D., and Sirca, C. (2015). Carbon footprint assessment on a mature vineyard. Agric. For. Meteorol. 214–215, 350–356. doi:10.1016/j.agrformet.2015.08.270
Martínez-Blanco, J., Lazcano, C., Christensen, T. H., Muñoz, P., Rieradevall, J., Møller, J., et al. (2013). Compost benefits for agriculture evaluated by life cycle assessment. A review. Agron. Sustain. Dev. 33 (4), 721–732. doi:10.1007/s13593-013-0148-7
Martínez-Casasnovas, J. A., Ramos, M. C., and García-Hernández, D. (2009). Effects of land-use changes in vegetation cover and sidewall erosion in a gully head of the Penedès region (northeast Spain). Earth Surf. Process. Landforms 34 (14), 1927–1937. doi:10.1002/esp.1870
Minasny, B., Malone, B. P., McBratney, A. B., Angers, D. A., Arrouays, D., Chambers, A., et al. (2017). Soil carbon 4 per mille. Geoderma 292, 59–86. doi:10.1016/j.geoderma.2017.01.002
Mondini, C., Fornasier, F., Sinicco, T., Sivilotti, P., Gaiotti, F., and Mosetti, D. (2018). Organic amendment effectively recovers soil functionality in degraded vineyards. Eur. J. Agron. 101, 210–221. doi:10.1016/j.eja.2018.10.002
Morlat, R., and Chaussod, R. (2008). Long-term additions of organic amendments in a loire valley vineyard. I. Effects on properties of a calcareous sandy soil. Am. J. Enol. Vitic. 59 (4), 353–363. doi:10.5344/ajev.2008.59.4.353
Morlat, R. (2008). Long-term additions of organic amendments in a loire valley vineyard on a calcareous sandy soil. II. Effects on root system, growth, grape yield, and foliar nutrient status of a Cabernet franc vine. Am. J. Enol. Vitic. 59 (4), 364–374. doi:10.5344/ajev.2008.59.4.364
Mugnai, S., Masi, E., Azzarello, E., and Mancuso, S. (2012). Influence of long-term application of green waste compost on soil characteristics and growth, yield and quality of grape (Vitis vinifera L.). Compost Sci. Util. 20 (1), 29–33. doi:10.1080/1065657x.2012.10737019
Nimmo, J. R., and Perkins, K. S. (2002). “Aggregate stability and size distribution,” in Methods of soil analysis (John Wiley and Sons), 317–328. doi:10.2136/sssabookser5.4.c14
Oertel, C., Matschullat, J., Zurba, K., Zimmermann, F., and Erasmi, S. (2016). Greenhouse gas emissions from soils—a review. Geochemistry 76 (3), 327–352. doi:10.1016/j.chemer.2016.04.002
Parkin, T., and Venterea, R. (2010). “USDA-ARS GRACEnet Project Protocols, Chapter 3. Chamber-based trace gas flux measurements,” in Sampling protocols. Editor R. F. Follett Available at: https://www.ars.usda.gov/ARSUserFiles/31831/2011%20Parkin%20and%20Venterea%20Trace%20Gas%20Protocol%20Revision%20Final.pdf.
Paustian, K., Collier, S., Baldock, J., Burgess, R., Creque, J., DeLonge, M., et al. (2019). Quantifying carbon for agricultural soil management: From the current status toward a global soil information system. Carbon Manag. 10 (6), 567–587. doi:10.1080/17583004.2019.1633231
Peregrina, F., Larrieta, C., Colina, M., Mariscal-Sancho, I., Martín, I., Martínez-Vidaurre, J. M., et al. (2012). Spent mushroom substrates influence soil quality and nitrogen availability in a semiarid vineyard soil. Soil Sci. Soc. Am. J. 76 (5), 1655–1666. doi:10.2136/sssaj2012.0018
Pinamonti, F. (1998). Compost mulch effects on soil fertility, nutritional status and performance of grapevine. Nutrient Cycl. Agroecosyst. 51 (3), 239–248. doi:10.1023/A:1009701323580
Polge de Combret - Champart, L., Guilpart, N., Mérot, A., Capillon, A., and Gary, C. (2013). Determinants of the degradation of soil structure in vineyards with a view to conversion to organic farming. Soil Use Manag. 29 (4), 557–566. doi:10.1111/sum.12071
Ramos, M. C. (2017). Effects of compost amendment on the available soil water and grape yield in vineyards planted after land levelling. Agric. Water Manag. 191, 67–76. doi:10.1016/j.agwat.2017.05.013
Robertson, G. P., Paul, E. A., and Harwood, R. R. (2000). Greenhouse gases in intensive agriculture: Contributions of individual gases to the radiative forcing of the atmosphere. Science 289 (5486), 1922–1925. doi:10.1126/science.289.5486.1922
Rose, M. T., Patti, A. F., Little, K. R., Brown, A. L., Jackson, W. R., and Cavagnaro, T. R. (2014). “Chapter two - a meta-analysis and review of plant-growth response to humic substances: Practical implications for agriculture,” in Advances in agronomy. Editor D. L. Sparks (Academic Press), 124, 37–89. doi:10.1016/B978-0-12-800138-7.00002-4
Ross, K. (2016). Preparing for an uncertain future with climate smart agriculture. Calif. Agric. 70 (1), 4–5. doi:10.3733/ca.v070n01p4
Rubio, R., Pérez-Murcia, M. D., Agulló, E., Bustamante, M. A., Sánchez, C., Paredes, C., et al. (2013). Recycling of agro-food wastes into vineyards by composting: Agronomic validation in field conditions. Commun. Soil Sci. Plant Anal. 44 (1–4), 502–516. doi:10.1080/00103624.2013.744152
Ryals, R., and Silver, W. L. (2013). Effects of organic matter amendments on net primary productivity and greenhouse gas emissions in annual grasslands. Ecol. Appl. 23 (1), 46–59. doi:10.1890/12-0620.1
Ryals, R., Kaiser, M., Torn, M. S., Berhe, A. A., and Silver, W. L. (2014). Impacts of organic matter amendments on carbon and nitrogen dynamics in grassland soils. Soil Biol. Biochem. 68, 52–61. doi:10.1016/j.soilbio.2013.09.011
Salomé, C., Coll, P., Lardo, E., Metay, A., Villenave, C., Marsden, C., et al. (2016). The soil quality concept as a framework to assess management practices in vulnerable agroecosystems: A case study in mediterranean vineyards. Ecol. Indic. 61, 456–465. doi:10.1016/j.ecolind.2015.09.047
Schaefer, M. V., Bogie, N. A., Rath, D., Marklein, A. R., Garniwan, A., Haensel, T., et al. (2020). Effect of cover crop on carbon distribution in size and density separated soil aggregates. Soil Syst. 4 (1), 6. Article 1. doi:10.3390/soilsystems4010006
Six, J., Bossuyt, H., Degryze, S., and Denef, K. (2004). A history of research on the link between (micro)aggregates, soil biota, and soil organic matter dynamics. Soil Tillage Res. 79 (1), 7–31. doi:10.1016/j.still.2004.03.008
Six, J., Paustian, K., Elliott, E. T., and Combrink, C. (2000). Soil structure and soil organic matter: I. Distribution of aggregate size classes and aggregate associated carbon. Soil Sci. Soc. Am. J. 64, 681–689. doi:10.2136/sssaj2000.642681x
Sokol, N. W., Kuebbing, S. E., Karlsen-Ayala, E., and Bradford, M. A. (2019). Evidence for the primacy of living root inputs, not root or shoot litter, in forming soil organic carbon. New Phytologist 221, 233–246. doi:10.1111/nph.15361
Steenwerth, K. L., Pierce, D. L., Carlisle, E. A., Spencer, R. G. M., and Smart, D. R. (2010). A vineyard agroecosystem: Disturbance and precipitation affect soil respiration under mediterranean conditions. Soil Sci. Soc. Am. J. 74 (1), 231–239. doi:10.2136/sssaj2008.0346
Stehfest, E., and Bouwman, L. (2006). N2O and NO emission from agricultural fields and soils under natural vegetation: Summarizing available measurement data and modeling of global annual emissions. Nutrient Cycl. Agroecosyst. 74 (3), 207–228. doi:10.1007/s10705-006-9000-7
Tautges, N. E., Chiartas, J. L., Gaudin, A. C. M., O’Geen, A. T., Herrera, I., and Scow, K. M. (2019). Deep soil inventories reveal that impacts of cover crops and compost on soil carbon sequestration differ in surface and subsurface soils. Glob. Change Biol. 25 (11), 3753–3766. doi:10.1111/gcb.14762
Tisdall, J. M., and Oades, J. M. (1982). Organic matter and water stable aggregates in soils. Journal of Soil Science 33, 141–163.
Verhoeven, E., and Six, J. (2014). Biochar does not mitigate field-scale N2O emissions in a Northern California vineyard: An assessment across two years. Agric. Ecosyst. Environ. 191, 27–38. doi:10.1016/j.agee.2014.03.008
Verhoeven, E., Pereira, E., Decock, C., Garland, G., Kennedy, T., Suddick, E., et al. (2017). N2O emissions from California farmlands: A review. Calif. Agric. 71 (3), 148–159. doi:10.3733/ca.2017a0026
Weil, R. R., Islam, K. R., Stine, M. A., Gruver, J. B., and Samson-Liebig, S. E. (2003). Estimating active carbon for soil quality assessment: A simplified method for laboratory and field use. Am. J. Altern. Agric. 18 (1), 3–17. doi:10.1079/ajaa2003003
Wolff, M. W., Alsina, M. M., Stockert, C. M., Khalsa, S. D. S., and Smart, D. R. (2018). Minimum tillage of a cover crop lowers net GWP and sequesters soil carbon in a California vineyard. Soil Tillage Res. 175, 244–254. doi:10.1016/j.still.2017.06.003
Yost, J. L., and Hartemink, A. E. (2020). How deep is the soil studied – An analysis of four soil science journals. Plant Soil 452 (1), 5–18. doi:10.1007/s11104-020-04550-z
Keywords: GHG, greenhouse gas, GWP, global warming potential, carbon sequestration, compost application, soil health
Citation: Wong CTF, Falcone M, Rich G, Stubler C, Malama B, Lazcano C and Decock C (2023) Short-term effects of increasing compost application rates on soil C and greenhouse gas (N2O and CO2) emissions in a California central coast vineyard. Front. Environ. Sci. 11:1123510. doi: 10.3389/fenvs.2023.1123510
Received: 14 December 2022; Accepted: 28 February 2023;
Published: 11 April 2023.
Edited by:
Xiaobo Qin, Chinese Academy of Agricultural Sciences (CAAS), ChinaReviewed by:
Jiaogen Zhou, Huaiyin Normal University, ChinaCopyright © 2023 Wong, Falcone, Rich, Stubler, Malama, Lazcano and Decock. This is an open-access article distributed under the terms of the Creative Commons Attribution License (CC BY). The use, distribution or reproduction in other forums is permitted, provided the original author(s) and the copyright owner(s) are credited and that the original publication in this journal is cited, in accordance with accepted academic practice. No use, distribution or reproduction is permitted which does not comply with these terms.
*Correspondence: Connie T. F. Wong, Y3Rmd29uZ0B1Y2RhdmlzLmVkdQ==
Disclaimer: All claims expressed in this article are solely those of the authors and do not necessarily represent those of their affiliated organizations, or those of the publisher, the editors and the reviewers. Any product that may be evaluated in this article or claim that may be made by its manufacturer is not guaranteed or endorsed by the publisher.
Research integrity at Frontiers
Learn more about the work of our research integrity team to safeguard the quality of each article we publish.