 Jing Ning1*
 Huimei Zhang
 Guoming Du
95% of researchers rate our articles as excellent or good
Learn more about the work of our research integrity team to safeguard the quality of each article we publish.
Find out more
ORIGINAL RESEARCH article
Front. Environ. Sci. , 23 May 2023
Sec. Land Use Dynamics
Volume 11 - 2023 | https://doi.org/10.3389/fenvs.2023.1120704
This article is part of the Research Topic Advances in Characterizing and Monitoring Land Cover/Use and Associated Ecosystem Changes Using Remote Sensing Data View all 13 articles
Land use function has become an important part in land change science. More attention should be given to multifunctional land to achieve land structure optimization and sustainable land use. This study takes Bin County in Heilongjiang province of China as the research area and investigates the spatiotemporal pattern and trade-off synergistic relationship of land functions from 2000 to 2020. Land functions were quantitatively measured by the spatiotemporal method of statistical data, INVEST model, CASA, RUSLE, and other models. The results showed that 1) during 2000–2020, the production function showed an overall trend of enhancement. Living function remained enhanced except in the southeast and north. The water conservation function was weakened in most areas, while the carbon fixation function was strengthened in the southeast and weakened in the central and northern parts. Soil conservation function decreased first and then increased significantly in the southwest. 2) There was a synergistic relationship between production and living functions and trade-off relationships between ecology and production functions and ecology and living functions from 2000 to 2020. 3) The production and living functions are mainly coordinated in space, and the collaborative agglomeration types are mainly distributed in Tangfang town, Manjing town, and other areas. The spatial distribution of trade-offs and synergies between ecological and productive functions and ecological and living functions was similar. The trade-off and agglomeration types were scattered, and the synergies were distributed in Binxi town and Juren town.
The land is a complex system of ecology–economy–society, carrying all social and economic activities of human beings and providing space bearing and material foundation for human beings (Huang et al., 2017; LUO, 2019). With the deepening of land use research, its scope has been gradually extended to land use function evaluation, relationship, mechanism, and zoning. Influenced by human behavior and activities, the interaction between different land use functions is complex, but it mainly shows two kinds of relationships: mutual checks and balances and mutual promotion. Based on these, we can identify and coordinate the relationship between different land use functions and their spatial and temporal distribution patterns is a meaningful way to realize the optimal allocation and sustainable use of land resources to provide a broader perspective for managers to use the land better.
Studying the spatiotemporal pattern of land use function and its trade-off and synergy is a hot topic in land science and geographical science. Meng et al. (2021), Zhu et al. (2018), and Peng et al. (2016) adopted the correlation analysis method to identify the service function relationship and its intensity change (Sun et al., 2018; Xu et al., 2018). Liu et al. (2019), Feng et al. (2017), and Fang et al. (2018) used the root mean square error method to analyze the trade-off and synergy between ecosystem services and cultivated multifunctional land. Yang et al. (2019), Lester et al. (2013), Cavend-Bares et al. (2015), and Verhagen et al. (2018) have quantitatively described the abstract relationship of ecosystem services by drawing the possible productive boundary. Zhang et al. (2019) and Liu et al. (2018) studied and analyzed the relationship between land use function, urban expansion, and cultivated land protection. Wang and Tang (2018), Liu et al. (2021), and Willemen et al. (2010), respectively, took the Chongqing Municipality, Beijing Municipality, and the countryside of the Netherlands as examples to analyze the coupling relationship of rural functional trade-offs. Xin et al. (2019) and Ren et al. (2019) used statistical analysis to explore the interaction of land use functions in time and used spatial analysis to describe the trade-off synergistic relationships of land use functions in space. Pan et al. (2013) used bivariate spatial autocorrelation to analyze the spatial trade-off of multiple ecosystem supplies. Qi et al. (2020) identified ecosystem service clusters in northeast China and divided them into ecological functional areas. Kang et al. (2021) and Zhang et al. (2019) analyzed and showed the characteristics of land use function evolution and trade-off synergistic relationships based on a comprehensive evaluation model and mechanical model.
From the perspective of domestic and foreign research, there was some progress in the research of land use function. However, there is still significant room for progress in applying land use functions to evaluate content and results. The following are the shortcomings: 1) in research content, studies mainly focus on constructing a function evaluation index system, the spatial and temporal distribution of functions, and analyzing the influencing factors. In analyzing spatial and temporal patterns of land use functions, there is a lack of spatial correlation analysis and research on the spatiotemporal dynamics and heterogeneity of land use functions. 2) In terms of research and application, the combination of research conclusion and practical application is not potent, and the typical research cases are few and concentrated in regions that have no reference value for the research of land use function in other regions in China. In the future, the research scope should be expanded, especially to regions with high comprehensive research value of land use function, to provide method cases for improving the multifunctional level of land use within the regional scope. Based on this, this work takes Bin County, a typical black soil area with land use characteristics, as the study area to conduct a multifunctional study of land use. With the help of the statistical spatial data method, INVEST model, CASA model, and RUSLE model, this work quantitatively measures the spatial–temporal distribution patterns of land use production, and living and ecological functions. This study uses the correlation coefficient and bivariate local spatial autocorrelation methods to study the characteristics of the trade-off synergistic relationships between land use functions from the perspective of space and time to reveal the dynamic and spatial heterogeneity and provide a reference for land use, development, and construction.
Bin County is in the south of Heilongjiang province, under the jurisdiction of Harbin city. Its geographical location is between 126°55′–128°19′E and 45°30'−46°01′N, as shown in Figure 1. It has a flat and narrow shape, and the total area is about 3,843.16 km2. Bin County is high in the southeast and low in the northwest, with an average elevation of 405 m. It has a cold temperate continental climate, with an average annual temperature of 4.5°C and an average annual precipitation of 570 mm. The territory has eight major rivers with complex hydrogeological conditions, and the annual average surface runoff is 4.11 m3 × 108 m3. Bin County is a major grain-producing county in the country. Arable land is the main land use type, accounting for 61.31% of the county area. The second is forest and grass. The county has a total forest area of 1,180 km2, a grassland comprehensive vegetation coverage of 81.3%, and rich forest and grass, which is an important cornerstone for developing the ecological function. There are mainly eight soil types in Bin County, among which the high-quality soil resources, such as black soil and meadow soil in the plain and hilly areas, are a good foundation for agricultural cultivation.
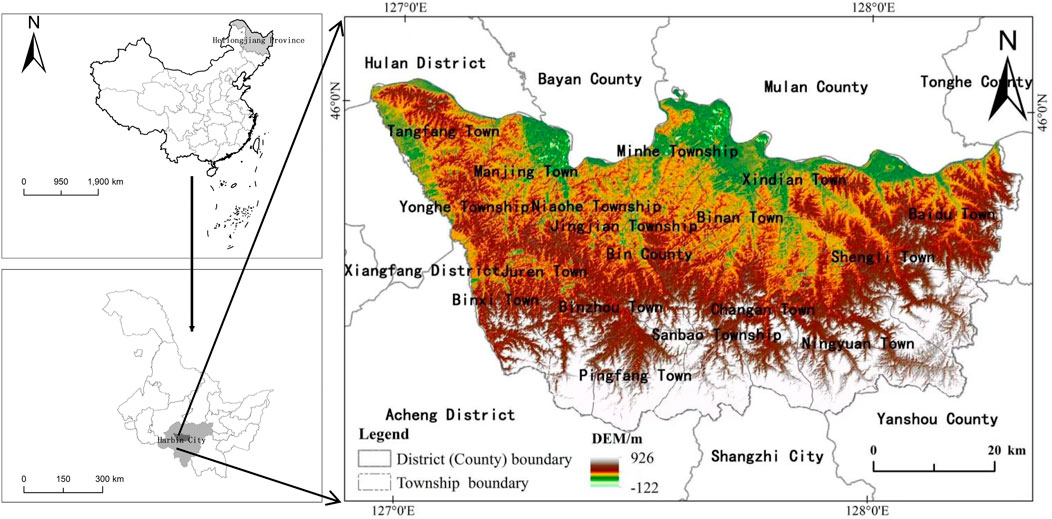
FIGURE 1. Location and elevation of the study area.
This study mainly includes 1) socioeconomic statistical data from the statistical yearbook of the Heilongjiang province, the statistical yearbook of Bin County (2000–2020), and the bulletin of water resources of Bin County. The missing statistics are obtained by calculating the average annual growth rate and other methods. 2) Natural environment data such as remote sensing data, topographic data, meteorological data, soil data, etc. 3) Reference data used for setting relevant parameters in model calculation (Table 1).
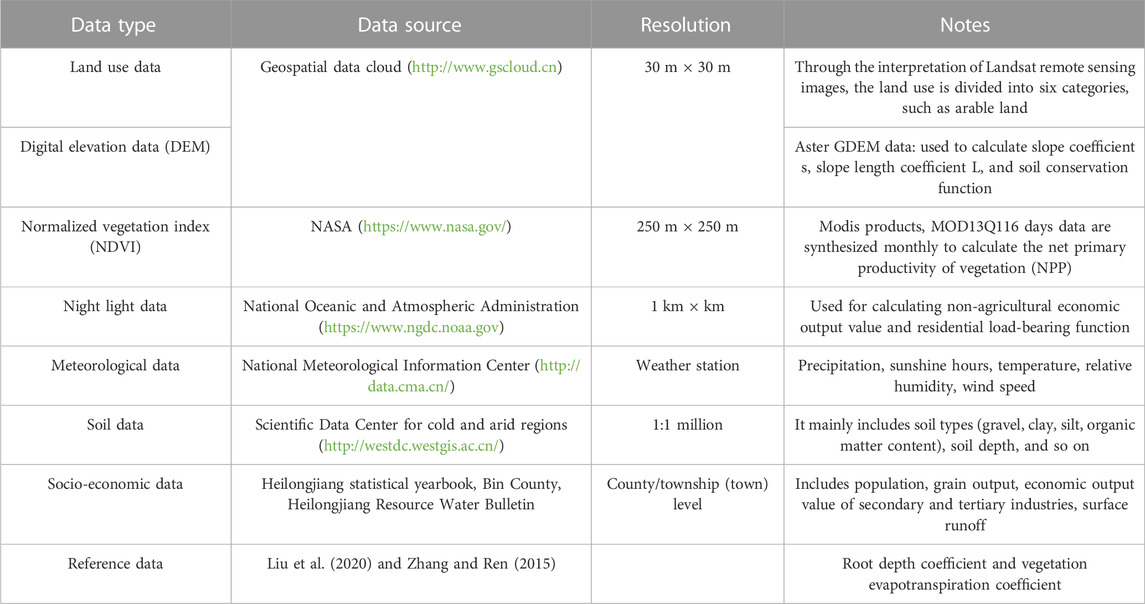
TABLE 1. Data sources and descriptions.
Among these, the collection of land use data is to extract the land use data of Bin County from 2000 to 2020 through the ENVI 5.3 software combined with human–computer interactive visual interpretation and modify the interpretation results by combining the Google Earth software and field investigation to meet the accuracy requirements. In order to facilitate the quantitative measurement of the functional model used for land use functional evaluation, preliminary data processing was carried out. All raster and vector data were projected to the ArcGIS10.5 software platform, where the coordinates were unified as WGS_1984_UTM_Zone_52N, and the mask was cut with the administrative boundary of Bin County in 2020, and the accuracy was unified.
Net primary production (NPP) is the difference between the total amount of organic matter produced by the green vegetation through photosynthesis and consumption due to respiration of the vegetation per unit time and area, that is, the organic mass accumulated by the vegetation (Jiang, 2020). Therefore, vegetation NPP can reflect the production capacity of different vegetation crops in arable land and can be used as a standard to measure the production capacity of different crops. Based on this, according to the functional measurement model of food production proposed by Fan (2019), this study allocates the statistical data of grain crop yield in townships to the cultivated land grid through NPP to realize the spatialization of grain supply function and analyze the changes of the grain supply function. Combined with the land use vector data, the cultivated land vector layer is extracted, which is based on the l km vector grid in the research region. The NPP data for the entire study area is then input using the ArcGIS spatial analysis tool. The intersecting NPP raster layer is extracted by putting the cultivated land vector layer as a mask. The grain crop yield at the grid scale is quantitatively quantified in conjunction with the statistics on the grain yield of the administrative region, and the regional production function is thoroughly characterized. The specific calculation formula is as follows:
where Yieldm is the grain yield of the MTH grid and Yieldj is the grain yield of the township where the MTH grid is. NPPm is the NPP of the MTH grid and NPPj is the total NPP of the township where the MTH grid is. The unit is t/km2.
Based on the relationship between night light data, non-agricultural economic output value, and population residence, the spatial expression of the 1 km grid scale is realized by combining land use type, night light index, and residential density, and based on the population data of the administrative region and the value of secondary and tertiary industries (Han et al., 2012). The calculation formula is as follows:
Non-agricultural output value:
where GDP23m is the value of non-agricultural industries (secondary and tertiary industries) in the NTH grid; NLmn, NUmn, and LEmn are the three land lighting parameters of the MTH secondary land type in the construction land in the grid; and Amn, Bmn, and Cmn are the corresponding weights of the three parameters of the MTH land use type in the grid. The unit is ten thousand yuan/km2.
Living load:
where Popm is the population number of the MTH grid, Pop is the demographic value of the administrative region where the MTH grid is, and Mm and m are the total weight of land use type, night light index, and residential density of the administrative region where the MTH grid is. The unit is person/km2.
Water yield is the ability to represent the water supply and guarantee it in the region. The difference between precipitation and actual evapotranspiration in grid cell x is the water yield in the selected INVEST model (Liu et al., 2020; Pan et al., 2020). The INVEST water conservation model utilizes grid unit parameters to calculate water yield, which includes surface or groundwater runoff, soil water content, water holding capacity of the withered objects, and canopy interception. These parameters cover precipitation, plant transpiration, surface evaporation, plant root depth, plant available water, and soil maximum root burial depth. The calculation formula is as follows:
In Eq. 4, Yx, AETx, and Px are the average annual water yield (mm), average annual actual evapotranspiration (mm), and average annual precipitation (mm) of x in each grid cell in the study area, respectively. In Eq. 5, PETx is the potential evapotranspiration (mm), and ω is a non-physical parameter. In Eq. 6, AWCx is the available soil water content (mm) of x in each grid cell, Z is an empirical constant, ranging from 1 to 10, Z equals 4.12 through linear fitting according to the surface runoff in the water resources bulletin of Bin County. In Eq. 7, Kcx is the plant evapotranspiration coefficient of x in each grid cell, which is set in Table 2. ETOx is the reference crop evapotranspiration of x in each grid cell, which is obtained by the Penman–Monteith formula. In Eq. 8, SRx is solar radiation, Tx is the daily average temperature, Tdvx is the difference between the highest and lowest temperatures of the day, and Pmx is the monthly average precipitation. In Eq. 9, root depth is the root coefficient, and parameter settings are shown in Table 2; PAWCx is the available water content of vegetation in x of each grid cell. In Eq. 10, Sand is soil sand content, Silt is soil silt content, Clay is soil clay content, and Om is soil organic matter content.
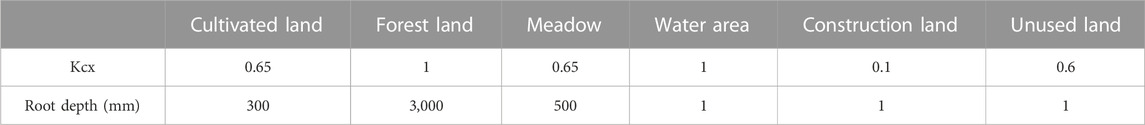
TABLE 2. Vegetation evapotranspiration coefficient and root depth coefficient.
Carbon fixation is an important ecological function to measure the gas balance and temperature regulation in a region, which refers to the process of carbon fixation and oxygen release through photosynthesis during vegetation growth (Zhang and Ren, 2015). This project intends to use the improved CASA model to calculate NPP, which can be converted into carbon fixation through the photosynthesis equation. The calculation formula is as follows:
In Eq. 11, APAR(x, t) is the photosynthetically absorbed active radiation (MJ/m2/month), and ε (x, t) is the actual light energy utilization rate (gC/MJ). In Eq. 12, SOL(x, t) is the total solar radiation (MJ/m2/month), where the solar radiation is calculated by the sunshine hours, and FPAR(x, t) is the effective radiation ratio of vegetation to incident light cooperation. In Eq. 13, Tε1(x, t) and Tε2(x, t) are the effects of high temperature and low temperature stress on light energy utilization, Wε(x, t) is the effect of water conditions on light energy utilization, and εmax is the maximum light energy utilization (gC/MJ). ε, NDVImax, and NDVImin are set according to Zhu Wenquan’s modified CASA model (Zhu et al., 2006a; Zhu et al., 2006b; Zhu et al., 2007). In Eq. 14, Mc is the carbon content of CO2 in the atmosphere fixed by vegetation, and Nc is the content of C in CO2, namely, 27.27%; β = 1.63, indicating that 1.63 kg CO2 will be fixed for every 1 kg organic matter produced by the vegetation.
The soil conservation function represents the ability of green vegetation to protect the soil and its fertility. In this study, the modified Universal Soil Erosion Model (RUSLE) was used to estimate the soil conservation in Bin County (Peng et al., 2017), and the calculation formula is as follows:
where Ac is the annual soil conservation (t/hm2/a), and it is the difference between the potential erosion Ap and actual erosion Ar. The potential soil erosion refers to soil erosion without any water conservation engineering measures (t/hm2/a), whereas the actual soil erosion refers to soil erosion (Peng et al., 2017) based on the vegetation cover within the scope and the utilization of soil and water conservation measures (t/hm2/a). R is the annual average precipitation erosivity factor, which is obtained by the Wischmeier empirical formula. K is the soil erosion factor, which is calculated by the EPIC model. LS in the given equations represents the slope length and slope factor, respectively, which are calculated by the method of Zhang et al. (2015) and is dimensionless. C is the vegetation coverage and management factor. P is the water and soil conservation management factor.
The dynamic changes of the synergistic relationship in time were weighed, and the correlation coefficient method was used to explore the correlation between production, living, and ecological functions at different time points and their intensity, under the scale of a 1 km grid from 2000 to 2020. When the correlation coefficient was positive, it indicated that the functional relationship of the two land use functions was in the same direction, which is a synergistic relationship; when the correlation coefficient was negative, it indicated that the functional relationship of the two land use functions was in the opposite direction, which is a trade-off relationship. The synergies and trade-off of the land use functions change with the absolute quantity of the correlation value (Fan, 2019).
Using bivariate local spatial autocorrelation can achieve the dynamic change of the trade-off synergistic relationship at the spatial scale, which can realize the distribution pattern of the trade-off synergistic relationship between two land use functions. Using different agglomeration types in the bivariate LISA cluster map can represent the trade-off or synergy area. There are five categories: high–high agglomeration synergy area, low–low agglomeration synergy area, high–low agglomeration trade-off area, low–high agglomeration trade-off area, and insignificant area (Cheng et al., 2021).
From the perspective of time characteristics, from 2000 to 2005, the production function of Bin County showed an overall trend of enhancement, and the enhanced area was about 218.60 km2 (Figure 2). From 2005 to 2010, the production function decreased, mainly due to the low precipitation and grain yield in 2010. From 2010 to 2015, the production function of most regions had enhanced, and the area of the enhanced function area was about 1958.86 km2. From 2015 to 2020, the production function of Bin County did not change, and from the area of functional changes, the area of the enhanced region was similar to that of the weakened one. From the change in spatial distribution of the production function, it shows that the enhanced area is mainly in the north of Binzhou town, Ningyuan town, and Baidu town, while the weakened area is mainly in the north of Pingfang town, Xindian town, and Changan town.
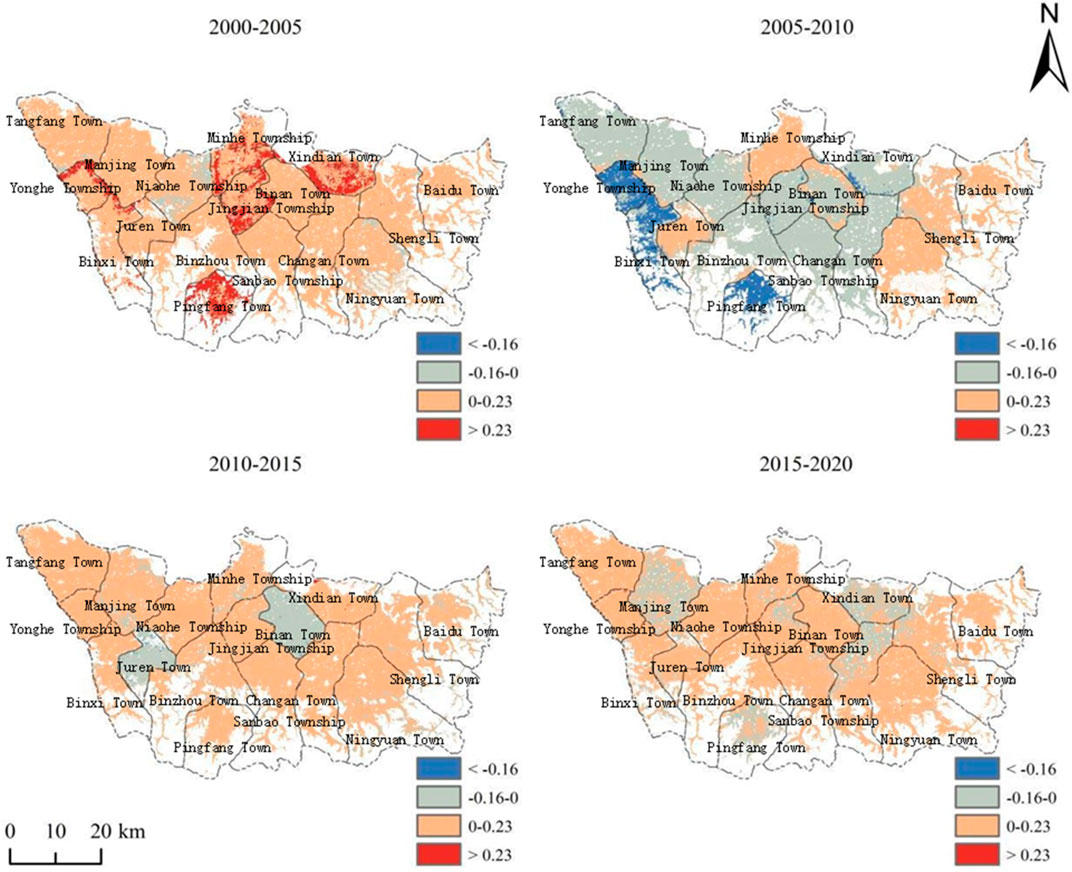
FIGURE 2. Spatial and temporal patterns of production functions in Bin County.
From the perspective of time, from 2000 to 2005, the overall living function of Bin County showed a weakening trend, and the enhanced area only accounted for 0.84% of the county area (Figure 3). From 2005 to 2010, and from 2010 to 2015, the living function of Bin County showed an increasing trend, with an area of 3,705.57 km2 and 3,822.02 km2, respectively. From 2015 to 2020, the overall living function of Bin County was still enhanced to a large extent, showing a centralized distribution. The change in the spatial distribution of production function shows that the enhanced area is mainly in the north of Binzhou town, Ningyuan town, and Baidu town, while the weakened area is mainly in the north of Pingfang town, Xindian town, and Changan town.
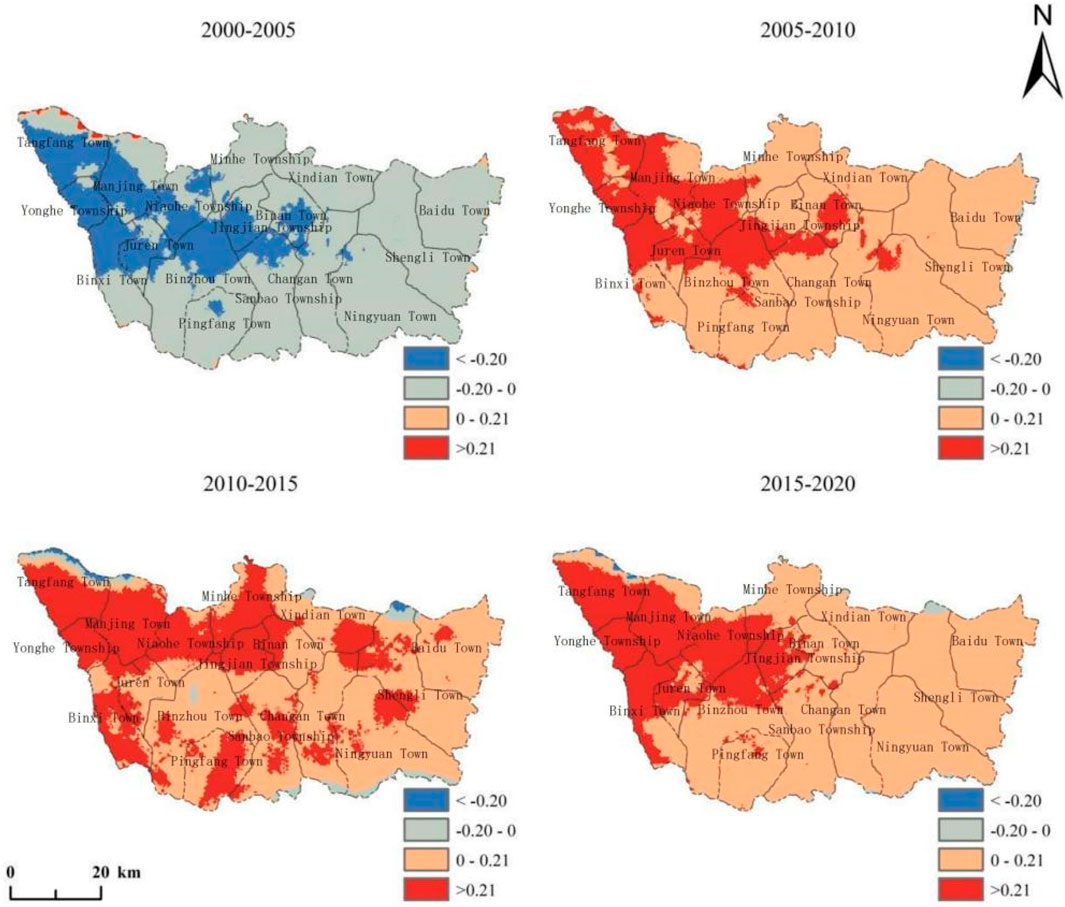
FIGURE 3. Spatial and temporal patterns of living functions in Bin County.
From 2000 to 2020, according to the distribution of water yield in each township, Ningyuan town, Changan town, Binan town, and Baidu town had relatively high water yields (Figure 4). From 2000 to 2005, precipitation increased and water conservation function was enhanced in most areas, accounting for 92.34% of the county’s total area. From 2005 to 2010, the enhanced area of water conservation decreased, and the weakened area was about 1,106.45 km2, concentrated in the central and eastern areas of Bin County. From 2010 to 2015, the precipitation increased significantly when compared with the previous period. In addition, due to the perfect construction of soil and water conservation facilities and good vegetation production, the vegetation was fixed and stable, the surface runoff increased, and the water yield showed an overall increasing trend. From 2015 to 2020, due to the influence of typhoon “Bawei” 2020, the summer precipitation was abundant, which resulted in increased defoliation and dead leaves, weakened vegetation evapotranspiration, and decreased the temperature in the southeastern mountainous area. Therefore, the regions with increased water sources are distributed chiefly in the southeastern region.
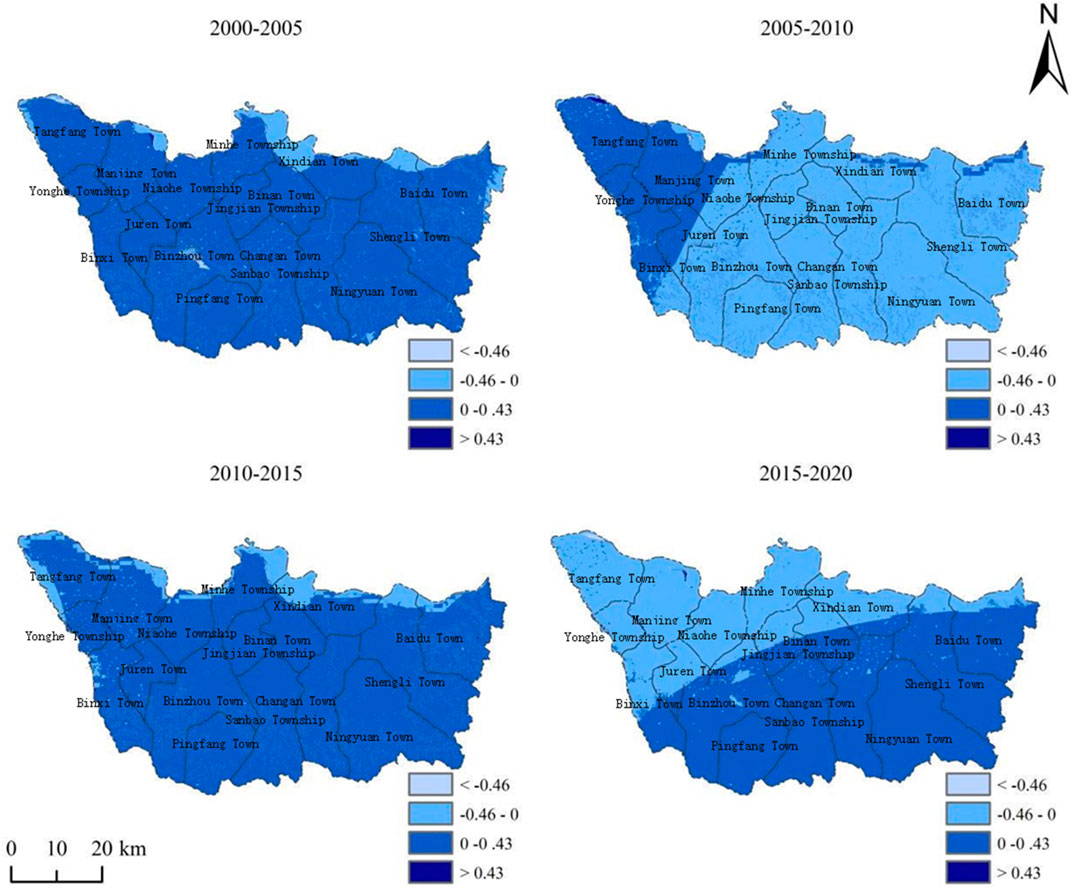
FIGURE 4. Spatial and temporal patterns of ecological functions of water conservation in Bin County.
In terms of time, from 2000 to 2005, the area with enhanced carbon fixation function was 1700.21 km2, accounting for 44.24%. From 2005 to 2010, the enhanced and weakened carbon function areas were similar, accounting for 50.15% and 49.85%, respectively. From 2010 to 2015, most areas of carbon fixation function showed an extended growth trend, and the enhanced area expanded by about 2,840.86 km2. However, from 2015 to 2020, the carbon fixation function decreased. Regarding space, the carbon fixation enhancement areas were mainly concentrated in Tangfang town, Yonghe town, Xindian town, Pingfang town, and Juren village, while the carbon fixation reduction areas were scattered in various townships (Figure 5).

FIGURE 5. Spatial and temporal patterns of ecological functions of carbon fixation in Bin County.
From 2000 to 2005, the changes in soil conservation function showed a trend of decreasing on both sides and increasing in the middle, namely, in the middle of Bin County, Sanbao township, Binan township, Jingjian township, Minhe township, and some other areas showed an increasing trend of function, and the proportion of enhanced areas was about 44.24% (Figure 6). From 2010 to 2015, most regions showed a weak, increasing trend, and the functional enhancement part showed a patchy distribution. The change in soil function in 2005–2010 and 2015–2020 was consistent with the spatial distribution trend of the water conservation function because the change in water conservation is directly related to the level of soil and water conservation capacity, which is a significant positive correlation. The surface runoff accelerates the soil surface loss, which is not conducive to soil conservation.
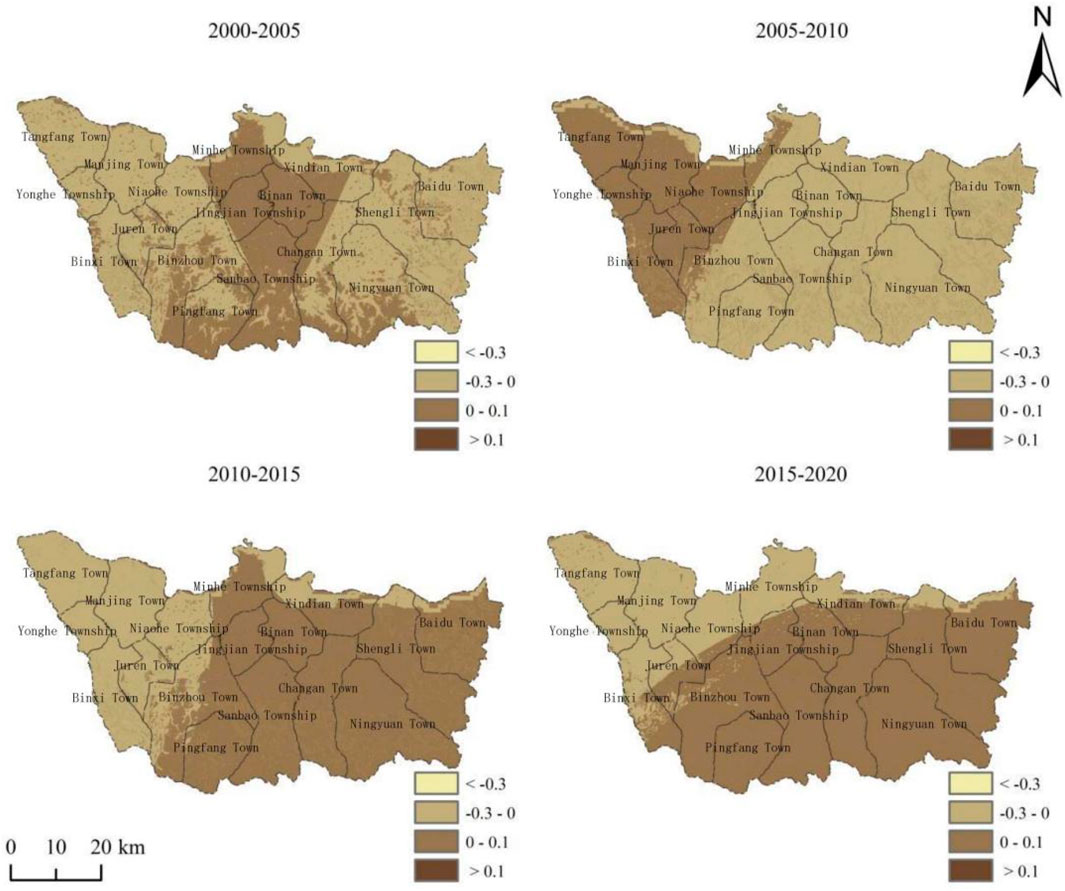
FIGURE 6. Spatial and temporal patterns of ecological functions of soil conservation in Bin County.
It can be seen from Figure 7 that the correlation coefficients of the production and living functions in Bin County at the five time points of 2000, 2005, 2010, 2015, and 2020 are all greater than zero, with values between 0.671 and 0.789, indicating a significant positive correlation, that is, a stable synergistic relationship between the two. Overall, the average correlation coefficient was 0.619, indicating a high degree of synergy. However, from the perspective of changes, the synergetic relationship changed with the advance of time, indicating that the trade-off synergetic relationship between land use functions was volatile and dynamic.
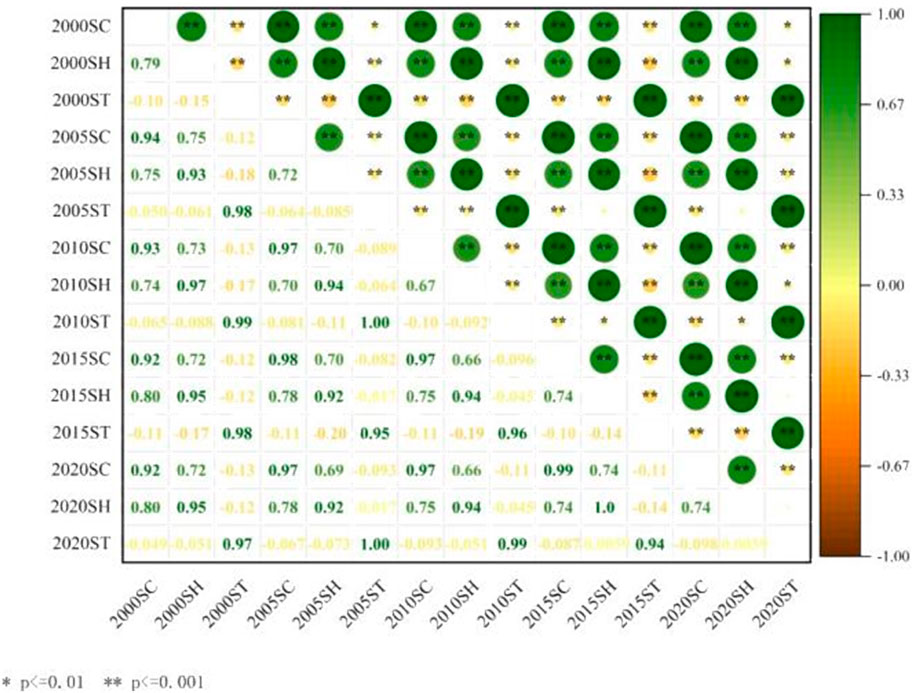
FIGURE 7. Correlation between production, living, and ecological functions in Bin County.
As seen from Figure 7, from 2000 to 2020, the production and ecological functions of Bin County always showed a negative correlation, and the average value of the correlation coefficient was −0.094, indicating that the trade-off degree changed stably. In general, from 2000 to 2020, the correlation coefficient between the production and ecological functions in Bin County first increased, then decreased, and again increased. In 2005, the trade-off relationship between production and ecological functions weakened significantly, and the trade-off relationship was enhanced.
From 2000 to 2020, the living and ecological functions in Bin County showed different degrees of negative correlation at five different time points. During the study period, the absolute value of the correlation coefficient showed a trend of first decreasing, then increasing, and again decreasing, indicating that the trade-off relationship between the two functions also showed corresponding fluctuations. In summary, from 2000 to 2020, the degree of trade-off between the living and ecological functions in Bin County was continuously weakened, and the correlation coefficient decreased by 0.148 during the 20 years. The trade-off relationship between the living and ecological functions in Bin County changed significantly during 2000–2005 and 2015–2020.
The specific trade-offs and synergies among production, living, and ecological functions are shown in Table 3, and the spatial distribution pattern is shown in Figure 8.
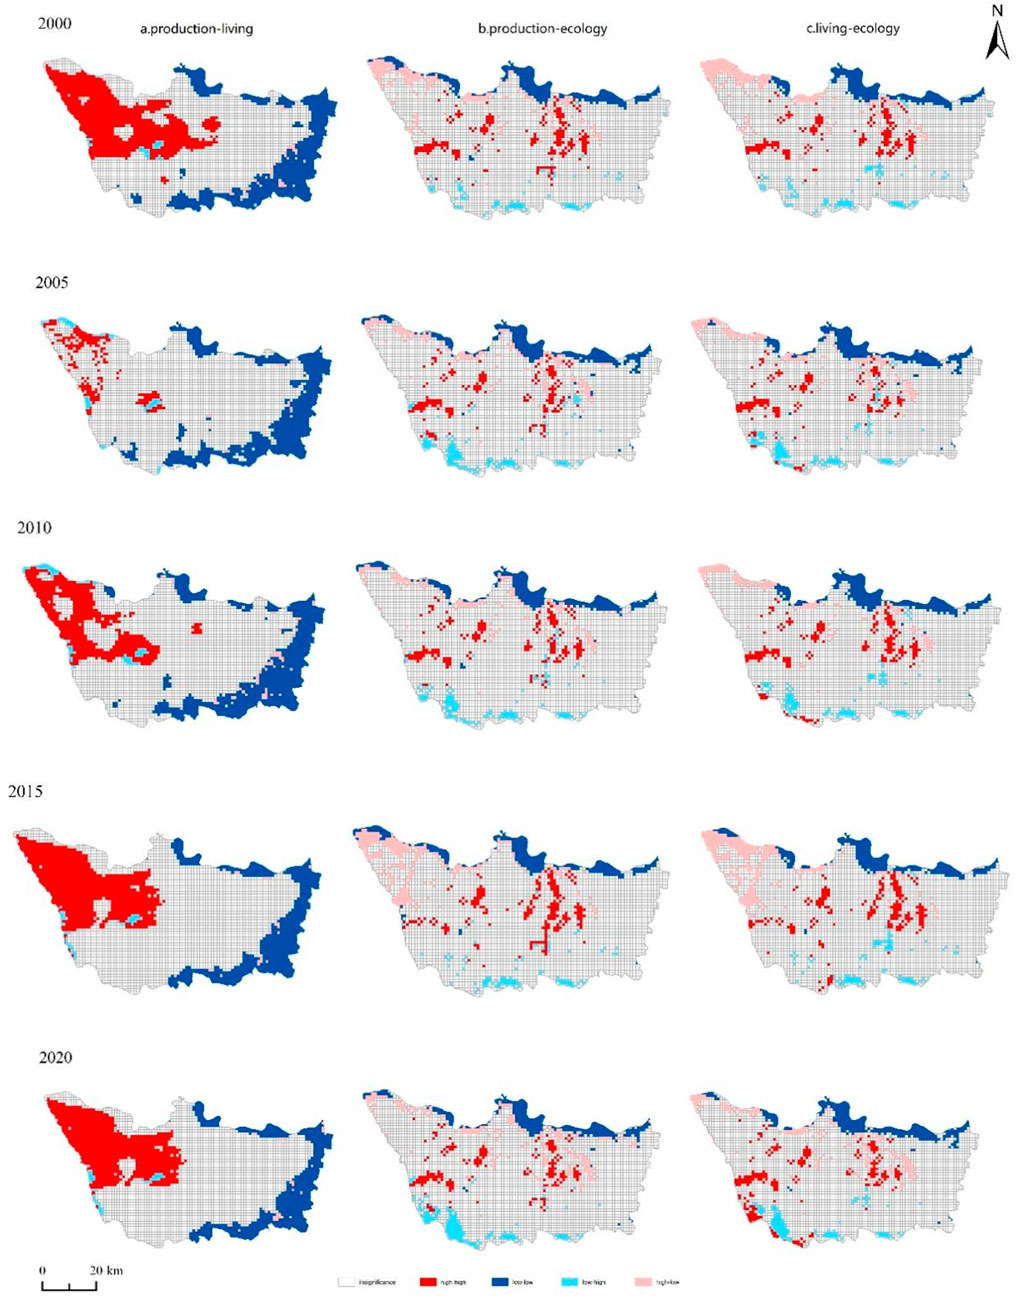
FIGURE 8. Spatial distribution pattern of functional trade-offs/synergistic relationships of land use in Bin County in 2000–2020.
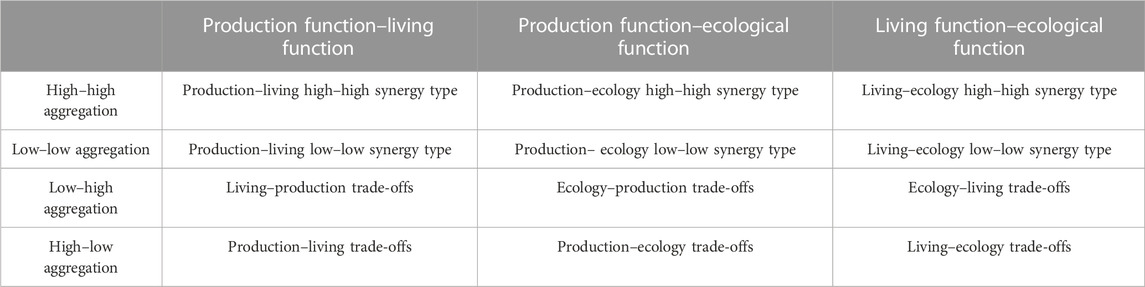
TABLE 3. Types of multifunctional land use trade-off/synergistic relationships.
From 2000 to 2020, the trade-off synergistic relationship between production and living functions in Bin County has apparent spatial heterogeneity. In 2000, the relationship between production and living functions was mainly characterized by production–living high–high synergy and low–low synergy. The production–living trade-off (high–low) and the living–production trade-off (low—high) showed an irregular spatial pattern. In 2005, the number of high–high agglomeration units decreased from 936 in 2000 to 229, and the number of low–low agglomeration units was stable, indicating that the communal area decreased, the low–high agglomeration and high–low agglomeration units increased from 85 to 110, and the trade-off area increased slightly. From 2010 to 2020, the spatial trade-off/synergy between production and living functions changed stably, and mainly manifested as a synergy relationship. The number of agglomeration units in 2010, 2015 and 2020 accounted for 36.44%, 38.99% and 38.57%, respectively. High–high agglomeration grid cells accounted for 39.90%, 55.02%, and 55.18% of the cooperative relationship, indicating that the cooperative relationship was gradually dominated by high–high agglomeration in space.
From 2000 to 2020, the spatial distribution of the trade-off synergistic relationships between production function and ecology function in Bin County was stable. The production-ecology low-low synergy type was mainly distributed in the northern valley plain area of Bin County, while the production-ecology high-high synergy type was mainly distributed in Binxi town, Niaohe township, Binan town and the northern area of Ningyuan town. The high–low agglomeration (production–ecological trade-off) type with trade-off relationship was scattered in some areas of Tangfang town, Xindian town, and Binan town, and the low–high agglomeration (eco–production trade-off) type was mainly distributed in the low hilly areas of southern Bin County.
From 2000 to 2020, the living and ecological functions in Bin County mainly characterized the living–ecology high–high synergy (high–high) and living–ecology low–low synergy (low–low), among which the low–low agglomeration type accounted for 59.24%, 63.08%, 60.24%, 58.3%, and 59.39% of the synergistic relationship. It indicates that the synergy relationship dominated the low–low agglomeration type. On the other hand, the trade-off types showed a decreasing trend, and high–low agglomeration (living–ecological trade-off) types accounted for 69.47%, 56.11%, 56.90%, 73.70%, and 61.56% of the trade-off relationships, indicating that high–low agglomeration types dominated the trade-off relationship. According to the spatial distribution pattern of the trade-off and synergy regions between living and ecological functions, the trade-off areas were distributed in Tangfang town, Yonghe town, Sanbao township, and the southern mountain area of Penn town in the northwest of Bin County.
This study takes Bin County as the research area to analyze the dynamic change of multifunctional land use and explore the spatiotemporal change patterns of trade-offs and synergies among various land use functions, aiming to provide scientific reference for optimizing the multifunctional land use in Bin County.
(1) Based on the literature research and the development characteristics of Bin County, the land use function was divided into production, living, and ecological functions. From 2000 to 2020, the production function of Bin County showed an overall trend of enhancement. Living function enhanced except in the southeastern mountainous area of Bin County and along the Songhua river in the north. The water conservation function weakened in most areas of the county, and the carbon fixation function was enhanced in southeastern Bin County but weakened in the central hills and the northern plain area. The soil conservation function showed a trend of decreasing first and then increasing, and the function improved significantly in southwestern Bin County.
(2) The trade-offs and synergies of land use function in Bin County in 2000, 2005, 2010, 2015, and 2020 were measured from two dimensions of time and space, and the spatiotemporal evolution trend of land use function in the 1 km grid scale was analyzed. During the study period, the production and living functions in Bin County always showed a significant synergistic relationship, and the production and ecological functions, as well as the living and ecological functions were significant trade-offs. From 2000 to 2020, the production and living functions of Bin County mainly showed a collaborative relationship in space, and the clustering type of collaborative relationship was distributed in Tangfang town, Manjing town, and other areas. The spatial distribution of trade-offs and synergies among production, living, and ecological functions was similar, and the clustering types of trade-offs showed an irregular distribution pattern. These types of synergies were mainly distributed in Binxi town, Juren village, and other areas.
The raw data supporting the conclusion of this study will be made available by the authors, without undue reservation.
JN was responsible for data processing, model calculation, writing of manuscript, and verifying. HZ was responsible for writing of manuscript and verifying. DS was responsible for data processing and model calculation. All authors contributed to the article and approved the submitted version.
This research was funded by The National Natural Science Foundation of China, grant No. 41971217; the National Key R&D Program of China, grant No. 2021YFD1500101.
The authors declare that the research was conducted in the absence of any commercial or financial relationships that could be construed as a potential conflict of interest.
All claims expressed in this article are solely those of the authors and do not necessarily represent those of their affiliated organizations, or those of the publisher, editors, and reviewers. Any product that may be evaluated in this article, or claim that may be made by its manufacturer, is not guaranteed or endorsed by the publisher.
Cavender-Bares, J., Polasky, S., King, E., and Balvanera, P. (2015). A sustainability framework for assessing trade-offs in ecosystem services. Ecol. Soc. 20, art17. doi:10.5751/es-06917-200117
Cheng, H., Meng, J., and Zhu, L. (2021). Spatial-temporal pattern and tradeoff of land versatility in the middle reaches of Heihe River based on multi-source geographic data fusion. Arid. Land Geogr. 44 (01), 208–220. doi:10.12118/j.issn.1000–6060.2021.01.22
Fan, Y. (2019). Study on the trade-off and coordination of land use functions in rapid urbanization areas. Nanjing, China: Nanjing University.
Fang, Y., Wang, J., Kong, X., Wu, R., Li, B., and Liu, J. (2018). Measurement and zoning optimization of multifunctional trade-off of cultivated land use: A case study in henan province. China Land Sci. 32 (11), 57–64. doi:10.11994/zgtdkx.20181019.151512
Feng, Q. W., Fu, B., Ding, J., and Wang, S. (2017). Ecosystem service trade-offs and their influencing factors: A case study in the loess plateau of China. Sci. Total Environ. 607, 1250–1263. doi:10.1016/j.scitotenv.2017.07.079
Han, X., Zhou, Y., Wang, S., Liu, R., and Yao, Y. (2012). Spatialization of GDP based on night light and land use data. Remote Sens. Technol. Appl. 27 (03), 396–405.
Huang, A., Xu, Y., Jinmin, H., Sun, P., Liu, C., and Zheng, W. (2017). Research progress and prospect of multi-functional evaluation of land use. China Land Sci. 31 (04), 88–97. doi:10.11994/zgtdkx.20170315.133056
Jiang, Y. (2020). Change of cultivated land use and its impact on farmland productivity in black soil region of Heilongjiang Province. Harbin, China: Northeast Agricultural University.
Kang, Q., Guo, Q. X., Ding, Y., Zhang, Y., Hu, Y., and Chen, S. Y. (2021). Spatial-temporal differentiation and influencing factors of "three living" functions in Shanxi Province, 2005-2018. Bull. Soil Water Conservation 41 (05), 327–337. doi:10.13961/j.cnki.stbctb.2021.05.042
Lester, S., Costello, C., Halpern, B. S., Gaines, S. D., White, C., and Barth, J. A. (2013). Evaluating tradeoffs among ecosystem services to inform marine spatial planning. Mar. Policy 38, 80–89. doi:10.1016/j.marpol.2012.05.022
Liu, J. H., Li, W. F., Zhou, W. Q., Han, L. J., and Qian, Y. G. (2018). Scenario analysis of optimal allocation of land use in Beijing-Tianjin-Hebei urban agglomeration based on urban expansion, cultivated land protection and ecological benefits. Acta Ecol. Sin. 38 (12), 4341–4350. doi:10.5846/stxb201712312369
Liu, L., Wang, Z., Wang, Y., Zhang, Y., Shen, J., Qin, D., et al. (2019). Trade-off analyses of multiple mountain ecosystem services along elevation, vegetation cover and precipitation gradients: A case study in the taihang mountains. Ecol. Indic. 103, 94–104. doi:10.1016/j.ecolind.2019.03.034
Liu, Y. Y., Liu, X. Y., Zhang, B., and Li, M. Y. (2020). Spatial characteristics of water conservation function in hilly region of Loess Plateau based on INVEST model. Acta Ecol. Sin. 40 (17), 6161–6170. doi:10.5846/stxb201910102108
Liu, Y., Gao, Y. B., Pan, Y. C., Tang, L. N., and Tu, M. G. (2021). Spatial characteristics of rural functions based on multi-source data and measurement of trade-offs and synergies. Geogr. Res. 40 (07), 2036–2050. doi:10.11821/dlyj020201140
Luo, G. (2019). Spatial-temporal differentiation and influencing factors of land use versatility in Chongqing. Chongqing, China: Southwest University.
Meng, H. B., Zhou, Q. G., Li, M. H., Zhou, L., Liu, X. W., and Peng, C. H. (2021). Spatial and temporal changes of ecosystem services and their trade-offs and synergies in the Three Gorges Reservoir Area. J. Ecol. Rural Environ. 37 (05), 566–575. doi:10.19741/j.issn.1673-4831.2020.0814
Pan, Y., Xu, Z., and Wu, J. (2013). Spatial differences of the supply of multiple ecosystem services and the environmental and land use factors affecting them. Ecosyst. Serv. 5, 4–10. doi:10.1016/j.ecoser.2013.06.002
Pan, X., Shi, P.-ji, and Wu, Na (2020). Ecological risk assessment and priority area identification based on ecosystem service balance: A case study of lanzhou city. Chin. J. Environ. Sci. 40 (02), 724–733. doi:10.13671/j.hjkxxb.2019.0437
Peng, J., Liu, Z. C., Liu, Y. X., Chen, X., and Zhao, H. J. (2016). Evaluation of landscape versatility of county cultivated land in Beijing-Tianjin-Hebei region. Acta Ecol. Sin. 36 (8), 12. doi:10.5846/stxb201509091856
Peng, J., Liu, Y., Liu, Z., and Yang, Y. (2017). Mapping spatial non-stationarity of human-natural factors associated with agricultural landscape multifunctionality in Beijing–Tianjin–Hebei region, China. Agric. Ecosyst. Environ. 246, 221–233. doi:10.1016/j.agee.2017.06.007
Qi, N., Zhao, J., Yang, Y.g, Gou, R. K., Chen, J. Q., Zhao, P. X., et al. (2020). Ecosystem service trade-offs and synergies based on service clusters in Northeast China. Acta Ecol. Sin. 40 (09), 2827–2837. doi:10.5846/stxb201903310620
Ren, G., Liu, L., Li, H.g, and Yuan, C. C. (2019). Trans. Chin. Soc. Agric. Eng. 35 (23), 273–285. doi:10.11975/j.issn.1002-6819.2019.23.034
Sun, X., Lu, Z., Li, F., and Crittenden, J. C. (2018). Analyzing spatio-temporal changes and trade-offs to support the supply of multiple ecosystem services in Beijing, China. Ecol. Indic. 94, 117–129. doi:10.1016/j.ecolind.2018.06.049
Verhagen, W., van der Zanden, E. H., Strauch, M., van Teeffelen, A. J., and Verburg, P. H. (2018). Optimizing the allocation of agri-environment measures to navigate the trade-offs between ecosystem services, biodiversity and agricultural production. Environ. Sci. Policy 84, 186–196. doi:10.1016/j.envsci.2018.03.013
Wang, C., and Tang, N. (2018). Spatial and temporal characteristics and pattern evolution of the coupling and coordination of rural three-livelihood spatial function in Chongqing. Geogr. Res. 37 (06), 1100–1114. doi:10.11821/dlyj201806004
Willemen, L., Hein, L., van Mensvoort, M. E. F., and Verburg, P. H. (2010). Space for people, plants, and livestock? Quantifying interactions among multiple landscape functions in a Dutch rural region. Ecol. Indic. 10, 62–73. doi:10.1016/j.ecolind.2009.02.015
Xin, L., Fang, B., Yin, R., and Hui-fang, R. (2019). Spatial-temporal change and collaboration/trade-off relationship of production-living-ecological functions in county area of Jiangsu province. J. Nat. Resour. 34 (11), 2363–2377. doi:10.31497/zrzyxb.20191109
Xu, X., Yang, G., Tan, Y., Liu, J., and Hu, H. (2018). Ecosystem services trade-offs and determinants in China's yangtze river economic belt from 2000 to 2015. Sci. Total Environ. 634, 1601–1614. doi:10.1016/j.scitotenv.2018.04.046
Yang, W., Jin, Y., Sun, L.n, Sun, T., and Shao, D. D. (2019). Ecosystem service tradeoff intensity in the Yellow River Delta wetland based on production possibility boundary. J. Nat. Resour. 34 (12), 2516–2528. doi:10.31497/zrzyxb.20191203
Zhang, C., and Ren, Z. (2015). Dynamic assessment of carbon sequestration and oxygen release value in land ecosystem in northern Shaanxi Province. Geogr. Res. 34 (08), 1522–1534. doi:10.11821/dlyj201508010
Zhang, L., Fu, B., Lü, Y., and Zeng, Y. (2015). Balancing multiple ecosystem services in conservation priority setting. Landsc. Ecol. 30 (3), 535–546. doi:10.1007/s10980-014-0106-z
Zhang, Y., Long, H., Tu, S., Ge, D., Ma, L., and Wang, L. (2019). Spatial identification of land use functions and their tradeoffs/synergies in China: Implications for sustainable land management. Ecol. Indic. 107, 105550. doi:10.1016/j.ecolind.2019.105550
Zhu, W., Pan, Y., Liu, X., and Wang, A. (2006). Spatio-temporal distribution of net primary productivity along the Northeast China Transect and its response to climatic change. J. For. Res. 17 (02), 93–98. doi:10.1007/s11676-006-0022-4
Zhu, W., Pan, Y., He, H., Yu, D., and Hu, H. (2006). Simulation of maximum light utilization rate of typical vegetation in China. Chin. Sci. Bull. (06), 700–706. doi:10.3321/j.issn:0023-074X.2006.06.014
Zhu, W., Pan, Y., and Zhang, J. (2007). Estimation of net primary productivity of terrestrial vegetation in China by remote sensing. Acta Phytoecol. Sin. (03), 413–424. doi:10.3321/j.issn:1005-264X.2007.03.010
Keywords: land use function, trade-offs, synergies, spatiotemporal variation, Bin County
Citation: Ning J, Zhang H, Shi D and Du G (2023) Analysis of trade-offs/synergies in land use function changes in Bin County, China. Front. Environ. Sci. 11:1120704. doi: 10.3389/fenvs.2023.1120704
Received: 10 December 2022; Accepted: 09 May 2023;
Published: 23 May 2023.
Edited by:
Jiren Xu, University of Glasgow, United KingdomReviewed by:
Yuhong Zhang, Harbin Normal University, ChinaCopyright © 2023 Ning, Zhang, Shi and Du. This is an open-access article distributed under the terms of the Creative Commons Attribution License (CC BY). The use, distribution or reproduction in other forums is permitted, provided the original author(s) and the copyright owner(s) are credited and that the original publication in this journal is cited, in accordance with accepted academic practice. No use, distribution or reproduction is permitted which does not comply with these terms.
*Correspondence: Jing Ning, am5pbmdAbmVhdS5lZHUuY24=; Huimei Zhang, Mjg1Nzg1MjM1OEBxcS5jb20mI3gwMjAwYTs=
Disclaimer: All claims expressed in this article are solely those of the authors and do not necessarily represent those of their affiliated organizations, or those of the publisher, the editors and the reviewers. Any product that may be evaluated in this article or claim that may be made by its manufacturer is not guaranteed or endorsed by the publisher.
Research integrity at Frontiers
Learn more about the work of our research integrity team to safeguard the quality of each article we publish.