 Hui Huang1
 Zhaoxi Wei
95% of researchers rate our articles as excellent or good
Learn more about the work of our research integrity team to safeguard the quality of each article we publish.
Find out more
ORIGINAL RESEARCH article
Front. Environ. Sci. , 08 March 2023
Sec. Environmental Economics and Management
Volume 11 - 2023 | https://doi.org/10.3389/fenvs.2023.1119914
This article is part of the Research Topic Low-Carbon Transformation for Sustainable Development View all 14 articles
Improving carbon emission efficiency and reducing carbon emissions is crucial to achieving the goal of carbon neutrality and carbon peak. This paper focuses on 278 cities in China from 2000 to 2017, and uses the undesired output SBM model to measure the carbon emission efficiency of each city. The results showed that during the research period the average carbon emission efficiency of China gradually dropped from 0.6 to 0.5. After classifying the carbon emission efficiency of each city. The number of cities in 2005 belonging to high-efficiency areas decreased by 11.76% compared with 2000. From 2005 to 2010, the number of cities in the medium-low-efficiency areas and low-efficiency areas increased from 122 to 143. It is found that the spatial-temporal evolution of carbon emission efficiency, on the whole follows a certain evolution law and has spatial auto-correlation. In addition, the spatial Durbin model model is selected to explore the influencing factors of urban carbon emission efficiency. The findings demonstrate that optimizing the quality of urban development, improving the ability of scientific, and technological innovation, grasping government intervention, and encouraging the introduction of high-quality foreign capital will play a positive role in improving the low efficiency of carbon emissions in cities.
Climate problems and ecological imbalance have become the problems that endanger the human living environment and health security. In the Fourth Assessment Report on Global Climate Change, the United Nations Intergovernmental Panel on Climate Change (IPCC) stated that greenhouse gas emissions from human activities mainly cause the warming of the Earth from the mid-20th century to the present. In 2015, 178 parties to the United Nations Framework Convention on Climate Change signed the Paris Agreement to combat climate change, ensuring that the global average temperature rise does not exceed 2°C compared to the pre-industrial revolution and striving to keep it within 1.5°C. Therefore, governments accelerate the pace of low-carbon economic transformation and promote the sustainable improvement of the natural ecological environment. As one of the largest exporters of carbon emissions, General Secretary Xi (2021) proposed to build a ‘community of life between humans and nature’, reflecting China’s great concern about solving the contradiction between ecological and economic development caused by industrial civilization. The key to resolving this contradiction is to achieve carbon peak, and carbon neutrality and to promote the green transformation of production and lifestyle. Researching the improvement of carbon emission efficiency is an important path to achieving China’s carbon emission reduction goals. Promoting the implementation of carbon emission reduction policies and measures in prefecture-level cities is an important measure to promote low-carbon, circular development and achieve sustainable development in China.
In recent years, scholars have investigated carbon emission efficiency from different dimensions mainly including carbon emission intensity and carbon productivity. Carbon emission intensity is measured by carbon emission and physical production (Zhang, 2009; Zhang, 2010; Su et al., 2013; Yu et al., 2018). The research on carbon productivity is divided into two stages. The preliminary research primarily focuses on measuring the single factor carbon emission efficiency, which is equivalent to using the ratio between carbon emissions and a single factor to respond to the characteristics of carbon emission efficiency (Otavio and José, 1999; Sun, 2005). A single factor cannot fully reflect the influencing factors of carbon emission efficiency scholars began to study carbon emission efficiency from a total factor perspective in the later period by taking into account the influence of political, economic, ecological, technological, and other factors on carbon emission efficiency (Hu and Kao, 2007; Wang et al., 2020). In terms of measuring carbon emission efficiency, domestic and foreign scholars mainly use two methods, DEA (Zofio and Prieto, 2001; Zhou et al., 2010; Wang, 2022; Zhang, 2023) and SFA (Du and Zou, 2011). Since the SFA method cannot eliminate the problem of subjective factors on weight setting and the traditional DEA model requires all input factors to be cut by the same proportion. Which is inconsistent with the actual economic production activities and makes its efficiency measurement biased. Therefore, an increasing number of scholars have improved based on previous studies. Some scholars combined RAM model with SFA method (Cai, 2017) and some scholars combined RAM model with DEA model (Meng et al., 2017). But at present, most scholars tend to combine the three-stage DEA model with the super-efficiency SBM model to measure the efficiency problem (Wang, 2019; Wang et al., 2021a; Zhang, 2022; Li, 2022; Zhu et al., 2022). Due to different time scales, sources of carbon emissions and analysis methods current studies on carbon emission efficiency are different even if the research objects are the same among different references. From the perspective of spatial econometrics, the rise of spatial econometrics some scholars focus on the spatial effects of carbon emission efficiency. Most studies on the influencing factors of carbon emission are carried out based on IPAT model and KAYA identity. However, due to the different research objects and research periods, the influencing factors of carbon emission efficiency of different research objects will have certain characteristics in different research periods. But scholars have not reached a consensus on defining the influencing factors of carbon emission efficiency. Most scholars’ influencing factors of carbon emission efficiency are carried out from science and technology and industrial structure (Ma, 2015; Song et al., 2018; Zhao, 2019; Guo and Zou, 2020; Li et al., 2020; Yin, 2021; Shang et al., 2022). It is confirmed that the impact of these two factors on carbon emissions has been widely recognized by the academic community. However, due to the differences in the study area, research period, and calculation error the significance of these factors is also different.
Due to the difficulty in gathering data, most extant studies estimate carbon emission efficiency at the national, provincial, or regional level, with only a few studies conducted at the national city level and in a period before 2015. Secondly, most scholars mainly use stochastic Frontier analysis (SFA) or data envelopment analysis (DEA) and use the division of three major regions and four major economic regions to measure carbon emission efficiency. Some new measurement models that have overcome the shortcomings of SFA and traditional DEA methods can better meet the actual production measurement needs. Considering the three major regions and the four major economic regions can no longer accurately reveal the differences and regularities of China’s regional economic development. Therefore, according to the report of the Development Research Center of the State Council. This paper adopts the division standard of eight comprehensive economic zones, and each regional division has epochal characteristics. This is a new perspective to study issues related to carbon emission efficiency and provides new ideas for the subsequent research of other scholars. In addition, for cities in different provinces, their carbon emission efficiency will affect each other due to geographical proximity and other reasons. Therefore, from the perspective of spatial effect the discussion on the spatial-temporal evolution of carbon emission efficiency at the national urban scale cannot be ignored. China has a large number of prefecture-level cities with a complex socio-economic backgrounds. To carry out research on carbon emissions of prefecture-level cities and explore the spatial-temporal evolution of carbon emissions and its influencing factors at the prefecture-level scale is conducive to the national and governments at all levels to formulate feasible carbon emission reduction plans according to local conditions based on improving the quality of economic development and steadily promoting the process of urbanization. Improving energy conservation and emission reduction policies have important reference value. It is also helpful for readers to understand the carbon emission situation of different cities. This study can provide a theoretical basis and guide readers to think deeply about carbon emissions.
So this paper takes the data of 278 cities in China from 2000 to 2017 as a sample, and adopts the super-efficient SBM model with non-expected output to measure the carbon emission efficiency. This paper dividing China into eight comprehensive economic zones combines spatial econometric models to explore the spatial and temporal evolution patterns of carbon emission efficiency. Its influencing factors provide theoretical support and practical reference for improving carbon emission efficiency.
In this paper, Super-efficiency SBM model that considers environmental factors based on undesirable outputs is selected to solve the slack problem of input-output and the problem of efficiency analysis in the presence of undesirable output. Tone (Kaoru, 2001) proposed the SBM (Slack-based Measure, SBM) model based on considering the slack variable, defining the production possibility set as
The specific calculation formula is:
In this formula:
The super-efficiency SBM model supposes to solve when the efficiency value of multiple decision units is 1. The removal point (x0, y0) redefines the production possibility set. The super-efficiency SBM model makes the efficiency calculation more accurate and efficient. However, the impact of environmental factors on the efficiency of the production system is increasing and cannot be ignored. Tone (Kaoru, 2002) stated the super-efficient SBM model with non-desired output considering environmental factors. There are still n decision units DMUs, m input variables x, s1 desired output variables
The formula for measuring the DMU of the evaluated unit is:.1
In this formula:
James and Kelly (2009) extend the SLM model and propose the spatial Durbin model (SDM), which contains the lag term of the explained variable and in turn includes the lag term of the explained variable. In this paper, the spatial Durbin model (SDM) is selected to analyze the influence of each indicator factor on carbon emission efficiency, which can reflect the spatial correlation of both the explained variable and explanatory variables as a formula (3):
In this formula:
The super-efficient SBM model contains input variables, non-expected output variables, and expected output variables. This paper draws on the perpetual inventory method of Xiang (2011), Liu et al. (2017), and others using social aggregate investment in fixed assets as investment indicators. Refers to the literature of Guo and Lin (2017) and other scholars on carbon emission efficiency accounting and Wu et al. (2014), Zou et al. (2014) and others using provincial nighttime lighting data to extrapolate urban scale data. The stock of fixed assets, labor input, and energy input are selected as input variables. Carbon emissions are undesired output indicators the level of economic development is the desired output indicator. Data required for calculating fixed asset stocks and economic development levels are obtained from the China City Statistical Yearbook. And the data on labor input are obtained from the China Statistical Yearbook for Regional Economy. The final labor input is expressed by averaging the number of employees at the end of the previous year with the number of employees at the end of the current year. Some missing data are obtained by linear interpolation. Data on energy input came from the China Energy Statistical Yearbook.
The process of obtaining carbon emission data of prefecture-level cities is as follows: provincial night light data to invert city-scale data by Wu et al. (2014) and Zou et al. (2014) night light data to invert county carbon emission data by Wang et al. (2021a) and the data had advantages of consistent statistical caliber and strong continuity. First process DMSP/OLS night light data and NPP/VIIRS night light data to obtain night light data for each year from 2000 to 2017. The data includes provincial night light data and municipal night light data. Secondly, many scholars have demonstrated the correlation between carbon emissions and the total value of night light. Therefore, referring to the research of relevant scholars fitted the correlation between carbon emissions and the total value of annual night light in 30 provinces or cities in China (excluding Taiwan, Tibet, Hong Kong, and Macao). Then selected the quadratic polynomial with the best goodness of fit is the fitting model. The total carbon emissions of each province can be calculated through the consumption of fossil energy provided in the China Energy Statistical Yearbook. Finally, the relevant fitting coefficient of each province can be obtained, and its reliability can be determined by a precision test. Finally, using DMSP/OLS and NPP/VIIRS night light data of prefecture-level cities and relevant fitting coefficients of their provinces and cities, carbon emissions of prefecture-level cities can be derived.
The carbon emission efficiency is affected by various factors. By analyzing the existing research results, the main academic views are that the industrial structure dominated by the secondary industry is the main reason for the increase in carbon emissions, and scientific and technological progress has a significant effect on reducing carbon emissions. The influence of these two factors on carbon emission has been widely recognized by the academic circle. Fan et al. (2019) proposed that the rapid development of urbanization would lead to a rapid increase in population density, which would significantly promote carbon emissions. In addition, factors such as ecological environment, government intervention and foreign investment were also proved by Ma (2015) and Li et al. (2020) to be important factors in inhibiting or promoting carbon emission efficiency.
Based on the existing research results, this paper selects the carbon emission efficiency of cities throughout the country as the dependent variable. Selects the industrial structure, urbanization level, technological progress, population density, ecological environment, government intervention and foreign investment of cities as explanatory variables to conduct a spatial econometric analysis of influencing factors. The relevant data are from the China City Statistical Yearbook, missing data using the linear interpolation method.
Based on the eight comprehensive economic zones, the spatial and temporal evolution of carbon emission efficiency of 278 cities in China is studied and explored (Figure 1). Due to the shortage of energy and carbon emission statistics in Tibet, Hong Kong, Macao, and Taiwan Province, the four regions in this study were not included in the calculation.
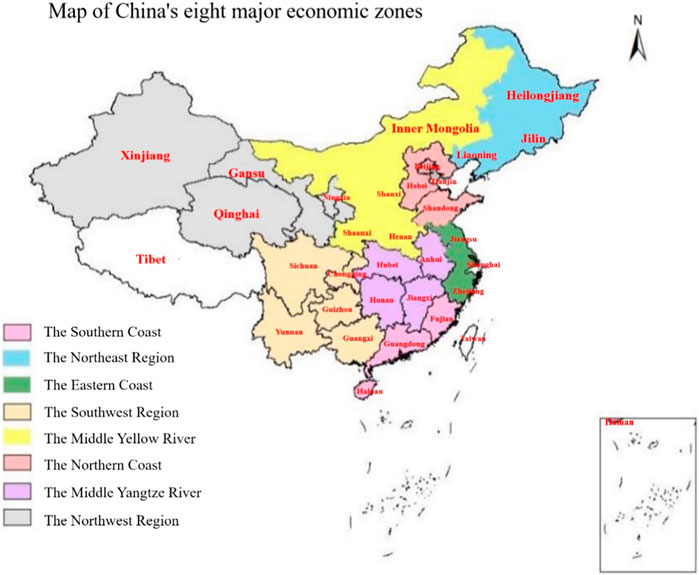
FIGURE 1. Map of China’s eight comprehensive economic zones.
From the overall perspective (Figure 2), overall carbon emission efficiency decreased continually from around 0.6 to 0.5, with a significant increase in 2009. Zhao (2013) and Wang et al. (2021b) both believe that the economy is an important factor affecting carbon emissions in both the long and short term. It was disturbed by the international financial crisis in 2008, which seriously affected the economic development of various regions and led to the overall economic recession. The carbon emission efficiency also fluctuated significantly. In 2009, due to the impact of the United Nations Climate Change Conference, the issue of carbon emissions was pushed to the forefront of public opinion. The government strengthened the control of carbon emissions, and the efficiency of carbon emissions was improved. After that China’s carbon emission efficiency has shown a continuous decrease. Zhao (2019) stated that the average national carbon emission efficiency from 2000 to 2016 shows an overall decreasing trend. Indicating that the country still puts economic construction in first place, which has caused some negative impacts on the environment.
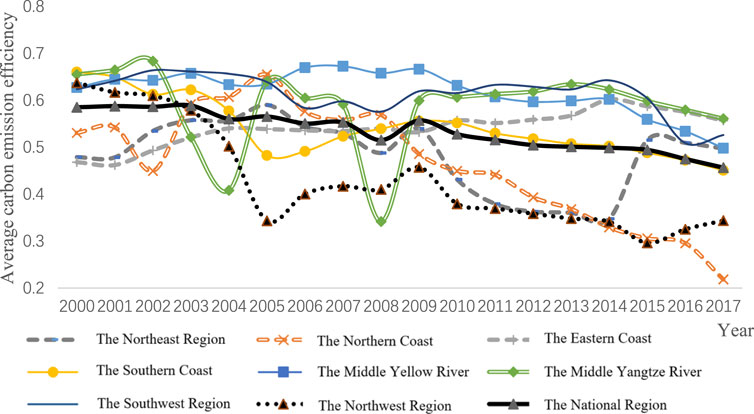
FIGURE 2. 2000–2017 China’s eight regions and the national carbon emission efficiency mean change chart.
From the perspective of the eight comprehensive economic zones, the average carbon emission efficiency of each region is quite different (Figure 2). (Excluding Tibet, Taiwan, Hong Kong, and Macao) The middle Yellow River region has the highest mean carbon emission efficiency with a total mean value of 0.6184 from 2000 to 2017, which makes a major contribution to China’s carbon emission efficiency. This was followed by the southwest region at 0.6135. The middle Yellow River and the southwest region use advanced carbon emission technology to take the path of low-carbon industrial structure, adjust and upgrade the industrial structure, and continuously improve energy efficiency. The impact of the financial crisis in 2008 eliminated some industries with low output and high energy consumption, so the average carbon emission efficiency of the two regions is always at a higher level in the country. In addition, these two regions have vast territories, and the environment has a greater ability to purify pollutants. Coupled with abundant energy resources led to the continuous transfer of high-energy-consuming industries in other regions to these two regions. However, the technical capabilities of these two regions are not as good as the eastern coastal areas and the middle Yangtze River. The carbon emission efficiency of the middle Yellow River and the southwest region has lagged behind that of the eastern coastal areas and the middle Yangtze River especially after 2015. The region with the lowest mean value of carbon emission efficiency is the Northwest Region. The mean value of carbon emission efficiency has been decreasing since 2000 and rebounded a small amount after 2005. Its maintenance is low but has improved significantly in 2015. Although the northwest region is remote, it is rich in energy resources. Therefore, after 2000 the development strategy of the western region led to the rapid development of energy-intensive industries it increased development opportunities and economic investment, and the proportion of the secondary industry increased. However, the technical level is limited and the management experience is insufficient, resulting in energy waste so that the carbon emission efficiency is decreasing. After 2015, possibly affected by the Paris Climate Conference the Northwest region continues to optimize the quality of industrial development, resulting in improved carbon emission efficiency. The average carbon emission efficiency of the northern coast and the northeast region is lower than the national average of 0.5345. The average carbon emission efficiency of the northern coast began to rise in 2002 reached a peak point in 2005 and decreased significantly since 2005. Due to the closure of many energy-intensive and polluting enterprises during the ‘10th Five-Year Plan’ the control of carbon emissions before 2005 was effective. In order to maintain a stable economic development rate the task of reducing carbon emissions still facing difficulty. The average carbon emission efficiency in the Northeast region showed a downward trend after 2009, which is related to the excessive dependence on heavy industry and the lack of technological innovation in Northeast China. High energy consumption, high emission and high pollution are serious, and the carbon emission efficiency is still low. After 2015 influenced by the Paris Climate Conference, the government issued a series of policies to help enterprises in the northeast region to transform and upgrade by adjusting industrial structure, continuously reduceing carbon emissions and enhanceing environmental awareness. Coupled with the decline of heavy industry and ecological environment restoration, the average carbon emission in the northeast region was higher than the national average level. The average carbon emission efficiency of the eastern coast overall situation is relatively stable with slow increase but still retention at a higher level in the country. This is due to the high degree of opening up of the eastern coastal areas, advanced technology and management experience. In addition, enterprises with high energy consumption and high emissions continue to move out, and the tertiary industry with low carbon emission intensity grows faster so that the carbon emission efficiency continues to increase. The average carbon emission efficiency of the southern coast continued to decrease between 2000 and 2005 and increased since 2005, generally staying with the national average level. This is because the region’s economic development and technology are relatively developed. In the early stage of development, a series of environmental problems such as strengthening construction, environmental protection, promoting emission, etc., Led to a decrease in the average emission efficiency. After that, as the recovery of the national economy once again promoted the development of the region, the average carbon emission efficiency of the southern coast did not lower the national average in the later period. Although the eastern coast and the southern coast have a high degree of openness to the outside world, they invested heavily in infrastructure construction in 2008 in response to the financial crisis, resulting in an increase in demand for steel and cement, resulting in a large number of carbon emissions. However, due to the advanced level of technology application, rich management experience, and a series of measures taken by the government, the carbon emission efficiency of the eastern coast and the southern coast in 2008 fluctuated less. The average carbon emission efficiency in the middle Yangtze River reached a trough in 2004 and 2008 respectively and finally stabilized after 2009. It is speculated that economic development is emphasized while environmental pollution is neglected, so the average carbon emission efficiency is reduced in 2004. Due to its high degree of opening to the outside world, so affected by the 2008 international financial crisis, in response to the financial crisis, the government investment stimulus, resulted in a large number of carbon emissions, resulting in low overall carbon emissions efficiency. After 2009, affected by the United Nations Climate Change Conference, coupled with a series of government measures, the region’s carbon emissions efficiency has improved. Although the fluctuation in the middle Yangtze River is large, the overall carbon emission efficiency in the region is high, which also benefits from the local advanced technology and rich management experience. From 2000 to 2017, the mean carbon emission efficiency of each region has a large difference, showing a downward trend.
To deeply analyze the changes in carbon emission efficiency this paper selects the carbon emission efficiency values of Chinese cities in 2000, 2005, 2010 and 2015 and uses ARCGIS to classify and visualize the carbon emission efficiency (Figure 3). Among them, [0.7, 1] is the high-efficiency area, [0.6, 0.7] is the more efficient area, [0.5, 0.6] is the mid-high efficient area, [0.4, 0.5] is the medium-low-efficiency area, below 0.4 is the low-efficiency area, and the white area indicates no data.
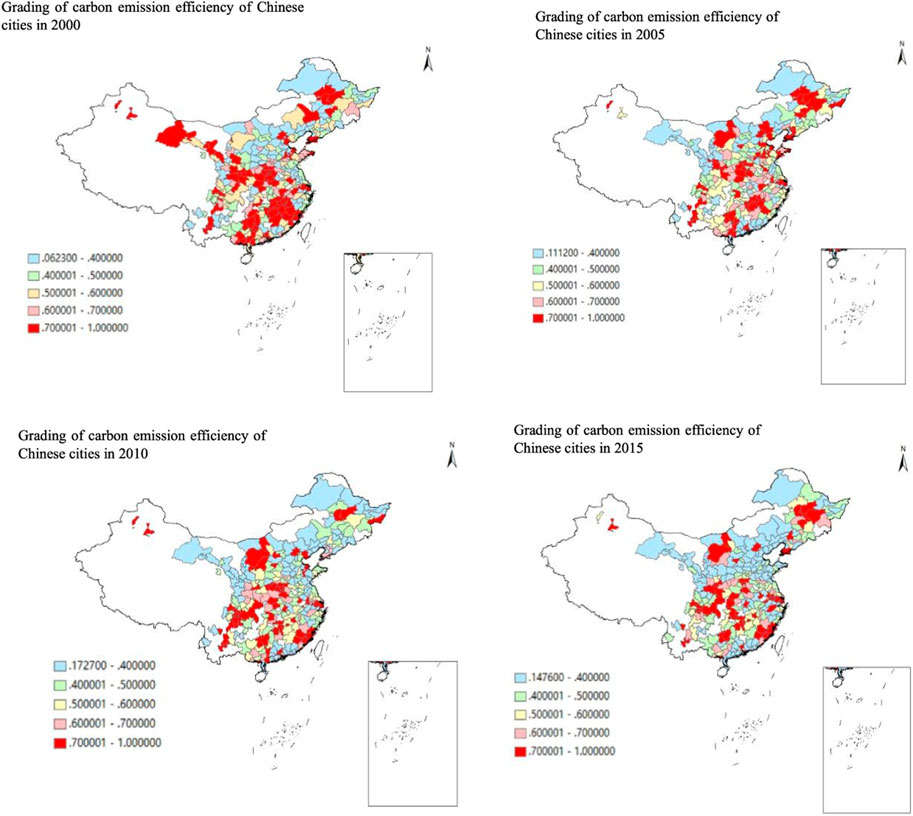
FIGURE 3. Grading of carbon emission efficiency in Chinese cities.
In 2005, the number of cities belonging to high-efficiency areas decreased by 11.76% compared with 2000. From 2005 to 2010, the number of cities in the medium-low-efficiency areas and low-efficiency areas increased from 122 to 143, and the increase was more obvious. By 2015, it can be seen that some cities adjacent to high-efficiency areas gradually changed from high-efficiency areas to medium-low-efficiency areas or low-efficiency areas. It shows that the carbon emission efficiency of China’s cities are in a downward trend, fewer cities in the high-efficiency areas, and more cities in the medium-low-efficiency areas and low-efficiency areas. In the selected 4 years, it can be seen that the carbon emission efficiency of Beijing, Shanghai, Daqing, Wuxi, Shenzhen, Zhengzhou, Liuzhou and other cities has always remained at 1, most of which are located east of the ‘Hu Huanyong Line’. The carbon emission efficiency of Fuxin, Tieling, Chaoyang, Huludao, Xingtai, Langfang, Heze, Lianyungang, Huzhou, Quzhou, Lishui, Meizhou, Shanwei, Heyuan, Qingyuan, Sanya, Xinzhou, Hulun Buir, Bayannur, Ulanchap, Anshun, Lijiang, Yinchuan and Guyuan is always lower than 0.4, of which 37.5% are distributed in the eastern coast and southern coast, 33.33% are distributed in the middle Yellow River, Southwest China and Northwest China, 29.17% are distributed in the northeast and northern coastal areas, while the middle reaches of the Yangtze River are not distributed. This study finds that carbon emission efficiency is bounded by the ‘Hu Huanyong Line’, and there are more high-efficiency cities to the east of the line than those to the west of the line, but the significance gradually decreases, indicating that the distribution of high-efficiency cities is gradually dispersed. It shows that although the cities to the east of the ‘Hu Huanyong Line’ are more effective in carbon emission efficiency, carbon emission efficiency still shows a general downward trend. After all, although advanced technology has improved carbon emission efficiency, it will also bring more capital investment and carbon emission demand, which will lead to a decrease in carbon emission efficiency. Two reasons can be inferred for cities with carbon emission efficiency always higher than 1. First, due to the more developed regions, high energy-consuming and high-polluting enterprises continue to migrate outward, making carbon emission intensity effectively reduced, thus improving carbon emission efficiencies, such as Beijing, Shanghai and Shenzhen. Second is that capital investment makes some high-energy-consuming industries continue to develop and carbon emissions increase, but at the same time, it pays attention to environmental protection. With the support of relevant policies, advanced production technology and rich management experience have effectively improved carbon emission efficiency, such as Daqing, Wuxi, Zhengzhou and Liuzhou. For cities whose carbon emission efficiency is always lower than 0.4, all regions are distributed except the middle Yangtze River, indicating that the middle Yangtze River has achieved relatively significant results in energy conservation and emission reduction, while cities in other regions should become key areas for improving carbon emission efficiency.
To explore whether the spatial distribution characteristics of carbon emission efficiency in China’s cities are affected by spatial auto-correlation during the sample period. It is necessary to test the spatial correlation of carbon emission efficiency in China’s cities, including the global spatial correlation test and local spatial correlation test.
This paper uses the Global Moran’s I to test whether there is a spatial correlation in the overall carbon emission efficiency of cities in China. The calculation formula is shown in (4). The value domain is [-1, 1]. If the result is greater than zero, it indicates that there is a spatial positive correlation between the carbon emission efficiency of each city. The larger the value, the more obvious the spatial correlation. The positive correlation of space indicates that the correlation is more significant with the aggregation of spatial distribution. There is a spatial negative correlation when it is less than zero, and the spatial negative correlation indicates that the correlation becomes significant with the dispersion of the spatial distribution. Equivalent to zero indicates no correlation, using ARCGIS to get results.
Where
This paper uses the local Moran index to further test whether there is a significant local spatial agglomeration or differentiation in the carbon emission efficiency of cities during the sample period. Local spatial autocorrelation analysis is a clustering and outlier analysis of the given elements and fields, if the cities with high carbon emission efficiency are clustered together, they are “HH” (High-High) clustering, and if cities with low carbon emission efficiency are clustered together, they are “LL” (Low-Low) clustering. Both “HH” and “LL” are “positive spatial autocorrelation”; if cities with high carbon emission efficiency and cities with low carbon emission efficiency are clustered together, they are “HL” (High-Low) outliers or “LH” (Low-High) outliers, both of which represent spatial outliers. If the cities with high carbon emission efficiency and the cities with low carbon emission efficiency are randomly distributed, the local Moran index p is not less than 0.05, indicating that the correlation is not significant.
By observing the global Moran index of Chinese cities from 2000 to 2017 (Table 1), the values were greater than zero, and all Moran values passed the significance test. From 2000 to 2007, the Moran index decreased in volatility, indicating that the spatial correlation between carbon emission efficiency in China’s cities weakened in volatility. The Moran index showed a rising trend in 2008–2017, from 0.15567 from 2008 to 0.225,294 in 2017. It shows that during the study period, the carbon emission efficiency of 278 cities in China as a whole shows a positive spatial correlation of ‘first fluctuation and then rise’, and the spatial distribution of carbon emission efficiency of cities in China is not random. Cities with similar carbon emission levels show a state of agglomeration. That is the number of cities with ‘high-high agglomeration’ and ‘low-low agglomeration’ first fluctuates and then increases.
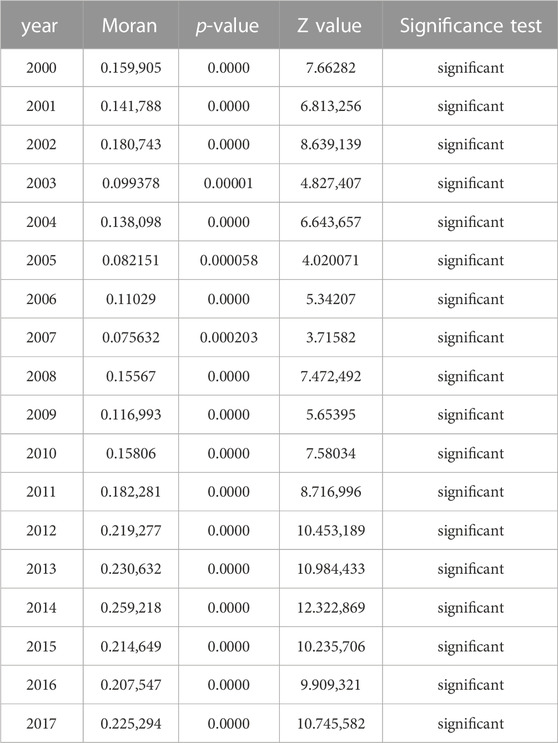
TABLE 1. China’s urban global moran index 2000–2017.
To further explore which cities have spatial agglomeration, 2000, 2005, 2010 and 2017 were selected for the local Moran index test, and the spatial clustering distribution map of carbon emission efficiency in Chinese cities was obtained (Figure 4), and specific cities were listed in Supplementary Appendix S1–S4.
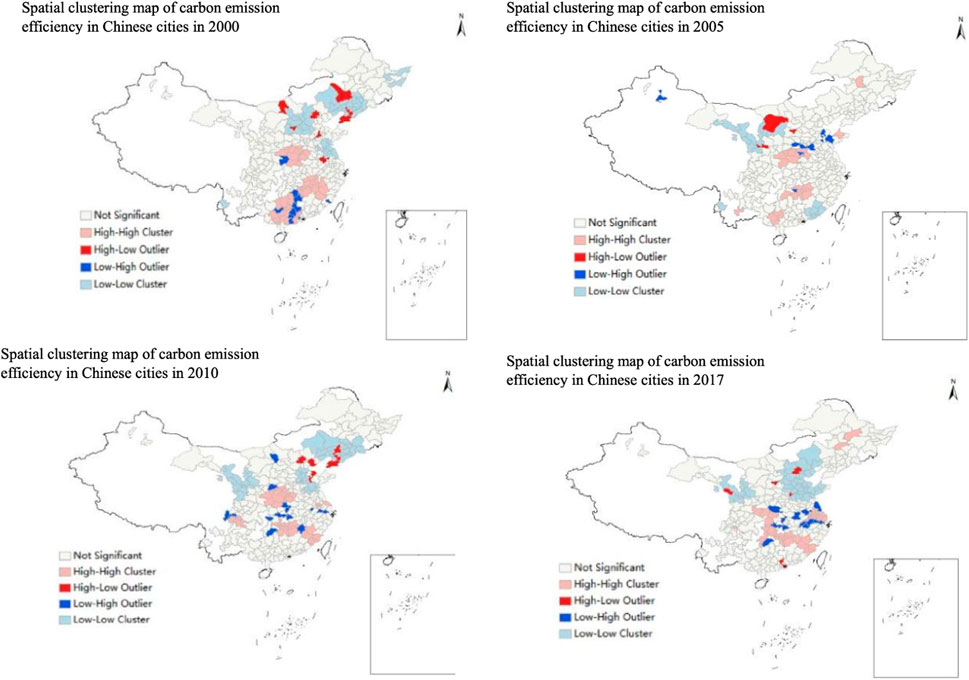
FIGURE 4. Spatial clustering map of carbon emission efficiency in Chinese cities.
From 2000 to 2017, the spatial distribution of carbon emission efficiency in Chinese cities gradually tended to be stable, with significant north-south differentiation and spatial agglomeration characteristics. It can be seen from Figure 4 that compared with 2000, the total number of cities with ‘high-high’ agglomeration and ‘low-low’ agglomeration decreased in 2005. Compared with 2005, the number of cities with ‘high-high agglomeration’ and ‘low-low agglomeration’ increased in 2010 and 2017, and gradually connected into pieces, which was basically consistent with the results of the global spatial correlation test.
Compared with 2000, the total number of cities with ‘HH’ aggregation and ‘LL’ aggregation increased from 76 in 2000 to 78 in 2017. The total number of cities with ‘HL’ and ‘LH’ characteristics decreased from 22 in 2000 to 19 in 2017. This shows that the spatial positive auto-correlation characteristics of urban carbon emission efficiency are gradually increasing and showing a trend of polarization. The distribution of cities with high carbon emission efficiency and cities with low carbon emission efficiency is gradually dispersed. Cities with high carbon emission efficiency are gradually adjacent to cities with high carbon emission efficiency, and cities with low carbon emission efficiency are gradually adjacent to cities with low carbon emission efficiency.
The cities that have always maintained the characteristics of ‘HH’ in the 4 years are Ji ‘an, Yichun, Xinyu, Pingxiang, and Zhuzhou. These cities are distributed in the middle Yangtze River. In addition, the number of cities with ‘HH’ characteristics in the middle Yangtze River and the eastern coast is increasing. The number of cities in the middle Yangtze River has increased from 13 to 19, and the number of cities on the eastern coast has increased from 0 to 10. These areas have advanced technical levels, rich management experience and high energy utilization rates, so the overall carbon emission efficiency is constantly improving. In these 4 years, cities in the northwest region have not shown ‘HH’ characteristics. Due to the remoteness of the region and the limited technical level, the overall carbon emission efficiency is low. And the cities with ‘HH’ characteristics in the middle Yellow River, southwest region, southern coast and northern coast are decreasing. Therefore, these areas should improve carbon emission efficiency for their own development problems.
It can be seen from the table that no city has always maintained the ‘LL’ characteristics, but the number of cities with ‘LL’ characteristics in the northern coast and northwest region is significantly higher than that in other regions, and the number of cities with ‘LL’ characteristics in the northern coast is increasing. From five in 2000 to 28 in 2017 indicating that the cities in this region ignore the importance of carbon emission reduction while pursuing economic development. The number of cities with ‘LL’ characteristics in the northwest region has decreased, indicating that the region has continuously optimized the quality of industrial development. Thus improving carbon emission efficiency but there is still a long way to go. There have been no cities with ‘LL’ characteristics in the middle Yangtze River. And the number of cities with ‘LL’ characteristics in the middle Yellow River, southwest region, the southern coast, northeast region and eastern coast is decreasing, indicating that cities in these areas have achieved considerable results in controlling carbon emissions.
In these 4 years, none of the cities has always maintained the ‘HL’ and ‘LH’ characteristics. However, compared with other regions the number of cities with ‘HL’ characteristics in the middle Yellow River and the northern coast is relatively large, and the number of cities with ‘LH’ characteristics in the middle Yellow River and the middle Yangtze River is quite large. Because the geographical location of these cities connects the developed eastern regions and the western regions with low carbon emission efficiency, the concentration of LH or HL is more obvious. The above results and reason analysis are also largely consistent with the findings of Liu et al. (2015), Wang et al. (2016). and Shi (2017).
To sum up, the spatial distribution of carbon emission efficiency in China at this stage shows an increasing positive auto-correlation. Low-carbon emission efficiency cities should focus on their own problems and rely on the experience of neighboring high-efficiency cities to drive their own economic and industrial restructuring, actively tap their carbon emission reduction potential, and improve carbon emission efficiency.
When combined with studies on the carbon emission efficiency of Chinese cities over the last 20 years. It is clear that there is a spatial auto-correlation between carbon emission efficiency and distance between cities, with distance having varying degrees of influence on carbon emission efficiency. Further estimation of the spatial Durbin model yields R2 = 0.7769, a preliminary judgment that the explanatory variables can explain 77.69% of the explained variables, and the fit is good. Using the estimated coefficients of the variables, the direct effect, indirect effect, and total effect of each explanatory variable on carbon emission efficiency can be deduced (Table 2).
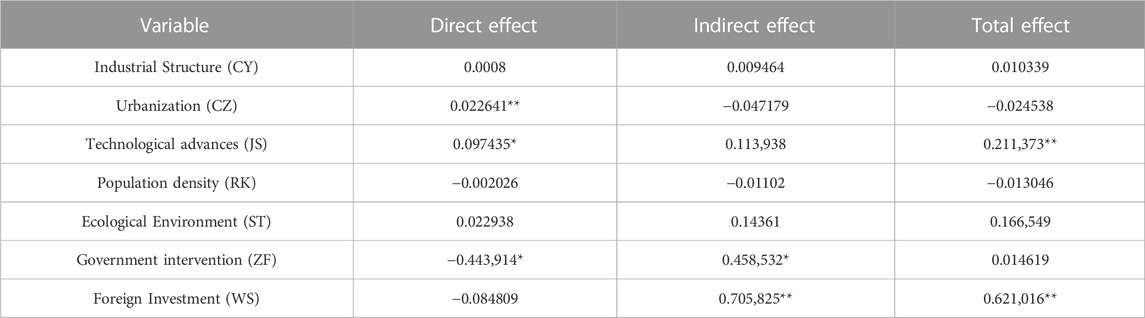
TABLE 2. Direct and indirect effects of the spatial durbin model.
From the estimation results, it can be seen that the direct effect coefficient of urbanization on urban carbon emission efficiency is 0.22641. That passes the significance level test of 5%, and the indirect effect coefficient is −0.047179, which does not pass the significance test. It indicates that increasing the urbanization rate of a city is beneficial to improving the carbon emission efficiency of this city but not to the improvement of the carbon emission efficiency of urban clusters. Xu et al. (2022) also concluded that the level of urbanization was significantly and negatively correlated with the carbon emission efficiency of the research cities. In recent years, the urbanization development mode of China’s cities has been changing from extensible development to connotative development, i.e., from the model of capital investment, the pursuit of speed and scale in the past to the development model of improving efficiency and pursuing efficiency. The development of new urbanization has a significant role in promoting carbon emission efficiency.
Both the direct and indirect effects of technological progress on carbon emission efficiency show a positive effect, and the coefficient of the direct effect is 0.097435 and passes the 1% significance level test. This shows that technological progress significantly promotes the improvement of urban carbon emission efficiency. Ning et al. (2021) concluded that the level of science and technology has a significant contribution to the improvement of carbon emission efficiency. Wei (2019) suggested that technological innovation promotes industrial upgrading. Thus improving carbon emission efficiency can reduce carbon emissions while ensuring economic growth. Therefore, Technology is the first productive force, and technological progress can serve urban economic development and urban environmental protection. Since China put forward the strategy of “developing the country through science and education,” it has taken scientific and technological progress as the “ballast stone” to coordinate the economy and the environment. Technological progress in adjusting the industrial structure, promoting the competitiveness of low-carbon industries, cultivating new energy and energy-saving industrial clusters, and promoting carbon emission reduction plays an important role in eliminating high energy-consuming industries and further improving carbon emission efficiency in this city and adjacent cities.
The coefficient of the direct effect of government intervention on the carbon emission efficiency of cities is −0.443,914. The indirect effect coefficient is 0.458,532, both pass the 1% significance test. It indicates that government intervention has a significant effect on the carbon emission efficiency of this city and neighboring cities. The development of the financial business of cities needs the government to provide the necessary financial guarantee and policy support. The smooth development of the city’s environmental protection business also needs the government’s policy leadership and regulations. Cai (2017) also suggested that the degree of government intervention is negatively correlated with the efficiency of carbon emissions in the region. One reason could be that the proportion of fiscal expenditure related to the control of CO2 emissions is not enough. The other reason may be that the effectiveness of emission reduction cannot be effectively stimulated for the time being due to pathway technology and so on. As the contradiction between the ecological environment and economic development is becoming more prominent. The state wrote the construction of ecological civilization into the working document in the 17th Party Congress, raised it to the national development layout in the 18th Party Congress, and reaffirmed the critical status of ecological civilization construction in the 19th Party Congress. It is evident that the state is paying more attention to the synergistic benefits of ecology and economy, and the effect of government intervention on carbon emission efficiency is becoming more and more significant.
The coefficients of direct and indirect effects of foreign investment on the carbon emission efficiency of cities are −0.084809 and 0.705,825, but the overall effect is positive. Zhao (2019) also suggested that changes in foreign direct investment showed a non-significant negative effect on carbon emission efficiency in the region. It suggests that China is not all green when introducing foreign investment, and to some extent takes on the bad products of polluting enterprises in developed countries, all of which have a negative effect on carbon emission efficiency in China. And increasing foreign investment has a significant effect on enhancing the carbon emission efficiency of neighboring cities. From the development trajectory of the past decades, most of the high-consumption and high-pollution industries invested by foreign investors will hurt the region’s environment. Simultaneously, it will bring the labor force of adjacent cities into this metropolis, propelling its continued expansion. As a result, most high-consumption and high-pollution businesses will migrate into this city, reducing the industries in neighboring cities. However, the degree of influence of foreign investors from different sources on the region is different. The hypothesis of ‘Pollution Paradise’ is too absolute for China, which has more and more discourse power in the world. China will inevitably introduce high-quality and high-efficiency foreign investment in the future and transform the city’s negative effect into a positive one.
It can be seen from the table that the previous industrial structure has not played a significant role in improving the carbon emission efficiency of cities and adjacent cities. Zhao (2019) also argued that the impact of industrial structure changes on adjacent areas showed a non-significant positive effect. China has continuously adjusted its industrial structure in recent years, shifting from a high-speed development model to a high-quality development model. Also pay more attention to the protection of the ecological environment in its development, the ecological benefits have also been continuously improved, but the economic benefits have decreased. So the overall benefits have not been significantly affected. The coefficient of the direct effect of population density on carbon emission efficiency is-0.002026, and the coefficient of the indirect effect is-0.01102. Both direct and indirect effects show negative effects, but the impact on carbon emission efficiency is not significant. In recent years, the population structure of various cities has been constantly adjusted and changed. The improvement of living standards has promoted the increase of energy consumption for basic living needs, which has increased carbon emissions and is not conducive to the improvement of carbon emission efficiency. The above results are also largely consistent with the findings of Zhao (2019), which are attributed to China’s long-standing family planning policy and low population growth rate, thus having less impact on carbon emission efficiency. The direct and indirect effects of the ecological environment on carbon emission efficiency are both positive, but the same effect is not significant. Although the state is paying more and more attention to environmental management and focusing on carbon emission efficiency at this stage, ecological and environmental development is a thousand-year plan. The economic benefits are difficult to quantify significantly in a short period. Hence, the state needs to be able to continuously develop policies related to environmental protection to guide the benign development of the local urban environment.
Based on the data from 278 Chinese cities year 2000–2017, this paper uses the super-efficiency SBM model of undesirable output to calculate the carbon emission efficiency of 278 Chinese prefecture-level cities with complete data available. Prefecture-level cities are an important part of the realization of new-type urbanization and agricultural modernization. Revealing the spatial-temporal pattern evolution of carbon emission in prefecture-level cities and its influencing factors play a significant role in improving China’s new-type urbanization strategy. Through promoting ecological civilization construction and green transformation development. Also has important policy significance for China’s construction of low-carbon cities. The study of carbon emission efficiency in prefecture-level cities in this paper improves the understanding of the differences in the spatial and temporal distribution patterns of carbon emission at different scales.
1) In exploring the changing trend of carbon emission efficiency in the whole country and the eight comprehensive economic zones. It is found that the carbon emission efficiency of China as a whole and the eight comprehensive economic zones generally shows a gradually decreasing trend, indicating that the whole country still puts economic construction in the first place, which has caused some negative effects on the environment. So the carbon emission efficiency has not improved significantly. Specifically, there are differences among the mean carbon emission efficiency of each region. The middle Yellow River region has the highest total mean carbon emission efficiency from 2000 to 2017, which makes a major contribution to China’s carbon emission efficiency, while the northwest region has the lowest mean carbon emission efficiency. In exploring the changing trend of carbon emission efficiency in 278 cities found that the carbon emission efficiency of all cities in China is in a downward trend. Fewer cities in the high-efficiency areas, more cities in the medium-low-efficiency areas and low-efficiency areas. The boundary of carbon emission efficiency is ‘Hu Huanyong Line’. In the four selected years, it can be seen that the cities with carbon emission efficiency always maintain one are Beijing, Shanghai, Daqing, Wuxi, Shenzhen, Zhengzhou and Liuzhou, most of which are located to the east of the “Hu Huanyong Line”. In addition, it can be seen from the figure that there are more high-efficiency zone cities east of the line than west of the line, but the significance gradually decreases, and the number of high-efficiency zone cities decreases and their distribution gradually disperses. Although the cities to the east of the ‘Hu Huanyong Line’ have achieved more significant results in carbon emission efficiency, carbon emission efficiency still shows a general downward trend. Although advanced technology has improved carbon emission efficiency. It will also bring more capital investment and carbon emission demand, resulting in a decrease in carbon emission efficiency. Of the cities whose carbon emission efficiency is always lower than 0.4, 37.5% are distributed in the eastern and southern coastal areas, 33.33% are distributed in the middle Yellow River, Southwest China and Great Northwest China, and 29.17% are distributed in the northeast and northern coastal areas. However, there is no distribution in the middle Yangtze River, indicating that the middle Yangtze River region has a relatively significant effect on energy conservation and emission reduction. Cities in other regions still have a lot of room for improvement in carbon emission efficiency.
2) In the spatial correlation test of urban carbon emission efficiency, the carbon emission efficiency of 278 cities in China as a whole shows a positive spatial correlation of ‘first fluctuation reduction and then rise’. Cities with similar carbon emission levels in China gradually gather, showing a trend of polarization. That is the distribution of cities with high carbon emission efficiency and low carbon emission efficiency is gradually dispersed. Cities with high carbon emission efficiency are gradually adjacent to cities with high carbon emission efficiency, and cities with low carbon emission efficiency are gradually adjacent to cities with low carbon emission efficiency. In 2000, 2005, 2010 and 2017, the cities that always maintain the ‘HH’ characteristics are distributed in the middle Yangtze River. The cities with ‘HH’ characteristics in the middle Yellow River, the southwest region, the southern coast and the northern coast are decreasing. No city can maintain the ‘LL’ feature, but the number of cities with ‘LL’ feature in the northern coast and the northwest regions is significantly higher than other regions. The number of cities with ‘HH’ characteristics in the middle Yangtze River has not appeared. The number of cities with ‘LL’ characteristics in the middle Yellow River, the southwest region, the southern coast, the northeast region and the eastern coast is decreasing, indicating that cities in these areas have achieved considerable results in controlling carbon emissions. No city always maintains ‘HL’ and ‘LH’ characteristics, but compared with other regions, the number of cities with ‘HL’ characteristics in the middle Yellow River and the northern coast is relatively large, and the number of cities with ‘LH’ characteristics in the middle Yellow River and the middle Yangtze River is relatively large. Because the geographical location of these cities connects the developed eastern regions and the western regions with low carbon emission efficiency. The concentration of LH or HL is more obvious. Therefore, each city should formulate policies according to its own situation and deeply tap its own carbon emission reduction potential to improve carbon emission efficiency.
3) In exploring the influencing factors of carbon emission efficiency, it is found that urbanization, technology, government intervention and foreign investment have an important impact on the improvement of carbon emission efficiency.
Specifically, the urbanization rate is conducive to improving the carbon emission efficiency of this city, but not conducive to improving the carbon emission efficiency of urban clusters. Because China has changed from the past mode of capital investment, speed and scale to the development mode of improving efficiency and pursuing efficiency. Technological progress significantly promotes the improvement of the carbon emission efficiency in cities. It adjusts the industrial structure using technological progress, promotes the competitiveness of low-carbon industries, cultivates new energy and energy-saving industrial clusters, and promotes carbon reduction and emission reduction. All of them play an important role in eliminating energy-intensive industries and further improving carbon emission efficiency in the city and neighboring cities. The degree of government intervention is negatively related to the carbon emission efficiency of the region. One reason may be that the proportion of fiscal expenditure related to the treatment of carbon dioxide emissions is not enough, and another reason may be that the emission reduction effect cannot be effectively stimulated for the time being due to the pathway technology,etc. Foreign investors directly show a non-significant negative impact on the carbon emission efficiency of the region, indicating that China has taken over the bad products of polluting enterprises in developed countries to a certain extent when introducing foreign investment. At the same time, it will make the labor force of neighboring cities flow into this city and drive this city to develop continuously, which eventually makes most of the high-consumption and high-pollution industries flow into this city and reduce the gathering of high-consumption industries in neighboring cities to a certain extent.
The 14th Five-Year Plan and the Long-Range Objectives Through the Year 2035 put forward the 14th Five-Year Plan period must follow the new development concept. To effectively transform the development mode, promote quality change, efficiency change, and power change to achieve higher quality, more efficient, more equitable, more sustainable and safer development (The People’s Daily, 2020). Improving the carbon emission efficiency of cities in each region of China is an important part of the 14th Five-Year Plan and achieving the 2035 vision. Therefore, based on the findings of the study, the following suggestions are put forward:
1) Optimize the quality of town development.
Cities with high carbon emission efficiency should focus on optimizing the quality of urban development, pay attention to the characteristics and development trend of population factors, make good use of resource factors, and match them with the layout of the industrial economy. Reduce the uncoordinated development between urban and rural areas. Improve the quality of urban development. In contrast, cities with low carbon emission efficiency like Chifeng City and Tianshui City should speed up the upgrading of urban development mode, increase the optimization of urban patterns and break through the bottleneck of new urbanization and high-quality development.
2) Improve science and technology innovation capacity.
Cities with high carbon emission efficiency pay more attention to scientific research investment and technological innovation. So they can play a significant role in improving carbon emission efficiency. However, cities with low carbon emission efficiency ignore the importance of science and technology innovation capacity. This requires that the person in charge of the cities with low carbon emission efficiency should raise the awareness of science and technology innovation and incorporate science and technology innovation into the strategic planning of urban development. And rely on the “double assistance” mechanism of national technology, funds, actively introduce talents and technology. In contrast, the cities with high carbon emission efficiency should strengthen the investment in R&D, make efforts to adjust the energy structure, fully explore the potential of carbon emission reduction on green productivity and improve the ecological compensation mechanism. Take the northern coastal region as an example, Beijing’s science and technology resources can be poured into cities such as Tianjin and Tangshan to shorten the “rich-poor gap” in technology development between cities and achieve coordinated improvement of regional carbon emission efficiency.
3) Grasp the strength of government intervention.
Cities with high carbon emission efficiency can increase fiscal expenditure, support emerging industries and promote regional urban transformation and upgrading, or intervene in urban development by strengthening governance and promoting environmentally friendly development of regional cities. Cities with low carbon emission efficiency like Yinchuan and Guyuan in northwest China, and Siping and Chaoyang in northeast China can adopt the former for government intervention, increase capital and scientific resources, and use high-tech or new industries to achieve low-carbon green development. In contrast, cities like Shijiazhuang, Hengshui, and Jinan on the northern coast can adopt the latter for government intervention, increase the investment in environmental pollution control, improve the quality of the urban environment, and increase the efficiency of carbon emission to achieve sustainable regional development. However, government intervention needs to grasp the scale. If the intervention is excessive it will affect the free flow of various resources in the city. It cannot realize the effective allocation of resources, which cannot improve the efficiency of carbon emissions and may hinder the green development of the city.
4) Encourage the introduction of high-quality foreign investment.
China’s early development focused on economic development more than environmental harmony, and economic development focused on quantity rather than quality. Hence, the introduction of foreign investment is mostly a highly polluting industy. Although China has gone through the developed countries hundreds of years of industrial development in just a few decades. The resulting environmental problems are difficult to reverse. Since the Third Plenary Session of the 18th Party Central Committee proposed to deepen reform in all aspects, and the 19th Party Congress proposed to establish a sound economic system of green, low-carbon, and cyclic development, “high-quality” development has become the consensus. Therefore, cities with high carbon emission efficiency should take advantage of their own development advantages to attract high-quality foreign investment with high-level opening up. While accelerating the process of high-level opening up, they should form an institutional environment to attract high-quality foreign investment and give full play to the role of foreign investment to achieve mutual benefit and win-win results. Cities with low carbon emission efficiency should clarify their strategic goals, examine their advantages, evaluate external opportunities, and selectively and purposefully choose high-tech, low-pollution projects or industries to complement their strengths and weaknesses. In addition, take active measures to share resources or risks with neighboring regions, realize “mutual benefit” between cities instead of “beggar-my-neighbour,” enhance the autonomy and enthusiasm of cities to develop green, low-carbon economy, and improve regional carbon emission efficiency.
This paper calculates the carbon emission efficiency of 278 prefecture-level cities in China with complete data available and explores the spatial autocorrelation and influencing factors of carbon emission efficiency of each city on the basis of dividing China into eight comprehensive economic zones. Due to the limitations of data and methods the research level of this paper needs to be further deepened, and in future research. There are still some issues that need to be explored further:
First, all countries in the world have not established unified carbon emission efficiency measurement indicators, so the domestic prefecture-level city carbon emission efficiency measurement indicators can be further studied.
Second, this paper only refers to relevant literature to extract some indexes as influencing factors of carbon emission, so it will be important direction to use quantitative methods to extract more scientific and reasonable influencing factor indexes.
Third, due to the difficulty and limitation of data collection, this paper does not cover all prefecture-level cities in China. There are some errors in data analysis and comparative studies between cities. In addition, the current research on carbon emission efficiency is usually limited to domestic perspectives and a few countries. There are still few comparative studies on most countries in the world, and transnational and trans-continental studies are relatively scarce. Therefore, international carbon emission is also one of the future research directions.
The original contributions presented in the study are included in the article/Supplementary Material, further inquiries can be directed to the corresponding authors.
HH and ZW each wrote the section of the manuscript. All authors contributed to data curation, analysis. ZW and QG contributed to manuscript revision. All authors approved the submitted version.
This study is supported by the State Key Laboratory of High-efficiency Utilization of Coal and Green Chemical Engineering (No. 2021-K71).
Author QG was employed by the company China Huaxing Group Co., Ltd.
The remaining authors declare that the research was conducted in the absence of any commercial or financial relationships that could be construed as a potential conflict of interest.
All claims expressed in this article are solely those of the authors and do not necessarily represent those of their affiliated organizations, or those of the publisher, the editors and the reviewers. Any product that may be evaluated in this article, or claim that may be made by its manufacturer, is not guaranteed or endorsed by the publisher.
The Supplementary Material for this article can be found online at: https://www.frontiersin.org/articles/10.3389/fenvs.2023.1119914/full#supplementary-material
Cai, H.D. (2017). Analysis of factors influencing the efficiency of CO2 emissions in China based on RAM-SFA model. Contemporary Economics 26, 86–89.
Du, K.R., and Zou, C.Y. (2011). Regional disparity, affecting factors and convergence analysis of carbon dioxide emission efficiency in China: On stochastic frontier model and panel unit root. Zhejiang Social Sciences 11, 32–156.
Fan, J.S., and Zhou, L. (2019). The mechanism and effect of urbanization and real estate investment on carbon emissions in China. Scientia Geographica Sinica 04, 644–653. doi:10.13249/j.cnki.sgs.2019.04.014
Fu, Y.P., Ma, S.C., and Song, Q. (2015). Spatial econometric analysis of regional carbon intensity. Statistical Research 06, 67–73.
Guo, B. N., and Lin, J. (2017). Research on efficiency of carbon emissions in Yangtze River Delta based on the SBM—undesirable model. Journal of Industrial Technological Economics 01, 108–115.
Guo, L., and Zou, M.Y. (2020). Research on Influencing Factors of Carbon Intensity from the Perspective of Spatial Spillover. Ecological Economy 09, 32–37.
Hao, H.J (2017). Fiscal Expenditures, Spatial Spillover Effect and Services Growth: The Analysis of Spatial Durbin Model Based on Central City Data. Journal of Shanghai University of Finance and Economics 19 (04), 79–92. doi:10.16538/j.cnki.jsufe.2017.04.007
Hu, J.L., and Kao, C.H. (2007). Efficient energy-saving targets for APEC economies. Energy Policy 35 (26), 373–382. doi:10.1016/j.enpol.2005.11.032
James, P L, and Kelly, P R (2009). Introduction to Spatial Econometrics. Boca Raton, US: CRC Press Taylor and Francis Group.
Kaoru, T. (2001). A slacks-based measure of efficiency in data envelopment analysis. Eur. J. Oper. Res. 130 (3), 498–509. doi:10.1016/s0377-2217(99)00407-5
Kaoru, T. (2002). A slacks-based measure of super-efficiency in data envelopment analysis. Eur. J. Oper. Res. 143 (1), 32–41. doi:10.1016/s0377-2217(01)00324-1
Li, G. Z., and Zhu, H. L. (2022). Research on the Performance of Industrial Carbon Emission in the Yangtze River Economic Belt Based on Three-stage SM-DEA-Malmquist. Operations Research and Management Science 06, 161–167.
Li, J. P., Huang, X. J., Chuai, X. W., and Sun, S.C. (2020). Spatio-temporal characteristics and influencing factors of carbon emissions efficiency in the Yangtze River Delta region. Resources and Environment in the Yangtze Basin 07, 1486–1496.
Liu, C. Q., Li, L., and Wei, P. (2017). Capital stock measurement in prefecture-level and above cities in China. Urban Problems 10, 67–72.
Liu, J. J., Shi, D., and Wang, C. (2015). A study on spatial spillover and correlation effect of carbon emissions across 30 provinces in China. Journal of Natural Resources 30 (08), 1289–1303.
Ma, D.L. (2015). The spatial econometric study on China's regional carbon emission efficiency and its influencing factors. Doctoral dissertation (Chongqing, China: Chongqing University).
Meng, M., Fu, Y. N., Wang, T. Y., and Jing, K. Q. (2017). Analysis of low-carbon economy efficiency of Chinese industrial sectors based on a RAM Model with undesirable outputs. Sustainability 9 (3), 451–451. doi:10.3390/su9030451
Ning, L. C., Zheng, W., and Zeng, L. (2021). Research on China’s carbon dioxide emissions efficiency from 2007 to 2016: Based on two stage super efficiency SBM model and Tobit model. Acta Scientiarum Naturalium Universitatis Pekinensis 57 (01), 181–188.
Otavio, M, and José, G (1999). Communication the evolution of the “carbonization index” in developing countries. Energy Policy 27 (5), 307–308. doi:10.1016/s0301-4215(99)00018-x
Shang, M., Wang, R. R., and Hu, Z. (2022). Study on spatial and temporal evolution and driving mechanism of carbon emissions from provincial energy consumption in China - the analysis based on the perspective of environmental regulation. Environmental Pollution and Control 04, 529–534+551. doi:10.15985/j.cnki.1001-3865.2022.04.020
Shi, K.F. (2017). A Multiscale Analysis on Spatiotemporal Pattern of Carbon Emissions and Its Impact Factors in China Using DMSP-OLS Data. Doctoral dissertation (Shanghai, China: East China Normal University).
Song, J.K., Liang, L.L., Niu, D.P., Cao, Z.J., and Zhang, K.X. (2018). Evaluation, influencing factors and promotion countermeasures of cities’ carbon emissions efficiencies in Shandong province. Journal of China University of Petroleum (Edition of Social Sciences) 01, 15–21.
Su, Y.X., Chen, X.Z., Ye, Y.Y., Wu, Q. T., Zhang, H.O., Huang, N.S., and Kuang, Y. Q. (2013). The characteristics and mechanisms of carbon emissions from energy consumption in China using DMSP/OLS night light imageries. Acta Geographica Sinica 11, 1513–1526.
Sun, J.W. (2005). The decrease of CO2 emission intensity is decarbonization at national and global levels. Energy Policy 33 (8), 975–978. doi:10.1016/j.enpol.2003.10.023
The People's Daily (2020). Proposal of the Central Committee of the Communist Party of China on Formulating the Fourteenth Five-Year Plan for National Economic and Social Development and the Visionary Goals for 2035. Beijing: The People's Daily, 001.
Wang, Q., Hu, F., Song, L., and Dai, Y. S. (2021a). Study on carbon emission efficiency of Hunan Province based on DEA model. Environmental Protection and Circular Economy 01, 15–19.
Wang, Q. Y., and Li, H. Y. (2022). Measuring Regional Efficiency of Energy and Carbon Dioxide Emission in China Based on Uncertain Environmental DEA Model. Soft Science 08, 78–83. doi:10.13956/j.ss.1001-8409.2022.08.11
Wang, S. J., Fang, C. L., and Wang, Y. (2016). Spatiotemporal variations of energy-related CO2 emissions in China and its influencing factors: An empirical analysis based on provincial panel data. Renewable and Sustainable Energy Reviews 55 (C), 505–515. doi:10.1016/j.rser.2015.10.140
Wang, S. J., Gao, S., Huang, Y. Y., and &Shi, C. Y. (2020). Spatio-temporal evolution and trend prediction of urban carbon emission performance in China based on super-efficiency SBM. Model. Acta Geographica Sinica 06, 1316–1330.
Wang, S. J., Xie, Z.H., and Wang, Z.H. (2021b). The spatiotemporal pattern evolution and influencing factors of CO2 emissions at the county level of China. Acta Geographica Sinica 12, 3103–3118.
Wang, Z. F., and Du, Y. Y. (2019). Spatial-temporal Differences and Influencing Factors of Carbon Emission Efficiency in Hunan Province Based on SBM-DEA Model. Scientia Geographica Sinica 05, 797–806. doi:10.13249/j.cnki.sgs.2019.05.011
Wei, X. (2019). Analysis of factors affecting carbon emissions in China - An empirical study based on vector error correction model. The World of Survey and Research 03, 60–65.
Wu, J.S, Niu, Y., Peng, J., Wang, Z., and Huang, X. L. (2014). Research on energy consumption dynamic among prefecture-level cities in China based on DMSP/OLS Nighttime Light. Geographical Research 04, 625–634.
Xiang, J. (2011). The estimation of the Chinese cities' fixed capital stock. Master's dissertation (Changsha, China: Hunan University).
Xu, Y. Q., Cheng, Y., Wang, J. J., and Liu, N. (2022). Spatio-temporal evolution and influencing factors of carbon emission efficiency in low carbon city of China. Journal of Natural Resources 37 (05), 1261–1276. doi:10.31497/zrzyxb.20220511
Yin, Y. G., and Chang, X. D. (2021). Scientific and technological innovation, industrial structure upgrading and regional carbon emission intensity: An empirical analysis based on spatial econometric model. Finance and Economy 12, 40–51. doi:10.19622/j.cnki.cn36-1005/f.2021.12.005
Yu, S.W., Hu, X., Fan, J.L., and Cheng, J.H. (2018). Convergence of carbon emissions intensity across Chinese industrial sectors. Journal of Cleaner Production 194, 179–192. doi:10.1016/j.jclepro.2018.05.121
Zhang, C.Q., and Chen, P.Y. (2022). Applying the three-stage SBM-DEA model to evaluate energy efficiency and impact factors in RCEP countries. Energy 241, 122917. doi:10.1016/j.energy.2021.122917
Zhang, M.D., and Xi, S.J. (2023). Evaluation of carbon emission efficiency of resource-based cities and its policy enlightenment. Journal of Natural Resources 38 (01), 220–237. doi:10.31497/zrzyxb.20230114
Zhang, Y.G. (2009). Structural decomposition analysis of sources of decarbonizing economic development in China. Ecological Economics 68 (8), 2399–2405. doi:10.1016/j.ecolecon.2009.03.014
Zhang, Y.G. (2010). Economic development pattern change impact on China’s carbon intensity. Economic Research Journal 04, 120–133.
Zhao, H., and Chen, Y. M. (2013). Research on Relationship Between Urbanization Process and Carbon Emission Reduction in China. China Soft Science 03, 184–192.
Zhao, H.R. (2019). Research on Evolution Characteristics and its Influencing Factors of China's Provincial Carbon Emission Efficiency. Master’s dissertation (Beijing, China: North China Electric Power University).
Zhou, P., Ang, B.W., and Han, J.Y. (2010). Total factor carbon emission performance: A Malmquist index analysis. Energy Econ. 32 (1), 194–201. doi:10.1016/j.eneco.2009.10.003
Zhu, S.Y., Liao, L.Y., Wu, J. A., Chang, H. G., and Wang, H. (2022). Urban Passenger Transportation Mode Carbon Emission Efficiency Difference: A Case Study of Xiangyang City. Journal of Transportation Systems Engineering and Information Technology 04, 158–166. doi:10.16097/j.cnki.1009-6744.2022.04.018
Zofio, J.L., and Prieto Angel, M. (2001). Environmental efficiency and regulatory standards: the case of CO2 emissions from OECD industries. Resour. Energy Econ. 23 (1), 63–83. doi:10.1016/s0928-7655(00)00030-0
Keywords: carbon emission efficiency, super-efficient SBM model, spatial autocorrelation, spatial durbin model, environment
Citation: Huang H, Wei Z, Ge Q and Guo Q (2023) Analysis of spatial-temporal evolution and influencing factors of carbon emission efficiency in Chinese cities. Front. Environ. Sci. 11:1119914. doi: 10.3389/fenvs.2023.1119914
Received: 09 December 2022; Accepted: 24 February 2023;
Published: 08 March 2023.
Edited by:
Gul Jabeen, Harbin Institute of Technology, ChinaReviewed by:
Xiaoyun Du, Zhengzhou University, ChinaCopyright © 2023 Huang, Wei, Ge and Guo. This is an open-access article distributed under the terms of the Creative Commons Attribution License (CC BY). The use, distribution or reproduction in other forums is permitted, provided the original author(s) and the copyright owner(s) are credited and that the original publication in this journal is cited, in accordance with accepted academic practice. No use, distribution or reproduction is permitted which does not comply with these terms.
*Correspondence: Zhaoxi Wei, d2VpNDUzNzI2MDE2QDE2My5jb20=; Qingru Ge, a3VhbmdkYTIwMjJAMTYzLmNvbQ==
Disclaimer: All claims expressed in this article are solely those of the authors and do not necessarily represent those of their affiliated organizations, or those of the publisher, the editors and the reviewers. Any product that may be evaluated in this article or claim that may be made by its manufacturer is not guaranteed or endorsed by the publisher.
Research integrity at Frontiers
Learn more about the work of our research integrity team to safeguard the quality of each article we publish.