 Xiaochun Zhao
 Mei Jiang
 Ying Zhou*
- School of Management, Anhui University, Hefei, China
Evaluating the impact of the digital economy on carbon emission intensity has great significance in promoting sustainable development. Based on the panel data of 30 provinces in China from 2013 to 2019, the level of the digital economy is estimated by using entropy weight and the Technique for Order Preference by Similarity to Ideal Solution (TOPSIS) model. The panel vector auto-regressive (PVAR) model is used to analyze the impact of the digital economy on carbon emission intensity. The results show that, first, the comprehensive development level of the digital economy in China is not high, and it tends to rise slowly from 0.208 in 2013 to 0.221 in 2019. Second, the carbon emission intensity of China shows a downward trend from 0.720 in 2013 to 0.607 in 2019. There are significant differences in carbon emission intensity among different regions, and a decreasing trend is seen from the western region to the eastern region. Third, there is a long-term equilibrium relationship between the digital economy and carbon emission intensity. Fourth, the digital economy has a long-term negative effect on carbon emission intensity, but carbon emission intensity has no negative effect on the digital economy. According to the research conclusion, this study puts forward some suggestions.
1 Introduction
Since the reform and opening up in 1978, China’s economy has developed rapidly. In 2010, China’s economy jumped to the second place in the world for the first time (Hou et al., 2021). Although China has made some progress in economic development, the economic development of China mainly relies on fossil fuel consumption. According to the data from the China Energy Statistical Yearbook (2021), the total energy consumption of China was 4.5 billion tons of standard coal in 2020, and the total coal consumption accounted for 62.2%. China’s long-term coal-based energy consumption structure has caused serious environmental problems (Zhong et al., 2022). However, with the development of the 5G network, e-commerce, artificial intelligence, and other technologies, the global economy has entered the digital age, and the digital economy has gradually penetrated various fields, such as society and ecology. The digital economy has shown strong carbon emission reduction potential, which has become an important way to alleviate environmental pressure (Yin et al., 2022). In 2021, the scale of the digital economy accounted for 39.8% of China’s GDP, ranking second in the world (Yang W et al., 2022). With the huge dividends released by the digital economy, China’s economy has gradually changed from extensive development to green and low-carbon development (Zhang et al., 2022). Theoretically, the digital economy is the main engine of high-quality economic development (Li, 2019; Yin and Yu, 2022). The digital economy has a great impact on people’s production and life, but there is little research on the relationship between the digital economy and carbon emission intensity. Can digital economy help to curb carbon emissions? Answering this question has practical significance for promoting economic development and reducing carbon intensity. Therefore, based on the provincial panel data of China, this study uses the panel vector auto-regressive (PVAR) model to analyze the relationship between the digital economy and carbon emission. Compared with the existing literature, the contributions of this study are as follows: First, the determination of evaluation indicators is more scientific, and this paper constructs the index system of the digital economy level based on the input and output dimensions. Second, the research perspective of this paper is more comprehensive, and this paper uses the PVAR model to analyze the relationship between the digital economy and carbon emission intensity.
The arrangement of this paper is as follows: The second part is a literature review, which includes the related literature on the digital economy and carbon emission. The third part is the research design, including introducing the research methods and data sources. The fourth part is the research results, which analyze the level of the digital economy in China, the carbon emission intensity, and the relationship between them. The fifth part is the conclusion, which summarizes this research and puts forward suggestions based on the research findings of this paper.
2 Literature review
Research on the digital economy can be traced back to the late 1990s, when economist Don Tapscott first proposed the concept of “digital economy,” pointing out that digital technology can produce new economic forms (Ma and Zhu, 2022). Subsequently, many countries accelerated the formulation of development strategies for the digital economy and actively promoted the development of a digital economy based on information networks and data resources (Sorescu and Schreier, 2021). With the emergence of the new generation of digital technologies, the digital economy not only accelerates the upgrading of the traditional industrial structure but also accelerates the process of digital governance (Sama et al., 2022). Compared with the rapid development of the digital economy, the research on how to measure the development level of the digital economy lags behind. Therefore, academia began to research the index construction and measure the development level of the digital economy (Liu, 2022). Li and Liu (2021), based on the cross-sectional data of eight comprehensive economic zones in China in 2018, evaluated the digital economic level from the aspects of digital infrastructure, digital industry development, and digital application, and found that the development level of the digital economy in China was low. Furthermore, some scholars used the analytic hierarchy process (AHP), an entropy method to calculate the level of the digital economy in China, and found that the digital economy in China was on the rise, and the main influencing factors included the construction of digital infrastructure and the application of digital technology (Yang and He, 2022). Considering the regional differences in the development of the digital economy, Shi (2022) used the Theil index to analyze the differences in the digital economy in seven regions of China and found the differences in the digital economy among regions were obvious, and the overall trend was on the rise.
In the field of carbon emissions, the academia mainly focuses on how to measure carbon emission measurement, influencing factors of carbon emission, spatial characteristics, and carbon emission reduction paths, and the research objects are provinces, city clusters, and high energy consumption industries. There are many pieces of research measuring carbon emission, carbon emission intensity, and carbon emission efficiency (Cai et al., 2019; Cary, 2020). Through analysis of the influencing factors of carbon emissions, it is found that the factors that promote carbon emissions include the level of industrialization (Wang and Ma, 2018), economic income (Han et al., 2022), energy consumption (Vujović et al., 2018), etc., while the factors that inhibit carbon emissions include activity intensity (Wang et al., 2018), technological input (Wen et al., 2020), environmental regulations (Zhang et al., 2021), etc. Considering the spatial distribution characteristics of carbon emissions, Su et al. (2018) found the regional differences in urban carbon emissions in China showed a downward trend. Yu et al. (2022a) took the Yangtze River Delta region as the research area, used a spatial correlation network model to analyze the spatial correlations of land-use carbon emissions, and found that land-use carbon emissions in the Yangtze River Delta had a spatial correlation and spillover effects. In addition, it is important to reduce the carbon emissions of the construction industry (Dong et al., 2023). Buildings are considered the last mile toward the carbon-neutral century, and studying the decarbonization potential of commercial building operations has become another mainstream topic (Probst et al., 2021; Xiang et al., 2022).
In terms of the relationship between the digital economy and carbon emissions, there are two different opinions about the relationship between the digital economy and carbon emissions. Some scholars believe the digital economy can curb carbon emissions (Yu et al., 2022b). With the development of the digital economy, more and more cities are implementing the concept of low-carbon development because the digital economy encourages the development of digital inclusive finance and green innovative technologies (Ma et al., 2022a; Zheng and Li, 2022). However, the effect of the digital economy on emission reduction is significantly different in different regions. The effect of the digital economy on emission reduction in eastern China is more prominent than in central China and western China (Yi et al., 2022). In addition, the spatial spillover effect of the digital economy on carbon emissions has also become a hot issue in academia. Improving the development level of the digital economy has a significant impact on the reduction of carbon emissions in neighboring areas (Zhou et al., 2022). Other scholars believe the development of the digital economy contributes to the increase in carbon emissions (Avom et al., 2020). The digital economy accelerated China’s import trade, resulting in an increase in consumer demand, which amplified consumption-based carbon emissions (Ma et al., 2022b). Liu et al. (2022) found the increase in information and communication technology can increase carbon emissions. In addition, some scholars found the impact of the digital economy on carbon emissions presents an inverted U-shaped non-linear relationship (Yang Z et al., 2022), which accords with the hypothesis of the environmental Kuznets curve (EKC) (Li et al., 2021).
To sum up, academia has made great achievements in the research of digital economy and carbon emissions, but there are still some research gaps in this field. First, there are many studies on designing digital economic indicators from the perspective of input, but there are few studies on measuring the level of the digital economy from the perspective of input and output. Second, few pieces of literature used the PVAR model to analyze the interactive relationship between the digital economy and carbon emission intensity. The PVAR model not only follows the advantages of the VAR (vector auto-regressive) model but also effectively solves the endogenous and individual heterogeneity problems and accurately reflects the influence of one variable and its lag term on other variables in the model (Dai et al., 2022). Therefore, based on the panel data of 30 provinces in China from 2013 to 2019, this paper first uses the entropy weight–TOPSIS method to evaluate the level of the digital economy in China, then calculates the carbon emission intensity based on the carbon emission coefficient method, and finally, uses the PVAR model to explore the relationship between the digital economy and carbon emission intensity.
3 Research methods and variable description
3.1 Research methods
3.1.1 Entropy–TOPSIS model
In this paper, the entropy weight method and TOPSIS model are combined to evaluate the level of the digital economy in China. The main idea is to standardize the processing of index data, then use the entropy weight method to determine the index weight, and finally use the TOPSIS model to determine the ranking of the digital economy level (Deng et al., 2020; Li S et al., 2022). The process of the entropy–TOPSIS method is as follows (see Figure 1).
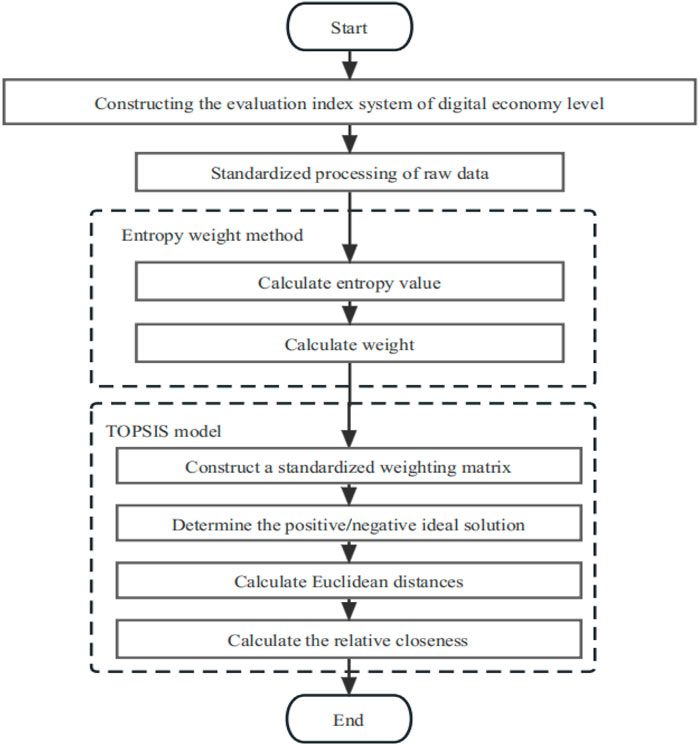
FIGURE 1. Entropy–TOPSIS model.
Step 1. Standardization of raw data.
In Formulas 1 and 2, xjn represents the sample value of the n-th index in the j-th object, M(xjn) is the maximum value of the sample values, and m(xjn) is the minimum value of the sample values.
Step 2. Calculating the index weight.
In Formulas 3 and 4, Hn represents the entropy value of each index, and wn represents the weight of each index.
Step 3. Calculating the Euclidean distance and relative closeness.First, we construct a standardized weighting matrix Q.
Second, we determine the positive ideal solution Q+ and negative ideal solution Q-.
Third, we calculate the Euclidean distances D+ and D-.
Fourth, we calculate the relative closeness P.
3.1.2 Panel vector auto-regressive model
This study chose the PVAR and Gaussian mixture model (GMM) methods to analyze the relationship between the digital economy level and carbon emission intensity. The PVAR model not only follows the advantages of the vector auto-regressive (VAR) model but also effectively solves the endogenous and individual heterogeneity problems and accurately reflects the influence of one variable and its lag term on other variables in the model (Dai et al., 2022). The formula is as follows:
In Formula (11), Zit is an endogenous variable, including digital economy level (CE) and carbon emission intensity (CO2). β0 represents the intercept term, j represents the lag order, fi represents the individual effect, gt represents the time effect, and hit represents the random error term.
3.2 Variable description and data sources
3.2.1 Digital economy level
Ding et al. (2021) pointed out that the digital economy is the economic output brought by the digital input. Combined with China’s digital economy development report, this study designs two criteria layers of input and output. Furthermore, it is subdivided into four first-level indicators, the digital input is represented by digital infrastructure and digital innovation elements, and the digital output is represented by digital industry and industrial digitalization (see Table 1). Referring to the research of Li and Wang (2022), digital infrastructure includes telephone penetration rate, the number of internet broadband access ports, and the number of domain names. Referring to the research of Zhao et al. (2022a), innovative elements include the number of scientific research and experimental development (R&D) personnel, the proportion of R&D funds to gross domestic product (GDP), etc. Referring to the research of Wang and Shi (2021), the digital industry refers to software business income and telecom industry income, and industrial digitalization refers to the number of websites owned by every hundred enterprises and e-commerce sales. The data of this paper comes from China Statistical Yearbook (2014–2020), and some missing data are filled in by interpolation.
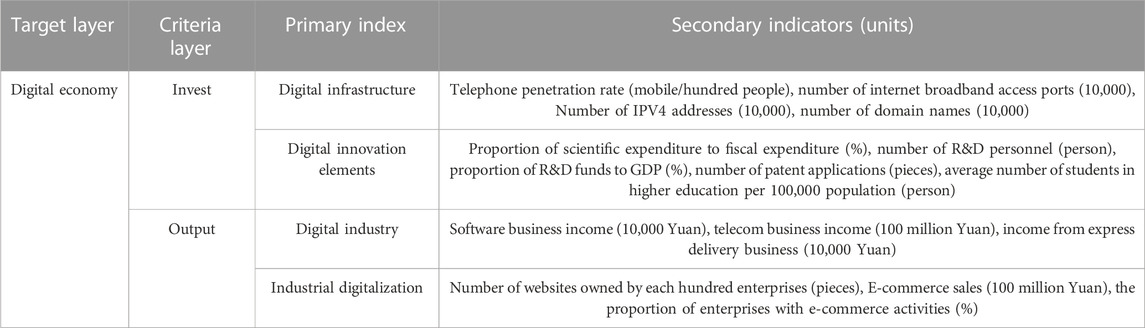
TABLE 1. Digital economic index system.
3.2.2 Carbon emission intensity
Carbon emission intensity is measured by the proportion of carbon emissions to GDP (gross domestic product). The specific formula is as follows:
In Formula(12), referring to the research of Zhao et al. (2022b), this paper selects the eight kinds of carbon sources, such as coal and natural gas, to calculate the carbon emission (Ci) in combination with the carbon emission coefficient. The formula is as follows:
In Formula (13), Ei represents the energy consumption, αi represents the carbon emission coefficient, and μi represents the standard coal conversion coefficient. The data comes from China Energy Statistics Yearbook (2014–2020), and some missing data are filled in by interpolation.
4 Results and discussion
4.1 Comprehensive evaluation of the development level of digital economy
The entropy weight–TOPSIS method is used to evaluate the level of the digital economy. The specific results are shown in Table 2.
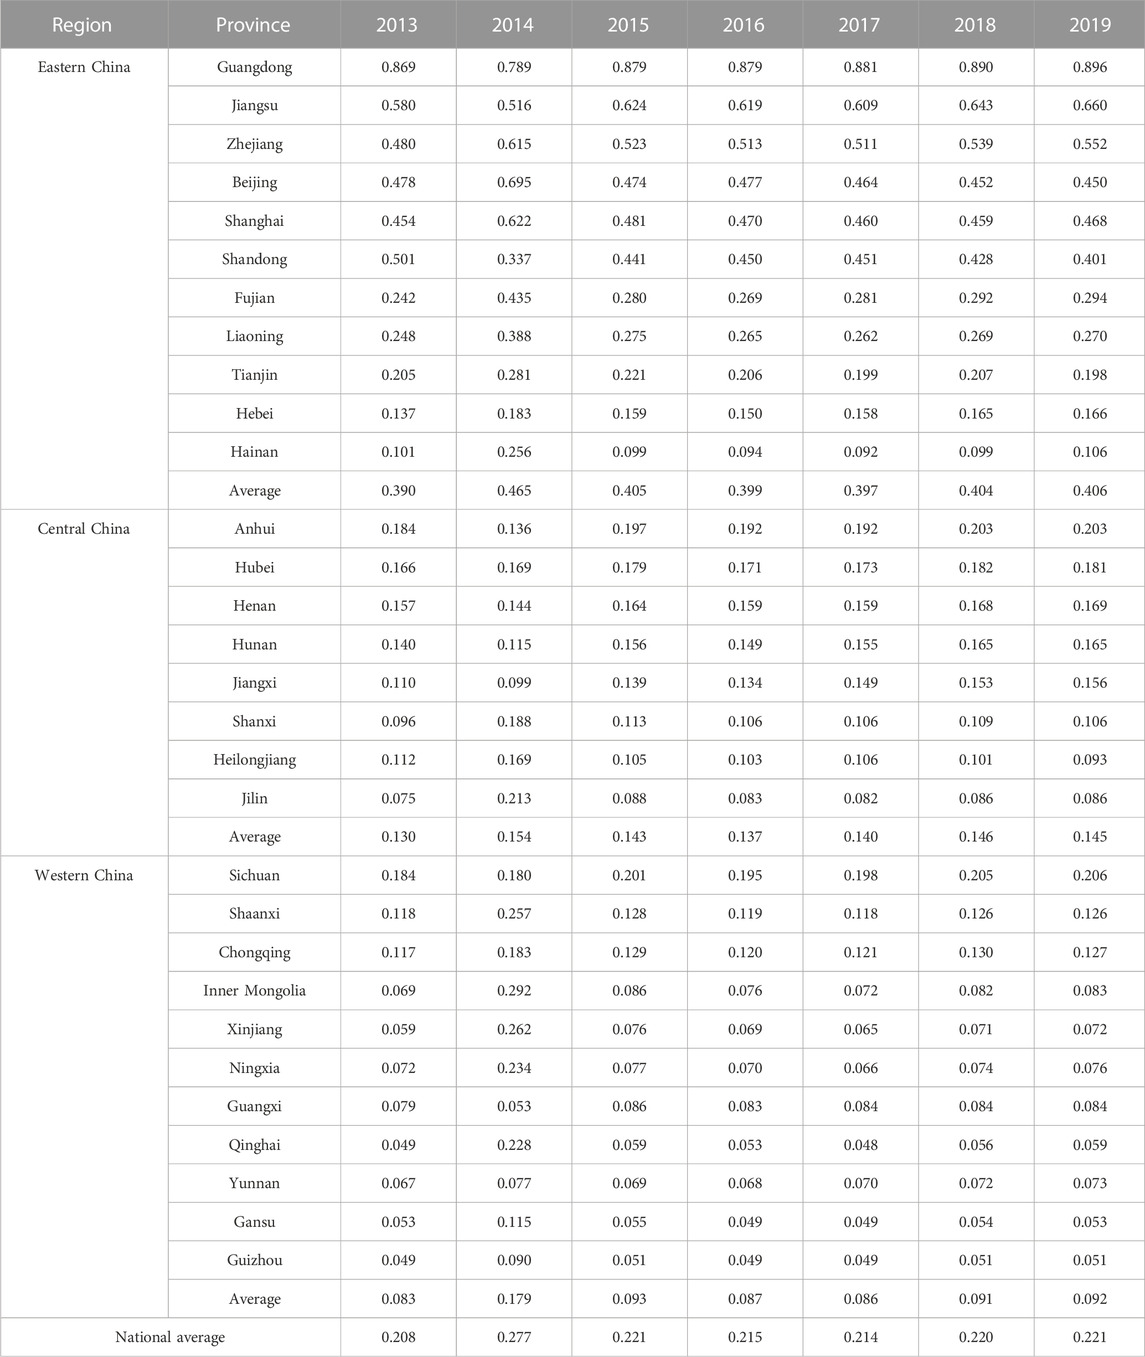
TABLE 2. Development level of the digital economy in China from 2013 to 2019.
As can be seen from Table 2, the level of the digital economy in China increased from 0.208 in 2013 to 0.221 in 2019, with an increase of 6.25%, indicating the level of the digital economy is slowly rising. Specifically, the level of the digital economy rose sharply from 2013 to 2014, reached 0.277 in 2014, then showed a downward trend from 2014 to 2017, and slowly rose from 2017 to 2019. In addition, there are significant differences in the level of the digital economy in China, which is consistent with the research of Xu et al. (2021). In 2019, the average value of the digital economy was 0.221 in China, 0.406 in eastern China, 0.145 in central China, and 0.092 in western China. The level of the digital economy in eastern China is higher than the national average, while that in central China and western China is significantly lower than the national average, which shows the development among regions is unbalanced, and the level of the digital economy decreases from the eastern region to western region. It is because the eastern region has a superior geographical location and a good economic and talent base, which creates conditions for technological innovation. However, the economic development level in central China and western China is low, which leads to a weak foundation of digital economy development and a slow growth rate. Second, Guangdong Province in eastern China ranked first in digital economy level, and Hainan Province ranked 19th, which is far behind other provinces in eastern China. The average values of the digital economy in Xinjiang, Ningxia, Guangxi, Qinghai, Yunnan, Gansu, and Guizhou in the western region are below 0.1, and while Sichuan ranks 10th, Sichuan’s digital economy is growing faster than other provinces in the western region. As can be seen from Table 2, there are great differences in the development of digital economy in different provinces.
4.2 Measurement of carbon emission intensity
Based on the carbon emission coefficient method, this study evaluates the carbon emission intensity of different provinces in China from 2013 to 2019, and the results are shown in Table 3.
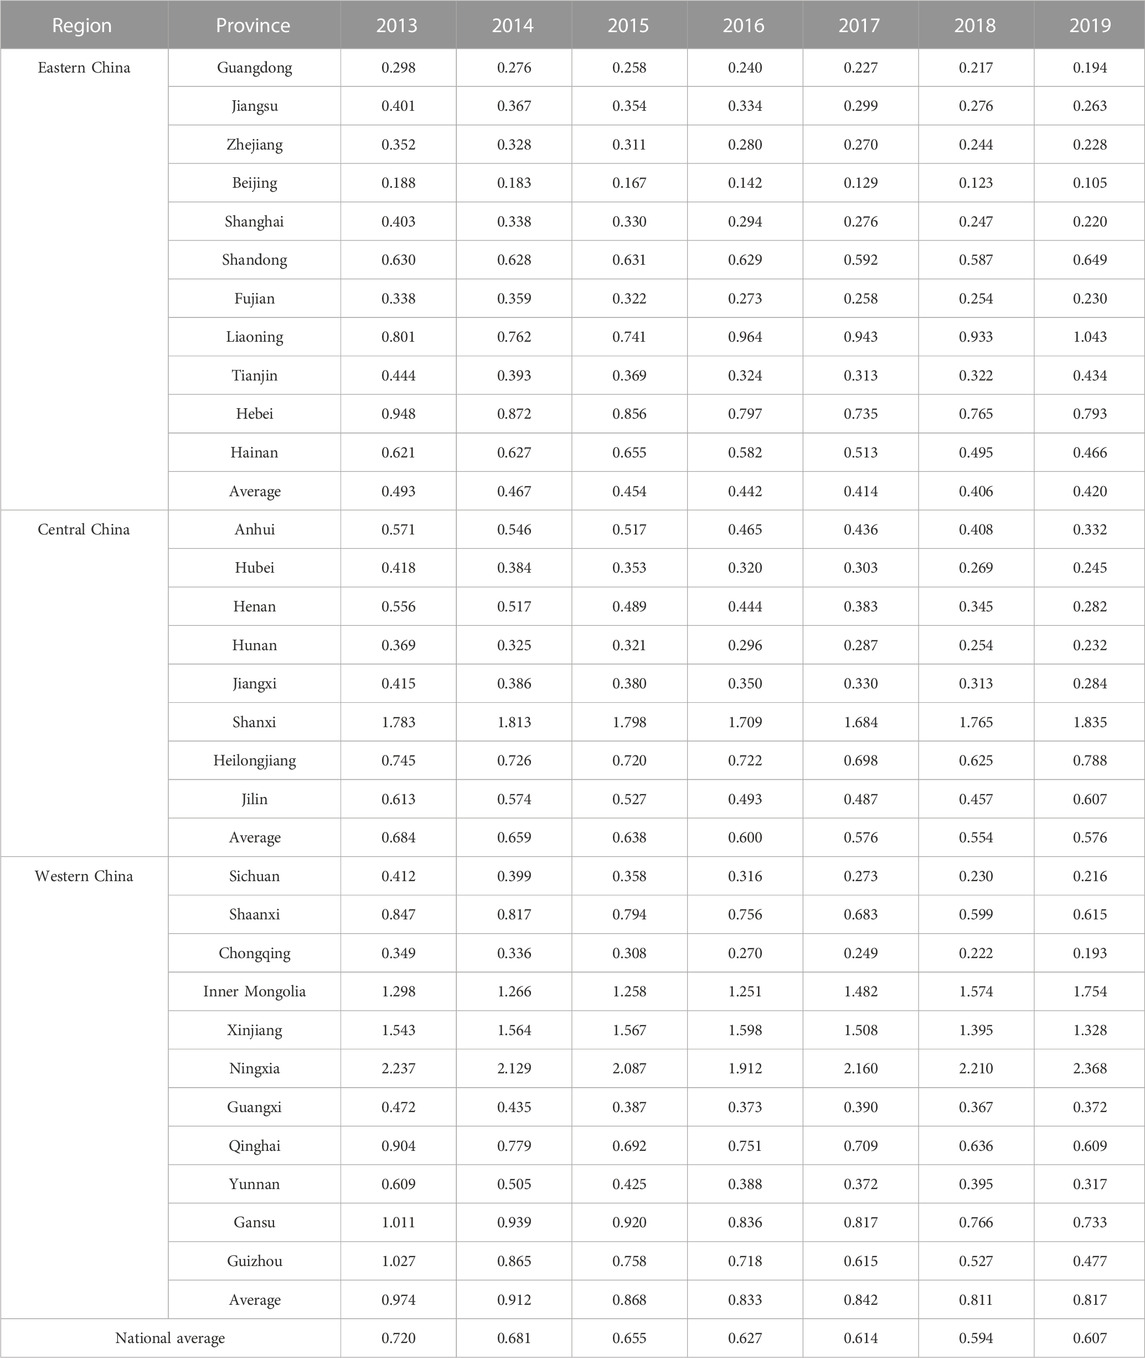
TABLE 3. Carbon emission intensity in China from 2013 to 2019.
As can be seen from Table 3, China’s carbon emission intensity shows a downward trend, with the carbon emission intensity decreasing from 0.720 in 2013 to 0.607 in 2019. This is consistent with the research conclusion by Wang and Zheng (2021). It is worth noting that the carbon intensity levels of Shanxi and Ningxia in 2013 and 2019 were at high levels. The reasons are as follows: First, Shanxi and Ningxia have great responsibilities in safeguarding national energy, so the coal development intensity is high, but the economic level is low, and the growth rate is slow, resulting in the high carbon intensity. Second, it is difficult to transform the energy consumption structure and the industrial structure. The carbon emission intensity of Inner Mongolia increased from 1.298 in 2013 to 1.754 in 2019, an increase of 35.13%. According to the resource curse theory (Wu et al., 2021), Inner Mongolia is constrained by a heavy industrial structure, which has the development dilemma of high energy consumption and low output value. In addition, the preferential electricity price policy in Inner Mongolia has also promoted the transfer of high energy-consuming industries, resulting in the carbon intensity of Inner Mongolia rising instead of falling. In addition, the carbon emission intensity of China has a discrepancy, showing a decreasing trend from western China to eastern China. This is because a series of projects, such as power transmission from western China to eastern China and gas transmission from western China to eastern China, have been started after the western development, and the rapid economic development in western China has caused air pollution. Because the projects have the characteristics of a long cycle and large scale, it is difficult to reduce the carbon emission intensity in western China.
4.3 The relationship between digital economy and carbon emission intensity
4.3.1 Unit root test
To ensure the accuracy of this paper and avoid false regression caused by unstable variables (Duan et al., 2022), this paper uses the unit root test, including the Levin–Lin–Chu test (LLC), different root Im–Pesaran–Shin test (IPS), and short panel Harris–Tzavalis test (HT). The results show that the LLC, IPS, and HT tests of the digital economy level (lnCE) all reject the original hypothesis at a 1% significance level. In other words, the original sequence is stable, and the unit root test is passed. The original sequence of carbon emission intensity (lnCO2) failed the IPS and HT tests. This means the original sequence has a unit root. The results in Table 4 show that the digital economy and the carbon emission intensity that the first-order difference data have passed LLC, IPS, and HT tests. It indicates that the two variables are first-order single integration, which can be used for the co-integration test.
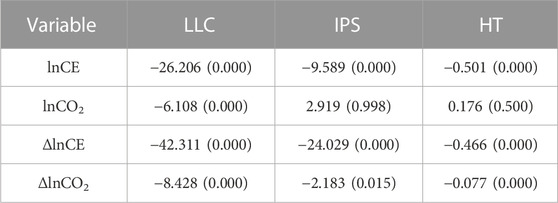
TABLE 4. Unit root test.
4.3.2 Co-integration test
Based on the single integration of the same order, the co-integration test is used to further analyze whether there is a long-term co-integration relationship between variables (Li Z et al., 2022). This paper used the Pedroni and Kao tests to test the co-integration relationship between the digital economy and carbon emission intensity. The original assumption is that there is no co-integration relationship between variables. The results in Table 5 show that the Pedroni and Kao tests reject the original hypothesis at 1% significance level. In other words, there is a long-term equilibrium relationship between digital economy level and carbon emission intensity, and the PVAR model can be used.
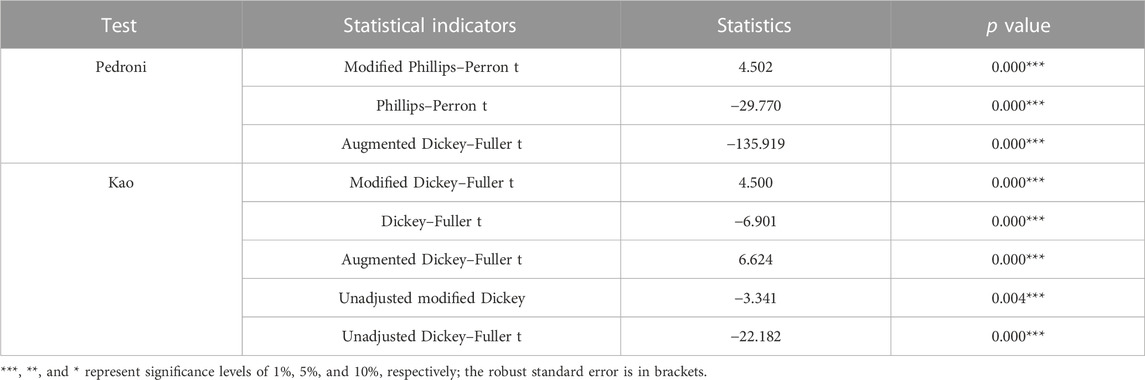
TABLE 5. Co-integration test.
4.3.3 Optimal lag order test
Before using the PVAR model, it is necessary to discriminate the optimal lag order of variables. Among them, the optimal lag order is determined according to the minimum value of AIC (Akaike information criterion), BIC (Bayesian information criterion), and HQIC (Hannan–Quinn information criterion) (Yuan et al., 2022). The results in Table 6 show that the optimal lag order selected by BIC is first order and the optimal lag order selected by AIC and HQIC is second order. According to the majority vote principle, the optimal lag period of the model is determined to be second order.
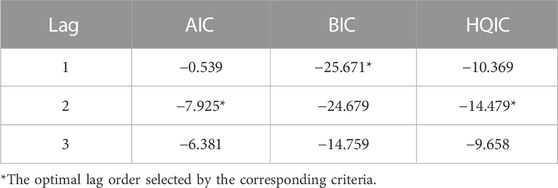
TABLE 6. Test results of optimal lag order.
4.3.4 GMM estimation based on the PVAR model
GMM is used to estimate the parameters of digital economy level (lnCE) and carbon emission intensity (lnCO2), and the estimated results are shown in Table 7. Column (1) is the regression result which takes the digital economy level as the explained variable. The result shows that the coefficient between carbon emission intensity lagging by two periods and the digital economy level is negative, but it fails to pass the significance level test, which indicates that the effect of carbon emission intensity on the digital economy level is not strong in the short term. Column (2) is the regression result which takes carbon emission intensity as the explained variable. The result shows that the digital economy level lagging by two periods has a significant inhibitory effect on carbon emission intensity, indicating that the higher the digital economy level the lower the carbon emission intensity. This is because the digital economy is driving the economy from factor-driven to innovation-driven, which not only helps to optimize the industrial structure, but also helps to improve energy efficiency. This transformation stimulates the high-quality development of the economy and reduces carbon emission intensity. It is consistent with the research of Wang et al. (2022a). In other words, the digital economy has a significant negative effect on carbon emissions. The difference between the research of Wang et al. (2022b) and this study is that this paper considers endogenous variables and uses the PVAR model to analyze the two-way interactive relationship between the digital economy and carbon emissions, deepening the relevant research results.
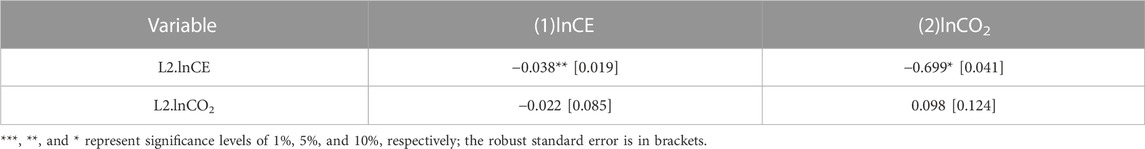
TABLE 7. GMM parameter estimation results.
4.3.5 Impulse response analysis
To analyze the impact changes between digital economy level and carbon emission intensity, the impulse response function is used for dynamic analysis. Referring to Wang et al. (2022a), the number of sample periods set by the model is 10. Combined with the Monte Carlo method, the number of repetitions of data simulation is 500, and the impulse response function results are shown in Figure 2. In Figure 2, the horizontal axis indicates the number of lag periods, the vertical axis indicates the degree of the impulse response, the upper and lower dashed lines indicate the upper and lower bounds of the 95% confidence interval, and the solid line in the middle indicates the impulse response value of the response variable after being impacted by a standard deviation unit.
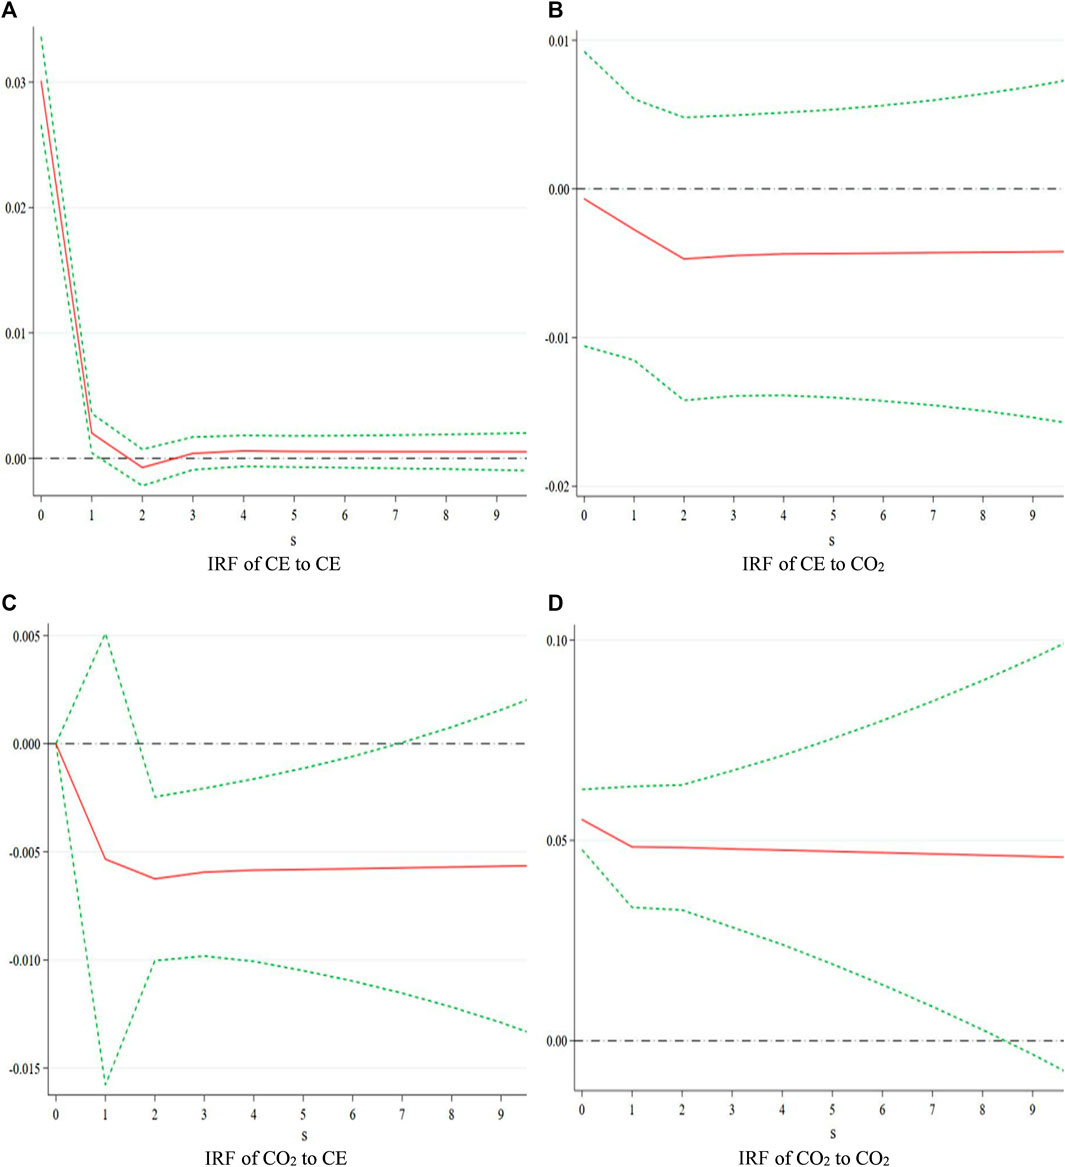
FIGURE 2. Impulse response function. (A) IRF of CE to CE, (B) IRF of CE to CO2, (C) IRF of CO2 to CE, (D) IRF of CO2 to CO2.
As can be seen from Figure 2A, the level of the digital economy has a positive response to itself, reaching the maximum value in the current period and showing a downward trend as a whole. In the second period, the maximum negative response is reached, and it begins to show an upward trend. In the third period, it rises to zero. It shows that the level of the digital economy is strengthened by itself and has a long-term promoting effect. As can be seen from Figure 2B, the impact of the digital economy on carbon emission intensity is negative and gradually becomes stable. Specifically, the level of the digital economy has a negative impact on carbon emission intensity from the current period, reaching the maximum negative impact in the second period. However, the overall trend rises and is kept stable below zero level. It shows that the improvement of the digital economy can inhibit carbon emission intensity. On the whole, in the short term, the digital economy plays a prominent role in restraining carbon emission intensity, while in the long term, the impact of the digital economy on carbon emission intensity has a certain time lag, which indicates the impact of the digital economy on carbon emission intensity is more lasting and far-reaching. Existing studies have shown that the digital economy promotes green economic development. For example, Song et al. (2022) found that the development of the digital economy can improve urban air quality. Kong and Li (2022) found that the development of the digital economy is helpful in improving the efficiency of a green economy. This study discusses the relationship between the digital economy and carbon intensity and finds digital economy contributes to the reduction of carbon intensity, expanding related research. Figure 2C shows a downward trend after the impact of carbon emission intensity on the digital economy level and tends to be stable after the third period, indicating carbon emission intensity has a long-term inhibitory effect on the digital economy level. Figure 2D shows that after the impact of one standard deviation of carbon emission intensity, its effect begins to decline and gradually becomes stable after reaching the maximum value in the current period, which indicates carbon emission intensity has a significant promoting effect on itself.
4.3.6 Variance decomposition
In this paper, variance decomposition is utilized to analyze the contribution of various structural impulses to the fluctuation of the digital economy level and carbon emission intensity. The results are shown in Table 8.
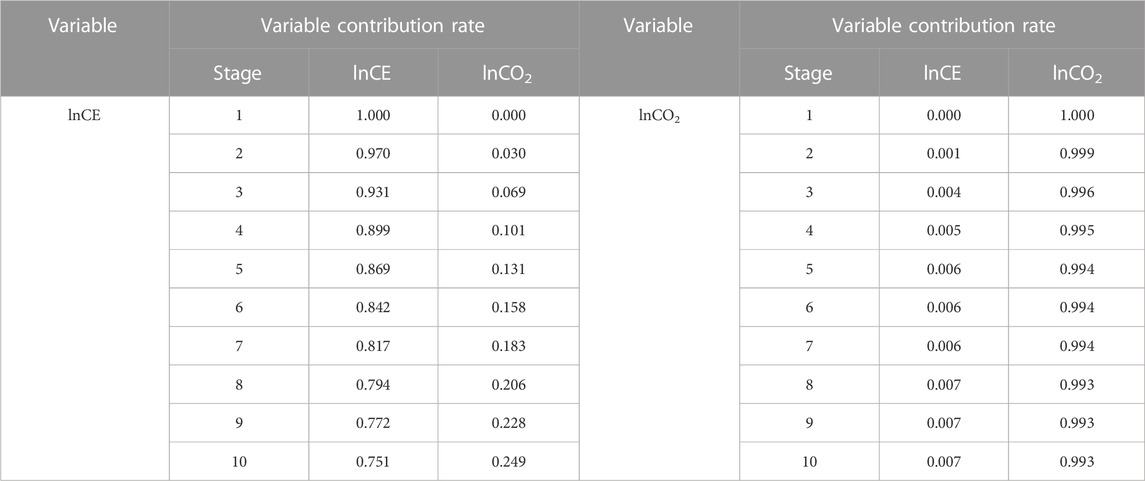
TABLE 8. Variance decomposition.
As can be seen from Table 8, in terms of lnCE (digital economy level), the contribution of lnCE to itself reaches 75.1% in period 10, while the variance contribution of lnCO2(carbon emission intensity) is 24.9%. It can be seen that the contribution rate of lnCE mainly comes from itself and lnCO2. In terms of lnCO2, the variance contribution of lnCO2 to itself is higher in period 10, which is more than 99% stable, while the contribution rate of lnCE to lnCO2 is lower in period 10, which is less than 1% stable. It indicates that the self-strengthening ability of lnCO2 is stronger. From the results of variance decomposition, we can see that the variance contribution rate of the digital economy and carbon emission intensity mainly comes from its own strengthening. In the long run, the impact of carbon emission intensity on the level of the digital economy has been strengthened over time.
5 Conclusion
Based on the data from 30 provinces in China from 2013 to 2019, this study analyzes the impact of digital economy development on carbon emission intensity. The research findings are as follows: 1) The development level of digital economy development in China is not high but has a slow upward trend. The development level of the digital economy in China has significant differences in different provinces. Specifically, the development level of the digital economy is decreasing from eastern China to western China. This indicates that while accelerating the development of the digital economy, China needs to pay attention to the regional differences in the digital economy. 2) China’s carbon emission intensity has declined, and the regional differences are significant. Specifically, the carbon emission intensity in eastern China is the lowest, followed by central China, and highest in western China. 3) Through the co-integration test, there is a long-term equilibrium relationship between the digital economy and carbon emission intensity. In addition, the optimal lag period of the model is 2. The GMM estimation results based on the PVAR model show the digital economy lagging behind two periods and significantly inhibiting carbon emission intensity. 4) From impulse response analysis, the digital economy has a long-term inhibitory effect on carbon emission intensity. This shows the digital economy has a certain climate improvement effect, and promoting the development of the digital economy can reduce the carbon emission intensity.
Based on the research findings, the following suggestions are put forward:
1) We should strengthen the construction of digital infrastructure such as internet broadband, 5G base stations, and artificial intelligence and, at the same time, actively apply digital technology to change resource waste. 2) China should strengthen the input of digital innovation elements. On the one hand, the government should rationally arrange financial expenditure and improve the coverage and innovation of information technology to empower the rapid development of the digital economy. On the other hand, high-quality digital talents should be cultivated to enhance the application ability of information technology and to provide a talent guarantee for the improvement of the digital economy. 3) We should steadily promote the development of industrial digitalization and intensify the development of the digital industry. In terms of industrial digitalization, enterprises need to penetrate internet technology into every link of production and operation to create a new format of enterprise development. In terms of the digital industry, the current development level is low, and the speed is slow. Therefore, the government needs to increase the support of innovation policies to create a good business environment for the development of the digital industry. 4) Cooperation should be strengthened and digital economy policies should be issued in line with regional characteristics. The eastern region should increase investment in information technology innovation capability, and the central and western regions should increase investment in digital infrastructure and digital innovation elements, thus helping the high-quality development of the digital economy.
This study analyzes the relationship between the digital economy and carbon emissions of 30 provinces in China, but there are still some shortcomings. First, there are significant differences in the digital economy level and carbon emission intensity in different regions of China, so it is a future research direction to study the relationship between the digital economy level and carbon emission intensity in different regions. Second, the factors related to the two variables of the digital economy level and carbon emission intensity are diverse and complex. In the future, other influencing factors should also be considered to further improve the research conclusions. Third, the study period of this paper is only 7 years, which can be appropriately increased in the future.
Data availability statement
The raw data supporting the conclusion of this article will be made available by the authors, without undue reservation.
Author contributions
XZ and MJ drafted the manuscript. YZ conceptualized and designed the study. XZ contributed to materials and analysis. YZ contributed to the theories and revised the manuscript. All authors read and agreed to the published version of the manuscript.
Funding
This work was supported by the project “Research on Evaluation and Improvement of Archival Data Management Ability under the Background of Data Governance” (No. 22BTQ089).
Conflict of interest
The authors declare that the research was conducted in the absence of any commercial or financial relationships that could be construed as a potential conflict of interest.
Publisher’s note
All claims expressed in this article are solely those of the authors and do not necessarily represent those of their affiliated organizations, or those of the publisher, the editors, and the reviewers. Any product that may be evaluated in this article, or claim that may be made by its manufacturer, is not guaranteed or endorsed by the publisher.
References
Avom, D., Nkengfack, H., Fotio, H. K., and Totouom, A. (2020). ICT and environmental quality in Sub-Saharan Africa: Effects and transmission channels. Technol. Forecast. Soc. Change 155, 120028. doi:10.1016/j.techfore.2020.120028
Cai, B., Guo, H., Ma, Z., Wang, Z., Dhakal, S., and Cao, L. (2019). Benchmarking carbon emissions efficiency in Chinese cities: A comparative study based on high-resolution gridded data. Appl. energy 242, 994–1009. doi:10.1016/j.apenergy.2019.03.146
Cary, M. (2020). Molecules of inefficiency: How tariffs impact carbon intensities, carbon dioxide emissions, and the environment. Sci. Total Environ. 713, 136531. doi:10.1016/j.scitotenv.2020.136531
Dai, S., Wang, Y., and Zhang, W. (2022). The impact relationships between scientific and technological innovation, industrial structure advancement and carbon footprints in China based on the PVAR model. Int. J. Environ. Res. Public Health 19 (15), 9513. doi:10.3390/ijerph19159513
Deng, X., Liu, Y., and Xiong, Y. (2020). Analysis on the development of digital economy in Guangdong province based on improved entropy method and multivariate statistical analysis. Entropy 22 (12), 1441. doi:10.3390/e22121441
Ding, Y., Zhang, H., and Tang, S. (2021). How does the digital economy affect the domestic value-added rate of Chinese exports? J. Glob. Inf. Manag. (JGIM) 29 (5), 71–85. doi:10.4018/JGIM.20210901.oa5
Dong, T., Yin, S., and Zhang, N. (2023). New energy-driven construction industry: Digital green innovation investment project selection of photovoltaic building materials enterprises using an integrated fuzzy decision approach. Systems 11, 11. doi:10.3390/systems11010011
Duan, X., Tang, M., and Zhang, K. (2022). How to evaluate the efficiency of green economy and its regional differences: Evidence from China. Discrete Dyn. Nat. Soc. 2022, 1–9. doi:10.1155/2022/4902406
Han, R., Li, L., Zhang, X., Lu, Z., and Zhu, S. (2022). Spatial-temporal evolution characteristics and decoupling analysis of influencing factors of China’s aviation carbon emissions. Chin. Geogr. Sci. 32 (2), 218–236. doi:10.1007/s11769-021-1247-z
Hou, F., Su, H., Li, Y., Qian, W., Xiao, J., and Guo, S. (2021). The impact of foreign direct investment on China’s carbon emissions. Sustainability 13 (21), 11911. doi:10.3390/su132111911
Kong, L., and Li, J. (2022). Digital economy development and green economic efficiency: Evidence from province-level empirical data in China. Sustainability 15 (1), 3. doi:10.3390/su15010003
Li, Q. (2019). Regional technological innovation and green economic efficiency based on DEA model and fuzzy evaluation. J. Intelligent Fuzzy Syst. 37 (5), 6415–6425. doi:10.3233/JIFS-179220
Li, X., Liu, J., and Ni, P. (2021). The impact of the digital economy on CO2 emissions: A theoretical and empirical analysis. Sustainability 13 (13), 7267. doi:10.3390/su13137267
Li S, S., Yan, J., Pei, Q., Sha, J., and Liu, F. (2022). Dynamic relationship between water resources and new urbanization based on a vector autoregressive model: A case study of Hebei province, China. Front. Environ. Sci. 10, 941726. doi:10.3389/fenvs.2022.941726
Li Z, Z., Luo, Z., Wang, Y., Fan, G., and Zhang, J. (2022). Suitability evaluation system for the shallow geothermal energy implementation in region by Entropy Weight Method and TOPSIS method. Renew. Energy 184, 564–576. doi:10.1016/j.renene.2021.11.112
Li, Z., and Liu, Y. (2021). Research on the spatial distribution pattern and influencing factors of digital economy development in China. IEEE Access 9, 63094–63106. doi:10.1109/ACCESS.2021.3075249
Li, Z., and Wang, J. (2022). The dynamic impact of digital economy on carbon emission reduction: Evidence city-level empirical data in China. J. Clean. Prod. 351, 131570. doi:10.1016/j.jclepro.2022.131570
Liu, T. C. (2022). Digital policy in European countries from the perspective of the digital economy and society index. Policy and Internet 14 (1), 202–218. doi:10.1002/poi3.274
Liu, W., Khan, H., Khan, I., and Han, L. (2022). The impact of information and communication technology, financial development, and energy consumption on carbon dioxide emission: Evidence from the Belt and Road countries. Environ. Sci. Pollut. Res. 29 (19), 27703–27718. doi:10.1007/s11356-021-18448-5
Ma, D., and Zhu, Q. (2022). Innovation in emerging economies: Research on the digital economy driving high-quality green development. J. Bus. Res. 145, 801–813. doi:10.1016/j.jbusres.2022.03.041
Ma, Q., Khan, Z., Tariq, M., Işik, H., and Rjoub, H. (2022a). Sustainable digital economy and trade adjusted carbon emissions: Evidence from China’s provincial data. Econ. Research-Ekonomska Istraz. 35 (1), 5469–5485. doi:10.1080/1331677X.2022.2028179
Ma, Q., Tariq, M., Mahmood, H., and Khan, Z. (2022b). The nexus between digital economy and carbon dioxide emissions in China: The moderating role of investments in research and development. Technol. Soc. 68, 101910. doi:10.1016/j.techsoc.2022.101910
Probst, B., Touboul, S., Glachant, M., and Dechezleprêtre, A. (2021). Global trends in the invention and diffusion of climate change mitigation technologies. Nat. Energy 6 (11), 1077–1086. doi:10.1038/s41560-021-00931-5
Sama, L. M., Stefanidis, A., and Casselman, R. M. (2022). Rethinking corporate governance in the digital economy: The role of stewardship. Bus. Horizons 65 (5), 535–546. doi:10.1016/j.bushor.2021.08.001
Shi, X. (2022). Comprehensive evaluation method of digital economy development level based on complex network model. Comput. Intell. Neurosci. 2022, 1–8. doi:10.1155/2022/4999178
Song, B., Shi, H., Wang, M., and Gu, R. (2022). The research on the effect of digital economy development on urban air quality. Front. Environ. Sci. 10, 1771. doi:10.3389/fenvs.2022.993353
Sorescu, A., and Schreier, M. (2021). Innovation in the digital economy: A broader view of its scope, antecedents, and consequences. J. Acad. Mark. Sci. 49 (4), 627–631. doi:10.1007/s11747-021-00793-z
Su, W., Liu, Y., Wang, S., Zhao, Y., Su, Y., and Li, S. (2018). Regional inequality, spatial spillover effects, and the factors influencing city-level energy-related carbon emissions in China. J. Geogr. Sci. 28 (4), 495–513. doi:10.1007/s11442-018-1486-9
Vujović, T., Petković, Z., Pavlović, M., and Jović, S. (2018). Economic growth based in carbon dioxide emission intensity. Phys. A Stat. Mech. its Appl. 506, 179–185. doi:10.1016/j.physa.2018.04.074
Wang, B., Sun, Y., Chen, Q., and Wang, Z. (2018). Determinants analysis of carbon dioxide emissions in passenger and freight transportation sectors in China. Struct. Change Econ. Dyn. 47, 127–132. doi:10.1016/j.strueco.2018.08.003
Wang, J., Dong, K., Dong, X., and Taghizadeh-Hesary, F. (2022a). Assessing the digital economy and its carbon-mitigation effects: The case of China. Energy Econ. 113, 106198. doi:10.1016/j.eneco.2022.106198
Wang, J., Rickman, D. S., and Yu, Y. (2022b). Dynamics between global value chain participation, CO2 emissions, and economic growth: Evidence from a panel vector autoregression model. Energy Econ. 109, 105965. doi:10.1016/j.eneco.2022.105965
Wang, S., and Ma, Y. (2018). Influencing factors and regional discrepancies of the efficiency of carbon dioxide emissions in Jiangsu, China. Ecol. Indic. 90, 460–468. doi:10.1016/j.ecolind.2018.03.033
Wang, Y., and Zheng, Y. (2021). Spatial effects of carbon emission intensity and regional development in China. Environ. Sci. Pollut. Res. 28 (11), 14131–14143. doi:10.1007/s11356-020-11557-7
Wang, Z., and Shi, P. (2021). Research and analysis on the index system of digital economy in Anhui province. Complexity 2021, 1–8. doi:10.1155/2021/5535864
Wen, Q., Chen, Y., Hong, J., Chen, Y., Ni, D., and Shen, Q. (2020). Spillover effect of technological innovation on CO2 emissions in China's construction industry. Build. Environ. 171, 106653. doi:10.1016/j.buildenv.2020.106653
Wu, L., Sun, L., Qi, P., Ren, X., and Sun, X. (2021). Energy endowment, industrial structure upgrading, and CO2 emissions in China: Revisiting resource curse in the context of carbon emissions. Resour. Policy 74, 102329. doi:10.1016/j.resourpol.2021.102329
Xiang, X., Ma, M., Ma, X., Chen, L., Cai, W., Feng, W., et al. (2022). Historical decarbonization of global commercial building operations in the 21st century. Appl. Energy 322, 119401. doi:10.1016/j.apenergy.2022.119401
Xu, A., Qian, F., Pai, C. H., Yu, N., and Zhou, P. (2021). The impact of COVID-19 epidemic on the development of the digital economy of China—based on the data of 31 provinces in China. Front. Public Health 9, 778671. doi:10.3389/fpubh.2021.778671
Yang, S., and He, J. (2022). Analysis of digital economy development based on AHP-Entropy weight method. J. Sensors 2022, 1–8. doi:10.1155/2022/7642682
Yang W, W., Chen, Q., Guo, Q., and Huang, X. (2022). Towards sustainable development: How digitalization, technological innovation, and green economic development interact with each other. Int. J. Environ. Res. Public Health 19 (19), 12273. doi:10.3390/ijerph191912273
Yang Z, Z., Gao, W., Han, Q., Qi, L., Cui, Y., and Chen, Y. (2022). Digitalization and carbon emissions: How does digital city construction affect China's carbon emission reduction? Sustain. Cities Soc. 87, 104201. doi:10.1016/j.scs.2022.104201
Yi, M., Liu, Y., Sheng, M. S., and Wen, L. (2022). Effects of digital economy on carbon emission reduction: New evidence from China. Energy Policy 171, 113271. doi:10.1016/j.enpol.2022.113271
Yin, S., and Yu, Y. (2022). An adoption-implementation framework of digital green knowledge to improve the performance of digital green innovation practices for industry 5.0. J. Clean. Prod. 363, 132608. doi:10.1016/j.jclepro.2022.132608
Yin, S., Zhang, N., Ullah, K., and Gao, S. (2022). Enhancing digital innovation for the sustainable transformation of manufacturing industry: A pressure-state-response system framework to perceptions of digital green innovation and its performance for green and intelligent manufacturing. Systems 10 (3), 72. doi:10.3390/systems10030072
Yu, Z., Chen, L., Tong, H., Chen, L., Zhang, T., Li, L., et al. (2022a). Spatial correlations of land-use carbon emissions in the Yangtze River Delta region: A perspective from social network analysis. Ecol. Indic. 142, 109147. doi:10.1016/j.ecolind.2022.109147
Yu, Z., Liu, S., and Zhu, Z. (2022b). Has the digital economy reduced carbon emissions?: Analysis based on panel data of 278 cities in China. Int. J. Environ. Res. Public Health 19 (18), 11814. doi:10.3390/ijerph191811814
Zhang, L., Wang, Q., and Zhang, M. (2021). Environmental regulation and CO2 emissions: Based on strategic interaction of environmental governance. Ecol. Complex. 45, 100893. doi:10.1016/j.ecocom.2020.100893
Zhang, Z., Fu, W. K., and Ma, L. (2022). The impact of digital economy on green development in China. Front. Environ. Sci. 10, 991278. doi:10.3389/fenvs.2022.991278
Zhao, X., Dong, Y., and Gong, X. (2022a). The digital economy and carbon productivity: Evidence at China’s city level. Sustainability 14 (17), 10642. doi:10.3390/su141710642
Zhao, X., Xu, H. X., and Sun, Q. (2022b). Research on China’s carbon emission efficiency and its regional differences. Sustainability 14 (15), 9731. doi:10.3390/su14159731
Zheng, H., and Li, X. (2022). The impact of digital financial inclusion on carbon dioxide emissions: Empirical evidence from Chinese provinces data. Energy Rep. 8, 9431–9440. doi:10.1016/j.egyr.2022.07.050
Zhong, S., Shen, H., Niu, Z., Yu, Y., Pan, L., Fan, Y., et al. (2022). Moving towards environmental sustainability: Can digital economy reduce environmental degradation in China? Int. J. Environ. Res. Public Health 19 (23), 15540. doi:10.3390/ijerph192315540
Keywords: digital economy level, carbon emission intensity, entropy weight method, TOPSIS model, PVAR model
Citation: Zhao X, Jiang M and Zhou Y (2023) The impact of the digital economy on carbon emission intensity: Evidence from China. Front. Environ. Sci. 11:1119246. doi: 10.3389/fenvs.2023.1119246
Received: 08 December 2022; Accepted: 07 February 2023;
Published: 23 February 2023.
Edited by:
Shi Yin, Hebei Agricultural University, ChinaReviewed by:
Elchin Suleymanov, Baku Enginering University, AzerbaijanMinda Ma, Lawrence Berkeley National Laboratory, United States
Yang Yu, Hainan University, China
Copyright © 2023 Zhao, Jiang and Zhou. This is an open-access article distributed under the terms of the Creative Commons Attribution License (CC BY). The use, distribution or reproduction in other forums is permitted, provided the original author(s) and the copyright owner(s) are credited and that the original publication in this journal is cited, in accordance with accepted academic practice. No use, distribution or reproduction is permitted which does not comply with these terms.
*Correspondence: Ying Zhou, eWluZ3pob3U5N0AxMjYuY29t