 Jianfeng Li
 Biao Peng
 Siqi Liu1,4
 Huping Ye
 Zhuoying Zhang
- 1Technology Innovation Center for Land Engineering and Human Settlements, Shaanxi Land Engineering Construction Group Co., Ltd. and Xi'an Jiaotong University, Xi’an, China
- 2State Key Laboratory of Resources and Environmental Information System, Institute of Geographic Sciences and Natural Resources Research, Chinese Academy of Sciences, Beijing, China
- 3State Key Laboratory of Tibetan Plateau Earth System, Environment and Resources (TPESER), Institute of Tibetan Plateau Research, Chinese Academy of Sciences, Beijing, China
- 4Institute of Land Engineering and Technology, Shaanxi Provincial Land Engineering Construction Group Co., Ltd., Xi’an, China
- 5Academy of Mathematics and Systems Science, Chinese Academy of Sciences, Beijing, China
- 6College of Science, Tibet University, Tibet, China
Urban fringes are of great significance to urban development as connecting hubs between urban and rural areas. However, there are many problems in urban fringes, including disorderly spatial layout, waste of social resources, and low quality of human settlements. Rapid and accurate identification of urban fringes has important practical significance for optimizing urban spatial layout, controlling urban unlimited expansion, and protecting land resources. Given the lack of suitable and high-quality fringe extraction models for small- and medium-sized urban areas, this study was based on Gaofen-2 (GF-2) imagery, Suomi National Polar-orbiting Partnership Visible Infrared Imager Radiometer Suite (NPP-VIIRS) imagery, point of interest (POI) data, and WorldPop data, taking the landscape disorder degree, POI kernel density, and night light intensity as urban feature factors and constructing a fringe extraction model of small- and medium-sized urban areas (FEM-SMU). Taking Hantai District in China as the study area, the results of the model were compared to the landscape disorder degree threshold method and POI kernel density breakpoint analysis method, while the generality of the model was further tested in Shangzhou and Hanbin Districts. The results show that the FEM-SMU model has evident improvements over the conventional methods in terms of accuracy, detail, and integrity, and has higher versatility, which can better meet the research needs of small- and medium-sized urban fringes.
1 Introduction
Since the reform and opening up, China has experienced unprecedented growth of urbanization and completed the great transformation from a country dominated by an agricultural population to an urban population (Chen et al., 2018; Feng et al., 2019). Rapid urbanization not only promotes the implementation of urban-rural integration development strategies, but also provides unprecedented development opportunities for urban fringes (Whitehand and Gu, 2017; Liu et al., 2018). The urban fringe is a region located at the outer boundaries of a city and serves as a transition zone between urban and rural areas, encompassing suburban developments and rural lands undergoing urbanization (Simon et al., 2004). As the connecting hub between urban and rural areas, urban fringes are the areas with the fastest change in land use and spatial structure in the process of urban expansion, with the characteristics of diversity, dynamics, and transition (Seto et al., 2010; Gant et al., 2011; Wadduwage et al., 2017). However, many problems have arisen in the urban fringe during the process of urbanization in China, including disorderly spatial layout, deterioration of ecological environment, waste of land resources and so on (Zhao and Zhang, 2018; Ahani and Dadashpoor, 2021; Lyu et al., 2022). Rapid and accurate identification of urban fringes is of great practical significance for optimizing urban spatial layout, protecting land resources, and promoting urban and rural integration.
With the development of remote sensing (RS) and geographic information system (GIS) technology in recent years, the recognition of the urban fringe has broken through the early empiricism of fuzzy definition and gradually changed into a scientism of accurate identification (Peng et al., 2016; Wadduwage et al., 2017; Wang Y. et al., 2021). Most existing studies constructed index systems using elements closely relevant to urban development to identify the urban fringe through mathematical models (Chang et al., 2018; Wang Y. et al., 2021; Dong et al., 2022). The identification methods of urban fringe mainly include the urban-rural gradient view, threshold, mutation/breakpoint analysis methods, and so on (Peng et al., 2014; van Vliet et al., 2019; Yang et al., 2021). The urban-rural gradient view method mainly identifies the urban fringe according to the spatial gradient changes in regional land use, socioeconomic status, and population density (van Vliet et al., 2019). It is generally well accepted that the gradient change of land use can determine the difference in landscape structure between urban and rural areas and reduce the subjectivity of land use variability measurements (Warren et al., 2011; Wadduwage et al., 2017). Moreover, the gradient changes in the social economy and population density can well reflect the differences between urban and rural areas (Vizzari and Sigura, 2015). However, the urban-rural gradient view method has difficulty in overcoming the subjectivity in determining the dividing point in areas with a scattered landscape structure (Peng et al., 2016; Sharaf El Din, 2020). As an alternative, the threshold method determines the urban fringe according to the threshold range of indicators such as distance from the built-up area, population density, building proportion, and information entropy (Imhoff et al., 2010; Peng et al., 2016; Yang et al., 2017). The threshold method is simple and practical, but the determination of the threshold usually requires repeated experiments, which has some problems, such as low efficiency, discontinuous results, and poor universality (Gao et al., 2014; Peng et al., 2014; Yang et al., 2017). As the current mainstream option, the mutation/break point analysis method is used to determine the urban fringe by calculating the mutation/break values of single or comprehensive indexes such as night light intensity, the impervious surface index, and the landscape disorder degree in different directions through the model (Peng et al., 2016; Yang et al., 2017; Peng et al., 2018; Yang et al., 2021).
At present, research on the identification of urban fringe is mainly focused on larger cities (Peng et al., 2014; Peng et al., 2016; Cai et al., 2017; Yang et al., 2017; Yang et al., 2021), while the extraction model suitable for small- or medium-sized urban fringes is rare. The fringes of large cities have higher population density and more economic activities, while the fringes of small and medium-sized cities are more remote and rural (Long et al., 2022). At the same time, the fringes of small- and medium-sized urban areas are smaller, and the spatial resolution of available data related to urban development (economy, population, lighting images, etc.) is lower. The existing models designed for large cities are difficult to accurately identify the fringes of small- and medium-sized urban. In recent years, the rapid development of 3 S (i.e., GIS, RS, and global positioning system (GPS)) technology has resulted in a large amount of urban spatial data, including POI data, GPS data, and population migration data (Li et al., 2019; Fang et al., 2020; Tu et al., 2020). These spatial data can reflect the activity law of residents and the spatial characteristics of the city, which is conducive to urban fringe studies. At the same time, high-resolution RS satellite images such as GF and Systeme Probatoire d'Observation dela Tarre (SPOT) improve the richness of obtaining surface spatial information (Su, 2019; Tong et al., 2020). This study was based on GF-2 imagery, NPP-VIIRS imagery, POI data, and WorldPop data, taking the landscape disorder degree, POI kernel density, and night light intensity as urban feature factors, and proposing an accurate fringe extraction model for small and medium-sized urban areas, hereafter FEM-SMU.
2 Materials and methods
2.1 Study area
The study area of this study is Hantai District which is located in the center of the Hanzhong Basin in the southwest of Shaanxi Province in China, with the Hanjiang River to the south and the Qinling Mountains to the north. The terrain of Hantai District is high in the north and low in the south, and the north belongs to the Qinling Mountains, with an elevation of 700–2000 m, accounting for 34% of the total area; the central part is a hilly area, with an elevation of 541–700 m, accounting for 28% of the total area; and the south is the Hanjiang alluvial plain, accounting for 38% of the total area (Wang L. et al., 2021). Hantai District is the largest commodity distribution center in southern Shaanxi and the core area of the Qinling and Bashan mountains, which has important economic and ecological value. Since the urban construction in Hantai District is mainly concentrated in the south, the study area is composed of the administrative boundaries of nine towns in the south (Figure 1).
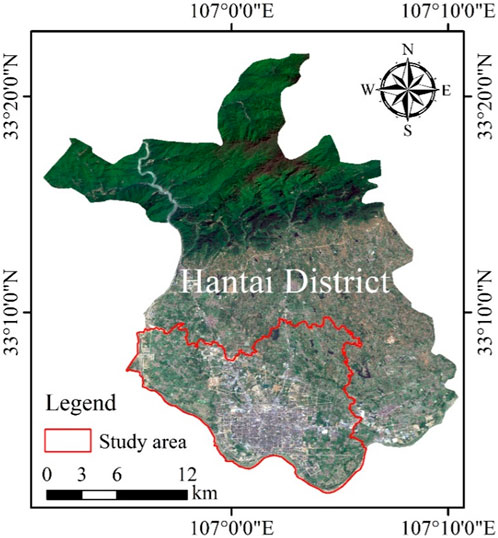
FIGURE 1. Location of the study area.
2.2 Data
This study utilized five types of data: GF-2 imagery, NPP-VIIRS imagery, POI data, WorldPop data, and administrative boundaries. The GF-2 satellite is the first civil optical RS satellite with a spatial resolution better than 1 m independently developed by China, which achieves sub-meter spatial resolution and multi-spectral comprehensive RS data acquisition (Zhou et al., 2021). It has the characteristics of high positioning accuracy, high spatial resolution, and high time resolution. Four GF-2 images covering the study area in July 2020 were used.
The data of POI comprises geographical objects that can be abstracted as points, especially some geographical entities closely related to people’s lives (Wenhao and Tinghua, 2015). In this study, the POI map data was divided into 18 service categories: automobile, motorcycle, catering, shopping, life, sports and leisure, healthcare, accommodation, scenic spots, commercial residences, government institutions and social organizations, science and education, transportation facilities, financial and insurance, company enterprises, road ancillary facilities, place name address information, and public facilities. Given road ancillary facilities and place names usually represent non-substantive information, such as road section identification, administrative place names, natural place names, and traffic place names, they were not selected.
The NPP-VIIRS data were obtained from the National Geophysical Data Center (NGDC) of the United States and were detected by the Suomi NPP satellite with a visible infrared imaging radiation instrument (Shi et al., 2014). The monthly data of lighting products in July 2020 were selected with a spatial resolution of 500 m.
The WorldPop project, hosted by the Department of Geography and the Institute of New Pathogens at the University of Florida, aims to provide spatial population data sets for Central and South America, Africa, and Asia to support development, disaster response, and health applications (Tatem, 2017). Table 1 lists the specific information of all the data used in this study.
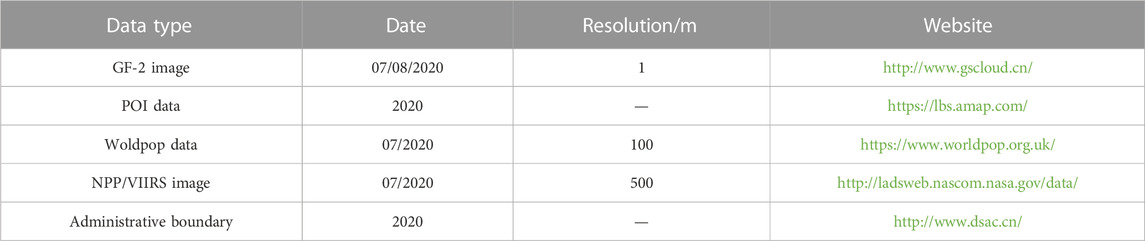
TABLE 1. The specific information of data.
2.3 Object-oriented support vector machines (SVM) classification method
SVM is a classification algorithm based on the VC dimension theory of statistical learning theory and the structural risk minimization principle (Cortes and Vapnik, 1995). Compared with traditional classification ideas based on neural networks or statistics, SVM controls the complexity of the model through the number of vectors and does not need to reduce the feature variables through dimensionality reduction processing to control the complexity of the model (Thaseen and Kumar, 2017). Therefore, in the classification process, the SVM classifier will not lose the feature information of ground objects and reduces the occurrences of some over-fitting phenomena.
The basic principle of SVM is to transform the original feature vector into a high-dimensional feature space and to solve the optimal classification hyperplane in a high-dimensional space. The classification accuracy depends on the distance between the hyperplane and the boundary plane on both sides of the hyperplane. The larger the distance, the higher the accuracy of the classifier and the smaller the error. Given a sample set (
The classification of land use belongs to the linear inseparable problem, so it is necessary to introduce the relaxation variable
where
For optimization problems, it needs to be transformed into the dual problem of the Lagrangian operator, and the final expression of SVM is:
where
The object-oriented classification method breaks through the limitation of the traditional classification method which takes a single pixel as the basic classification and processing unit, classifies the image from the object level, and reduces the loss rate of semantic information contained in the traditional pixel-based classification method (Stumpf and Kerle, 2011). The object-oriented SVM classification method takes into account the advantages of object-oriented multi-scale segmentation and SVM. Firstly, multi-scale segmentation is carried out according to the properties of the object region on the image, which not only considers the spectral information of the image, but also adds features such as texture, geometric shape, and spatial topological relations, and then uses training samples for SVM classification. The object-oriented SVM classification method has obvious advantages in accuracy, generalization, and high-dimensional data processing, and thus has been widely used in RS image classification (Li et al., 2010; Lin et al., 2018; Shen et al., 2020). To obtain the land use types in the study area, this research utilized the object-oriented SVM classification method to classify remote sensing images.
2.4 Landscape disorder degree
The landscape disorder degree can indicate the degree of fragmentation and dispersion of urban landscapes, as well as reflect the heterogeneity and homogeneity of landscape space (Dong et al., 2010). The higher the heterogeneity of land use patches per unit area, the greater the degree of landscape disorder. Urban and rural areas usually have a single type of land, mostly for construction or agricultural use, and the degree of their landscape disorder is low. Since the urban fringe is an active expansion zone between the urban landscape and agricultural hinterland, it has various types of land use and a high degree of landscape disorder (Scott et al., 2013; Yang et al., 2017; Sharaf El Din, 2020). Therefore, the scope of the urban fringe can be determined by the differences in landscape disorder. The formula for the landscape disorder degree is as follows:
Where
2.5 Kernel density estimation (KDE)
The KDE calculation is often used to evaluate the density value of the neighborhood of point or line elements, and to simulate the spatial distribution of elements, which is widely used in geospatial analyses (Lin et al., 2021). Its main principle is that the estimated density of elements decreases with an increase in distance within a certain bandwidth. The kernel density at the center of the feature is the highest, and the kernel density at the edge of the bandwidth is 0. As KDE obeys the law of spatial correlation, the closer the distance is, the greater the correlation is, hence the POI data also conform to this law. The kernel density formula is as follows:
where
2.6 Geographical detector (Geodetector)
Geodetectors are a group of statistical methods used to detect spatial diversity and explain the driving force behind it, including factor, interaction, risk, and ecological detectors (Wang et al., 2010). The main principle of the geodetector is to assume that the study area is divided into several sub-regions; if the sum of the variance of the sub-region is less than the total variance of the region, there is a spatial difference; if the spatial distribution of the two variables tends to be consistent, there is a statistical correlation between the two variables. Geodetectors can evaluate spatial differentiation, detect explanatory factors, and analyze the interaction between variables, and therefore have been widely used in nature, environmental science, human health, and other fields (Wang et al., 2010; Cao et al., 2013; Liu et al., 2020). Based on the factor detector, this study obtained the degree of landscape disorder, POI kernel density, and night light intensity to explain the spatial distribution of population.
Of the detector components, the factor detector detects the spatial differentiation of attribute Y and the explanatory power of factor X to attribute Y, which is measured by
where
2.7 Fringe extraction model of small and medium-sized urban areas (FEM-SMU)
Taking the landscape disorder degree, POI kernel density, and night light intensity as urban characteristic factors, this study proposes the FEM-SMU model (Figure 2). The spatial distribution of population density in an urban area is reflective of the differences between the urban center, urban fringe, and rural areas (Simon, 2008). The explanatory power of individual factors (landscape disorder degree, POI kernel density, night light intensity) on population distribution can reflect their explanatory power on the differences in urban center, urban fringe, and rural characteristics. Therefore, the relative weights of the various factors can be established based on the ratio of the explanatory power of a single factor to the sum of the explanatory power of all factors. The implementation process of the model is divided into the following three steps.
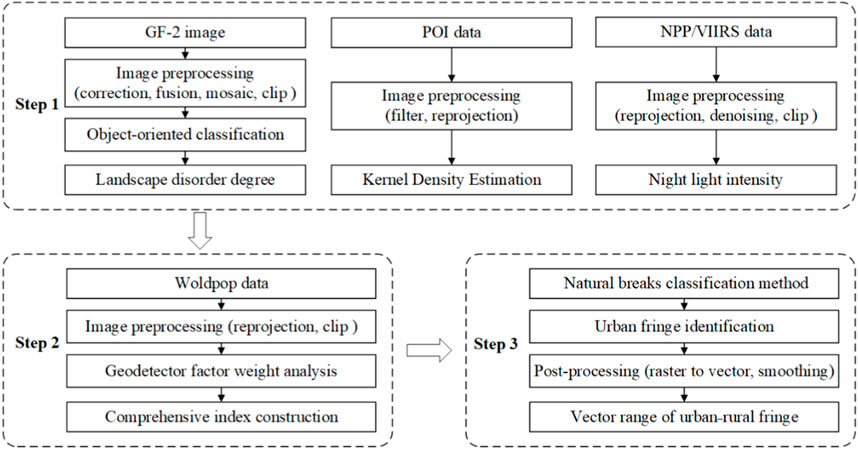
FIGURE 2. The implementation process of the FEM-SMU model.
The first step was to calculate the degree of landscape disorder, POI kernel density, and night light intensity. For the calculation of landscape disorder degree: First, Envi 5.3 software was used to perform atmospheric correction, fusion, mosaic, and cropping operations on GF-2 images in the study area, then the object-oriented SVM method was used for land use classification, and finally, Eq. 4 was used to calculate the degree of landscape disorder. For the calculation of POI kernel density: First, the POI data were filtered and reprojected using ArcGIS 10.3 software, and then the kernel density tool was used to evaluate the kernel density. For the calculation of night light intensity: First, the NPP-VIIRS data of the study area were reprojected, denoised, and cropped using ArcGIS 10.3, and then the DN value of pixels was obtained to represent the night light intensity. It should be noted that the degree of landscape disorder, POI kernel density, and night light intensity should be normalized and resampled to a resolution of 10 m after calculation to ensure accurate analysis.
The second step was to build a comprehensive index. First, the Wordpop data were reprojected and cropped using ArcGIS 10.3. Second, the explanatory power of the landscape disorder degree, POI kernel density, and night light intensity on population spatial distribution was determined based on the factor detector. Finally, the comprehensive index was established after the weight was determined according to the ratio of the explanatory power degree of a single factor to all explanatory power degrees.
The third step was to extract the fringe of small- and medium-sized urban areas. First, the comprehensive index grid was divided into three categories by using the Natural Breaks Classification (NBC) method, which represents the urban core, urban fringe, and rural hinterland, and then the classified results were transformed into vectors and smoothed to obtain the range of the urban fringe. It is worth mentioning that this paper determines the NBC method as the classification method for the composite index through comparison of the accuracy of equal interval method, NBC method, and standard deviation method, and reference to literature (Xu et al., 2013; Xiao et al., 2020).
3 Results
3.1 Results of landscape disorder degree threshold method
Based on the preprocessed GF-2 imagery of the study area, the land use was divided into four categories: vegetation (cultivated land, forest land, and grassland), construction land, water, and unused land, using the object-oriented SVM classification method (Figure 3A). It can be seen from the figure that the construction land was mainly distributed in the middle and south of the study area, the water was distributed along the southern boundary, the unused land was mainly distributed in the north, and the vegetation was mainly distributed in the northwest, northeast, and southeast. According to statistics, the vegetation area of the study area was 80.34 km2, the construction land area was 60.83 km2, the water area was 6.95 km2, and the unused land area was 3.31 km2.
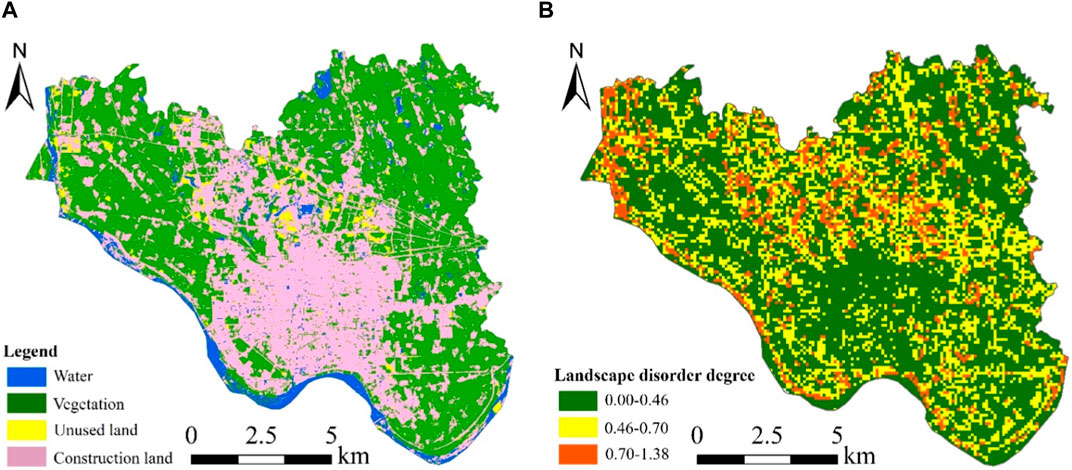
FIGURE 3. (A) Results of land use classification based on the object-oriented SVM method. (B) Results of the landscape disorder degree threshold method.
To highlight the circular structure of landscape disorder in the study area, a grid of 100 × 100 m was constructed as the scale unit of spatial calculation. ArcGIS 10.3 was applied to calculate the area ratios of vegetation, construction land, water, and unused land in the cell grid, and the degree of landscape disorder in the study area was calculated using Eq. 4; (Figure 3B). As can be seen from the figure, the landscape structure characteristics of the urban core area were prominent, the landscape disorder degree was low, and there were concentrated and contiguous low-value areas. After repeated experiments, a threshold value of less than 0.46 was used as the symbol to identify the urban core area. However, if there was a large range of green spaces in the urban core area, the degree of landscape disorder was higher, and the landscape disorder degree threshold method could not identify the complete urban core area. The difference in the degree of landscape disorder between the urban fringe and rural hinterland was not obvious, and the degree of landscape disorder was higher. We consider that, compared with larger cities, small- and medium-sized cities have fewer populations and smaller villages; further, the study area is located in the Hanzhong Plain, where villages are relatively concentrated and cultivated land is relatively scattered. These circumstances resulted in a higher degree of landscape disorder between the urban fringe and rural hinterland. Although the landscape disorder degree threshold method is currently widely used in the identification of metropolitan fringes (Huang et al., 2016; Wang Y. et al., 2021; Liu, 2021), in this study, the common shortcomings of this as a single-factor threshold method, which include discontinuity, lack of detail, and poor versatility, were amplified obviously in the process of urban fringe identification in the study area. Therefore, we conclude that the landscape disorder degree threshold method is not suitable for the identification of small- and medium-sized urban fringes.
3.2 Results of the POI kernel density breakpoint analysis method
The setting of the bandwidth in KDE has an important influence on the results. After referring to previous research results (Heidenreich et al., 2013; Lin et al., 2021), the distances of 500 m, 1000 m, and 1,500 m were selected for KDE analysis (Figures 4A–C). It can be seen from the figure that with the shortest bandwidth of 500 m, the KDE results were fragmented and discontinuous, and the overall distribution of urban POI was not obvious. On the other end of the spectrum, with a bandwidth of 1,500 m, the local characteristics of the overall distribution trend of urban POI were difficult to show, and the details were insufficient. Finally, with the medium bandwidth of 1,000 m, the KDE results had good stability and an obvious overall distribution, which can meet the analysis needs of the urban fringe in the study area.
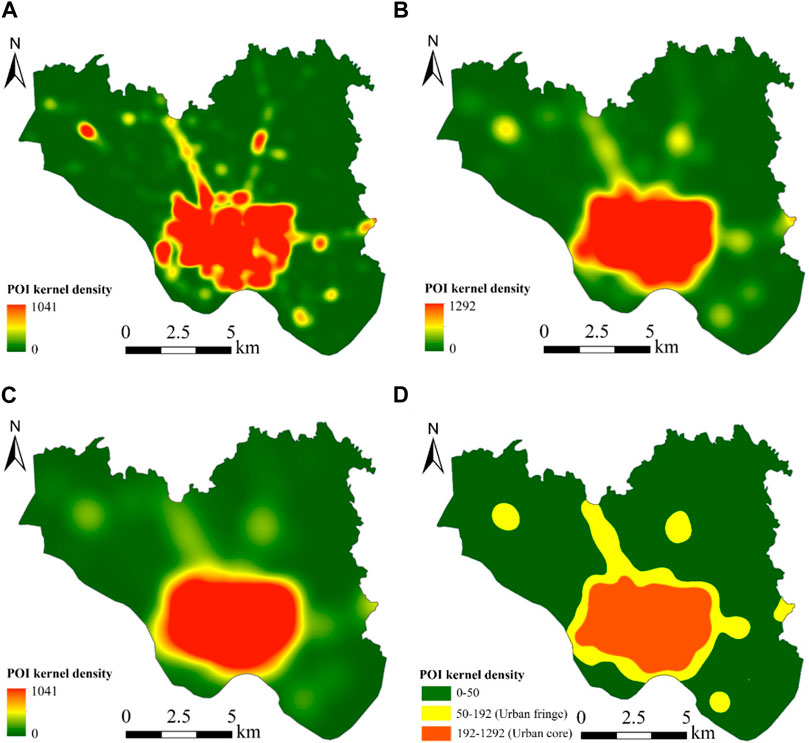
FIGURE 4. (A–C) The KDE results with bandwidths of 500 m, 1,000 m, and 1,500 m, respectively. (D) Results of dividing the POI kernel density with a bandwidth of 1,000 m into three categories by the NBC method.
Taking this selected bandwidth, Figure 4D shows the result of dividing the POI kernel density with a bandwidth of 1,000 m into three categories by the NBC method. As can be seen from Figures 4B, D, the POI kernel density showed an obvious circular structure distribution. The urban core area had a large area of continuous high-density area, the density of the urban fringe was low, and the density of most rural areas was close to 0. Compared with the landscape disorder degree threshold method, the results of the POI kernel density breakpoint analysis method can clearly and completely identify the urban core area; however, both of them had poor recognition results for the urban fringe area. Moreover, the POI kernel density breakpoint analysis method identifies well-developed villages with a large number of POIs as urban fringes. As the urban fringe was in the stage of development, with less POI data and slow updating speed, this led to obvious errors between the results and the actual urban fringe. Different from larger cities, the POI data integrity of small- and medium-sized urban fringe was lower and the update speed was relatively slow, so we conclude that the POI kernel density breakpoint analysis method had too much difficulty in accurately extracting the urban fringe of the study area.
3.3 Results of the FEM-SMU model
Finally, the urban fringe of the study area was extracted using the FEM-SMU model proposed in this study. First, the degree of landscape disorder, POI kernel density, and night light intensity were calculated. Then, the weight of each factor was determined by combining the Geodetector and WorldPop data (landscape disorder degree: 0.10, POI kernel density: 0.51, night light intensity: 0.39) to construct a comprehensive index. Finally, the urban fringe was identified by the NBC method, and the results were post-processed.
Figure 5A shows the result of dividing the comprehensive index into three categories by the NBC method, and Figure 5B shows the final result of the FEM-SMU model. As can be seen from the figure, the FEM-SMU model could accurately and completely identify the urban fringe of the study area. The urban fringe was mainly concentrated in the north and east, with an area of approximately 39 km2. Compared with the two single-factor extraction methods, the performance of the FEM-SMU model was a great improvement, especially for the results of the outer boundary of the urban fringe. The overall pattern of the inner boundary of the urban fringe (urban core area) extracted by the FEM-SMU model and POI kernel density breakpoint analysis was more consistent, and further, the former was more detailed. The difference between the results of the two methods was mainly concentrated in the southwest in the Hanjiang New Area which is still in the stage of rapid development with rapidly changing landscape patterns, and the POI data updated slowly. Therefore, there is a partial error between the inner boundary of the urban fringe extracted by the POI kernel density breakpoint analysis and the actual boundary. Nevertheless, the FEM-SMU model focuses on the comprehensive performance of the regional landscape disorder degree, POI kernel density, and night light intensity, and is less dependent on the performance of a single factor, thus it can more accurately identify the urban fringe.
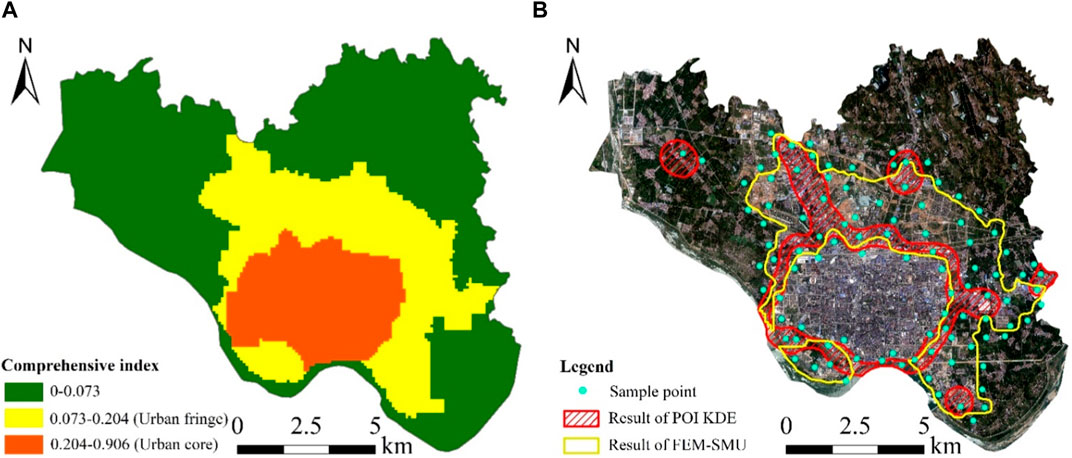
FIGURE 5. (A) Results of dividing the comprehensive index into three categories by the NBC method. (B) Final results of the FEM-SMU model.
4 Discussion
4.1 Accuracy evaluation of the FEM-SMU model
As the landscape disorder degree threshold method makes it difficult to identify the urban fringe of the study area, this study only evaluates the accuracy of the POI kernel density breakpoint analysis method and FEM-SMU model. Through detailed visual analysis in Section 4, we found that the FEM-SMU model was significantly stronger than the POI kernel density breakpoint analysis method in detail and integrity. To further evaluate the extraction accuracy of different methods, field verification and landscape pattern index evaluations were used in this study. A total of 100 sample points were evenly selected along the road around the urban fringe (Figure 5B), and the accuracy of the extraction results was analyzed by field verification (Table 2). It can be seen from the table that the overall accuracy of the FEM-SMU model was significantly higher than that of POI kernel density breakpoint analysis method, reaching 98%. The POI kernel density breakpoint analysis method had a relatively large number of errors, with an overall accuracy of only 67%.
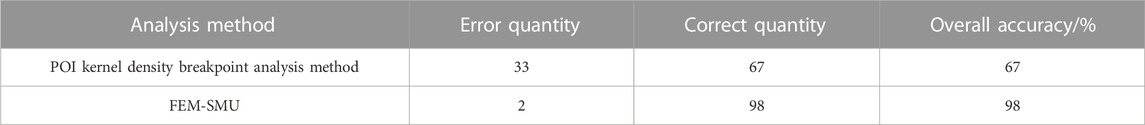
TABLE 2. Extraction accuracy of different methods.
As another validation method, the landscape pattern index is often used to evaluate the extraction accuracy of urban fringes (Peng et al., 2016). After referring to previous research results (Vizzari and Sigura, 2015; Yang et al., 2021), patch density (PD) and the Shannon diversity index (SHDI) were selected to evaluate the accuracy of the two methods at the grade and landscape levels. The PD value indicates the degree of landscape fragmentation, and SHDI represents the degree of richness and complexity of landscape types. Generally speaking, the PD and SHDI in urban fringes should be higher, while those in urban centers and rural areas should be lower. Table 3 shows the PD and SHDI values of the two methods in different regions calculated by the Fragstats 4.2 software. It can be seen from the table that the PD and SHDI values of the FEM-SMU model were significantly higher than those of the POI kernel density breakpoint analysis method in the urban fringe. This shows that the degree of landscape fragmentation, complexity, and diversity in the urban fringe extracted by the former was higher than that of the latter, which can better reflect the characteristics of the urban fringe. In the rural hinterland, the PD and SHDI values of the FEM-SMU model were significantly lower than those of the POI kernel density breakpoint analysis method. However, the PD and SHDI values are approximate in the urban core areas because of the relatively small difference between the boundaries extracted by the two methods. In conclusion, the two evaluation methods show that the FEM-SMU model has higher accuracy and can accurately extract the urban fringe of the study area.
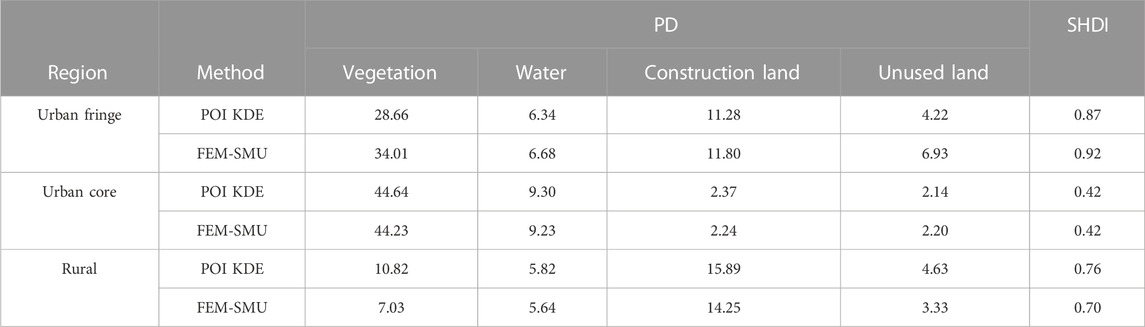
TABLE 3. PD and SHDI values in different regions.
4.2 Generality analysis of the model
To further verify the applicability of the model proposed in this study in different regions and different types of small- and medium-sized cities, urban fringe identification was completed for Shangzhou District in Shangluo City and Hanbin District in Ankang City (Figure 6). Shangzhou District is a typical banded urban structure, which is severely limited by resource conditions. As shown in Figure 6A, the extraction result of the POI kernel density breakpoint analysis method is incomplete, especially in the southeast. The reason for this is likely that the southeast part of Shangzhou District is mainly an industrial park, and the number of POIs is small and scattered, which is not enough to support the identification of the urban fringe. Hanbin District is separated from the middle by the Hanjiang River, with the old urban area in the southeast and the new urban area in the northwest, which is a multi-center urban structure. As can be seen from Figure 6B, the extraction result of the POI nuclear density breakpoint analysis was poor, especially in the old urban area of the southeast. The main reason for this is likely that the single-factor method requires high data quality when extracting the fringe of multi-center cities, while the development of the old urban area is relatively backward, the population distribution is concentrated, and the POI data are not complete. As a better option, the FEM-SMU model identifies the urban fringe according to the comprehensive performance differences of regional landscape disorder degree, POI kernel density, and night light intensity combined, and is less dependent on the performance of a single factor, thus it can adapt to different regions and different types of small- and medium-sized cities.
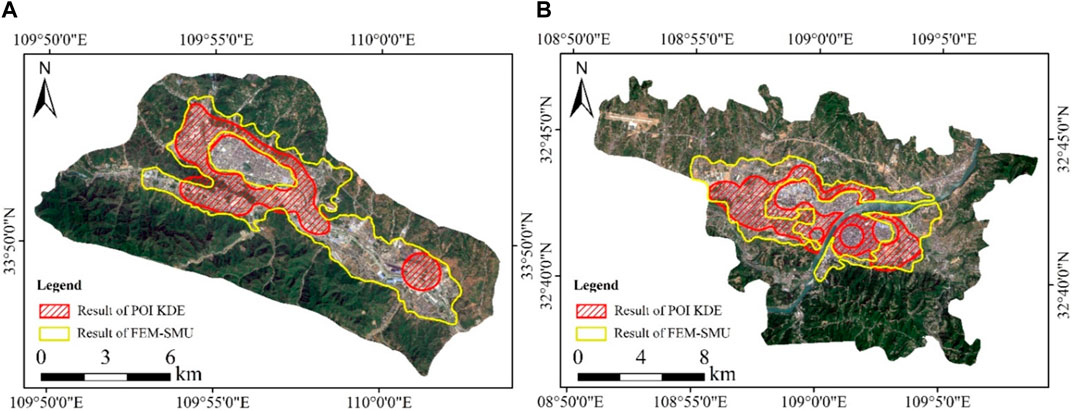
FIGURE 6. (A) Urban fringe of Shangzhou District extracted using different methods. (B) Urban fringe of Hanbin District extracted using different methods.
5 Conclusion
This study proposes a FEM-SMU taking the landscape disorder degree, POI kernel density, and night light intensity as urban feature factors. The extraction results of the FEM-SMU model, landscape disorder degree threshold method, and POI kernel density breakpoint analysis method in Hantai District, China were compared through experiments, and the generality of the model was tested in Shangzhou and Hanbin districts, also in China. The results show that although the landscape disorder degree threshold method could reflect the landscape characteristics of urban core areas, the recognition results of the rural hinterland and urban fringe were poor. The overall pattern characteristics of urban core areas extracted by the POI kernel density breakpoint analysis method and FEM-SMU model were consistent, but the former was poor in extracting urban fringe. In contrast, the urban fringe extracted by FEM-SMU had obvious advantages in accuracy, detail, and integrity, and can be applied to different areas and different types of small- and medium-sized urban areas. The research results have important practical significance for optimizing urban spatial layout, controlling unlimited urban expansion, and protecting land resources.
Data availability statement
The original contributions presented in the study are included in the article/supplementary material, further inquiries can be directed to the corresponding author.
Author contributions
JL contributed by processing the data and wrote the main part of the manuscript. BP and SL contributed to writing and collecting data. HY, ZZ, and XN contributed to the research design and gave constructive comments and suggestions.
Funding
This research was supported by the National Natural Science Foundation of China (No.71874183), the Technology Innovation Center for Land Engineering and Human Settlements, Shaanxi Land Engineering Construction Group Co., Ltd and Xi’an Jiaotong University (No. 2021WHZ0090), the Scientific Research Item of Shaanxi Provincial Land Engineering Construction Group (DJNY-YB-2023-33, DJTD-2023-2, DJTD-2022-4), and Shaanxi Key laboratory of land consolidation (No. 300102352502).
Acknowledgments
We greatly appreciate the POI data provided by Gaode, the NPP/VIIRS data provided by NGDC and the Worldpop data provided by the Department of Geography and the Institute of New Pathogens at the University of Florida.
Conflict of interest
Authors JL, BP, and SL were employed by the company Shaanxi Provincial Land Engineering Construction Group Co., Ltd.
The remaining authors declare that the research was conducted in the absence of any commercial or financial relationships that could be construed as a potential conflict of interest.
The authors declare that this study received funding from Shaanxi Provincial Land Engineering Construction Group Co., Ltd. The company had the following involvement in the study: design, data collection and analysis.
Publisher’s note
All claims expressed in this article are solely those of the authors and do not necessarily represent those of their affiliated organizations, or those of the publisher, the editors and the reviewers. Any product that may be evaluated in this article, or claim that may be made by its manufacturer, is not guaranteed or endorsed by the publisher.
References
Ahani, S., and Dadashpoor, H. (2021). A review of domains, approaches, methods and indicators in peri-urbanization literature. Habitat Int. 114, 102387. doi:10.1016/j.habitatint.2021.102387
Cai, J., Huang, B., and Song, Y. (2017). Using multi-source geospatial big data to identify the structure of polycentric cities. Remote Sens. Environ. 202, 210–221. doi:10.1016/j.rse.2017.06.039
Cao, F., Ge, Y., and Wang, J.-F. (2013). Optimal discretization for geographical detectors-based risk assessment. GIScience Remote Sens. 50 (1), 78–92. doi:10.1080/15481603.2013.778562
Chang, S., Jiang, Q., Wang, Z., Xu, S., and Jia, M. (2018). Extraction and spatial–temporal evolution of urban fringes: A case study of changchun in jilin province, China. ISPRS Int. J. Geo-Information 7 (7), 241. doi:10.3390/ijgi7070241
Chen, M., Liu, W., Lu, D., Chen, H., and Ye, C. (2018). Progress of China's new-type urbanization construction since 2014: A preliminary assessment. Cities 78, 180–193. doi:10.1016/j.cities.2018.02.012
Cortes, C., and Vapnik, V. (1995). Support-vector networks. Mach. Learn. 20 (3), 273–297. doi:10.1007/bf00994018
Dong, C., Man-Chun, L., Zhen-jie, C., Fei-xue, L., and Wei, W. (2010). “A method of division of urban fringe based on message entropy:----A case study in Nanjing Cit,” in Proceedings of the 2009 joint urban remote sensing event, May 2009, Shanghai, China, doi:10.1109/URS.2009.5137553
Dong, Q., Qu, S., Qin, J., Yi, D., Liu, Y., and Zhang, J. (2022). A method to identify urban fringe area based on the industry density of POI. ISPRS Int. J. Geo-Information 11 (2), 128. doi:10.3390/ijgi11020128
Fang, L., Huang, J., Zhang, Z., and Nitivattananon, V. (2020). Data-driven framework for delineating urban population dynamic patterns: Case study on Xiamen Island, China. Sustain. Cities Soc. 62, 102365. doi:10.1016/j.scs.2020.102365
Feng, W., Liu, Y., and Qu, L. (2019). Effect of land-centered urbanization on rural development: A regional analysis in China. Land Use Policy 87, 104072. doi:10.1016/j.landusepol.2019.104072
Gant, R. L., Robinson, G. M., and Fazal, S. (2011). Land-use change in the ‘edgelands’: Policies and pressures in London's rural–urban fringe. Land use policy 28 (1), 266–279. doi:10.1016/j.landusepol.2010.06.007
Gao, Y., Feng, Z., Wang, Y., Liu, J.-L., Li, S.-C., and Zhu, Y.-K. (2014). Clustering urban multifunctional landscapes using the self-organizing feature map neural network model. J. Urban Plan. Dev. 140 (2), 05014001. doi:10.1061/(asce)up.1943-5444.0000170
Heidenreich, N.-B., Schindler, A., and Sperlich, S. (2013). Bandwidth selection for kernel density estimation: A review of fully automatic selectors. AStA Adv. Stat. Analysis 97 (4), 403–433. doi:10.1007/s10182-013-0216-y
Huang, J., Zhou, Q., and Wu, Z. (2016). Delineating urban fringe area by land cover information entropy—An empirical study of guangzhou-foshan metropolitan area, China. ISPRS Int. J. Geo-Information 5 (5), 59. doi:10.3390/ijgi5050059
Imhoff, M. L., Zhang, P., Wolfe, R. E., and Bounoua, L. (2010). Remote sensing of the urban heat island effect across biomes in the continental USA. Remote Sens. Environ. 114 (3), 504–513. doi:10.1016/j.rse.2009.10.008
Li, H., Gu, H., Han, Y., and Yang, J. (2010). Object-oriented classification of high-resolution remote sensing imagery based on an improved colour structure code and a support vector machine. Int. J. remote Sens. 31 (6), 1453–1470. doi:10.1080/01431160903475266
Li, J., Li, J., Yuan, Y., and Li, G. (2019). Spatiotemporal distribution characteristics and mechanism analysis of urban population density: A case of xi'an, Shaanxi, China. Cities 86, 62–70. doi:10.1016/j.cities.2018.12.008
Lin, A., Sun, X., Wu, H., Luo, W., Wang, D., Zhong, D., et al. (2021). Identifying urban building function by integrating remote sensing imagery and POI data. IEEE J. Sel. Top. Appl. Earth Observations Remote Sens. 14, 8864–8875. doi:10.1109/jstars.2021.3107543
Lin, Q., Guo, J., Yan, J., and Heng, W. (2018). Land use and landscape pattern changes of Weihai, China based on object-oriented SVM classification from Landsat MSS/TM/OLI images. Eur. J. Remote Sens. 51 (1), 1036–1048. doi:10.1080/22797254.2018.1534532
Liu, C., Li, W., Zhu, G., Zhou, H., Yan, H., and Xue, P. (2020). Land use/land cover changes and their driving factors in the northeastern Tibetan plateau based on geographical detectors and google earth engine: A case study in gannan prefecture. Remote Sens. 12 (19), 3139. doi:10.3390/rs12193139
Liu, H. (2021). Apply fringe identification to understand urban economic development in China: In case of wuhan. Arabian J. Geosciences 14 (13), 1295–1314. doi:10.1007/s12517-021-07629-8
Liu, Y., Li, J., and Yang, Y. (2018). Strategic adjustment of land use policy under the economic transformation. Land Use Policy 74, 5–14. doi:10.1016/j.landusepol.2017.07.005
Liu, Y., Song, Y., and Arp, H. P. (2012). Examination of the relationship between urban form and urban eco-efficiency in China. Habitat Int. 36 (1), 171–177. doi:10.1016/j.habitatint.2011.08.001
Long, Y., Luo, S., Liu, X., Luo, T., and Liu, X. (2022). Research on the dynamic evolution of the landscape pattern in the urban fringe area of wuhan from 2000 to 2020. ISPRS Int. J. Geo-Information 11 (9), 483. doi:10.3390/ijgi11090483
Lyu, Y., Wang, M., Zou, Y., and Wu, C. (2022). Mapping trade-offs among urban fringe land use functions to accurately support spatial planning. Sci. Total Environ. 802, 149915. doi:10.1016/j.scitotenv.2021.149915
Peng, J., Liu, Y., Ma, J., and Zhao, S. (2018). A new approach for urban-rural fringe identification: Integrating impervious surface area and spatial continuous wavelet transform. Landsc. Urban Plan. 175, 72–79. doi:10.1016/j.landurbplan.2018.03.008
Peng, J., Ma, J., and Yuan, Y. (2014). Research progress and prospect on the identification of urban fringe. Prog. Geogr. 33 (8).
Peng, J., Zhao, S., Liu, Y., and Tian, L. (2016). Identifying the urban-rural fringe using wavelet transform and kernel density estimation: A case study in beijing city, China. Environ. Model. Softw. 83, 286–302. doi:10.1016/j.envsoft.2016.06.007
Scott, A., Carter, C., Reed, M., Larkham, P., Adams, D., Morton, N., et al. (2013). Disintegrated development at the rural–urban fringe: Re-Connecting spatial planning theory and practice. Prog. Plan. 83, 1–52. doi:10.1016/j.progress.2012.09.001
Seto, K. C., Sánchez-Rodríguez, R., and Fragkias, M. (2010). The new geography of contemporary urbanization and the environment. Annu. Rev. Environ. Resour. 35, 167–194. doi:10.1146/annurev-environ-100809-125336
Sharaf El Din, E. (2020). A novel approach for surface water quality modelling based on Landsat-8 tasselled cap transformation. Int. J. Remote Sens. 41 (18), 7186–7201. doi:10.1080/01431161.2020.1754497
Shen, G., Yang, X., Jin, Y., Luo, S., Xu, B., and Zhou, Q. (2020). Land use changes in the zoige plateau based on the object-oriented method and their effects on landscape patterns. Remote Sens. 12 (1), 14. doi:10.3390/rs12010014
Shi, K., Huang, C., Yu, B., Yin, B., Huang, Y., and Wu, J. (2014). Evaluation of NPP-VIIRS night-time light composite data for extracting built-up urban areas. Remote Sens. Lett. 5 (4), 358–366. doi:10.1080/2150704x.2014.905728
Simon, D., McGregor, D., and Nsiah-Gyabaah, K. (2004). The changing urban-rural interface of african cities: Definitional issues and an application to kumasi, Ghana. Environ. urbanization 16 (2), 235–248. doi:10.1177/095624780401600214
Simon, D. (2008). Urban environments: Issues on the peri-urban fringe. Annu. Rev. Environ. Resour. 33, 167–185. doi:10.1146/annurev.environ.33.021407.093240
Stumpf, A., and Kerle, N. (2011). Object-oriented mapping of landslides using Random Forests. Remote Sens. Environ. 115 (10), 2564–2577. doi:10.1016/j.rse.2011.05.013
Su, T. (2019). Scale-variable region-merging for high resolution remote sensing image segmentation. ISPRS J. Photogrammetry Remote Sens. 147, 319–334. doi:10.1016/j.isprsjprs.2018.12.003
Tatem, A. J. (2017). WorldPop, open data for spatial demography. Sci. data 4 (1), 170004–4. doi:10.1038/sdata.2017.4
Thaseen, I. S., and Kumar, C. A. (2017). Intrusion detection model using fusion of chi-square feature selection and multi class SVM. J. King Saud University-Computer Inf. Sci. 29 (4), 462–472. doi:10.1016/j.jksuci.2015.12.004
Tong, X.-Y., Xia, G.-S., Lu, Q., Shen, H., Li, S., You, S., et al. (2020). Land-cover classification with high-resolution remote sensing images using transferable deep models. Remote Sens. Environ. 237, 111322. doi:10.1016/j.rse.2019.111322
Tu, W., Zhu, T., Xia, J., Zhou, Y., Lai, Y., Jiang, J., et al. (2020). Portraying the spatial dynamics of urban vibrancy using multisource urban big data. Comput. Environ. Urban Syst. 80, 101428. doi:10.1016/j.compenvurbsys.2019.101428
van Vliet, J., Verburg, P. H., Grădinaru, S. R., and Hersperger, A. M. (2019). Beyond the urban-rural dichotomy: Towards a more nuanced analysis of changes in built-up land. Comput. Environ. Urban Syst. 74, 41–49. doi:10.1016/j.compenvurbsys.2018.12.002
Vizzari, M., and Sigura, M. (2015). Landscape sequences along the urban–rural–natural gradient: A novel geospatial approach for identification and analysis. Landsc. Urban Plan. 140, 42–55. doi:10.1016/j.landurbplan.2015.04.001
Vranken, I., Baudry, J., Aubinet, M., Visser, M., and Bogaert, J. (2015). A review on the use of entropy in landscape ecology: Heterogeneity, unpredictability, scale dependence and their links with thermodynamics. Landsc. Ecol. 30, 51–65. doi:10.1007/s10980-014-0105-0
Wadduwage, S., Millington, A., Crossman, N. D., and Sandhu, H. (2017). Agricultural land fragmentation at urban fringes: An application of urban-to-rural gradient analysis in adelaide. Land 6 (2), 28. doi:10.3390/land6020028
Wang, J. F., Li, X. H., Christakos, G., Liao, Y. L., Zhang, T., Gu, X., et al. (2010). Geographical detectors-based health risk assessment and its application in the neural tube defects study of the Heshun Region, China. Int. J. Geogr. Inf. Sci. 24 (1), 107–127. doi:10.1080/13658810802443457
Wang, L., Wu, L., and Zhang, W. (2021a). Impacts of land use change on landscape patterns in mountain human settlement: The case study of Hantai District (Shaanxi, China). J. Mt. Sci. 18 (3), 749–763. doi:10.1007/s11629-020-6236-7
Wang, Y., Han, Y., Pu, L., Jiang, B., Yuan, S., and Xu, Y. (2021b). A novel model for detecting urban fringe and its expanding patterns: An application in harbin city, China. Land 10 (8), 876. doi:10.3390/land10080876
Warren, P. S., Ryan, R. L., Lerman, S. B., and Tooke, K. A. (2011). Social and institutional factors associated with land use and forest conservation along two urban gradients in Massachusetts. Landsc. Urban Plan. 102 (2), 82–92. doi:10.1016/j.landurbplan.2011.03.012
Wenhao, Y., and Tinghua, A. (2015). The visualization and analysis of POI features under network space supported by kernel density estimation. Acta Geod. Cartogr. Sinica 44 (1), 82.
Whitehand, J., and Gu, K. (2017). Urban fringe belts: Evidence from China. Environ. Plan. B Urban Anal. City Sci. 44 (1), 80–99. doi:10.1177/0265813515608849
Xiao, W., Lv, X., Zhao, Y., Sun, H., and Li, J. (2020). Ecological resilience assessment of an arid coal mining area using index of entropy and linear weighted analysis: A case study of shendong coalfield, China. Ecol. Indic. 109, 105843. doi:10.1016/j.ecolind.2019.105843
Xu, W., Yu, W., Jing, S., Zhang, G., and Huang, J. (2013). Debris flow susceptibility assessment by GIS and information value model in a large-scale region, Sichuan Province (China). Nat. hazards 65, 1379–1392. doi:10.1007/s11069-012-0414-z
Yang, J., Dong, J., Sun, Y., Zhu, J., Huang, Y., and Yang, S. (2021). A constraint-based approach for identifying the urban–rural fringe of polycentric cities using multi-sourced data. Int. J. Geogr. Inf. Sci. 36, 114–136. doi:10.1080/13658816.2021.1876236
Yang, Y., Ma, M., Tan, C., and Li, W. (2017). Spatial recognition of the urban-rural fringe of Beijing using DMSP/OLS nighttime light data. Remote Sens. 9 (11), 1141. doi:10.3390/rs9111141
Yue, W., Liu, Y., and Fan, P. (2013). Measuring urban sprawl and its drivers in large Chinese cities: The case of Hangzhou. Land use policy 31, 358–370. doi:10.1016/j.landusepol.2012.07.018
Zhao, P., and Zhang, M. (2018). Informal suburbanization in Beijing: An investigation of informal gated communities on the urban fringe. Habitat Int. 77, 130–142. doi:10.1016/j.habitatint.2018.01.006
Keywords: landscape disorder degree, kernel density estimation (KDE), night light intensity, geographical detector (Geodetector), urban fringe
Citation: Li J, Peng B, Liu S, Ye H, Zhang Z and Nie X (2023) An accurate fringe extraction model of small- and medium-sized urban areas using multi-source data. Front. Environ. Sci. 11:1118953. doi: 10.3389/fenvs.2023.1118953
Received: 08 December 2022; Accepted: 25 April 2023;
Published: 09 May 2023.
Edited by:
Chang Huang, Northwest University, ChinaReviewed by:
Qingsong He, Huazhong University of Science and Technology, ChinaShi Qiu, Chinese Academy of Sciences (CAS), China
Yan Xia, Institutes of Science and Development, Chinese Academy of Sciences, China
Kailan Tian, Chinese Academy of Sciences (CAS), China
Copyright © 2023 Li, Peng, Liu, Ye, Zhang and Nie. This is an open-access article distributed under the terms of the Creative Commons Attribution License (CC BY). The use, distribution or reproduction in other forums is permitted, provided the original author(s) and the copyright owner(s) are credited and that the original publication in this journal is cited, in accordance with accepted academic practice. No use, distribution or reproduction is permitted which does not comply with these terms.
*Correspondence: Xiaowei Nie, eHduaWVAaXRwY2FzLmFjLmNu