 Rebecca K. Forgrave
 Emily M. Elliott
 Daniel J. Bain
95% of researchers rate our articles as excellent or good
Learn more about the work of our research integrity team to safeguard the quality of each article we publish.
Find out more
ORIGINAL RESEARCH article
Front. Environ. Sci. , 04 July 2023
Sec. Biogeochemical Dynamics
Volume 11 - 2023 | https://doi.org/10.3389/fenvs.2023.1117809
This article is part of the Research Topic Biogeochemical Dynamics in Urban Systems: Interactions, Feedbacks, and Cumulative Impacts View all 9 articles
Stream channel burial drastically alters watershed flowpaths by routing surface waters underground and increasing the potential for interactions between stream water and urban infrastructure such as storm and sanitary sewers. While numerous studies have investigated storm event solute loads from urban watersheds, the influences of stream channel burial and sewer overflows are often overlooked. This study uses grab samples and natural abundance stable isotope tracers to quantify the event dynamics of solute concentration-discharge relationships as well as cumulative loads in a buried urban stream. Our results demonstrate that different solutes, as well as different sources of the same solute (atmospheric NO3− and sewer-derived NO3− differentiated by the Δ17O tracer), are delivered via separate watershed flowpaths and thus have different timings within the event and contrasting relationships to flow. This inter-event variability reveals dynamics that result from temporal and spatial heterogeneity in infiltration, exfiltration, and pipe overflows. These results can help guide system-wide infrastructure maintenance as cities seek to meet challenges in sustaining and improving water quality as infrastructural systems age.
Storms mobilize solutes from across watersheds and connect storage zones to the stream that are disconnected in dry weather conditions. This is especially true in urban watersheds where large areas of impervious surfaces are connected to the stream channel via stormwater pipe networks and lead to high and flashy event flows (Leopold, 1968; Graf, 1975). Additionally, urban watershed flowpaths are complicated by stream burial, where surface stream channels are deliberately relocated to subsurface pipes (Elmore and Kaushal, 2008; Forgrave et al., 2022), often in the storm drainage network (Broadhead et al., 2013). Burial is common in many older US cities (Elmore and Kaushal, 2008; Roy et al., 2015; Napieralski and Welsh, 2016; Weitzell et al., 2016; Hopkins and Bain, 2018; Forgrave et al., 2022) and is concentrated in spatial extent, resulting in urban areas where complete burial has created “stream deserts” or areas of land with no surface streams (Napieralski et al., 2015; Napieralski and Carvalhaes, 2016). This process of stream burial has three significant impacts on the connectivity between watershed solute sources and the stream network: 1) direct connections to the storm drainage network increase loads of surface solutes (Kaushal and Belt, 2012; Hobbie et al., 2017; Fork et al., 2018), 2) relocating streams underground increases the likelihood of connectivity to subsurface solutes such as sewage leaks (Broadhead et al., 2013; 2015; Divers et al., 2014; Hopkins and Bain, 2018; Delesantro et al., 2022), and 3) burial disconnects streams from their surface floodplains and wetlands—locations that can slow down flow and promote nutrient uptake, settling, and denitrification (Groffman and Crawford, 2003; Klocker et al., 2009; Pennino et al., 2014; Newcomer Johnson et al., 2016). These compounding disturbances to watershed flowpaths have significant biogeochemical consequences (Beaulieu et al., 2014; 2015; Divers et al., 2014; Pennino et al., 2014), particularly during storm events through activation of flowpaths and hydrologic connections to surface and subsurface solute reservoirs.
Two common methods to quantify solute event dynamics are concentration-discharge hysteresis and load-volume curves. Solute concentration-discharge (c-Q) relationships often exhibit hysteresis during the storm hydrograph where concentrations at a particular discharge differ between the rising and falling limb of the hydrograph (Evans and Davies, 1998). These hysteretic patterns can clarify solute sources and active catchment flow paths for any given storm event (Carey et al., 2014; Bowes et al., 2015; Lloyd et al., 2016a; Lloyd et al., 2016b; Duncan et al., 2017; Baker and Showers, 2019). Solute concentrations that increase with rising streamflow are categorized as “transport-limited” indicating that discharge determines mobilization of readily available solute pools, also referred to as “flushing” from near-stream sources (Bowes et al., 2015). Conversely, when solute concentrations decrease with increasing discharge, these solutes are considered “source-limited” due to finite supply that is exhausted and diluted with higher streamflow (Bowes et al., 2015). When solute concentrations remain constant, despite changes in flow, this condition is called chemostasis (Godsey et al., 2009; Thompson et al., 2011).
Another method for quantifying the timing of solute delivery is through the creation of a dimensionless plot—called an LV curve—of cumulative pollutant load versus cumulative runoff volume for each event (Figure 1) (Bertrand-Krajewski et al., 1998). “First flush” is the phenomenon when the majority of the total load (60%–80%) of a given pollutant is contained in the first 20%–30% of runoff volume (Saget et al., 1996; Deletic, 1998; Lee et al., 2002; Barco et al., 2008; McCarthy, 2009; Bach et al., 2010) which would plot above the 1:1 line on an LV curve (Bertrand-Krajewski et al., 1998). Some studies note that first flush is particular to certain contaminants (Kim and Furumai, 2016), while other studies note that first flush occurs only in small sewer catchments (Lee et al., 2002; Zhang et al., 2012) or varies on an event-by-event basis (Saget et al., 1996). The first flush phenomenon is more likely to occur in catchments with more impervious surfaces (Lee et al., 2002) and is highly dependent on the time of concentration (i.e., the length of time needed for water to flow from the most remote point in a watershed to the watershed outlet (Kang et al., 2008). Contaminant mobilization can also follow a middle-flush pattern with continued contaminant mobilization throughout the extent of the hydrograph rise and fall (Surbeck et al., 2006; Qin et al., 2016). In this middle flush scenario, increased effective contributing area of runoff throughout a storm corresponds to an increasing number of large but diffuse catchment reservoirs of accumulated contaminants (Peter et al., 2020). Final-flush behavior is when the largest proportion of pollutant load is delivered in the latter portion of the storm event (Lee and Bang, 2000; Flint and Davis, 2007).
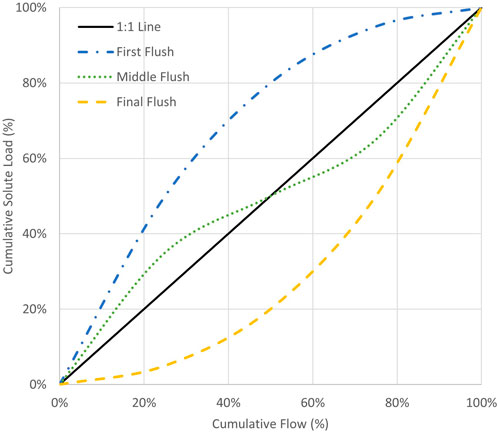
FIGURE 1. Normalized cumulative flow and solute load curves for different types of flush types. Adapted from Qin et al., 2016.
In urban systems, solute event dynamics are complicated because of the variety of potential contributing sources as well as the complex flow paths that result from stream burial, incision, and storm drain inputs (Kaushal & Belt, 2012). Urban solute sources include runoff from upland impervious surfaces carried through storm sewers, infiltration into pervious upland areas and subsequent transport through soil flow paths, flushing of riparian soils, leaking water and sewer infrastructure, as well as sanitary and combined sewer overflows. Variability in travel times of solutes from different sources in different parts of the watershed through a variety of transport mechanisms increases the complexity of understanding stream solute concentrations (Scholefield et al., 2005).
An additional confounding factor in urban stream solute load analysis is sewer overflows which contribute significant pollution and bypass natural catchment flowpaths that could mitigate water quality impacts. Overflows come from both combined and sanitary sewers. Combined sewers are designed so the sewage and stormwater travel in the same pipes. Under dry weather conditions, the pipes only convey sewage, and all flow is directed to the treatment plant; however, during wet weather, the additional stormwater causes the total water flow in the pipe to exceed a fixed threshold and discharges a mix of raw sewage and stormwater directly into surface water. In separated sewers, sanitary and stormwater travel in different pipes and should not interact, but there can be enough infiltration and inflow of freshwater, whether from groundwater or rainfall, to cause surcharge and discharge of the sanitary system to surface water (Kracht et al., 2007; Karpf and Krebs, 2011; Bhaskar and Welty, 2012; Pangle et al., 2022).
Both sanitary sewage and stormwater contribute nitrate (NO3−) to urban streams and can be differentiated using natural abundance stable isotope tracers (Kendall et al., 2007). In particular, δ15N and δ18O values of NO3− can indicate both nitrogen sources and some aspects of terrestrial nitrogen cycling (i.e., denitrification). In comparison, mass-independent Δ17O of NO3− is not affected by denitrification and can thus be used to precisely quantify contributions of unprocessed atmospheric NO3− to surface and groundwater (Michalski et al., 2003). All terrestrial systems have a constant ratio between δ17O and δ18O due to the mass dependence of kinetic and equilibrium fractionations. Because all terrestrial nitrate sources follow this mass-dependent relationship (δ17O = 0.52 x δ18O), they have a characteristic slope called the “terrestrial fraction line”. Deviations from this relationship are known as “mass-independent fractionations” and are conservative tracers indicative of the proportion of unaltered atmospheric NO3−. This mass-independent relationship is imparted to nitrate molecules during interactions in the atmosphere with ozone that lead to excess 17O (Michalski et al., 2003). The anomaly stemming from interactions with ozone between δ17O and δ18O is known as ∆17O, where Δ17O = δ17O–(δ18O x 0.52). Positive Δ17O values are unambiguous tracers of atmospheric deposition in terrestrial and aquatic systems (Michalski et al., 2003; Riha et al., 2014; Rose et al., 2015). Δ17O presents the opportunity to use a two-end-member mixing model to partition atmospheric NO3− (i.e., stormwater runoff) from human and terrestrial sources (i.e., sewage). In contrast, quantification of atmospheric nitrate using the 18O/16O abundances of nitrate, while easier to measure, are highly uncertain due to large ranges in the isotopic composition of 18O in many forms of reactive nitrogen compounds in the atmosphere (Elliott et al., 2019). In urban streams, the potential terrestrial sources are human sewage, fertilizer, and animal waste (e.g., domestic dogs). Sewage is a common nitrate source to urban streams due to pipe leaks and overflows (Kaushal et al., 2011; Divers et al., 2014). While fertilizer can be a significant contribution to total NO3− load in arid urban watersheds (Hale et al., 2014), fertilizer is often hard to detect in watersheds with more frequent precipitation because it does not have much opportunity to build up on the landscape in between storm events. (Elliott and Brush, 2006; Anisfeld et al., 2007; Divers et al., 2014). Pet waste can also be a NO3− source to urban and suburban watersheds (Hobbie et al., 2017), but is generally indistinguishable from sewage using δ15N. Because of prior work in this watershed, both isotopic and inverse modeling, we know that the mass-dependent source is dominated by sewage (Divers et al., 2013; 2014).
While numerous studies have investigated storm event solute loads from urban watersheds (Thompson et al., 2011; Carey et al., 2014; Duncan et al., 2017; Blaszczak et al., 2019), the influences of stream channel burial and sewer overflows are often overlooked, despite the fact that these infrastructure challenges have drastic effects on the routing of stormwater flow, the timing of event responses, and the hydrologic connections between solute sources and the stream (Forgrave et al., 2022). This study uses grab samples from different storm event sizes to highlight unique solute delivery patterns in a buried urban stream. Specifically, we investigate 1) how do solute concentrations and loads change throughout storm events? and 2) how can triple NO3− isotope analyses be used to distinguish timing and load percentages of atmospheric and sewage-derived sources? We expect to see a difference between a first flush of runoff chemistry such as atmospheric NO3− and road-related solutes such as chloride from road salt, and then potentially a second flush of sewage-related solutes from overflows after pipes exceed capacity. This research will reveal the storm event-driven solute dynamics of buried urban streams and highlight the important impacts to watershed connectivity and biogeochemical loads. To reduce urban surface water contamination, these solute dynamics must be an overarching consideration in urban stream restoration activities, stormwater management, and nutrient load planning.
Nine Mile Run drains 15.7 km2 of Eastern Pittsburgh, PA and adjacent communities. The watershed is predominantly urban land use (66%); the remainder is 18% forested, 10% grassy field, and 5% barren land (PAMAP Program Land Cover for Pennsylvania, 2005) (Figure 2B). Half of the watershed is served by combined sewers and half by separated storm and sanitary sewer networks (Figure 2A). A majority of the headwaters of Nine Mile Run were buried in the 1920s (Historic Pittsburgh Maps, 2021) during a time of rapid residential development (Hopkins et al., 2013). In combined sewer systems, buried stream flow was often deliberately routed into the sewer network (Hopkins and Bain, 2018). Today, an estimated 78% of all channels in the Nine Mile Run watershed are buried (Rivers 2nd Nature, 2006), with only the downstream portion in a restored surface channel (Figure 2). This restoration project was completed in 2006 and cost over $7.7 million (2007 dollars) to restore the stream channel with the goal of promoting ecological recovery (Bain et al., 2014). However, the restoration effort was restricted to the stream valley itself without focusing on the upstream watershed causes of stream impairment and thus did not mitigate large storm flows (Forgrave et al., 2022).
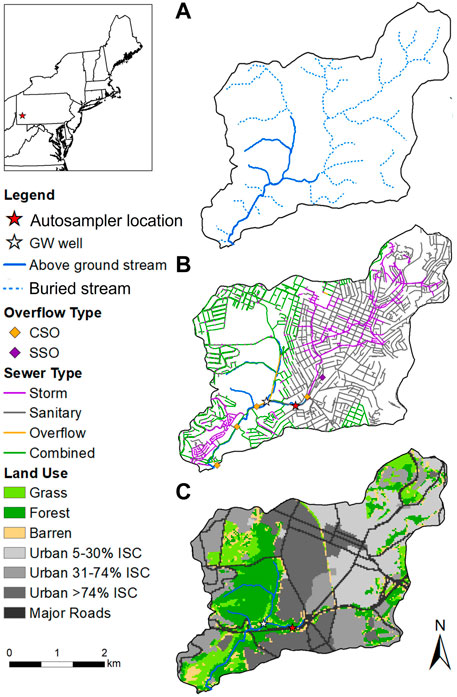
FIGURE 2. Maps of the Nine Mile Run watershed showing the surface stream (solid blue lines) and location of autosampler (red star) along with (A) locations of buried stream (dotted blue lines), (B) sewer pipe networks and overflows and (C) land use categories. The “overflow” sewer type is a large collector pipe to collect the water from several sewer pipe outlets and transport it to a location farther downstream to overflow.
In addition to flooding issues, Nine Mile Run is strongly influenced by sewage inputs at both low flows and storm events. Previous research using inverse modeling and dual NO3− isotope analysis on biweekly grab samples from Nine Mile Run indicates that up to 94% of the NO3− is sewage-derived at baseflow conditions, and 66% of during storm events (Divers et al., 2014). The pollution is a result of leakage from a sewage system developed in the early 1900s made of concrete, brick, and vitrified clay pipes installed within the stream channel (Hopkins and Bain, 2018). In addition to leaks, Nine Mile Run receives inputs from four combined sewer overflows (CSOs) and one sanitary sewer overflow (SSO) (Figure 2A), however, there are an additional 38 maintenance holes for access to the main trunk sewer that runs alongside the stream. Several of these maintenance holes routinely overflow during storm events, and in some instances, the maintenance hole cover is completely blown off during a high flow storm event. The City of Pittsburgh is in the top three cities in the U.S, for highest number of CSOs (EPA, 2004), and the overflows can be triggered by precipitation events as low as a tenth of an inch (ALCOSAN, 2012). While sanitary sewers are, in theory, not supposed to be connected to the storm drainage system, the authors have observed and the local watershed organization has acknowledged SSOs overflowing during storms, indicating significant stormwater flow in the sewer pipes and flow that exceeds capacity, resulting in overflow to the stream (Rivers 2nd Nature, 2004; UpstreamPGH, 2020).
In a plunge pool 300 m downstream of where the stream first emerges from underground pipes, we installed an ISCO autosampler (Teledyne Isco, Lincoln, NE) secured in a metal barrel and activated through a cell phone modem. The autosampler was programmed to collect grab samples at 15-minute intervals during storms, and then switched to every 30 min after the storm to collect the hydrograph recession. Water samples were collected from the autosampler within six hours of the end of collection and brought to the lab for filtering and partitioning.
One subset of each sample was vacuum-filtered through 0.45 µm filters and frozen for analysis of nitrogen species, anion concentrations, and NO3− isotopes. Nitrate (NO3−), nitrite (NO2−), ammonium (NH4+), and orthophosphate (PO43-) concentrations were measured on a Lachat Quickchem 8,500 Flow Injection Analysis (Hach). Fluoride (F−), chloride (Cl−), and sulfate (SO42-) ion concentrations were measured on a Dionex ICS2000 Ion Chromatograph. Nitrate isotopes (δ15N-NO3-, δ18O-NO3-) were measured on an Isoprime Continuous Flow Mass Spectrometer following the denitrifier method (Sigman et al., 2001). Samples were corrected using international reference standards USGS-32, USGS-34, USGS-35, and IAEA-N3; these standards were also used to correct for linearity and instrument drift. Samples with more than 2% nitrite of the total oxidized nitrogen (NO2− + NO3−) had the nitrite removed through sulfamic acid reduction (Granger and Sigman, 2009) prior to isotopic analysis. Δ17O-NO3- values were analyzed similarly to δ15N and δ18O values but with the additional step of the N2O gas heated to 800°C in a gold tube where it decomposed into N2 and O2 gases (Kaiser et al., 2006) prior to analysis by the IRMS. The remainder of each sample was left unfiltered, frozen, and then later analyzed for total nitrogen and total phosphorus on the Lachat combined with a persulfate pre-digestion (Hosomi and Sudo, 1986).
Water level was collected with a HOBO pressure transducer (Onset Computer Corporation, Bourne, MA) in a stilling located less than 100 m upstream from the autosampler location, between where the stream emerges and the plunge pool. The stage-discharge relationship has already been established and was shown to be consistent with the USGS gage (03085049) that existed in this watershed from 2006 to 2009 (Kolmogorov-Smirnov test, p < 0.0001).
The load is the total mass in kilograms of a given solute that is mobilized in a given storm event. Loads of each solute for each storm were calculated by multiplying the concentration (in mg/L) by the flow (in m3/s) for each sample, then multiplying by the total number of seconds between each sampling interval. Cumulative mass load percent for a given solute was compared to cumulative flow volume percent at each sample interval to create an LV curve (Bertrand-Krajewski et al., 1998). For this study, the numeric thresholds used to define first flush were 80% of the total solute load delivered in the first 30% of the storm event, and 80% of the total load not delivered until 80% of the total event flow to be “final flush” and everything in between as “middle flush”. Due to fast-rising limbs observed there are large jumps in cumulative discharge, increasing by nearly 40% in a single 15-minute time interval.
For some storm events, the autosampler did not capture the entirely of the rise and recession due to large storm size, imprecise weather predictions, or technical difficulties in remotely triggering autosampler initiation. In these cases, the calculated event loads only account for the proportion of the total event that was successfully collected via the autosampler. We recognize that missing a portion of the storm in the data could potentially bias the LV analysis and have noted on figures when part of the storm event is missing. However, with the number of storms and the fact that different portions are missing in the different events collected, the data still allows for generalized findings on the average solute load response across a range of event sizes.
For each storm event collected with the autosampler, we use a two-end-member mixing model to determine the fraction of the total nitrogen load contributed by atmospheric sources and sewage (Michalski et al., 2004; Hale et al., 2014). Although prior studies have conducted source apportionment in Nine Mile Run using dual nitrate isotopes (Divers et al., 2014) and inverse modeling (Divers et al., 2013), here we use a mass-independent anomaly of the least abundant oxygen isotope (17O) in the nitrate molecule following Eq. 1 below.
Because Δ17O is not fractionated by biological processes, it is a conservative tracer of atmospheric nitrate and can be used for more precise source apportionment relative to the δ15N and δ18O values of nitrate. This approach is particularly powerful in urban systems like Nine Mile Run that are dominated by two sources: untreated sewage and atmospheric nitrate from stormwater runoff (Divers et al., 2013; 2014). The endmembers used for load apportionment were Δ17O = 21‰ for atmospheric nitrogen and Δ17O = 0‰ for sewage. The atmospheric value is the average from locally-collected, event-integrated precipitation from 43 events over a full year [Δ17O = +20.9 ± 3.8‰) (Supplementary Figure S1)]. To account for the extreme within-event variability reported for Δ17O values of precipitation nitrate (Rose et al., 2019), we designed a large-volume precipitation collector to sample throughout the entire precipitation event and measure volume-integrated Δ17O values. The mean Δ17O value and range from all precipitation samples collected falls within the range of published values (+20 to +30‰, Michalski et al., 2003). The variability in this end member for atmospheric Δ17O is due to seasonal differences in photochemical oxidation pathways (Michalski et al., 2003). Δ17O values in in precipitation sample collected were seasonally variable, however, there is also considerable event-to event variation within a given season, so we chose to represent atmospheric nitrate inputs with the average Δ17O value for the precipitation end member across all sampled storms to keep a consistent method across all events collected. Based on the standard deviation of observed Δ17O values (±3.8‰) across storm events, the maximum error introduced by using an average Δ17O value as the atmospheric end member is less than 5% of the load attributed to the atmospheric sources.
The atmospheric fraction (fatm) of the nitrate load for each collected water sample was determined with Eq. 3 and the fraction from sewer (fsewerfrom Eq. 4. The total NO3− load was calculated as the NO3− concentration multiplied by discharge and these two fractions to calculate total load (in mass of NO3-N) from each source Eqs 5, 6.
We collected a total of five storm events through 2019 and 2020, for four of these events (Storms 1, 3, 4 and 5), samples were collected at 15-minute time intervals for the whole event and sample collection for Storm 2 started at 15-minute and then switched to 30-min to spread out the samples and capture the complete recession (Table 1). Three storms (Storms 2, 3, and 5) had multiple discharge peaks throughout the event corresponding to multiple peaks in precipitation, while the other two summer storms (Storms 1 and 4) had a single discharge rise and recession. Below we briefly describe the hydrological and chemical characteristics of each of the five storms where these differences are compared across storms in Figure 3.
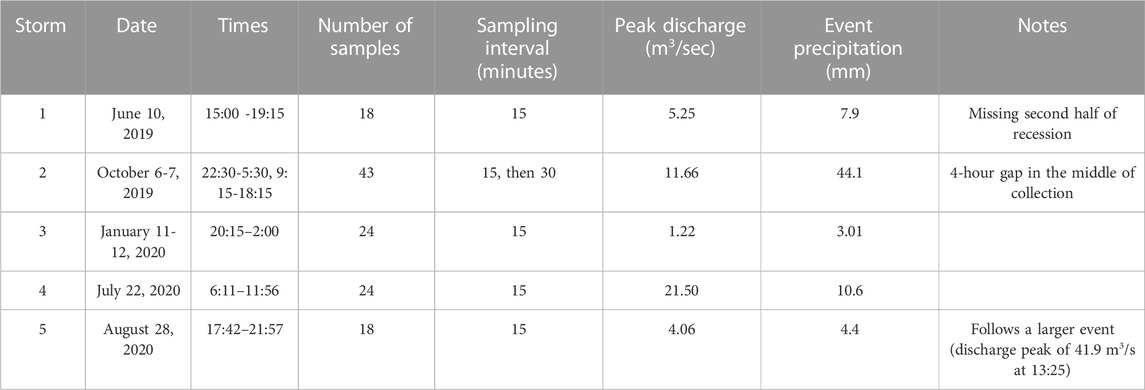
TABLE 1. List of grab sample storm collections. Precipition amounts listed are the amount directly before the peak discharge captured by the autosampler rather than the entire event from start of precipitation to finish to account for storms where it rains throughout the entirety of the event causing subsequent discharge peaks after sampling concluded.
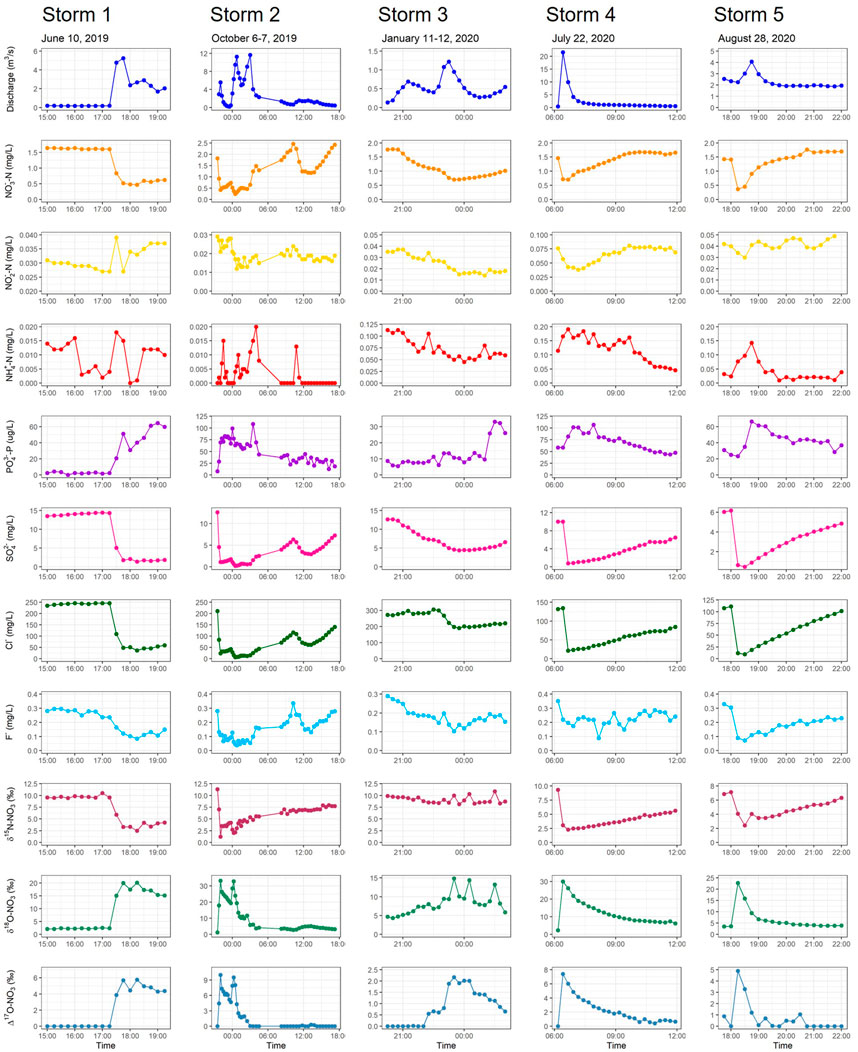
FIGURE 3. Time series plots for Nine Mile Run discharge and grab sample chemistry for five storm events. Each column is a different storm event while each row is a different chemical parameter. Note different y-axis scale ranges for different storm events.
Storm 1 discharge peaked at 5.25 m3/s, rising to this peak discharge in 30 min, then had a secondary peak in flow an hour later after another pulse of precipitation. Only nine grab samples were collected during Storm 1 because the autosampler started collecting before the storm event occurred, thus missing most of the recession. As discharge increased, NO3−, Cl−, F−, and SO42- concentrations rapidly decreased, while PO43- concentrations increased (Figure 3). NH4+ initially increased at the beginning of the storm, subsequently decreased, and then increased again. δ15N-NO3- values decreased and δ18O-NO3- values increased along with the discharge (Figure 3).
Storm 2 was an extended rainfall event over several hours that produced several consecutive discharge peaks where the largest peak was 11.6 m3/s. After the first collection of 24 grab samples, we restarted the autosampler and continued sample collection for the entire recession. However, there is a 4-hour gap during this restart process (5:15 to 9:30am). With the initial increase in flow, NO3−, F−, and Cl− concentrations decreased sharply and then decreased again with subsequent discharge peaks followed by an increase in concentration during the recession. In the case of NO3− and F−, recession concentrations were higher than the pre-storm concentrations (Figure 3). PO43- concentration increased with the initial runoff inputs and then progressively decreased throughout the rest of the sample collection. δ15N-NO3- values decreased dramatically with the initial discharge peak and then steadily increased throughout the rest of the flow event. δ18O-NO3- values increased with the first two discharge peaks (2019-10-06 22:00 and 2019-10-07 0:15), then decreased back to baseflow values for the rest of the sample collection period.
Storm 3 was a small winter rain event (3.0 mm of precipitation) where the stream rose to two discharge peaks of 0.75 and 1.25 m3/s. NO3− concentration slowly decreased in contrast to the abrupt changes seen in the summer and fall storms (Figure 3). NH4+ and F− also decreased in concentration but not as smoothly as NO3−. PO43- concentration slowly increased throughout most of the storm, but then increased suddenly at the end of the event. Cl− concentration increased slightly with the first discharge peak and then decreased with the second peak. δ15N values initially decreased slightly but then increased several times in the latter half of the event. δ18O-NO3- values followed a similar pattern, but the initial change was a gradual increase in δ18O-NO3- values followed by three more increases in δ18O-NO3- values later in the event (Figure 3).
Storm 4 was an intense summer storm that rose to a peak discharge of 21.5 m3/s in only 15 min in response to 0.42 mm of precipitation (Figure 3). NO3− and Cl− concentrations decreased rapidly as streamflow increased. F− concentrations decreased by 0.1 mg/L in response to the initial input of stormwater but then stayed fairly constant for the remainder of the event. PO43- and NH4+ concentrations both sharply increased with increasing discharge and then decreased gradually throughout the rest of the event. δ15N-NO3- values decreased sharply and δ18O-NO3- values increased sharply along with the sudden discharge increase and then both values slowly returned to pre-storm conditions as the storm peak flow receded.
Storm 5 was another summer storm where the autosampler collected the secondary storm peak (4.1 m3/s) after a much larger initial discharge rise of 41.9 m3/s (Figure 3). Total precipitation for the whole event was 52.0 mm while the precipitation directly before ISCO collection was only 4.4 mm. Concentrations of NO3−, Cl−, SO42-, and F− decreased then slowly increased throughout the recession. PO43- and NH4+ concentrations increased with streamflow and decreased afterward. δ15N-NO3- values decreased and δ18O-NO3- values increased along with discharge, but δ18O-NO3- values returned to pre-storm conditions before δ15N-NO3- values.
Most solutes show clockwise hysteresis patterns in Storms 1, 3, and 4 (Figure 4) suggesting sources that are quickly connected to the stream via fast flow pathways such as pipes, with the exceptions of PO43- which is counter-clockwise in these events and NH4+ which is counterclockwise in Storm 4. All solutes in Storm 2 have a complex hysteresis with multiple loops in different directions corresponding to the several discharge peaks throughout the storm event. For Storm 5, most solutes show a “figure-8” pattern with an initial counterclockwise solute dilution, followed by concentration increase during discharge recession. This is likely because Storm 5 is a smaller storm directly after a much larger storm that was missed by the autosampler so the initial start of the plotted hysteresis loop is affected by the recession of the previous storm.
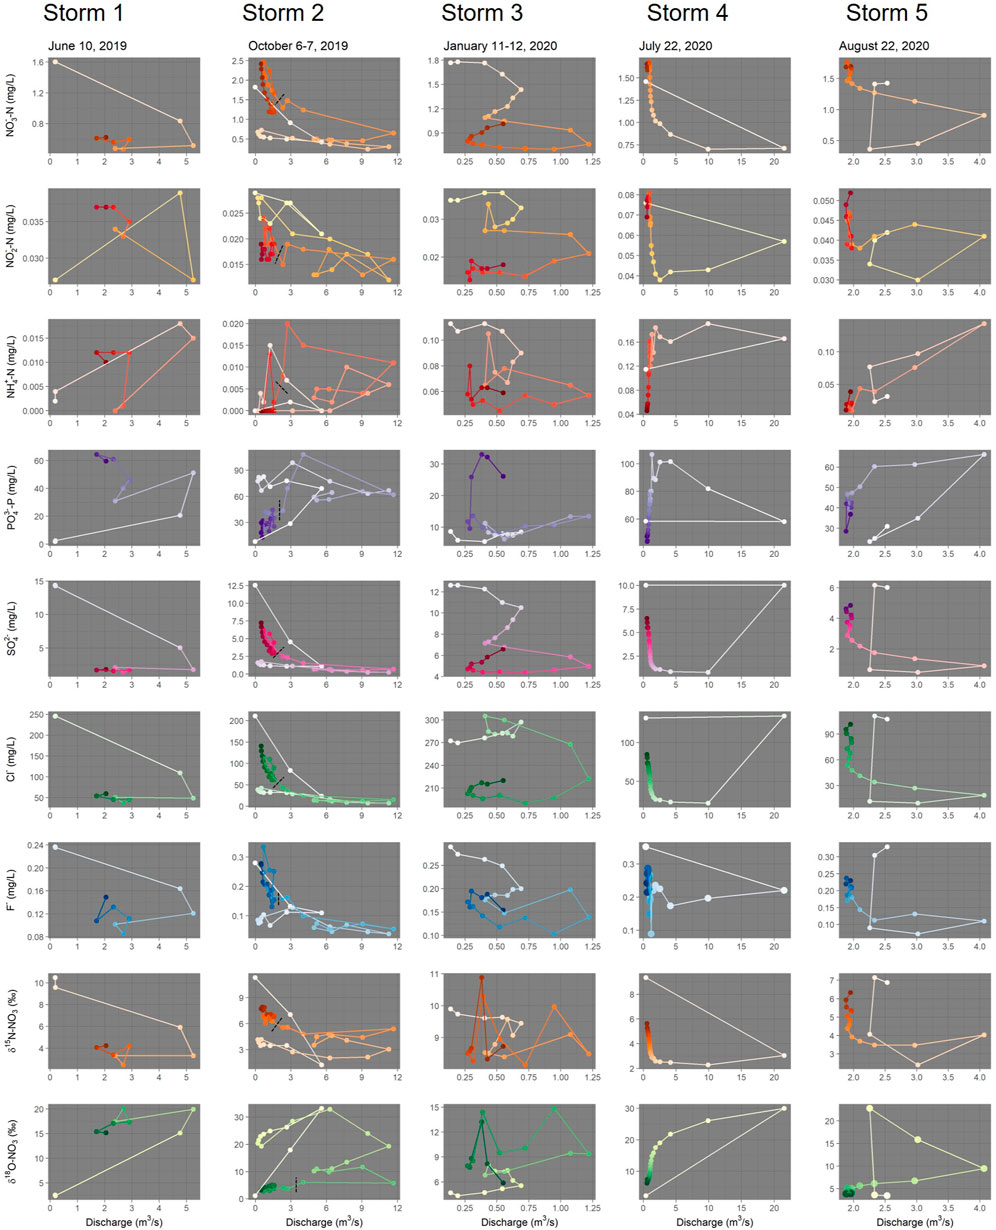
FIGURE 4. Hysteresis for solutes collected by the autosampler for each storm event. Each column is a different storm event while each row is a different chemical parameter; the color goes light to dark over time with white at the beginning of the event and the darkest color at the end. Note different axis scales for different storm events. Black dotted lines on Storm 2 indicate the 4-hour gap in collection.
Event solute loads varied widely across the five storm events for each solute, but the largest event-to-event variation was in PO43-, where loads were 88x larger in Storm 2 than in Storm 3. The highest overall load of NO3−, PO43-, F− and Cl− was exported from the longest storm (Storm 2), while the largest mass of NH4+, NO2−, and SO42- was in the storm with the highest peak discharge (Storm 4) (Table 2; Table 3).
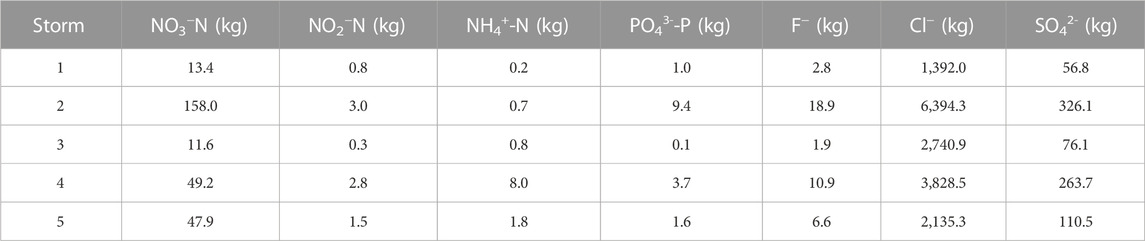
TABLE 2. Solute loads for all storm events collected with the autosampler.
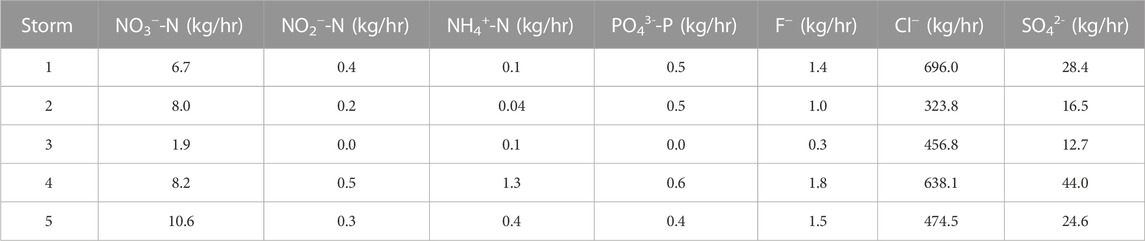
TABLE 3. Solute loads for all storm events normalized by event duration.
In this study, the timing of solute loads varied by event and parameter (Figure 5). Two notable solutes are Cl− and SO4 in Storm 4 where 69% and 75% of the mass load, respectively, are delivered in the first 15 min of the storm event which also coincides with 40% of total event runoff, but this is still categorized as middle flush. Conversely, the NO2− and NO3− loads are delivered more towards the end of Storm 4 where 80% of the total mass load for NO2− and NO3− is delivered at 86% and 89%, respectively, of the total event runoff. In other events with less rapid increases in discharge compared to Storm 4, SO42- and Cl− still plot above the 1:1 line indicating solute delivery that slightly precedes the comparable percentage of total water volume. In Storms 1 and 3, all solutes except PO43- have cumulative load increase faster than cumulative discharge. In Storms 2 and 5, which have multiple discharge peaks, solute load delivery changes mid-storm between the multiple discharge peaks. In Storm 2, there is a first flush of SO42- and Cl− and then they lag flow for the rest of the event, while NO3− is equal to flow for the first 10% of the event and then lags after stormwater volume for the rest of the event (Figure 5). PO43- cumulative mass lags cumulative flow in all storm events except for the second half of Storm 5.
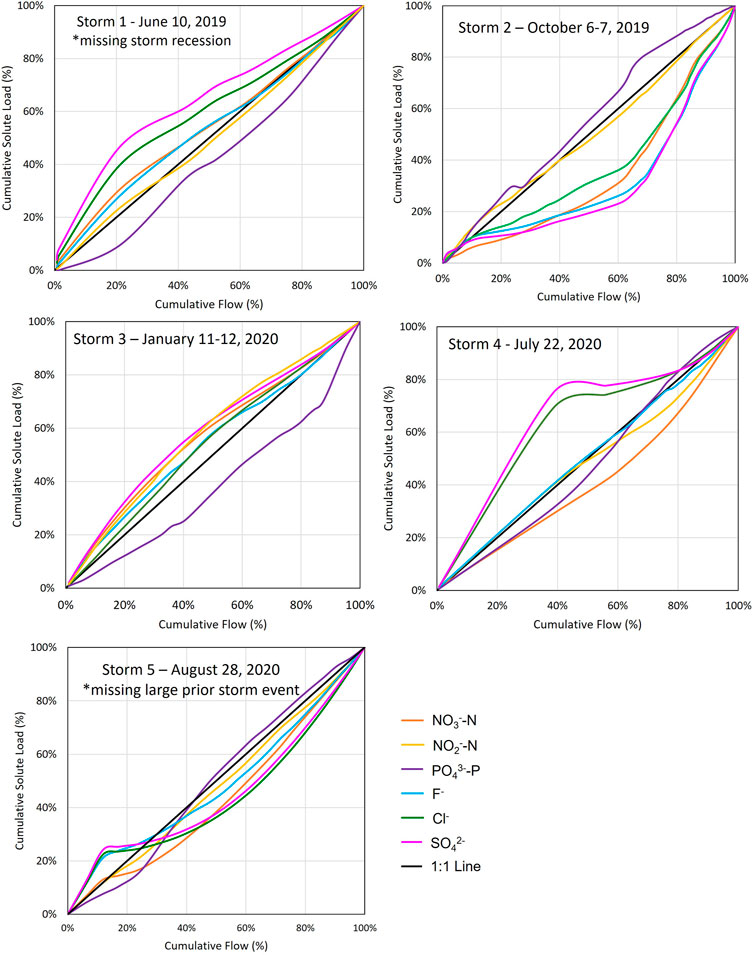
FIGURE 5. LV curves for each storm event collected by the autosampler. The 1:1 line indicating uniform solute delivery is in black. The intercept of these plots represents beginning of autosampler collection, not nessarily beginning of storm flow.
For all grab samples, δ15N-NO3- and δ18O-NO3- values in the pre-event sampling (after autosampler initiation but before discharge rise) are within the range of δ15N and δ18O values of sewage-derived NO3−, while Δ17O-NO3- are zero. In the beginning of each event, δ15N-NO3- values decreased while δ18O-NO3- and Δ17O-NO3- values increased as impervious surface runoff delivered atmospherically deposited NO3−, and then returned to a predominantly sewage source for the rest of the event (Figure 6). Although the NO3− load from the atmosphere ranges from 2.3% to 23.6% of total NO3− load across the five storm events as indicated by the Δ17O-NO3- partitioning, (Table 4; Figure 7), the majority of the NO3− load exported from all storms is sewage (76%–98%). The lowest atmospheric NO3− contributions occurred during the longest-duration storms characterized by several discharge peaks (Storms 2, 3, and 5). This is because the majority of the atmospheric NO3− is delivered from the first peak from rain washing atmospherically deposited dry N deposition off the landscape, particularly from directly connected impervious surfaces, while successive peaks have increasing percentages of sewer-derived NO3−. These three events with lower atmospheric deposition contribution are also the events where the autosampler missed the first peak of the storm, making the calculated mass from atmospheric deposition conservative.
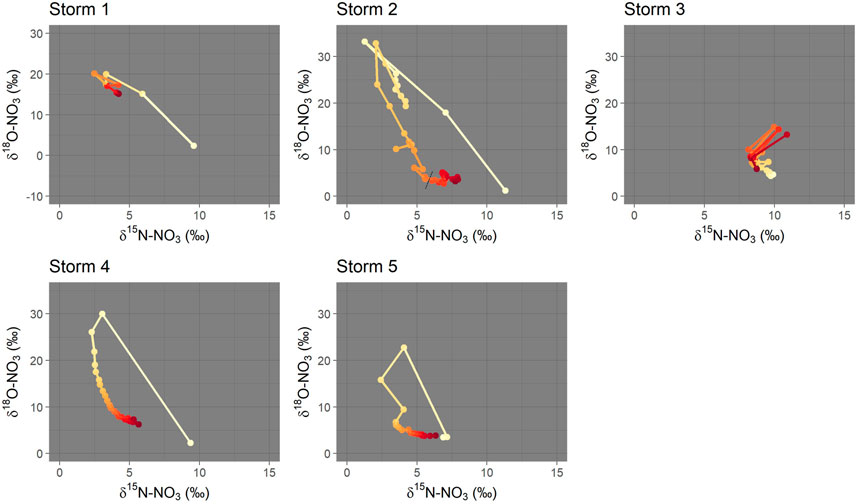
FIGURE 6. Dual plot of NO3− isotope values for each event collected by the autosampler. Time is represented in color from light yellow at the beginning of the storm event to dark red at the end. The black dotted line in Storm 2 indicates the 4-hour gap in sample collection.
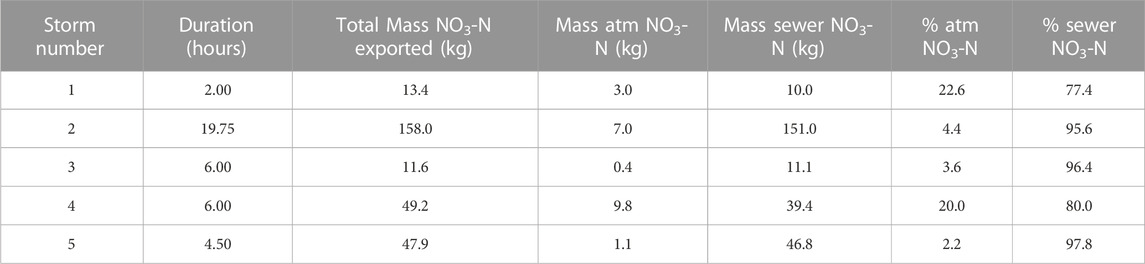
TABLE 4. Load calculations of atmospherically deposited and sewer-derived NO3− from grab sample data collected by the autosampler.
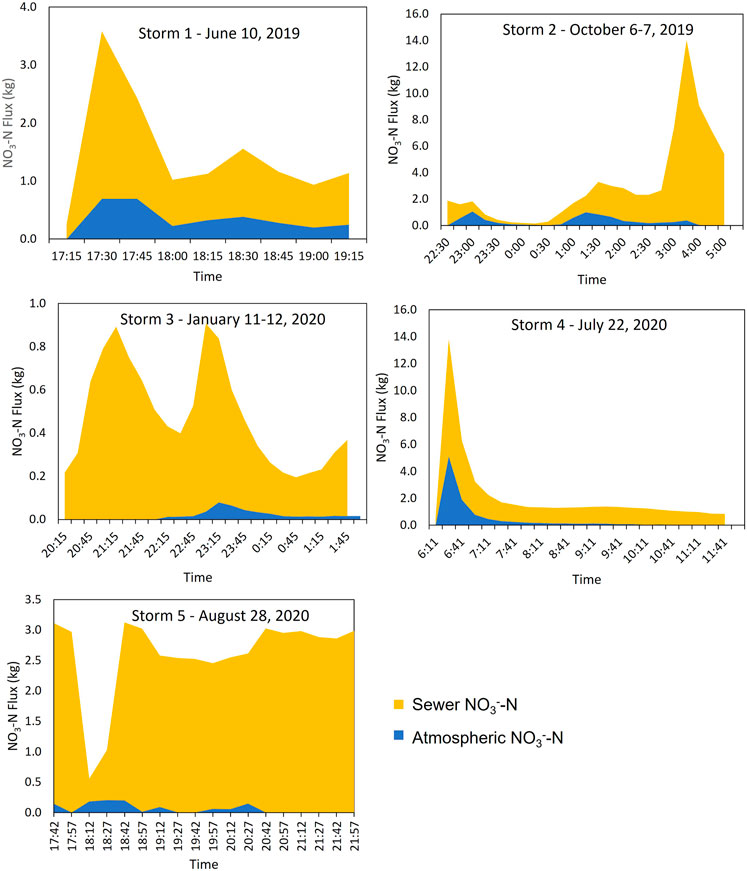
FIGURE 7. Time series plots of NO3− loads separated into sewer and atmospheric sources for storms collected with the autosampler. Note different y-axes ranges among storm events.
More NO3− from atmospheric deposition is exported during storms that have a higher peak discharge (R2 = 0.94); however, peak discharge is only weakly correlated (R2 = 0.24) with the relative percentage of atmospheric contribution compared to sewage. One caveat to note is that the relative percentages are biased by the portion of the storm event collected (inconsistent due to issues described previously, as well as inaccuracies in weather prediction). For example, storms when more of the recession was collected, or the storm event occurred immediately after a previous storm, have a higher percentage of sewer-derived NO3− and less atmospheric contribution. Due to the small number of storms collected with the autosampler, attempts to break these storms down further run into issues of statistics of small numbers and preclude quantitative evaluation of these relationships.
Nine Mile Run is distinct among urban streams documented in the literature for the high percentage of buried channels (Forgrave et al., 2022). This efficient drainage leads to fast runoff responses to rainfall, and rapid dilution of baseflow chemistry. NO3−, NO2−, Cl−, F−, SO42- are diluted in every event, while PO43- always increases in concentration, and NH4+ responses vary among events (Figure 3). The differences in magnitude and direction of change among the various solutes demonstrate that different solute pools within the watershed are activated at different times throughout a storm event.
This dilution pattern is more apparent in the c-Q hysteresis loops (Figure 4) where the majority of solutes rotate clockwise during hysteresis, i.e., higher background concentrations are diluted by surface runoff. In other urban studies, clockwise hysteresis loops have been attributed to pollutants rapidly entering the stream from surface runoff or “new water” while counter-clockwise hysteresis implies slower groundwater inputs or “old water” (Baker and Showers, 2019; Duncan et al., 2017; Lloyd et al., 2016). The clockwise hysteresis observed in this study is consistent with fast solute inputs, but likely from both surface and subsurface flowpaths as the distinction between them is blurred by buried surface waters receiving contribution from storm drainage and considerable infiltration from shallow soil flowpaths.
Exceptions to this overall pattern are PO43- and sometimes NH4+ which show counter-clockwise flushing behavior, suggesting they are delivered from slower subsurface flowpathsthat become hydrologically connected to the stream during the event (Scanlon et al., 2001; Butturini and Sabater, 2002; Duncan et al., 2017). Variable NH4+ event responses result from its low concentration and are harder to attribute to a particular source. Higher PO43- concentrations can be evidence of reducing conditions as PO43- is released during break down of Fe and Al oxides in reducing conditions (Patrick and Khalid, 1974). These increases in PO43- correspond with higher δ15N-NO3- values (Figure 4), which is indicative of sewage, so these reducing zones could be near the pipes and subsidized by sewer leaks, creating patches of variably saturated, hot spots of biological activity, which are then activated during a storm event (McClain et al., 2003; Bernhardt et al., 2017).
An additional complicating factor to the observed PO43- concentration dynamics is additions of orthophosphate to the municipal drinking water supply starting in 2019. The Pittsburgh Water and Sewer Authority started introducing 1700 μg/L PO43- in five locations through the water supply network to build biofilm on the interior walls of the pipes and prevent corrosion with a goal of concentrations of 500 μg/L at the tap (Balangoda et al., 2023; submitted; Spencer-Williams et al., 2022). Due to the need to pressurize drinking water distribution systems as well as the advanced age of the pipes, this network leaks an estimated 40%–50% of its total volume, resulting in at least 28 million gallons per day of phosphate-enriched water subsidizing the groundwater and surface water every day and contributing to storm event solute loads (Balangoda et al., 2023; submitted). While we cannot definitively distinguish whether phosphate observed in storm events originates as leaks from sewer pipes, drinking water pipes, or natural sources, based on our observations in this and previous studies (Divers et al., 2014; Delesantro et al., 2022), we surmise that infrastructure leakage is the dominant source of both phosphate and ammonium.
Even as concentrations decrease for most parameters during storms, the solute loads increase because of the large volume of stormwater flowing through the stream. However, the LV curves from grab sample collections reveal that not all solute loads increase at the same time. Additionally, different sources of the same solute can respond at different times, and not all storm events have the same responses (Table 5). Sewer NO3−, NO2−, PO43-, and F− show final flush behavior in more events, where Cl−, SO42-, NH4+, and atmospheric NO3− are more commonly middle flush, though no solute is completely consistent across all events (Figure 5).
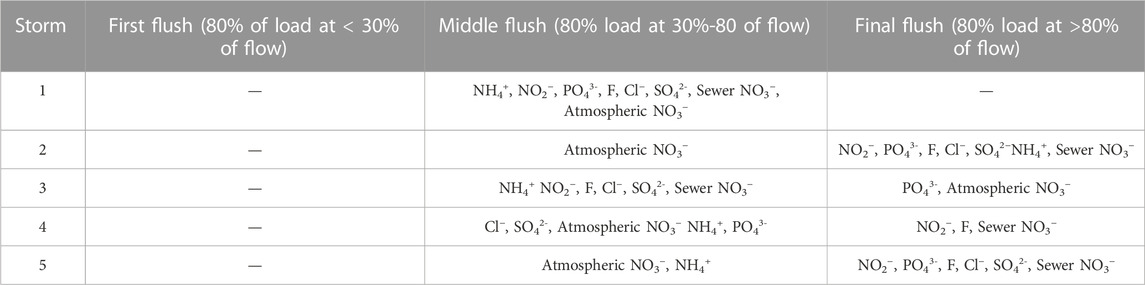
TABLE 5. Solute loads categorized into different flushing behavior.
It is also important to note that the amount of the total rise and recession captured for any given autosampler event can introduce considerable bias to these thresholds.
No solutes exhibited first flush behavior. The closest species/storm pair was atmospheric NO3− in Storm 2 where it just barely missed threshold for first flush, reaching 80% of total mass load at 36% of the total flow. The lack of first flush is an interesting finding because it contrasts with the conceptual model of urban streams as dominated by surface runoff from impervious surfaces (Shuster et al., 2005; Schueler et al., 2009). Studies that have shown a significant first flush in urban areas have mostly been in small stormwater catchments that do not have any interaction with the subsurface (Hathaway et al., 2012; Yang and Toor, 2016). In Nine Mile Run, this rapid first addition of stormwater does not have large amounts of solutes when compared to the loads of the rest of the event. Additionally, not all the landscape area is connected to the storm drainage system (Figure 2). Other urban stream studies have made a distinction between impervious area and directly connected impervious area (Roy and Shuster, 2009; Baruch et al., 2018), a difference that is particularly relevant for buried streams where there are fewer connections between the landscape surface and the stream. Buried streams only receive surface runoff from the storm drainage network, not direct inputs from the landscape itself. Areas of land with no storm drainage (purple lines in Figure 2) will not drain to the buried stream, so a smaller portion of the total impervious surface is actually connected impervious area that could contribute to a first flush phenomenon.
The middle-flush scenario, when load increases linearly with discharge throughout the event, was the most common pattern among the different solutes and events in this study as well as others (Qin et al., 2016; Peter et al., 2020). One likely theory for the dominance of middle flush responses in urban watersheds is that pervasive contaminants exist in the urban subsurface in nearly unlimited quantities compared to the runoff volumes (Peter et al., 2020). As some solute pools become depleted, the increase in effective contributing area can activate additional solute reservoirs throughout the watershed (Qin et al., 2016, Knapp et al., 2022).
Storms with a longer portion of the total collected event as recession (Storms 2 and 4) tend to have a higher percentage of sewer-derived NO3− as well as more solutes exhibiting final flush behavior. In this case, a longer recession results in storm events where more of the water samples are collected are on the falling limb of the hydrograph. It is possible that these patterns of final flush and increased sewer NO3− are in all events, but this behavior was missed due to truncated recession from limited grab sampling capacity. The impact of the increased solute load is seen when comparing Storm 3 and Storm 4 which have the same overall duration of collection time, but for Storm 3, the flow fluctuates through multiple storm peaks, while for Storm 4, there is one single peak and then the remainder of the event is recession. These storms with longer recessions also have higher loads of PO43-, Cl−, and F−, supporting relatively higher wastewater contributions as they are all additives to drinking water, and in the case of PO43- also present in both human waste and detergents, and thus present in wastewater.
Deconvolving these patterns involves both spatial and temporal dimensions due to the similarity in chemistry among the various solute pools as well as spatial connectivity among flowpaths. For example, PO43- can come from organic matter decomposition in soils, flushing of reduced soils, drinking water leaks, or sewer pipe leaks, and these various pools contribute different amounts throughout a storm event. While atmospheric NO3− and sewer-derived NO3− can be distinguished with nitrate isotopes, both soil-mediated sewer leaks and direct inputs from overflows are characterized by higher δ15N-NO3- values. Additionally, the various flowpaths are spatially intertwined such as in the case of combined sewer pipes intentionally designated to carry both stormwater and sanitary sewage, but also through unintentional connections such as exfiltration and infiltration (Bhaskar and Welty, 2012; Pangle et al., 2022). This pipe exfiltration is even more significant during storm events when sewer pipes are at capacity.
Part of the timing differences in NO3− load delivery is due to location and the relative contribution from multiple sources among events. Dual NO3− isotope data indicate a mix of sewer and atmospheric sources throughout each storm event (Figure 5), and atmospheric nitrate loads based on Δ17O measurements suggest that sewer NO3− contributions are pervasive throughout all storm events and are at least 75% of the total NO3− load in any storm event.
Storms following a relatively dry period (Storms 1 and 4) have more atmospheric deposition sourced NO3− in the storm load because during the dry period, reactive nitrogen particulates and aerosols accumulate on landscape surfaces before washing off into the stream during the storm event (Riha et al., 2014) (Figure 3; Table 3). Storms with a long recession (Storms 2 and 4) or those immediately following another event (Storms 3 and 5) have a higher percentage of sewage-derived NO3− because once the atmospheric deposition source has been depleted, sewage-derived NO3−—which is an effectively unlimited source—dominates (Figure 3; Table 3). Additionally, storm events with a longer duration of precipitation, take more time to return to baseflow conditions and thus have a longer period of time in saturated soil conditions whereby wastewater is more directly and quickly conveyed to the stream.
It is surprising that there were no thresholds in event size or intensity that could be connected to the distinctive chemistry of an active combined sewer overflow. This contradicts our hypothesis, where we expected to see a distinction between runoff chemistry and sewage overflows. While it is possible that more distinct thresholds of chemical change would be more apparent if more events were sampled, the solute event loads we observed in this study show flushing of various subsurface solute reservoirs with considerable sewer influence in all sizes of storms in all seasons.
As other studies have noted, the connections between sewer systems and surface waters vary in both space and time (DeSilva et al., 2005; Delesantro et al., 2022). Breaks and fractures in the sewer network are dependent on pipe age, pipe material, topography, intrusion by tree roots, and other disturbance factors. The height of the water table relative to the sewer pipes is also very important for determining how much infiltration or exfiltration occurs from these sewer pipe fractures (Divers et al., 2013; Duncan et al., 2017). This connectivity changes over time due to seasonal changes in water table elevation as well as changes in the pipe such as pipe fractures becoming blocked with debris and no longer leak, or debris can be washed away by heavy storms and increase leakage (DeSilva et al., 2005). These factors combine to create the event-specific solute behavior observed in this study where the majority of nitrate is sewer-derived but not necessarily from direct contributions from a sewer overflow.
Solute loads in buried urban streams respond rapidly and variably to storm events. In this study, by considering both solute concentrations and load patterns, we clarify the timing and delivery mechanisms associated with multiple solutes (Figure 8). Grab samples from storm events of different sizes and seasons reveal three different solute flowpaths that vary in relative importance through the course of a storm event: 1) elevated background concentrations of NO3−, NO2−, Cl−, F−, SO42- are diluted by runoff during storm events, and increased PO43- concentrations and δ15N- NO3− values during storms potentially arise from (2) direct inputs from sewer overflows as well as 3) flushing of biochemically active reducing soil zones near sewer pipes. Nitrate isotopes further reveal that NO3− responses are driven by inputs of accumulated atmospheric deposition in the early parts of the storms, whereas wastewater-derived NO3− is present throughout the storm events and especially dominant during storm recession. Solute load responses also reflect the dominance of hydrologic control on solute loads as seen by all solutes showing middle flush or final flush delivery patterns. It is important to note that while we present these different flowpaths as distinct, as shown in Figure 8, they are not completely sequential, as flushing of near-pipe reducing zones and direct sewer overflow inputs tend to occur at the same time in storm events. These two subsurface flowpaths are coupled due to infiltration of shallow subsurface event water into sewer pipes triggering overflow events as well exfiltration of sewer solutes that will drain through the shallow subsurface during storm recession or remain in the near-pipe sediments to be flushed in subsequent storm events.
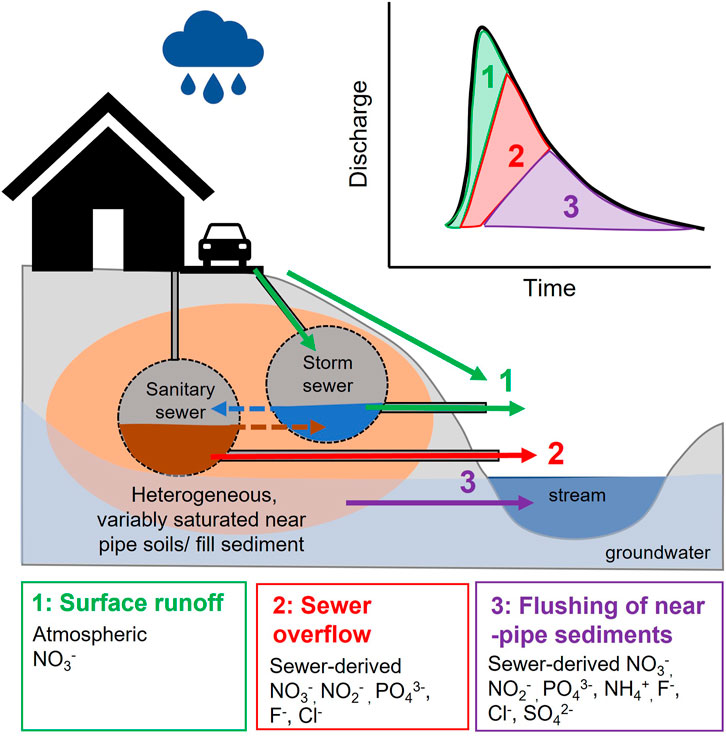
FIGURE 8. Conceptual diagram that shows the main solute pools in urban watershed and the sequential and overlapping timing if the flowpaths connecting these solute pools to the stream throughout a storm event. While the sewer pipes are shown at similar depths, this is not mean to portray actual pipe locations or scale.
The results presented here expand our understanding of the storm event solute transport in a largely buried urban stream network, through the multitude of solutes and isotopes measured and analysis of cumulative loads. Despite their prevalence in urban areas (Napieralski and Carvalhaes, 2016), buried streams are understudied due to the difficulty of accessing and sampling. The unique situation of Nine Mile Run where 98% of the original stream channels are buried allows for transferrable insights into how buried streams interact with urban infrastructure and the effects of this hydrologic connectivity on downstream loads. While non-buried urban streams also have significant inputs from sewer infrastructure, the deliberate location of stream underground makes these connections more efficient and likely to occur in a wider range of event conditions. Previous research on solute transport in buried stream channels has emphasized that burial decreases nutrient uptake, thus increasing downstream loads (Beaulieu et al., 2014; Pennino et al., 2014; Beaulieu et al., 2015). This research builds on this finding to demonstrate that, in addition to decreased uptake, stream burial also increases the hydrologic connections to additional solute sources from runoff and leaking sewer infrastructure, resulting insubstantial impacts on downstream ecosystems.
The biogeochemical dynamics revealed in this study highlight the importance of subsurface solute pathways to urban surface water quality, especially in watersheds with aging pipe infrastructure creating opportunities for sewage leakage and biogeochemical transformations (Delesantro et al., 2022). In the complicated, multiple-stakeholder, stormwater management environment, these fundamental sources of impairment cannot be ignored. If ongoing infrastructure repair focuses solely on combined sewer overflow abatement, opportunities to address parallel and potentially more persistent water quality impairments from leaking sewers are missed. Given the dynamics documented here, more sophisticated prioritization of repair targets and increased recognition of subsurface interactions between infrastructure and streams to improve urban water quality and mitigate water quality impairments downstream of urban systems (Chung et al., 2023, in press).
The raw data supporting the conclusion of this article will be made available by the authors, without undue reservation.
RF collected all samples, conducted the laboratory analyses, and did the majority of the data analysis and writing. DB and EE assisted in data analysis as well as writing and editing.
This material is based upon work supported by the National Science Foundation under Grant Nos. 1939977 and 1253000 to EM. This work was also supported by the Pittsburgh Water Collaboratory and the Mellon Pre-Doctoral Fellowship at the University of Pittsburgh.
We would like to thank Sarah Lavin for establishing the Nine Mile Run gage and developing early stage-discharge relationships and Joe Fedor for sharing sewage pipe data.
The authors declare that the research was conducted in the absence of any commercial or financial relationships that could be construed as a potential conflict of interest.
All claims expressed in this article are solely those of the authors and do not necessarily represent those of their affiliated organizations, or those of the publisher, the editors and the reviewers. Any product that may be evaluated in this article, or claim that may be made by its manufacturer, is not guaranteed or endorsed by the publisher.
The Supplementary Material for this article can be found online at: https://www.frontiersin.org/articles/10.3389/fenvs.2023.1117809/full#supplementary-material
Anisfeld, S. C., Barnes, R. T., Altabet, M. A., and Wu, T. (2007). Isotopic apportionment of atmospheric and sewage nitrogen sources in two Connecticut rivers. Environ. Sci. Technol. 41, 6363–6369. doi:10.1021/es070469v
Bach, P. M., Mccarthy, D. T., and Deletic, A. (2010). Redefining the stormwater first flush phenomenon. Water Res. 44, 2487–2498. doi:10.1016/j.watres.2010.01.022
Bain, D. J., Copeland, E. M., Divers, M. T., Hecht, M., Hopkins, K. G., Hynicka, J., et al. (2014). Characterizing a major urban stream restoration project: Nine mile run (Pittsburgh, Pennsylvania, USA). J. Am. Water Resour. Assoc. 15218, 1608–1621. doi:10.1111/jawr.12225
Baker, E. B., and Showers, W. J. (2019). Hysteresis analysis of nitrate dynamics in the Neuse River, NC. Sci. Total Environ. 652, 889–899. doi:10.1016/j.scitotenv.2018.10.254
Barco, J., Papiri, S., and Stenstrom, M. K. (2008). First flush in a combined sewer system. Chemosphere 71, 827–833. doi:10.1016/j.chemosphere.2007.11.049
Baruch, E. M., Voss, K. A., Blaszczak, J. R., Delesantro, J., Urban, D. L., and Bernhardt, E. S. (2018). Not all pavements lead to streams: Variation in impervious surface connectivity affects urban stream ecosystems. Freshw. Sci. 37, 673–684. doi:10.1086/699014
Beaulieu, J. J., Golden, H. E., Knightes, C. D., Mayer, P. M., Kaushal, S. S., Pennino, M. J., et al. (2015). Urban stream burial increases watershed-scale nitrate export. PLoS One 10, 1–14. doi:10.1371/journal.pone.0132256
Beaulieu, J. J., Mayer, P. M., Kaushal, S. S., Pennino, M. J., Arango, C. P., Balz, D. A., et al. (2014). Effects of urban stream burial on organic matter dynamics and reach scale nitrate retention. Biogeochemistry 121, 107–126. doi:10.1007/s10533-014-9971-4
Bernhardt, E. S., Blaszczak, J. R., Ficken, C. D., Fork, M. L., Kaiser, K. E., and Seybold, E. C. (2017). Control points in ecosystems: Moving beyond the hot spot hot moment concept. Ecosystems 20, 665–682. doi:10.1007/s10021-016-0103-y
Bertrand-Krajewski, J.-L., Chebbo, G., and Saget, A. (1998). Distribution of pollutant mass vs volume in stormwater discharges and the first flush phenomenon. Water Res. 32, 2341–2356. doi:10.1016/s0043-1354(97)00420-x
Bhaskar, A. S., and Welty, C. (2012). Water balances along an urban-to-rural gradient of metropolitan baltimore, 2001-2009. Environ. Eng. Geosci. 18, 37–50. doi:10.2113/gseegeosci.18.1.37
Blaszczak, J. R., Delesantro, J. M., Zhong, Y., Urban, D. L., and Bernhardt, E. S. (2019). Watershed urban development controls on urban streamwater chemistry variability. Biogeochemistry 144, 61–84. doi:10.1007/s10533-019-00572-7
Bowes, M. J., Jarvie, H. P., Halliday, S. J., Skeffington, R. A., Wade, A. J., Loewenthal, M., et al. (2015). Characterising phosphorus and nitrate inputs to a rural river using high-frequency concentration–flow relationships. Sci. Total Environ. 511, 608–620. doi:10.1016/J.SCITOTENV.2014.12.086
Broadhead, A. T., Horn, R., and Lerner, D. N. (2013). Captured streams and springs in combined sewers: A review of the evidence, consequences and opportunities. Water Res. 47, 4752–4766. doi:10.1016/j.watres.2013.05.020
Broadhead, A. T., Horn, R., and Lerner, D. N. (2015). Finding lost streams and springs captured in combined sewers: A multiple lines of evidence approach. Water Environ. J. 29, 288–297. doi:10.1111/wej.12104
Burns, D. (2005). What do hydrologists mean when they use the term flushing? Hydrol. Process. 19, 1325–1327. doi:10.1002/HYP.5860
Butturini, A., and Sabater, F. (2002). Nitrogen concentrations in a small mediterranean stream: 1. Nitrate 2. Ammonium. Hydrol. Earth Syst. Sci. 6, 539–550. doi:10.5194/hess-6-539-2002
Carey, R. O., Wollheim, W. M., Mulukutla, G. K., and Mineau, M. M. (2014). Characterizing storm-event nitrate fluxes in a fifth order suburbanizing watershed using in situ sensors. Environ. Sci. Technol. 48, 7756–7765. doi:10.1021/es500252j
Delesantro, J. M., Duncan, J. M., Riveros-Iregui, D., Blaszczak, J. R., Bernhardt, E. S., Urban, D. L., et al. (2022). The nonpoint sources and transport of baseflow nitrogen loading across a developed rural-urban gradient. Water Resour. Res. 58, 1–25. doi:10.1029/2021WR031533
Deletic, A. (1998). The first flush load of urban surface runoff. Water Res. 32, 2462–2470. doi:10.1016/s0043-1354(97)00470-3
DeSilva, D., Burn, S., Tjandraatmadja, G., Moglia, M., Davis, P., Wolf, L., et al. (2005). Sustainable management of leakage from wastewater pipelines. Water Sci. Technol. 52, 189–198. doi:10.2166/wst.2005.0459
Divers, M. T., Elliott, E. M., and Bain, D. J. (2013). Constraining nitrogen inputs to urban streams from leaking sewers using inverse modeling: Implications for dissolved inorganic nitrogen (DIN) retention in urban environments. Environ. Sci. Technol. 47, 1816–1823. doi:10.1021/es304331m
Divers, M. T., Elliott, E. M., and Bain, D. J. (2014). Quantification of nitrate sources to an urban stream using dual nitrate isotopes. Environ. Sci. Technol. 48, 10580–10587. doi:10.1021/es404880j
Duncan, J. M., Welty, C., Kemper, J. T., Groffman, P. M., and Band, L. E. (2017). Dynamics of nitrate concentration-discharge patterns in an urban watershed. Water Resour. Res. 53, 7349–7365. doi:10.1002/2017WR020500
Elliott, E. M., and Brush, G. S. (2006). Sedimented organic nitrogen isotopes in freshwater wetlands record long-term changes in watershed nitrogen source and land use. Environ. Sci. Technol. 40, 2910–2916. doi:10.1021/es051587q
Elliott, E. M., Yu, Z., Cole, A. S., and Coughlin, J. G. (2019). Isotopic advances in understanding reactive nitrogen deposition and atmospheric processing. Sci. Total Environ. 662, 393–403. doi:10.1016/j.scitotenv.2018.12.177
Elmore, A. J., and Kaushal, S. S. (2008). Disappearing headwaters: Patterns of stream burial due to urbanization. Front. Ecol. Environ. 6, 308–312. doi:10.1890/070101
EPA (2004). Report to congress on impacts and control of combined sewer overflows and sanitary sewer overflows. Available at: https://www.epa.gov/npdes/2004-npdes-cso-report-congress.
Evans, C., and Davies, T. D. (1998). Causes of concentration/discharge hysteresis and its potential as a tool for analysis of episode hydrochemistry. Water Resour. Res. 34, 129–137. doi:10.1029/97WR01881
Flint, K. R., and Davis, A. P. (2007). Pollutant mass flushing characterization of highway stormwater runoff from an ultra-urban area. J. Environ. Eng. 133, 616–626. doi:10.1061/(asce)0733-9372(2007)133:6(616)
Forgrave, R., Elliott, E. M., and Bain, D. J. (2022). Event scale hydrograph responses highlight impacts of widespread stream burial and urban infrastructure failures. Hydrol. Process 36, 1–13. doi:10.1002/hyp.14584
Fork, M. L., Blaszczak, J. R., Delesantro, J. M., and Heffernan, J. B. (2018). Engineered headwaters can act as sources of dissolved organic matter and nitrogen to urban stream networks. Limnol. Oceanogr. Lett. 3, 215–224. doi:10.1002/lol2.10066
Godsey, S. E., Kirchner, J. W., and Clow, D. W. (2009). Concentration-discharge relationships reflect chemostatic characteristics of US catchments. Hydrol. Process. 23, 1844–1864. doi:10.1002/hyp.7315
Graf, W. L. (1975). The impact of suburbanization on fluvial geomorphology. Water Resour. Res. 11, 690–692. doi:10.1029/WR011i005p00690
Granger, J., and Sigman, D. M. (2009). Removal of nitrite with sulfamic acid for nitrate N and O isotope analysis with the denitrifier method. Rapid Commun. Mass Spectrom. 23, 3753–3762. doi:10.1002/rcm.4307
Groffman, P. M., and Crawford, M. K. (2003). Denitrification potential in urban riparian zones. J. Environ. Qual. 32, 1144–1149. doi:10.2134/jeq2003.1144
Hale, R. L., Turnbull, L., Earl, S., Grimm, N., Riha, K., Michalski, G., et al. (2014). Sources and transport of nitrogen in arid urban watersheds. Environ. Sci. Technol. 48, 6211–6219. doi:10.1021/es501039t
Hathaway, J. M., Tucker, R. S., Spooner, J. M., and Hunt, W. F. (2012). A traditional analysis of the first flush effect for nutrients in stormwater runoff from two small urban catchments. Water. Air. Soil Pollut. 223, 5903–5915. doi:10.1007/s11270-012-1327-x
Historic Pittsburgh Maps (2021). Pittsburgh historic Maps. Univeristy Pittsburgh Libr. Digit. Collect. Available at: https://www.arcgis.com/apps/View/index.html?appid=63f24d1466f24695bf9dfc5bf6828126 (Accessed August 24, 2021).
Hobbie, S. E., Finlay, J. C., Janke, B. D., Nidzgorski, D. A., Millet, D. B., and Baker, L. A. (2017). Contrasting nitrogen and phosphorus budgets in urban watersheds and implications for managing urban water pollution. Proc. Natl. Acad. Sci. U. S. A. 114, 4177–4182. doi:10.1073/pnas.1618536114
Hopkins, K. G., Bain, D. J., and Copeland, E. M. (2013). Reconstruction of a century of landscape modification and hydrologic change in a small urban watershed in Pittsburgh, PA. Landsc. Ecol. 29, 413–424. doi:10.1007/s10980-013-9972-z
Hopkins, K. G., and Bain, D. J. (2018). Research Note: Mapping spatial patterns in sewer age, material, and proximity to surface waterways to infer sewer leakage hotspots. Landsc. Urban Plan. 170, 320–324. doi:10.1016/J.LANDURBPLAN.2017.04.011
Hosomi, M., and Sudo, R. (1986). Simultaneous determination of total nitrogen and total phosphorus in freshwater samples using persulfate digestion. Int. J. Environ. Stud. 27, 267–275. doi:10.1080/00207238608710296
Kaiser, J., Hastings, M. G., Houlton, B. Z., Röckmann, T., and Sigman, D. M. (2006). Triple oxygen isotope analysis of nitrate using the denitrifier method and thermal decomposition of N2O. Anal. Chem. 79, 599–607. doi:10.1021/ac061022s
Kang, J. H., Kayhanian, M., and Stenstrom, M. K. (2008). Predicting the existence of stormwater first flush from the time of concentration. Water Res. 42, 220–228. doi:10.1016/j.watres.2007.07.001
Karpf, C., and Krebs, P. (2011). Quantification of groundwater infiltration and surface water inflows in urban sewer networks based on a multiple model approach. Water Res. 45, 3129–3136. doi:10.1016/J.WATRES.2011.03.022
Kaushal, S. S., and Belt, K. T. (2012). The urban watershed continuum: Evolving spatial and temporal dimensions. Urban Ecosyst. 15, 409–435. doi:10.1007/s11252-012-0226-7
Kaushal, S. S., Groffman, P. M., Band, L. E., Elliott, E. M., Shields, C. A., and Kendall, C. (2011). Tracking nonpoint source nitrogen pollution in human-impacted watersheds. Environemntal Sci. Technol. 45, 8225–8232. doi:10.1021/es200779e
Kendall, C., Elliott, E. M., and Wankel, S. D. (2007). “Tracing anthropogenic inputs of nitrogen to ecosystems,” in Stable isotopes in ecology and environmental science. Editors R. . Michener, and K. Lajtha (New Jersey: Blackwell Publishing), 375–449.
Kim, W., and Furumai, H. (2016). Characterization of washoff behavior of in-sewer deposits in combined sewer systems. Water Environ. Res. 88, 557–565. doi:10.2175/106143016X14504669768930
Klocker, C. A., Kaushal, S. S., Groffman, P. M., Mayer, P. M., and Morgan, R. P. (2009). Nitrogen uptake and denitrification in restored and unrestored streams in urban Maryland, USA. Aquat. Sci. 71, 411–424. doi:10.1007/s00027-009-0118-y
Kracht, O., Gresch, M., and Gujer, W. (2007). A stable isotope approach for the quantification of sewer infiltration. Environ. Sci. Technol. 41, 5839–5845. doi:10.1021/es062960c
Lee, J. H., and Bang, K. W. (2000). Characterization of urban stormwater runoff. Water Reserarch 34, 1773–1780. doi:10.1016/s0043-1354(99)00325-5
Lee, J. H., Bang, K. W., Ketchum, J. H., Choe, J. S., and Yu, M. J. (2002). First flush analysis of urban storm runoff. Sci. Total Environ. 293, 163–175. doi:10.1016/S0048-9697(02)00006-2
Leopold, L. (1968). Hydrology for urban land planning, A guidebook on the hydrologic effects of urban land use. U.S. Department of the Interior Available at: https://play.google.com/books/reader?id=J6jLOn2juZkC&hl=en&pg=GBS.PA1 (Accessed May 7, 2020).
Lloyd, C. E. M., Freer, J. E., Johnes, P. J., and Collins, A. L. (2016a). Technical Note: Testing an improved index for analysing storm discharge-concentration hysteresis. Hydrol. Earth Syst. Sci. 20, 625–632. doi:10.5194/hess-20-625-2016
Lloyd, C. E. M., Freer, J. E., Johnes, P. J., and Collins, A. L. (2016b). Using hysteresis analysis of high-resolution water quality monitoring data, including uncertainty, to infer controls on nutrient and sediment transfer in catchments. Sci. Total Environ. 543, 388–404. doi:10.1016/J.SCITOTENV.2015.11.028
McCarthy, D. T. (2009). A traditional first flush assessment of E. coli in urban stormwater runoff. Water Sci. Technol. 60, 2749–2757. doi:10.2166/wst.2009.374
McClain, M. E., Boyer, E. W., Dent, C. L., Gergel, S. E., Grimm, N. B., Groffman, P. M., et al. (2003). Biogeochemical hot spots and hot moments at the interface of terrestrial and aquatic ecosystems. Ecosystems 6, 301–312. doi:10.1007/s10021-003-0161-9
Michalski, G., Meixner, T., Fenn, M., Hernandez, L., Sirulnik, A., Allen, E., et al. (2004). Tracing atmospheric nitrate deposition in a complex semiarid ecosystem using Δ17O. Environ. Sci. Technol. 38, 2175–2181. doi:10.1021/es034980+
Michalski, G., Scott, Z., Kabiling, M., and Thiemens, M. H. (2003). First measurements and modeling of ∆17O in atmospheric nitrate. Geophys. Res. Lett. 30, 3–6. doi:10.1029/2003GL017015
Napieralski, J. A., and Carvalhaes, T. (2016). Urban stream deserts: Mapping a legacy of urbanization in the United States. Appl. Geogr. 67, 129–139. doi:10.1016/j.apgeog.2015.12.008
Napieralski, J. A., and Welsh, E. S. (2016). A century of stream burial in Michigan (USA) cities. J. Maps 12, 300–303. doi:10.1080/17445647.2016.1206040
Napieralski, J., Keeling, R., Dziekan, M., Rhodes, C., Kelly, A., and Kobberstad, K. (2015). Urban stream deserts as a consequence of excess stream burial in urban watersheds. Ann. Assoc. Am. Geogr. 105, 649–664. doi:10.1080/00045608.2015.1050753
Newcomer Johnson, T. A., Kaushal, S. S., Mayer, P. M., Smith, R. M., and Sivirichi, G. M. (2016). Nutrient retention in restored streams and rivers: A global review and synthesis. Water 8, 116. doi:10.3390/w8040116
Pangle, L. A., Diem, J. E., Milligan, R., Adams, E., and Murray, A. (2022). Contextualizing inflow and infiltration within the streamflow regime of urban watersheds. Water Resour. Res. 58, 1. doi:10.1029/2021wr030406
Patrick, W. H., and Khalid, R. A. (1974). Anaerobic soils released more phosphate to soil solutions low in soluble phosphate and sorbed more phosphate from soil solutions high in soluble phosphate than did aerobic soils. The difference in behavior of phosphate under aerobic and anaerobic conditio. Science 186, 53–55. doi:10.1126/science.186.4158.53
Pennino, M. J., Kaushal, S. S., Beaulieu, J. J., Mayer, P. M., and Arango, C. P. (2014). Effects of urban stream burial on nitrogen uptake and ecosystem metabolism: Implications for watershed nitrogen and carbon fluxes. Biogeochemistry 121, 247–269. doi:10.1007/s10533-014-9958-1
Peter, K. T., Hou, F., Tian, Z., Wu, C., Goehring, M., Liu, F., et al. (2020). More than a first flush: Urban creek storm hydrographs demonstrate broad contaminant pollutographs. Environ. Sci. Technol. Acs.est. 54, 6152–6165. doi:10.1021/acs.est.0c00872
Qin, H., He, K., and Fu, G. (2016). Modeling middle and final flush effects of urban runoff pollution in an urbanizing catchment. J. Hydrol. 534, 638–647. doi:10.1016/j.jhydrol.2016.01.038
Riha, K. M., Michalski, G., Gallo, E. L., Lohse, K. A., Brooks, P. D., and Meixner, T. (2014). High atmospheric nitrate inputs and nitrogen turnover in semi-arid urban catchments. Ecosystems 17, 1309–1325. doi:10.1007/s10021-014-9797-x
Rivers 2nd Nature (2006). Art, ecology, community | the 3 rivers 2nd nature project. Stud. Creat. Inq. Carnegie Mellon Univ. Available at: https://3r2n.collinsandgoto.com/index.htm (Accessed September 27, 2021).
Rivers 2nd Nature (2004). Urban watersheds: Water quality in allegheny county, PA. Pittsburgh, PA: Rivers 2nd Nature.
Rose, L. A., Elliott, E. M., and Adams, M. B. (2015). Triple nitrate isotopes indicate differing nitrate source contributions to streams across a nitrogen saturation gradient. Ecosystems 18, 1209–1223. doi:10.1007/s10021-015-9891-8
Rose, L. A., Yu, Z., Bain, D. J., and Elliott, E. M. (2019). High resolution, extreme isotopic variability of precipitation nitrate. Atmos. Environ. 207, 63–74. doi:10.1016/j.atmosenv.2019.03.012
Roy, A. H., Dybas, A. L., Fritz, K. M., and Lubbers, H. R. (2015). Urbanization affects the extent and hydrologic permanence of headwater streams in a midwestern US metropolitan area. J. North Am. Benthol. Soc. 28, 911–928. doi:10.1899/08-178.1
Roy, A. H., and Shuster, W. D. (2009). Assessing impervious surface connectivity and applications for watershed management. J. Am. Water Resour. Assoc. 45, 198–209. doi:10.1111/j.1752-1688.2008.00271.x
Saget, A., Chebbo, G., and Bertrand-Krajewski, J.-L. (1996). The first flush in sewer systems. Water Sci. Technol. 33, 101–108. doi:10.2166/wst.1996.0186
Scanlon, T. M., Raffensperger, J. P., and Hornberger, G. M. (2001). Modeling transport of dissolved silica in a forested headwater catchment: Implications for defining the hydrochemical response of observed flow pathways. Water Resour. Res. 37, 1071–1082. doi:10.1029/2000WR900278
Scholefield, D., Le Goff, T., Braven, J., Ebdon, L., Long, T., and Butler, M. (2005). Concerted diurnal patterns in riverine nutrient concentrations and physical conditions. Sci. Total Environ. 344, 201–210. doi:10.1016/j.scitotenv.2005.02.014
Schueler, T. R., Fraley-Mcneal, L., and Cappiella, K. (2009). Is impervious cover still important? Review of recent research. J. Hydrol. Eng. 14, 309–315. doi:10.1061/ASCE1084-0699200914:4309
Shuster, W. D., Bonta, J., Thurston, H., Warnemuende, E., and Smith, D. R. (2005). Impacts of impervious surface on watershed hydrology: A review. Urban Water J. 2, 263–275. doi:10.1080/15730620500386529
Sigman, D. M., Casciotti, K. L., Andreani, M., Barford, C., Galanter, M., and Böhlke, J. K. (2001). A bacterial method for the nitrogen isotopic analysis of nitrate in seawater and freshwater. Anal. Chem. 73, 4145–4153. doi:10.1021/ac010088e
Spencer-Williams, I., Balangoda, A., Dabundo, R., Elliott, E., and Haig, S.-J. (2022). Exploring the impacts of full-scale distribution system orthophosphate corrosion control implementation on the microbial ecology of hydrologically connected urban streams. Microbiol. Spectr. 10, e0215822. doi:10.1128/spectrum.02158-22
Surbeck, C. Q., Jiang, S. C., Ho Ahn, J., and Grant, S. B. (2006). Flow fingerprinting fecal pollution and suspended solids in stormwater runoff from an urban coastal watershed. Environ. Sci. Technol. 40, 4435–4441. doi:10.1021/es060701h
Thompson, S. E., Basu, N. B., Lascurain, J., Aubeneau, A., and Rao, P. S. C. (2011). Relative dominance of hydrologic versus biogeochemical factors on solute export across impact gradients. Water Resour. Res. 47, 1. doi:10.1029/2010WR009605
UpstreamPGH (2020). Nine mile run watershed association stragetic plan 2020-2023. Pittsburgh, PA: UpstreamPGH.
Weitzell, R. E., Kaushal, S. S., Lynch, L. M., Guinn, S. M., and Elmore, A. J. (2016). Extent of stream burial and relationships to watershed area, topography, and impervious surface area. WaterSwitzerl. 8, 11. doi:10.3390/w8110538
Yang, Y. Y., and Toor, G. S. (2016). δ15N and δ18O reveal the sources of nitrate-nitrogen in urban residential stormwater runoff. Environ. Sci. Technol. 50, 2881–2889. doi:10.1021/acs.est.5b05353
Keywords: urban areas, buried streams, sewage subsidies, nitrate isotopes, hysteresis, stormwater managment
Citation: Forgrave RK, Elliott EM and Bain DJ (2023) Sewer subsidies from overflows and pipe leaks dominate urban stream solute loads in all storm events. Front. Environ. Sci. 11:1117809. doi: 10.3389/fenvs.2023.1117809
Received: 06 December 2022; Accepted: 12 April 2023;
Published: 04 July 2023.
Edited by:
Claire J. Oswald, Toronto Metropolitan University, CanadaReviewed by:
Sujay Kaushal, University of Maryland, United StatesCopyright © 2023 Forgrave, Elliott and Bain. This is an open-access article distributed under the terms of the Creative Commons Attribution License (CC BY). The use, distribution or reproduction in other forums is permitted, provided the original author(s) and the copyright owner(s) are credited and that the original publication in this journal is cited, in accordance with accepted academic practice. No use, distribution or reproduction is permitted which does not comply with these terms.
*Correspondence: Rebecca K. Forgrave, cmVmNjFAcGl0dC5lZHU=
Disclaimer: All claims expressed in this article are solely those of the authors and do not necessarily represent those of their affiliated organizations, or those of the publisher, the editors and the reviewers. Any product that may be evaluated in this article or claim that may be made by its manufacturer is not guaranteed or endorsed by the publisher.
Research integrity at Frontiers
Learn more about the work of our research integrity team to safeguard the quality of each article we publish.