 Fujie Zhao
 Guojie Wang
 Shijie Li
 Daniel Fiifi Tawia Hagan
 Waheed Ullah
- Collaborative Innovation Center on Forecast and Evaluation of Meteorological Disasters, School of Geographical Sciences, Nanjing University of Information Science & Technology, Nanjing, China
Understanding the effects of thermal and water stress on maize yield in the context of climate change is crucial to ensure food security in China. However, very few studies looked into the combined effects of heat and water stress on maize yield in China. Here, we utilized historical reanalysis data from ERA5 and four future shared socioeconomic pathway scenarios (SSP1-2.6, SSP2-4.5, SSP3-7.0, and SSP5-8.5) of the Coupled Model Intercomparison Project 6 (CMIP6) models to predict the maize yield. We used the linear mixed-effects model to quantify the grid cell sensitivity of vapor pressure deficit (VPD) and root-zone soil moisture to maize yield in China during 2010–2016. The results infer that VPD and root-zone soil moisture are excellent representatives of heat and moisture stress. Maize yield is beneficial only when the atmospheric moisture demand and soil moisture are in relative balance. Based on the historical results’ polynomial function for VPD and soil moisture, we predict the maize yield response to soil moisture and VPD in the four SSPs. The results show that considering soil moisture in the future the projected yield estimates reduce the overestimated yield loss by half compared to considering only atmospheric moisture requirements. Maize yield will decrease under representative SSPs due to an increase in temperature (1.5, 2.0, 2.5, 3.0, 3.5, and 4.0°C). This study suggests that both atmospheric moisture demand and supply need to be considered when analyzing the specific influence of climate change on crop yield to secure and assure global food supplies.
1 Introduction
Maize is one of the most valuable food crops to ensure food security in the world (Jones and Thornton, 2003; Lobell et al., 2013; Abera et al., 2018). Increased maize production is essential for human livelihood, welfare, and the development of the national agriculture and livestock industry. The maize yield in China is probably 2.61 × 10⁸ tons, accounting for 22.7% of the total global maize production (FAOSTAT, 2020), making it the world’s second-largest maize producer. Global warming, accompanied by an increase in the frequency and intensity of extreme weather and climate extremes (droughts, heat waves, floods, etc.), will irreversibly affect plant physiological and yield parameters (IPCC, 2021). Conversely, the impacts of climate change and the intensification of associated hydrometeorological extremes will exacerbate the maize production crisis, affecting food security and sustainability (Li et al., 2021a).
Vegetation growth and development at different stages are subject to changes in temperature degree days (Schlenker and Roberts, 2009), vapor pressure deficit (VPD) (Arve et al., 2011), soil water (Siebert et al., 2014; Webber et al., 2016), CO2 (Lobell et al., 2013) and solar radiation (Mercado et al., 2009). Moreover, large-scale climatic phenomena such as the El Niño Southern Oscillation (ENSO) (Zhu et al., 2018) and anthropogenic interventions in the natural earth climate system can affect the global vegetation growth (Reichstein et al., 2013). Air temperature and soil moisture are two main controlling factors for rainfed maize yield (Carter et al., 2016; Ortiz-Bobea et al., 2019). Therefore, the specific air temperature and soil moisture range corresponding to each growth stage contribute to the physiological growth of maize. Fluctuation beyond the optimal threshold range adversely affects biological production and grain yield (Zhang et al., 2022). Excessively increasing air temperature triggers heat stress, reducing maize yield (Schlenker and Roberts, 2009; Butler and Huybers, 2013; Lobell et al., 2013; Butler and Huybers, 2015). For another, excess soil moisture (e.g., flood, over-irrigation) also produces waterlogging, damaging the plant root system and loss of essential nutrients, causing maize yield damage (Rosenzweig et al., 2002; Beier et al., 2012; Li et al., 2019; Lesk et al., 2020). On the contrary, an increase in soil moisture also mediates the passive influence of heat stress from an increase in temperature-related heat losses or amplifies the losses when the soil moisture decrease. Air temperature also has been shown to have similar influences on maize yield due to excess (deficit) soil moisture (Lobell et al., 2013). These imply that air temperature and soil moisture jointly impact maize yield.
However, predicting maize yield using the relationship between maize yield, air temperature, and soil moisture may not be the best choice. Rigden et al. (2020) found that the collective influence of soil moisture and VPD can accurately predict maize yield in the US, rather than soil moisture and air temperature, demonstrating that VPD is more suitable for maize yield prediction than the air temperature. This is because VPD, determined by air temperature and specific humidity, can reflect atmospheric demand more than air temperature (Hsiao et al., 2019). Thus, the effect of VPD on vegetation growth has received more attention. Meanwhile, Yuan et al. (2019) indicated that the negative contribution of VPD limits global terrestrial vegetation growth since 1998 even more than the CO2 fertilization effects. Sulman et al. (2016) and Novick et al. (2016) pointed out that VPD substantially affects vegetation growth more than soil moisture. VPD affects vegetation growth because increasing VPD leads to an increase evapotranspiration (Li et al., 2011; Li et al., 2022). Consequently, vegetation prevents water loss by closing its stomata, thus limiting vegetation growth. Rigden et al. (2020) validated the accuracy of maize yield prediction based on soil moisture and VPD. However, the results of this predicted method have not been validated in China, where maize is widely grown. China has a vast territory with diverse topography and climate, and maize is grown in 90% of the provinces in the country at a preliminary estimate (Wang, 2010). As the largest grain crop, maize accounts for about 25% of grain sown area and 40% of grain output in China (NSBC, 2021). Meanwhile, China is an important maize producer in the world. Based on these aspects, we need to conduct studies on soil moisture and VPD to preferable realize the effect of atmospheric moisture requirement and supply on maize production in China.
There are three classic approaches to quantify the effects of climatic variables on crop production: (1) process-based biophysical crop simulation models (Whish et al., 2015; Chen et al., 2020), (2) field trials (Nandram et al., 2013; Feng et al., 2020), and (3) statistical models (Tao et al., 2012; Leng and Hall, 2020). Compared with field trial methods and process-based crop models, yield estimation methods by statistical regression are widely used and have a long history because of inexpensive cost and easy application (Feng et al., 2018). In addition, statistical regression models can explain specific correspondence between independent (precipitation, etc.) and dependent variables (maize yield, etc.), which can more directly and accurately understand and quantify the relationship between climate change and crop production (Peng et al., 2004). The linear mixed-effects model belonging to the statistical model not only eliminates the requirement for data independence and other requirements of traditional linear statistical models but also retains its normality assumptions, which greatly improves the applicability of linear models.
In recent decades, few studies have quantified the influence of climate variables on maize production at the grid scale in China due to the limitation of maize yield availability. Some previous studies were mainly carried out at the provincial level (Li et al., 2010; Chen et al., 2015). Other site scales were on the basis of major maize-growing belts of China in Northeast China (Zhao et al., 2015; Zhao et al., 2016), Huang-Huaihai region (Liu et al., 2010), Southwest region (Li et al., 2014). However, the trend of climatic factors and warming affecting maize yields, especially in the future, are still unclear. This study attempts to analysis climate variability effect on maize production in the major maize-growing belts of China at the grid point level using high-resolution data with a linear mixed-effect model. We also estimate the optimal water balance of maize over the historical period. Then a polynomial model is used to estimate how maize yield will change under the different shared socioeconomic pathway (SSP) in the warming future, compared to the preindustrial period. This work is a reference for estimating the climatic variability of maize production in China.
2 Materials and methods
2.1 Study area
The study focuses on mainland China, which is a well-known maize producer and ranks second in the world. Its land coverage is vast, and the terrain is complex and diverse, with geographical locations between 73°40′–135°20′E and 3°52′–53°33′N. The climate zones of China gradually transition from the southernmost subtropical monsoon to a temperate climate in the north. However, due to the wide area and diverse terrain, the actual climatic states (temperature, precipitation and etc.) vary greatly between regions (Liang et al., 2018; Yao et al., 2018). Under the promotion of climate and other factors, China’s maize production has gradually formed three regional patterns with distinct characteristics after a long evolution process (Miao et al., 2014). These include the northeastern production area, the northern production area (Supplementary Figure S1), and the southwestern production area, which connect to a narrow maize growing belt (Wang, 2010; Yang et al., 2017). The belt is the major maize-producing district in China and the section of interest here.
2.2 Data
2.2.1 Maize yield data
The historical maize production data is derived from the Global Dataset of Historical Yields for major crops (GDHY), which integrates agricultural census statistics from the United Nations statistical database (FAOSTAT) and multiple satellite products. This global grid yield dataset with a spatial resolution of 0.5° contains four major crops - maize, rice, wheat and soybeans - from 1981 to 2016 (Iizumi and Sakai, 2020). Here, we use a calibrated version (v1.2 + v1.3) which had the data examined in agreement with other crop yield products (Ray et al., 2012) containing only from 1995 to 2005, but this data is also extended to 2016. Therefore, this historical yield data is of higher quality and spans a longer period to meet the needs of newer scientific studies. For this study, we treat this data as the actual yield value. The data was obtained from https://doi.org/10.1594/PANGAEA.909132. Although the crop calendar for maize production in the dataset is divided into two seasons (major and second, the second mainly contains maize from eastern South Africa and central and southern Brazil), there is no data on maize production in the second season for our study area, which is the main maize producing area in China. Therefore, the variable we use for maize yield data is “maize major”, which represents the maize production in the first season. This work used the global crop calendar to determine the growing season of the crops in China (Sacks et al., 2010). As this study is focused on the maize-producing areas of China, some pre-processing is required before this data can be used. The most important of these is the extraction of the Chinese maize-growing areas, and we show this part of the process in the methods part.
2.2.2 Climate data
The ERA5 dataset (Hersbach et al., 2020) we use in this study is from the European Centre for Medium-Range Weather Forecasts (ECMWF). The spatial resolution of the dataset is 0.25° × 0.25° with temporal coverage from 1959 to the present downloaded from https://www.ecmwf.int/en/forecasts/datasets/reanalysis-datasets/era5. Evaluation studies have demonstrated its high skill in China (Hagan et al., 2019; Hersbach et al., 2020; Liu et al., 2022). ERA5 contains products with hourly and monthly time resolution. Since our study requires daily frequency data, we convert the hourly data to daily mean data. The meteorological variables used in this study are 2 m air temperature, 2 m maximum and minimum air temperature, 2 m dew point temperature, total precipitation, surface soil volumetric water content (top layer of soil moisture, 0–7 cm), and soil volumetric water content at a depth of the maize root system (third layer of soil moisture data, 28–100 cm). Since the main root water absorption of maize extends to less than 7 cm, to characterize the available water to the plants more accurately, we select soil moisture data of corresponding depth according to the distribution area of maize roots. The reanalysis data from 2010 to 2016 were interpolated into a regular cell of 0.5° using the nearest neighbor method to be consistent with yield data. The daily vapor pressure deficit (VPD) was computed using the dew point, maximum and minimum temperature variables of 2 m per day.
2.2.3 CMIP6 data
The climate data for the pre-industrial and future periods used in this study are derived from CMIP6 of the World Climate Research Programme (WCRP) (https://esgf-node.llnl.gov/projects/cmip6/). The simulation of CMIP6 is from 1950 to 2100 and contains simulations of historical periods (1950–2014) and predictions of future periods (2015–2100). CMIP6 data approves 23 sub-program experiments, including a newly additional estimation project, the Scenario Model Intercomparison Project (ScenarioMIP). ScenarioMIP’s eight sets of scenario experiments for future periods contain two levels (Tier-1 and Tier-2) on the basis of priority. The first level of experiments is the central experiment, including four scenarios for SSP1-2.6, SSP2-4.5, SSP3-7.0, and SSP5-8.5 (Zhang et al., 2019). The first scenario, SSP1-2.6, represents a sustainable development scenario that is more stable and has lower pressure and radiative forcing (van Vuuren et al., 2017). Both stability and radiative forcing in the SSP2-4.5 scenario are moderate. SSP3-7.0 is a new radiative forcing scenario that has high challenges to mitigation and adaptation (Fujimori et al., 2017). And SSP5-8.5 is a rapidly developing high-emission shared socio-economic pathway based on high fossil fuel consumption. To more accurately analyze the climate-yield relationship in future climates, we use a collection of multiple model ensembles and scenarios to study.
Given the availability of the data, we select nine models covering the meteorological elements of the main climate scenarios for the future period (soil moisture content, 2 m temperature, and near-surface relative humidity), along with the temperature and relative humidity data for the preindustrial period. Information on the names, research institutions, and spatial resolutions of each mode can be found in Supplementary Table S1. The simulated data needs to be re-gridded to a resolution of 0.5° to ensure consistency with the reanalysis dataset and yield data. In addition, to reduce the error between the model-simulated data and the reanalysis data, we also corrected the model-simulated data. Data for future scenarios for all models cover the period 2041–2100. In calculating the future maize yield response to elevated VPD, we counted the number of days of exposure to specific VPD and SMr for each model under different SSPs, and then averaged the number of days across all models. The ensemble-mean number of days of exposure was input into the model to obtain the yield response. However, in calculating the future yield response to temperature increase, this study first calculated the time period of the particular temperature increase for each model. The mean is the height of the bar in Figure 8 and the error bar indicates the difference between each model.
2.3 Methods
2.3.1 Data pre-processing
Maize is grown in about 31 provinces in China, due to the suitability of climatic conditions, the districts with the largest planting area are mainly concentrated in the maize belt from the northeast to the southwest, which is the main maize producing area in China (Wang, 2010; Yu, 2014; Yang et al., 2017). We first select the grid points where the maize yield of the GDHY dataset has values from 1982 to 2016 to determine the main maize-growing areas in China during these 35 years. Our study area is planted with spring maize and summer maize with different growing seasons. Northeastern China is mainly dominated by spring maize, and the northern region is dominated by summer maize, while spring and summer maize coexist in the southwest mountainous areas. For the general applicability of the findings, the study uses meteorological variables from April to September, which includes the growing seasons of spring and summer maize (Huai et al., 2020; Luo et al., 2020; Guo et al., 2021; Zheng et al., 2022). The daily VPD in the study area is calculated using temperature data from the ERA5 dataset and CMIP6. VPD is the saturated water vapor pressure minus the actual water vapor pressure. The daily average saturated water vapor pressure can be estimated using the mean of saturated vapor pressure at the maximum and minimum temperature or directly using the mean temperature (Allen et al., 1998; Allen et al., 2000). The actual water vapor pressure can be calculated by various approaches using one or more of the following parameters: dew point temperature, relative humidity, and air temperature (Allen et al., 1998; Upreti and Ojha, 2017). In this study, the observed VPD for the historical period in the study area is calculated using dew point temperature and maximum and minimum temperatures. The distribution of daily VPD and soil moisture in the maize root zone is shown in Figure 1.
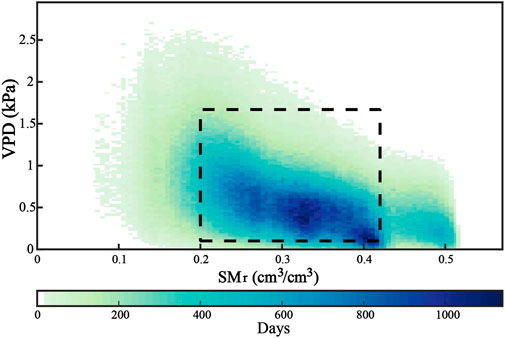
FIGURE 1. The distribution of daily VPD and root-zone soil moisture (SMr) in China maize growing area from 2010 to 2016. The color indicates the amount of days in each corresponding interval, and the data we use in the yield model shown in is within the dotted box (VPD: 0.1–1.67 kPa, SMr: 0.2–0.42 cm3 cm−3).
Due to the data availability, the simulated VPD for the future period is calculated from relative humidity and air temperature. We expect some deviations between the climate models and the actual situation in our study area due to the low resolution of these models, the inter-model resolution differences, and different model sensitivities and parameterization schemes (Zhang et al., 2016; Chen et al., 2020; Richter and Tokinaga, 2020). To reduce these uncertainties, before using these data, we carried out bias corrections and spatial downscaling based on station observations from historical periods in China (Kazmi et al., 2015; Jiang et al., 2022; Mondal et al., 2022). The method used for bias correction is the Equidistant Cumulative Distribution Function (EDCDF) (Li et al., 2010), which is a mapping method based on the probability distribution of data. It is a mapping method used to adjust the distribution of simulated data sets and is the most commonly used bias correction method for model (ESM) output. EDCDF considers historical and future period variables using quantile-based cumulative distribution function (CDF) mapping. EDCDF takes into account the CDF of historical and future periods differences between them, and it assumes that the differences between the observations referenced during training and the model output remain during calibration. This differs from a simple CDF, where the relationship between the two time periods remains unchanged.
The future soil moisture in the maize root-zone used in the study is extracted from the representative soil layer thickness for non-uniform thickness layers of CMIP6 using the weighted average method following Wang et al. (2015). And the relevant layer number information of the soil layer moisture content of each model used is listed in Supplementary Table S1. It must be noted that the unit of soil moisture for the CMIP6 is kg/cm2, which is inconsistent with the unit of ERA5, so we converted all the model units to be consistent with ERA5 soil moisture. The conversion is done following Zhu and Shi. (2014).
In Eq. 2,
2.3.2 Construction of yield calculation model
We estimate the 2010–2016 maize yield anomaly concerning the yield data during 1982–2009. The anomaly is calculated using a linear regression fit of yield on each grid point from 1982 to 2009; the fitted predicted yield is then subtracted from the grid observation in 2010–2016. First, we construct yield prediction models based on individual variables for historical periods to analyze yield variation to climatic conditions, and the variables used are listed in Table 1. After screening and processing, 9,205 grid points-years are preserved, covering all grid points in China’s major maize-growing regions from 2010–2016. To be able to model one item of each climate variable on yield, this study assumes that during the selected maize growing season (April-September, all national growing seasons of maize), the response of yield accumulates over time, and the yield is proportional to the total exposure time. Therefore, this response can be replaced cumulatively over time (Schlenker and Roberts, 2009). We model yield as a function of exposure events under specific climatic conditions to analyze the impact of climate on production in this work. We fit grid-level yield anomalies under different climatic conditions with a step function based on a linear mixed-effects model as follows
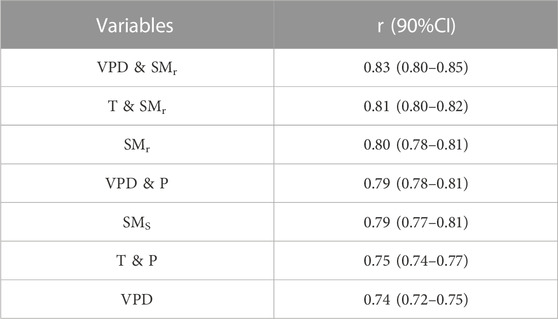
TABLE 1. Correlation between the estimated and actual yield anomalies. The correlation (r) between estimated and actual yield anomalies and the 90% confidence interval for the corresponding correlation (from n = 10,000 bootstrap realizations). The variables in the table are vapor pressure deficit (VPD), root-zone soil moisture (SMr), maximum temperature (T), precipitation (P), and surface soil moisture (SMs), all of which are daily data.
In Eq. 3,
To clarify the effect of water availability on thermal stress (Figure 3), we applied three sets of VPD data extracted from various soil moisture states to Eq. 3: all grid-year data, the first 40% and bottom 40% of the soil moisture sequence. Finally, for a more visually clear effect, we used eight equally spaced climate variables to estimate variation for maize production, with the range being 0.1–1.67 kPa. The numerical interval of daily climate data from April to September is divided into five equal-width bins to contrast yield variations to various climate conditions. We divided the variables in these climate combinations equally into five boxes and modeled to assess the combined effects of thermal and water stress, which increased the amount of box (from 5 to 25) by squaring. When fitting Eq. 3, which defines bin edges based on the 1% and 99% quartiles, we use all 9,205 grid points-years for each climate variable for all days from April to September to estimate the yield response. Surface soil water content is taken in the range of 0.2–0.42 cm3 cm−3, the value interval for root-zone soil moisture is 0.2–0.42 cm3 cm-3, VPD ranges from 0.1 to 1.67 kPa, temperature ranges from 10°C to 36°C, and precipitation ranges from 0 to 40 mm. The data interval of VPD and SMr used is the range in the dashed black box shown in Figure 1. Identify the five boxes and their individual value intervals, and ensure that the amount of data falling within each interval is sufficient.
To investigate the interaction between heat and water stress, the data are grouped according to water stress (soil moisture or precipitation) and thermal stress (VPD or temperature), producing 25 combinations (e.g., 5 precipitation groupings (h) multiplied by 5 VPD groups (i)), the form of the model is shown below
In this two-dimensional equation expressing the interaction,
2.3.3 Applying yield models to future
To infer the yield response to the environment in future climatic states based on the constructed yield predictive model for the historical period (Figure 7 and Supplementary Figure S3), we fit the polynomial to the sensitivity (
In Eq. 5, a weight (
Similar to Eqs. 5, 6 also includes weights, but it is built on the days within the 25 combined intervals. The
3 Results
3.1 Model validation
Numerous studies on rainfed agriculture indicate that temperature has a non-negligible effect on maize yield (Butler and Huybers, 2015), while water is an essential and important condition for vegetation growth and development. Heat stress is strongly correlated with yield reduction in maize (Rigden et al., 2020). However, the connection between water availability and yield variability has not been fully demonstrated. Therefore, we first use a yield estimation model based on a linear mixed effects model to identify the climatic variables characterizing temperature and moisture availability that impact maize yield most. Table 1 shows the results of the correlation coefficients between yield anomalies estimated using the model and the observed yield anomalies for the historical (2010–2016) period. We first calculate the correlation between the model outputs and the actual results for the single variable characterizing moisture or temperature that impacted yield. The calculations show that the output results of the model inputs for soil moisture in the maize root zone performed best on average, with values as high as 0.8 (Confidence Interval (CI): 0.78–0.81). The results of soil moisture data at surface depths of 1–7 cm are only 0.1 lower than the results of root-zone soil moisture (CI: 0.77–0.81). This shows the impact of available water since soil moisture is also a variable that characterizes the water required for plant growth and development. The calculation results of precipitation are not entirely satisfactory. The average correlation coefficient is only 0.66, and the maximum value of the CI is only 0.70, which is lower than the CI of soil moisture in the root zone (0.78). This may be because precipitation contains changes in runoff, drainage, and evaporation (Basso and Ritchie, 2014), and the changes in precipitation are uneven (Fezzi and Bateman, 2015); as a result, the amount of water available to plants cannot be well determined. Rainfall is not a good representation of the water available to plants. On the other hand, in the variables representing temperature, the mean value of the model output of VPD (0.74) is better than that of the 2 m air temperature (0.56).
Subsequently, to investigate the effect of thermal and water stress on yield, we selected one of the variables that characterized temperature and water and substituted them into a two-dimensional model representing the interaction (Eq. 4). The results indicate that the hydrothermal combination of VPD and soil moisture in the root zone form the most suitable climatic combination of maize yield. The correlation coefficient between yield calculated based on this combination and actual yield reaches up to 0.85, with a mean value of 0.83. This is followed by the combination of temperature and root zone soil moisture, which correlated up to 0.82. The lowest correlation coefficient is obtained from the combination of precipitation and temperature (CI: 0.74–0.77, mean: 0.75), which is lower than the univariate results for surface soil moisture (CI: 0.77–0.81, mean: 0.79). Overall, the results for soil moisture (top soil moisture and root zone soil moisture) are better than precipitation for the single elements related to maize yield, and root-zone soil moisture yields better results than topsoil moisture. The comparison between the univariate and bivariate results shows that the latter results are overall significantly better than the former. The univariate best result (SMr) ranks third in all results. It is noteworthy that the three sets of results with the highest correlations all include root-zone soil moisture, reflecting that root-zone soil moisture strongly influences yield, which is the meteorological variable representing the available water of maize over longer time scales.
Next, the optimal results are selected based on Table 1 for verification. Our validation includes data distribution density and spatial distribution validation. The results of the scattered density of the estimated and the observed yield anomaly are shown in Figure 2. It shows the scatter density distribution of the estimated historical yield anomalies and the observed yield anomalies for 9,205 grid years from 2010 to 2016. The denser the data distribution, the warmer the colors (blue to red). The correlation coefficient of the scatter density fitting of the predicted and observed yield anomalies is 0.82, reflecting the high consistency between the predicted and observed yield anomalies. The overall MAE, RMSE, and Bias representing error are 0.380, 0.480, and −0.020, respectively, indicating subtle differences. The results of the spatial distribution verification are shown in Figure 3, where Figure 3A indicates the spatial distribution of the annual mean of the observed yield anomalies over the grid points from 2010 to 2016 and Figure 3B shows the spatial distribution of the estimated yield anomalies output by the model. By comparing the spatial distributions and values of the two, we find that the modes of the spatial distribution of the observed and estimated yield anomalies are very similar, but there are moderate differences. For example, the yield anomalies in the maize-growing areas in the southwest mountains of China are negative. It indicates that the actual maize yield in the southwest mountains has not reached the expected mean of linear trend fitting for 2010–2016, while positive values dominate the northeast region of China. It has been confirmed that maize in Northeastern China is rain-fed and susceptible to interannual meteorological conditions, with high yield volatility but an overall upward trend, while parts of Southwestern and Eastern China have shown a downward trend in recent years. Based on the above phenomena, maize production and cultivation’s national center of gravity gradually moves to the northeast (Xu et al., 2013). The results shown in the Figure are consistent with the above facts, which also illustrate the robustness of the yield estimation model based on the linear mixed-effects model.
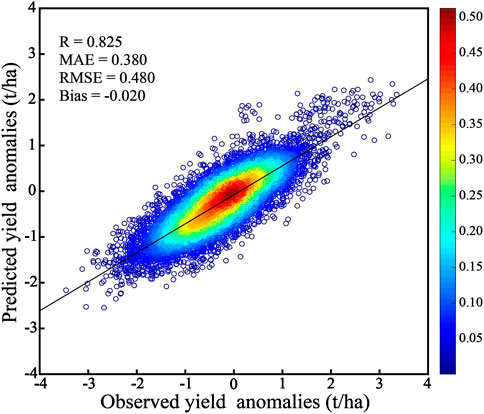
FIGURE 2. Scattered density of yield anomalies between estimated and actual yield anomalies. We drew the scatter density plot of estimated and actual yield anomalies and calculated the fitting coefficient. R is 0.825, MAE is 0.38, RMSE is 0.48, and the Bias is −0.02. All deviations are measured in tons per hectare.
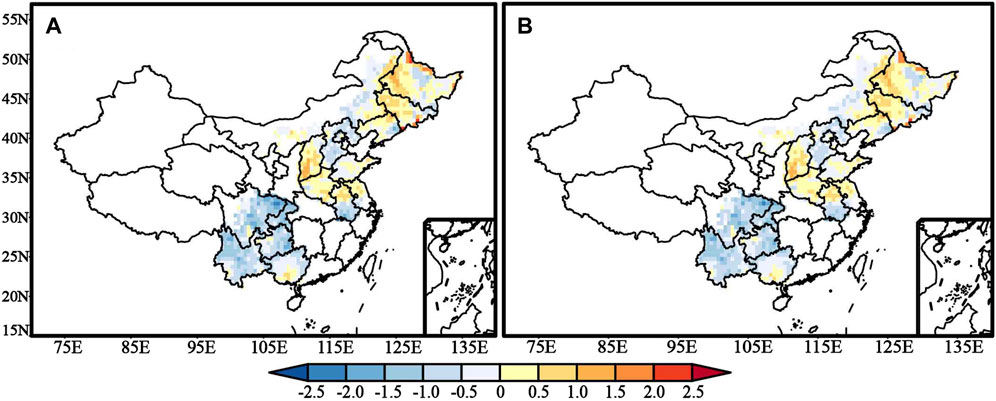
FIGURE 3. The 2010-2016 annual average observed and predicted yield anomalies. (A), The average yield anomalies estimated from a linear trend of observed annual yields in 2010–2016. (B), Same as in a, but driven by VPD and soil moisture in the maize root zone.
3.2 Impact of combined SM-VPD on historical maize yield in China.
The validation results of the maize yield model in the former part clearly show that the yield model can be well adapted to the study. A previous finding suggests that thermal stress is often accompanied by water stress and that the two are irreplaceable and not interchangeable. However, since there are still uncertainties concerning the role of moisture in regulating the loss of maize yield due to heat stress, we first conduct a simple analysis of the yield response to heat stress and how it depends on soil moisture. We use the model in Eq. 3 to estimate the yield sensitivity of VPD to show the impact of daily accumulated atmospheric moisture demand on yield (Butler and Huybers, 2013). Based on the different average soil moisture states during the maize growing season, we extracted data for the driest and wettest 40% of soil water content in the study area from April to September and fed them into the model separately. For comparison, we put in all grid-year data at the same time. Daily mean VPD rather than daily mean air temperature was used as an input to the model because VPD was shown to be more closely related to water stress to predict better yield loss (Hsiao et al., 2019). When comparing yield sensitivity results from three sets of data (Figure 4), it was found that high VPD was not consistently destructive. Only in wetter years, a low VPD (<0.6 kPa) was detrimental to maize yields, and when VPD was higher than 1.3 kPa, it would reduce maize yields in drier years. The 95% confidence intervals for yield sensitivity were also different at low and high VPD. The above analysis shows that if the state of different soil moisture is mixed together, it is easy to get misleading results, and it will be mistakenly believed that higher or lower VPD is not conducive to maize yield.
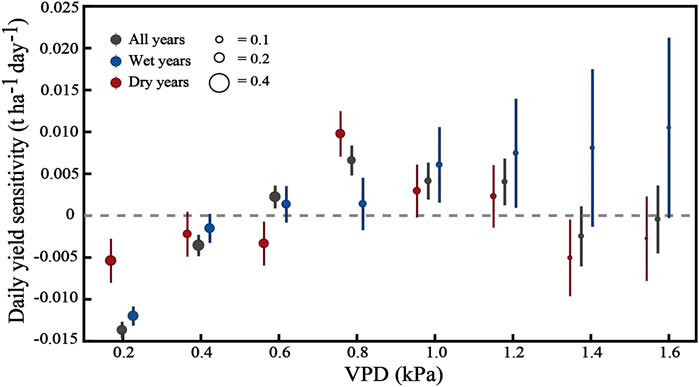
FIGURE 4. Daily sensitivity of maize yields to VPD under different soil moisture conditions. Eq. 3 estimates the response of the driest 40% (red), the wettest 40% (blue), and all grid-years (black) to the daily yield anomaly of vapor pressure deficit (VPD). A constant width interval from 0.4 kPa to 2 kPa is specified, and the center of the interval is marked on the horizontal axis. The size of the circles in the plot represents the percentage distribution of data that belongs to the corresponding interval in each set of data, and the vertical bar represents the 95% confidence interval corresponding to each sensitivity.
Figure 5 shows the estimated contributions of different VPD and soil moisture in the root zone of maize intensities to maize yield. Figures 5A–E are the contribution of VPD for different numerical intervals to the average yield of each grid point in 2010–2016. It is noteworthy that, whether it is the complementary addition of grid points from Figures 5A–E in turn or the sum of Figures 5F, G, their results are equal to the corresponding grids in 2010–2016. The value range of VPD 0.1–1.67 kPa is divided into 5 bins equally; for example, Figure 5A is 0.1–0.414 kPa, and so on. Although the yield contribution to 2010–2016 is negative for the entire Chinese maize growing region in Figure 5A (VPD: 0.1–0.414 kPa), a positive contribution gradually emerges with increasing VPD. When VPD increases to 0.728–1.042 (Figure 5C), all of northeastern and northern China have changed to meaningful positive contributions to yield, with changes up to 1.21 t ha-1. Negative values then appear again as the numerical contribution of VPD increases, but when atmospheric water demand is highest (Figure 5E), the overall negative impact in China is smaller than in Figure 5A, and positive impacts still dominate northeastern China. Similarly, Figures 5F–J shows the contribution of soil moisture to yield by equally dividing the interval 0.2–0.42 cm3 cm−3 at 0.044 cm3 cm−3 intervals. Although the trend in the contribution of soil moisture to yield in China from 2010 to 2016 is similar to that of VPD, the negative impact of relatively high soil moisture on yield is greater. In general, there is a trend of the negative-positive-negative contribution of VPD and SMr to maize yield, along with increasing the range of values taken. Moreover, the negative effect is more dominant in southwestern China for both VPD and root-zone soil moisture, which is consistent with the shift of maize center of gravity to the northeast, as analyzed in the previous section.
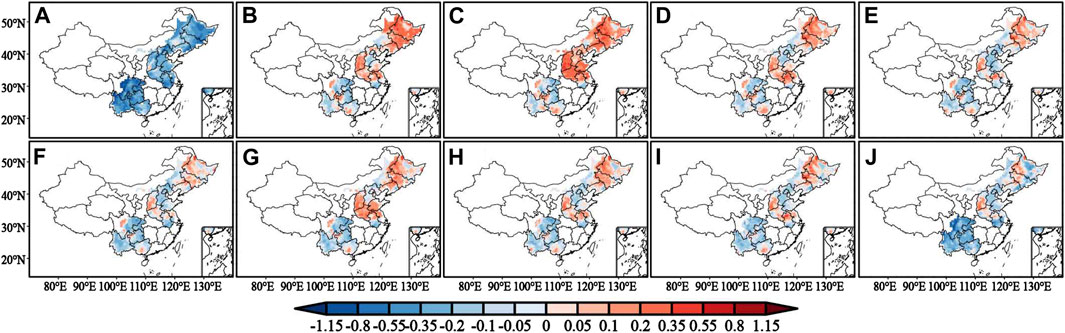
FIGURE 5. Contributions of VPD and SMr with different intensities to maize yield in 2010–2016. (A–E), the VPD contribution to maize yield was divided into five intervals from 0.1 kPa to 1.67 kPa (F–J), same as in a-e, but driven by the root-zone soil moisture of maize (SMr) from 0.2 cm3cm-3 to 0.42 cm3cm−3.
The yield response to VPD is shown here to be affected by soil water content, suggesting that both conditions should be considered when constructing yield models. We construct the model assuming that the yield response to climatic variables accumulates daily within each growing season. Based on this, a two-dimensional correlation model is built to infer VPD and soil moisture interactions (Figure 6). As previously described, the method is suitable for this study, in which yield is gradually accumulated according to changes in daily exposure to VPD and soil moisture. Applying the model Eq. 4 to 9,205 grid-year yields from 2010 to 2016 gives a yield-sensitivity model of the interaction between VPD and root-zone soil moisture (Figure 6). Yield sensitivity indicates that a supersaturated state of soil water content reduced yield by 0.011 t d−1 ha-1, while a dry state with high VPDs resulted in a yield loss of 0.006 t d−1 ha−1. The yield loss estimate for wet conditions is the average of the four negatively affected squares at the bottom right of the diagonal line in Figure 6. Similarly, the loss value for dry and high VPD conditions is the average of the three squares at the top left of the diagonal line.
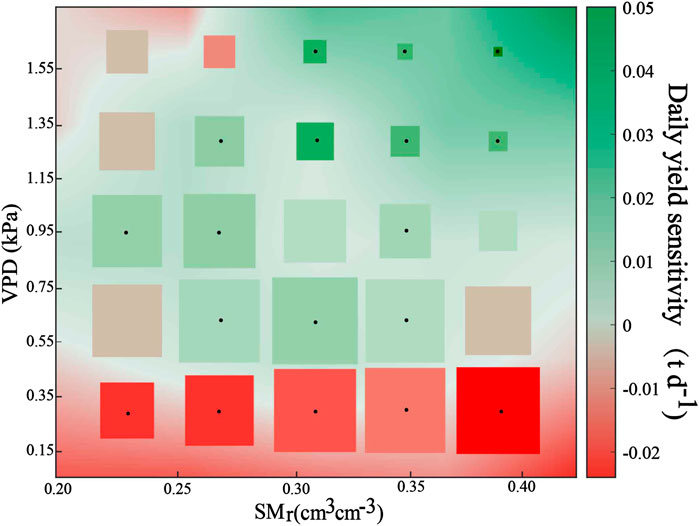
FIGURE 6. The response of maize yields to moisture supply and demand in 2010–2016. Based on observational data, we estimated the maize yield responses to VPD and root-zone soil moisture. The color of each rectangle shows the estimated daily maize yield sensitivity (i.e., βh factor) and the radius of the square indicates the relative amounts of days falling in each value interval. The largest icon in the figure means 8.21% of the used data. The black dots in squares indicate significant fitting coefficients (p < 0.05). The surface of the interpolated 25 coefficients is drawn behind the square.
3.3 Future yield prediction based on VPD and soil moisture
The response of yield to the increase in VPD is closely related to the soil moisture in the root zone. However, it remains unclear how changes in the balance between the demand and supply of moisture would impact future yield. Additionally, there is no guarantee that the past covariance between increased atmospheric demand and lower moisture supply will remain consistent in future climate change. Relative to the preindustrial (1850–1900) climatology in the 9 CMIP6 models, the vapor pressure of maize-growing regions in China could increase by up to 0.5 kPa in 2041–2100. The increase in VPD indicates that the temperature and saturated vapor pressure will increase in the future climate state. Still, since the relative humidity change is not apparent, the change in actual vapor pressure can also be ignored (Ficklin and Novick, 2017). The increase in VPD leads to a decrease in soil moisture content, and we have estimated here that the changes in VPD and soil moisture in the 9 models of CMIP6 are inversely correlated (r = −0.33). We analyze the average performance of VPD-based 1D and VPD-SMr-based on 2D polynomials in the SSP1-2.6, SSP2-4.5, SSP3-7.0, and SSP5-8.5 scenarios for nine models (Figure 7). The dotted lines in the Figure 7 represent the one-dimensional model, while the solid lines represent the participation of soil moisture. When the VPD increases by 0.5kPa, the model using the combination of root-zone soil moisture and VPD Eq. 6 shows that the SSP5-8.5 scenario will reduce the yield of about 276.1718 million tons per season, which is about 1.17 times the average yield in 2010–2016 (236.9214 million tons). If only the VPD-based one-dimensional model is used to estimate yields for future periods, the SSP1-2.6 scenario shows increased yield loss by less than twice the former. In contrast, it will increase the yield loss estimate by about 2.7 times in the SSP5-8.5 scenario. We also roughly estimate the modalities of the optimal water balance state in favor of maize under four different future scenarios (Supplementary Figure S3). After comparison, we find that with the gradual increase of the emission scenario, the optimal water balance conditions for maize will gradually change relative to 2010–2016, and the scope tends to shrink.
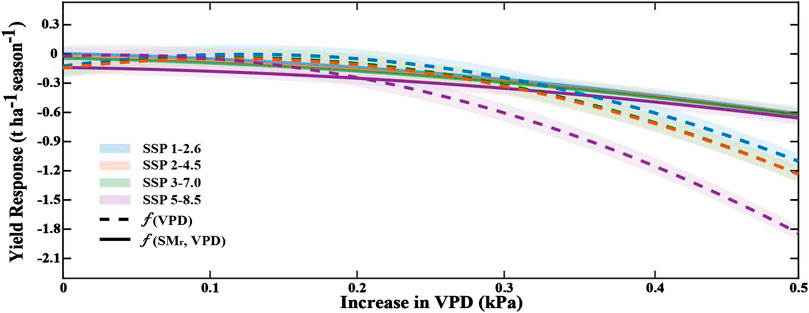
FIGURE 7. Maize yield response to VPD and SMr in different SSPs. Increasing the observed VPD and using the fitted polynomial function of the VPD (dashed line) and the fitted polynomial function of VPD and SMr (active line) to predict the future response of maize yield to VPD elevation in China. The shaded confidence interval represents a significant coefficient of fit (p < 0.05) from the distribution of the mean yield estimated from the bootstrap data from the grid (n = 10,000).
Under the projected warming of the climate, we calculate the specific future yield response of maize under 6 different warming conditions (1.5, 2.0, 2.5, 3.0, 3.5, 4.0°C) (Figure 8). In models where the warming degree of a certain emission scenario does not meet our calculation standard, we ignore it and average the remaining models. The highest and lowest ends of the error bars represent the difference in results for different modes, and in some cases, only one mode exists, so some columns do not have error bars (e.g., SSP1-2.6 at 1.5°C increase). We have listed the specific values of the average yield response of the 9 models for all 24 different emission paths or different warming states in Supplementary Table S2. When the future temperature increases by 4.0°C relative to the reference period, scenarios from SSP1-2.6 to SSP5-8.5 reduce production by about 0.0690, 1.5705, 2.1634, and 6.2310 million tons per season, respectively. That is about 0.003%, 0.663%, 0.913% (1/109) and 2.63% (1/38) of the average production in 2010–2016 (236.9214 million tons). Overall, maize yield loss gradually increases with rising temperature under either SSP scenario, although SSPs 1-2.6 are positive yield responses until temperature increases reach 4°C.
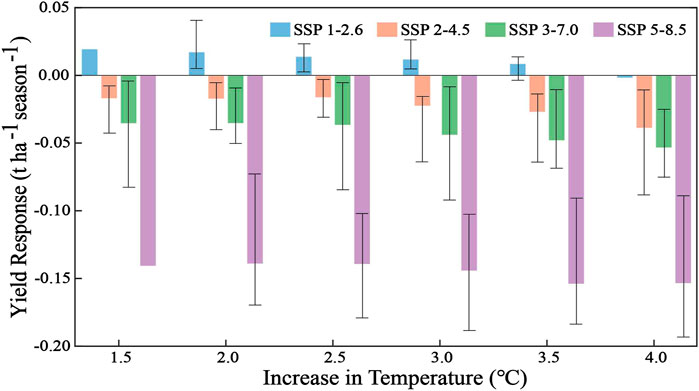
FIGURE 8. Yield response under different temperature-rising conditions in different SSPs. We predict yield responses under different temperature increases in different social sharing economy pathways using a fitted polynomial surface for VPD and SMr. The error bar indicates the difference between the models.
4 Discussion
The impact of climate change on agricultural production remains difficult to control, with the Fourth Assessment IPCC Report (Easterling et al., 2007) noting that moderate warming of the climate would benefit maize yields, while the Fifth Assessment Report (Porter et al., 2014) and the most recent the Sixth Assessment Report (Bezner et al., 2022) indicated yield losses. Accurately predicting future production is quite challenging. This uncertainty may be due to the fragmentation of existing climate-agriculture studies. The nuances of the constructed models will also impact the experimental results. If the key variables relating to yield are omitted from the model, it can easily cause biases in the results. It is well known that moisture and thermal stress are important variables affecting yield. Many studies on rainfed agriculture have shown that heat stress is associated with reduced yields (Schlenker and Roberts, 2009; Butler and Huybers, 2013; Lobell et al., 2013; Porter et al., 2014; Butler and Huybers, 2015; Zhao et al., 2017; Rigden et al., 2020). Although water is clearly essential for crop growth and development, the relationship between water effectiveness and yield is still not well resolved. Many studies using precipitation to indicate water availability have not yielded good results (Schlenker and Roberts, 2009; Butler and Huybers, 2013; Lobell et al., 2013). Soil moisture in the root zone indicates better water stress that affects plant water use. VPD is not only an indicator of air dryness and temperature but also accurately captures moisture stress in the environment.
Our study uses fine-scale meteorological data and combines it with a flexible linear mixed-effects model linking yield to weather variability in each season, considering the specification of fixed effects for grids. We calculate the sensitivity of maize yield to VPD under different soil moisture conditions in historical periods based on a mixed linear effects model (Figure 4), the results of which demonstrate the sensitivity of maize yield to VPD in the form of an approximate quadratic curve. The model was validated to be highly accurate (Figures 2, 5). This study therefore began by using a quadratic polynomial to predict the effect of VPD on maize yield in future periods. To analyse the effect of water stress on yield, we therefore modified the polynomial into a binary quadratic polynomial. We retained only the more significant results for scientific certainty (Figure 7).The focus of this study was to analyse the effect of soil moisture and VPD on maize yield during the historical period, which has been demonstrated in the previous paper with high accuracy of results. Then we want to study and quantify the effect of this effect on yield in the future period for the purpose of yield prediction. We demonstrate that a VPD and soil moisture imbalance reduces the daily yield response. The balance between soil moisture and atmospheric demand in the root zone provides optimal water balance conditions for maize yield, corresponding to the higher positive yield sensitivity in Figure 6, a phenomenon consistent with the true physiological state of maize (Kramer and Boyer, 1995). When the water supply exceeds the demand or is lower than the conditions required for the growth and development of maize, it will cause a loss of yield. The yield decline shown in Figure 6 under drier soil conditions and higher atmospheric moisture requirements may be caused by insufficient raw materials for plant photosynthesis. Specifically, maize closes its stomata to prevent its water loss due to excessive transpiration under such conditions (Bennett et al., 1987), and also to limit the uptake of CO2 from the atmosphere, thereby impeding photosynthesis (Farquhar and Sharkey, 1982). When the soil moisture is sufficient, and the atmospheric moisture demand is low, the negative response of the yield also indicates that the photosynthetic capacity of maize is decreasing. Numerous studies have shown that photosynthesis is sensitive to water stress and that the photosynthetic rate decreases with increasing water stress (Boyer, 1970; Ephrath and Hesketh, 1991; Dai et al., 1995). Water stress can lead to a decrease in chlorophyll content and even irreversible damage to chlorophyll if the water stress is too high (Zhao et al., 2003). The activity of the key enzyme (Bubisco), which fixes CO2 in photosynthesis, will also decrease. If the soil is oversaturated with water, it will lead to hypoxia of plant roots, reduce the absorption of nutrients, contact and increase the exposure to toxic substances, and also lead to the proliferation of fungal pathogens and eventually lead to reduced yields (Harvell et al., 2002; Rosenzweig et al., 2002; Li et al., 2019). Eventually, when atmospheric water demand is low, often accompanied by poor light conditions, photosynthesis can also be limited. Within climate change conditions, VPD and root-zone soil moisture are still the main study variables in the future. The main reason is that they are among the most directly related environmental variables for plant growth and development (Hsiao et al., 2019). We hypothesize that the joint distributions of VPD and root-zone soil moisture are unchanged except for changes in the mean, while yield sensitivity to these variables also remained unchanged. While we believe that process-based crop models can also assess the problem of crop demand and supply of atmospheric water (Tao et al., 2009), the method used in this study uses fewer parameters and yet can accurately represent and analyze the response of maize-growing regions as an extension to increased confidence in assessing future climate impacts on major crops around the world.
There are some limitations to our study. First, spring and summer maize are two types. Due to the lack of data, the study chose the entire maize belt as the study area to analyze the impact of climate change on maize yields throughout China. Second, our basic statistical approach does not quantify the effect of CO2 as a separate variable, but its effect is considered laterally in the study of atmospheric moisture demand and supply. Carbon dioxide is the basic raw material for plant photosynthesis, so its level affects maize growth and yield. The increase in global ambient CO2 concentration in recent decades and the change in the correspondence between it and water are likely to change the sensitivity (Rigden et al., 2020). It is still controversial that higher CO2 concentrations have the potential to increase yields (Lobell et al., 2013), which will need to be explored in future studies. Finally, our basic statistical approach cannot account for and quantify the effects of CO2 in regression analyses of observed yields because CO2 concentrations exist in concentration gradients throughout the atmosphere that flow endlessly, leaving only a slowly increasing time trend. Although crop growers have been adapting to climate change by introducing new technologies, the growth of global yields of major crops, including maize, has been gradually slowing or even remaining constant (Brisson et al., 2010; Ray et al., 2012). It is worth noting that the negative impact of global warming on yields, in addition to increasing VPD and reducing soil moisture, may also affect yields by shortening the phenological period of crops (Porter et al., 2014). For the purpose of the science and integrity of the study, we will later consider the effects of other natural elements (wind speed, solar radiation, etc.) and human influences (maize seed, management practices, etc.) on yield.
Since soil moisture plays an important role in regulating yield losses due to heat stress (Rigden et al., 2020), this study also implies that optimizing and adjusting management programs for water balance in the crop root zone to maintain higher soil moisture content is particularly important to increase yield sensitivity to the environment. Increasing management intensity and better crop varieties may also inadvertently increase yield sensitivity to weather (Lobell et al., 2014). Therefore, there is an urgent need to focus on national research and extension programs to promote production, including through crop-region-specific adaptation strategies, to offset the negative impact of future climate change on yields and ensure food security for a growing world population.
5 Conclusion
We first used grid-level maize yield data from GDHY v3.0 from 2010 to 2016, combined with high-resolution ERA 5 reanalysis meteorological data, to develop a yield estimation model based on a linear mixed-effect statistical model to favor the optimal water balance conditions for maize yield in China. Our findings showed that historical yield estimation derived from the combination between VPD and maize root-zone soil moisture (SMr) were obviously better than those from other fundamental variables alone or together. Only when the demand and supply of atmospheric moisture are relatively balanced can there be benefits to maize yields. If either side is too extreme, it can damage maize yields. Furthermore, soil moisture can regulate yield losses caused by thermal stress. We also extrapolated the above model results into the future using data from 9 global climate models from CMIP6, using a two-dimensional polynomial built on VPD and SMr to explore changes in maize yield under climatic conditions in future periods. We also estimated changes in maize under different temperatures (1.5, 2.0, 2.5, 3.0, 3.5, and 4.0°C) scenarios relative to the base period (1850–1900). We found that considering soil moisture in the future yield estimation reduces the overestimated yield loss by about a factor of two, compared to considering only atmospheric moisture requirements in SSP 1-2.6. This can even be reduced by a factor of 1.7 in SSP5-8.5. At the same time, under the different SSP scenarios, the reduction of maize yield gradually increased with the temperature rising. Moreover, for the same temperature increases, the yield loss also increases gradually with increasing emission concentration. The implications of these findings are vital for present and future food security purposes.
Data availability statement
The original contributions presented in the study are included in the article/Supplementary Material; further inquiries can be directed to the corresponding author.
Author contributions
FZ: Formal analysis and writing original draft; GW: Funding acquisition, project administration, resources and supervision; SL: Discussion and suggestion for research, supervision and reviewing; DH and WU: grammar modification and polishing.
Funding
This work was supported by the National Natural Science Foundation of China (NO. 42275028).
Conflict of interest
The authors declare that the research was conducted in the absence of any commercial or financial relationships that could be construed as a potential conflict of interest.
Publisher’s note
All claims expressed in this article are solely those of the authors and do not necessarily represent those of their affiliated organizations, or those of the publisher, the editors and the reviewers. Any product that may be evaluated in this article, or claim that may be made by its manufacturer, is not guaranteed or endorsed by the publisher.
Supplementary material
The Supplementary Material for this article can be found online at: https://www.frontiersin.org/articles/10.3389/fenvs.2023.1117184/full#supplementary-material
References
Abera, K., Crespo, O., Seid, J., and Mequanent, F. (2018). Simulating the impact of climate change on maize production in Ethiopia, East Africa. Environ. Syst. Res. 7 (1), 4–12. doi:10.1186/s40068-018-0107-z
Allen, R, G., Pereira, L, S., Raes, D., and Martin, S. (1998). Crop evapotranspiration: Guidelines for computing crop water requirements-FAO irrigation and drainage paper 56. Fao, Rome 300 (9), D05109.
Allen, R, G., Walter, I, A., Elliott, R., Mecham, B, Q., Jensen, M, E., Daniel, I., et al. (2000). “Issues, requirements and challenges in selecting and specifying a standardized ET equation,” in Proc., 4th national irrigation symp (Phoenix, Arizona: American Society of Agricultural Engineers), 201–208.
Arve, L. E., Torre, S., Olsen, J. E., and Tanino, K. K. (2011). “Abiotic stress in plants — Mechanisms and adaptation,” in Stomatal responses to drought stress and air humidity abiotic stress in plants. Editors A. Shanker, and B. Venkateswarlu (Rijeka: IntechOpen).
Basso, B., and Ritchie, J. (2014). Temperature and drought effects on maize yield. Nat. Clim. Change. 4 (4), 233. doi:10.1038/nclimate2139
Beier, C., Beierkuhnlein, C., Wohlgemuth, T., Penuelas, J., Emmett, B., Körner, C., et al. (2012). Precipitation manipulation experiments–challenges and recommendations for the future. Ecol. Lett. 15 (8), 899–911. doi:10.1111/j.1461-0248.2012.01793.x
Bennett, J. M., Sinclair, T. R., Muchow, R. C., and Costello, S. R. (1987). Dependence of stomatal conductance on leaf water potential, turgor potential, and relative water content in field-grown soybean and maize. Crop Sci. 27 (5), 984–990. doi:10.2135/cropsci1987.0011183x002700050033x
Bezner, K. R., Hasegawa, T., Lasco, R., Bhatt, I., Deryng, D., Farrell, A., et al. (2022). “Food, fibre, and other ecosystem products,” in Climate change 2022: Impacts, adaptation, and vulnerability. Contribution of working group II to the Sixth assessment Report of the intergovernmental panel on climate change (Cambridge, United Kingdom: Cambridge University Press).
Boyer, J. (1970). Leaf enlargement and metabolic rates in corn, soybean, and sunflower at various leaf water potentials. Plant physiol. 46 (2), 233–235. doi:10.1104/pp.46.2.233
Brisson, N., Gate, P., Gouache, D., Charmet, G., Oury, F. X., and Huard, F. (2010). Why are wheat yields stagnating in europe? A comprehensive data analysis for France. Field Crops Res. 119 (1), 201–212. doi:10.1016/j.fcr.2010.07.012
Butler, E. E., and Huybers, P. (2013). Adaptation of US maize to temperature variations. Nat. Clim. Change. 3 (1), 68–72. doi:10.1038/nclimate1585
Butler, E. E., and Huybers, P. (2015). Variations in the sensitivity of US maize yield to extreme temperatures by region and growth phase. Environ. Res. Lett. 10 (3), 034009. doi:10.1088/1748-9326/10/3/034009
Carter, E. K., Melkonian, J., Riha, S. J., and Shaw, S. B. (2016). Separating heat stress from moisture stress: Analyzing yield response to high temperature in irrigated maize. Environ. Res. Lett. 11 (9), 094012. doi:10.1088/1748-9326/11/9/094012
Chen, C., Zhou, G. S., and Pang, Y. M. (2015). Impacts of climate change on maize and winter wheat yields in China from 1961 to 2010 based on provincial data. J. Agric. Sci. 153 (5), 825–836. doi:10.1017/s0021859614001154
Chen, S., Jiang, T., Ma, H., He, C., Xu, F., Malone, R. W., et al. (2020). Dynamic within-season irrigation scheduling for maize production in northwest China: A method based on weather data fusion and yield prediction by dssat. Agric. For. Meteorol. 285-286, 107928–108286. doi:10.1016/j.agrformet.2020.107928
Dai, J., Shen, X., Xu, S., Wang, L., Cui, Q., and Zhu, Y. (1995). Effects of water stress on photosynthetic properties and yield of maize. Acta Agron. Sin. 11 (03), 356–363+112. doi:10.3321/j.issn:0496-3490.1995.03.017
Easterling, W. E., Aggarwal, P. K., Batima, P., Brander, L., Erda, S. M., and Howden, A. (2007). “Food, fibre and forest products climate change 2007: Impacts, adaptation and vulnerability,” in Contribution of working group II to the Fourth assessment Report of the intergovernmental panel on climate change. Editor M. L. Parry (Cambridge, United Kingdom: Cambridge University Press), 273–313.
Ephrath, J. E., and Hesketh, J. D. (1991). The effects of drought stress on leaf elongation, photosynthetic and transpiration rates in maize (Zea mays) leaves. Photosynth. (CSFR) 25, 607–619. doi:10.5897/ajmr11.964
FAOSTAT (2020). Food and agricultural organization of the united nations agricul-ture databases. Avaliable at: http://www.fao.org/faostat/en/#data/QCL/visualize.
Farquhar, G. D., and Sharkey, T. D. (1982). Stomatal conductance and photosynthesis. Annu. Rev. Plant Physiol. 33, 317–345. doi:10.1146/annurev.pp.33.060182.001533
Feng, P., Wang, B., Li Liu, D., Waters, C., Xiao, D., Shi, L., et al. (2020). Dynamic wheat yield forecasts are improved by a hybrid approach using a biophysical model and machine learning technique. Agric. For. Meteorol 285, 107922. doi:10.1016/j.agrformet.2020.107922
Feng, P., Wang, B., Liu, D. L., Xing, H., Ji, F., Macadam, I., et al. (2018). Impacts of rainfall extremes on wheat yield in semi-arid cropping systems in eastern Australia. Clim. Change 147 (3), 555–569. doi:10.1007/s10584-018-2170-x
Fezzi, C., and Bateman, I. (2015). The impact of climate change on agriculture: Nonlinear effects and aggregation bias in ricardian models of farmland values. J. Assoc. Environ. Resour. Econ. 2 (1), 57–92. doi:10.2139/ssrn.2358004
Ficklin, D. L., and Novick, K. A. (2017). Historic and projected changes in vapor pressure deficit suggest a continental-scale drying of the United States atmosphere. J. Geophys. Res. Atmos. 122, 2061–2079. doi:10.1002/2016jd025855
Fujimori, S., Hasegawa, T., Masui, T., Takahashi, K., Herran, D. S., Dai, H., et al. (2017). SSP3: AIM implementation of shared socioeconomic pathways. Glob. Environ. Change 42, 268–283. doi:10.1016/j.gloenvcha.2016.06.009
Guo, S., Mo, Y., Wu, Z., Wang, J., Zhang, Y., Gong, S., et al. (2021). The effects of furrow depth in alternate row planting on germination and yield of spring maize under subsurface drip irrigation in north China plain. J. Irrigation Drainage 40 (08), 27–34. doi:10.13522/j.cnki.ggps.2019443
Hagan, D. F. T., Parinussa, R. M., Wang, G., and Draper, C. S. (2019). An evaluation of soil moisture anomalies from global model-based datasets over the people’s Republic of China. Water 12 (1), 117. doi:10.3390/w12010117
Harvell, C. D., Mitchell, C. E., Ward, J. R., Altizer, S., Dobson, A. P., Ostfeld, R. S., et al. (2002). Climate warming and disease risks for terrestrial and marine biota. Science 296 (5576), 2158–2162. doi:10.1126/science.1063699
Hersbach, H., Bell, B., Berrisford, P., Hirahara, S., Horányi, A., Muñoz-Sabater, J., et al. (2020). The ERA5 global reanalysis. Q. J. R. Meteorological Soc. 146 (730), 1999–2049. doi:10.1002/qj.3803
Hsiao, J., Swann, A. L., and Kim, S. H. (2019). Maize yield under a changing climate: The hidden role of vapor pressure deficit. Agric. For. Meteorology 279, 107692. doi:10.1016/j.agrformet.2019.107692
Huai, H., Sun, N., Yu, J., Li, C., Zhang, Q., Wang, A., et al. (2020). Study on growth periods of spring maize in Northeast China under climate change. Jiangsu Agric. Sci. 48 (05), 80–83. doi:10.15889/j.issn.1002-1302.2020.05.016
Iizumi, T., and Sakai, T. (2020). The global dataset of historical yields for major crops 1981–2016. Sci. Data 7 (1), 97–7. doi:10.1038/s41597-020-0433-7
Jiang, H., Wang, G., Li, S., Ullah, W., Amankwah, S. O. Y., and Lu, J. (2022). Effect of CO2 concentration on drought assessment in China. Int. J. Climatol. 1, 7465–7482. doi:10.1002/joc.7657
Jones, P., and Thornton, P. (2003). The potential impacts of climate change on maize production in Africa and Latin America in 2055. Glob. Environ. Change 13 (1), 51–59. doi:10.1016/S0959-3780(02)00090-0
Kazmi, D. H., Li, J., Rasul, G., Tong, J., Ali, G., Cheema, S. B., et al. (2015). Statistical downscaling and future scenario generation of temperatures for Pakistan region. Theor. Appl. Climatol. 120 (1–2), 341–350. doi:10.1007/s00704-014-1176-1
Kramer, P. J., and Boyer, J. S. (1995). Water relations of plants and soils. Amsterdam, Netherlands: Elsevier. doi:10.1016/j.scitotenv.2022.153664
Leng, G., and Hall, W. J. (2020). Predicting spatial and temporal variability in crop yields: An inter-comparison of machine learning, regression and process-based models. Environ. Res. Lett. 15, 044027. doi:10.1088/1748-9326/ab7b24
Lesk, C., Coffel, E., and Horton, R. (2020). Net benefits to US soy and maize yields from intensifying hourly rainfall. Nat. Clim. Chang. 10 (9), 819–822. doi:10.1038/s41558-020-0830-0
Li, E., Zhao, J., Ye, Q., Gao, J., and Yang, X. (2021a). The possible effects of global warming on cropping systems in ChinaⅫⅠ.Precipitation limitation on adjusting maturity cultivars of spring maize and its possible influence on yield in three provinces of northeastern China. Sci. Agric. Sin. 54 (18), 3847–3859. doi:10.3864/j.issn.0578-1752.2021.18.005
Li, H., Sheffield, J., and Wood, E. F. (2010). Bias correction of monthly precipitation and temperature fields from Intergovernmental Panel on Climate Change AR4 models using equidistant quantile matching. J. Geophys. Res. Atmos. 115, D10101. doi:10.1029/2009JD012882
Li, L., Wang, B., Feng, P., Wang, H., He, Q., Wang, Y., et al. (2011). Crop yield forecasting and associated optimum lead time analysis based on multi-source environmental data across China. Agric. For. Meteorology 308-309, 108558–109309. doi:10.1016/j.agrformet.2021.108558
Li, S. J., Wang, G. J., Sun, S. L., Hagan, T. F. D., Chen, T. X., Dolman, H., et al. (2021b). Long-term changes in evapotranspiration over China and attribution to climatic drivers during 1980–2010. J. Hydrol. 595, 126037. doi:10.1016/j.jhydrol.2021.126037
Li, S., Wang, G., Zhu, C., Lu, J., Ullah, W., Hagan, D. F. T., et al. (2022). The impact of climate change on maize yields in the United States and ChinaLi, X. Hydrol. Earth Syst. Sci.Agric. Syst. 26104 (4), 3691348–3707353. doi:10.5194/hess-26-3691-202210.1016/j.agsy.2010.12.006
Li, X., Takahashi, T., Suzuki, N., and Kaiser, H. M. (2014). Impact of climate change on maize production in Northeast and Southwest China and risk mitigation strategies. Apcbee Procedia 8, 11–20. doi:10.1016/j.apcbee.2014.01.073
Li, Y., Guan, K., Schnitkey, G. D., DeLucia, E., and Peng, B. (2019). Excessive rainfall leads to maize yield loss of a comparable magnitude to extreme drought in the United States. Glob. Change Biol. 5, 2325–2337. doi:10.1111/gcb.14628
Liang, L., Ma, L., Liu, T., Sun, B., Zhou, Y., and Liu, Y. (2018). Spatiotemporal variation of the temperature mutation and warming hiatus over northern China during 1951—2014. China Environ. Sci. 38 (51), 1601–1615. doi:10.3969/j.issn.1000-6923.2018.05.001
Liu, T., Zhu, X., Guo, R., Xu, K., and Zhang, S. (2022). Applicability of ERA5 reanalysis of precipitation data in China. Arid. Land Geogr. 45 (1), 66–79. doi:10.12118/j.issn.1000–6060.2021.132
Liu, Y., Wang, E., Yang, X., and Wang, J. (2010). Contributions of climatic and crop varietal changes to crop production in the North China Plain, since 1980s. Glob. Change Biol. 16 (8), 2287–2299. doi:10.1111/j.1365-2486.2009.02077.x
Lobell, D. B., Hammer, G. L., McLean, G., Messina, C., Roberts, M. J., and Schlenker, W. (2013). The critical role of extreme heat for maize production in the United States. Nat. Clim. Change. 3 (5), 497–501. doi:10.1038/nclimate1832
Lobell, D. B., Roberts, M. J., Schlenker, W., Braun, N., Little, B. B., Rejesus, R. M., et al. (2014). Greater sensitivity to drought accompanies maize yield increase in the US Midwest. Science 344 (6183), 516–519. doi:10.1126/science.1251423
Luo, Y., Zhang, Z., Chen, Y., Li, Z., and Tao, F. (2020). ChinaCropPhen1km: A high-resolution crop phenological dataset for three staple crops in China during 2000–2015 based on leaf area index (LAI) products. Earth Syst. Sci. Data 12 (1), 197–214. doi:10.5194/essd-12-197-2020
IPCC (2021). “Summary for policymakers. In: Climate change 2021: The physical science basis,” in Contribution of working group I to the Sixth assessment Report of the intergovernmental panel on climate change. V. Masson-Delmotte, P. Zhai, A. Pirani, S. L. Connors, C. Péan, and S. Berger (Cambridge: Cambridge University Press).
Mercado, L. M., Bellouin, N., Sitch, S., Boucher, O., Huntingford, C., Wild, M., et al. (2009). Impact of changes in diffuse radiation on the global land carbon sink. Nature 458 (7241), 1014–1017. doi:10.1038/nature07949
Miao, S., Xu, Y., and Lu, Q. (2014). Maize yield and growth factor decomposition in three major districts of China. Hubei Agric. Sci. 53 (12), 2932–2936. doi:10.14088/j.cnki.issn0439-8114.2014.12.055
Mondal, S. K., Huang, J., Wang, Y., Su, B., Kundzewicz, Z. W., Jiang, S., et al. (2022). Changes in extreme precipitation across South Asia for each 0.5 °C of warming from 1.5 °C to 3.0 °C above pre-industrial levels. Atmos. Res. 266, 105961. doi:10.1016/j.atmosres.2021.105961
Nandram, B., Berg, E., and Barboza, W. (2013). A hierarchical Bayesian model for forecasting state-level corn yield. Environ. Ecol. Stat. 21 (3), 507–530. doi:10.1007/s10651-013-0266-z
Novick, K. A., Ficklin, D. L., Stoy, P. C., Williams, C. A., Bohrer, G., Oishi, A. C., et al. (2016). The increasing importance of atmospheric demand for ecosystem water and carbon fluxes. Nat. Clim. Change 6 (11), 1023–1027. doi:10.1038/nclimate3114
NSBC (National Bureau of Statistics of the People’s Republic of China) (2021). China statistical yearbook 2020. Beijing: China Statistics Press.
Ortiz-Bobea, A., Wang, H., Carrillo, C. M., and Ault, T. R. (2019). Unpacking the climatic drivers of US agricultural yields. Environ. Res. Lett. 14 (6), 064003. doi:10.1088/1748-9326/ab1e75
Peng, S., Huang, J., Sheehy, J. E., Laza, R. C., Visperas, R. M., Zhong, X., et al. (2004). Rice yields decline with higher night temperature from global warming. Proc. Natl. Acad. Sci. 101 (27), 9971–9975. doi:10.1073/pnas.0403720101
Peters, G. P., Andrew, R. M., Canadell, J. G., Fuss, S., Jackson, R. B., Korsbakken, J. I., et al. (2017). Key indicators to track current progress and future ambition of the Paris Agreement. Nat. Clim. Change 7 (2), 118–122. doi:10.1038/nclimate3202
Porter, J. R., Xie, L., Challinor, A. J., Cochrane, K., Howden, S. M., Iqbal, M. M., et al. (2014). “Food security and food production systems. Climate change 2014: Impacts, adaptation and vulnerability Part A: Global and sectoral aspects,” in Contribution of working group II to the Fifth assessment Report of the intergovernmental panel on climate change. Editor C. B. Field (Cambridge: Cambridge University Press), 485–533.
Ray, D. K., Ramankutty, N., Mueller, N. D., West, P. C., and Foley, J. A. (2012). Recent patterns of crop yield growth and stagnation. Nat. Commun. 3 (1), 1293–1297. doi:10.1038/ncomms2296
Reichstein, M., Bahn, M., Ciais, P., Frank, D., Mahecha, M. D., Seneviratne, S. I., et al. (2013). Climate extremes and the carbon cycle. Nature 500 (7462), 287–295. doi:10.1038/nature12350
Richter, I., and Tokinaga, H. (2020). An overview of the performance of CMIP6 models in the tropical atlantic: Mean state, variability, and remote impacts. Clim. Dyn. 55 (9–10), 2579–2601. doi:10.1007/s00382-020-05409-w
Rigden, A. J., Mueller, N. D., Holbrook, N. M., Pillai, N., and Huybers, P. (2020). Combined influence of soil moisture and atmospheric evaporative demand is important for accurately predicting US maize yields. Nat. Food 1 (2), 127–133. doi:10.1038/s43016-020-0028-7
Rosenzweig, C., Tubiello, F. N., Goldberg, R., Mills, E., and Bloomfield, J. (2002). Increased crop damage in the US from excess precipitation under climate change. Glob. Environ. Change 12 (3), 197–202. doi:10.1016/s0959-3780(02)00008-0
Sacks, W. J., Deryng, D., Foley, J. A., and Ramankutty, N. (2010). Crop planting dates: An analysis of global patterns. Glob. Ecol. Biogeogr. 19 (5), 607–620. doi:10.1111/j.1466-8238.2010.00551.x
Schlenker, W., and Roberts, M. J. (2009). Nonlinear temperature effects indicate severe damages to US crop yields under climate change. Proc. Natl. Acad. Sci. 106 (37), 15594–15598. doi:10.1073/pnas.0906865106
Siebert, S., Ewert, F., Rezaei, E. E., Kage, H., and Graß, R. (2014). Impact of heat stress on crop yield—On the importance of considering canopy temperature. Environ. Res. Lett. 9 (4), 044012. doi:10.1088/1748-9326/9/4/044012
Slaets, J. I., Piepho, H. P., Schmitter, P., Hilger, T., and Cadisch, G. (2017). Quantifying uncertainty on sediment loads using bootstrap confidence intervals. Hydrol. Earth Syst. Sci. 21 (1), 571–588. doi:10.5194/hess-21-571-2017
Sulman, B. N., Roman, D. T., Yi, K., Wang, L., Phillips, R. P., and Novick, K. A. (2016). High atmospheric demand for water can limit forest carbon uptake and transpiration as severely as dry soil. Geophys. Res. Lett. 43 (18), 9686–9695. doi:10.1002/2016gl069416
Tao, F., Yokozawa, M., and Zhang, Z. (2009). Modelling the impacts of weather and climate variability on crop productivity over a large area: A new process-based model development, optimization, and uncertainties analysis. Agric. For. Meteorol 149 (5), 831–850. doi:10.1016/j.agrformet.2008.11.004
Tao, F., Zhang, Z., Zhang, S., Zhu, Z., and Shi, W. (2012). Response of crop yields to climate trends since 1980 in China. Clim. Res. 54 (3), 233–247. doi:10.3354/cr01131
UNFCCC (United Nations Framework Convention on Climate Change) (2015). The Paris agreement. Avaliable at: http://unfccc.int/paris_agreement/items/9485.php.
Upreti, H., and Ojha, C. S. P. (2017). Estimation of relative humidity and dew point temperature using limited meteorological data. J. Irrigation Drainage Eng. 143 (9), 05017005. doi:10.1061/(ASCE)IR.1943-4774.0001225
van Vuuren, D. P., Isaac, M., Kundzewicz, Z. W., Arnell, N., Barker, T., Criqui, P., et al. (2011). The use of scenarios as the basis for combined assessment of climate change mitigation and adaptation. Glob. Environ. Change 21 (2), 575–591. doi:10.1016/j.gloenvcha.2010.11.003
Van Vuuren, D. P., Stehfest, E., Gernaat, D. E., Doelman, J. C., Van den Berg, M., Harmsen, M., et al. (2017). Energy, land-use and greenhouse gas emissions trajectories under a green growth paradigm. Glob. Environ. Change 42, 237–250. doi:10.1016/j.gloenvcha.2016.05.008
Vautard, R., Gobiet, A., Sobolowski, S., Kjellström, E., Stegehuis, A., Watkiss, P., et al. (2014). The European climate under a 2°C global warming. Environ. Res. Lett. 9 (3), 034006. doi:10.1088/1748-9326/9/3/034006
Wang, D., Shen, R., Shi, C., Li, M., and Zhang, Y. (2015). Ahmad M fahim. Simulation for China’s soil moisture by CLM4.5 in summer season. Sci. Technol. Eng. 15 (17), 10–17. doi:10.3969/j.issn.1671-1815.2015.17.003
Wang, S., Guan, Y., Wang, F., Huang, A., and Zhang, Y. A. (2010). Bmi-1 regulates self-renewal, proliferation and senescence of human fetal neural stem cells in vitro. Mod. Animal Husb. Sci. Technol. 476 (06), 74–78. doi:10.1016/j.neulet.2010.04.006
Webber, H., Ewert, F., Kimball, B. A., Siebert, S., White, J. W., Wall, G. W., et al. (2016). Simulating canopy temperature for modelling heat stress in cereals. Environ. Modell. Softw. 77, 143–155. doi:10.1016/j.envsoft.2015.12.003
Whish, J. P., Herrmann, N. I., White, N. A., Moore, A. D., and Kriticos, D. J. (2015). Integrating pest population models with biophysical crop models to better represent the farming system. Environ. Modell. Softw. 72, 418–425. doi:10.1016/j.envsoft.2014.10.010
Wilby, R. L., and Wigley, T. M. (1997). Downscaling general circulation model output: A review of methods and limitations. Prog. Phys. Geogr. 21, 530–548. doi:10.1177/030913339702100403
Wood, A. W., Maurer, E. P., Kumar, A., and Lettenmaier, D. P. (2002). Long-range experimental hydrologic forecasting for the eastern United States. J. Geophys. Res. Atmos. 107 (D20), 4429. doi:10.1029/2001JD000659
Xu, Z., Song, Z., Deng, A., Chen, W., Chen, F., and Zhang, W. (2013). Regional changes of production layout of main grain crops and their actuation factors during 1981-2008 in China. J. Nanjing Agric. Univ. 36 (1), 79–86. doi:10.7685/j.issn.1000-2030.2013.01.014
Yang, D., Xiong, W., Xu, Y., Feng, L., Zhang, M., and Liu, H. (2017). Analysis of reason for recent slowing maize yield increase under climate change in China. Trans. CSAE 33 (1), 231–238. doi:10.11975/j.issn.1002-6819.2017.z1.035
Yao, N., Li, Y., Lei, T., and Peng, L. (2018). Drought evolution, severity and trends in mainland China over 1961–2013. Sci. Total Environ. 616, 73–89. doi:10.1016/j.scitotenv.2017.10.327
Yu, H. (2014). Exploring climatic suitability based on the distribution of maize growing areas in China. Beijing Agriculture 36, 35–36.
Yuan, W., Zheng, Y., Piao, S., Ciais, P., Lombardozzi, D., Wang, Y., et al. (2019). Increased atmospheric vapor pressure deficit reduces global vegetation growth. Sci. Adv. 5 (8), eaax1396. doi:10.1126/sciadv.aax1396
Zhang, L., Chen, X., and Xin, X. (2019). Short commentary on CMIP6 scenario model Intercomparison project (ScenarioMIP). Clim. Change Res. 15 (5), 519–525. doi:10.12006/j.issn.1673-1719.2019.082
Zhang, L., Wu, P., Zhou, T., Roberts, M. J., and Schiemann, R. (2016). Added value of high-resolution models in simulating global precipitation characteristics. Atmos. Sci. Lett. 17 (12), 646–657. doi:10.1002/asl.715
Zhang, Y., Piao, S., Sun, Y., Rogers, B. M., Li, X., Lian, X., et al. (2022). Future reversal of warming-enhanced vegetation productivity in the Northern Hemisphere. Nat. Clim. Chang. 12, 581–586. doi:10.1038/s41558-022-01374-w
Zhao, C., Liu, Bing., Piao, S., Wang, X., Lobell, D., Huang, Y., et al. (2017). Temperature increase reduces global yields of major crops in four independent estimates. Proc. Natl. Acad. Sci. U. S. A. 114, 9326–9331. doi:10.1073/pnas.1701762114
Zhao, J., Guo, J., and Mu, J. (2015). Exploring the relationships between climatic variables and climate-induced yield of spring maize in Northeast China. Agric. Ecosyst. Environ. 207, 79–90. doi:10.1016/j.agee.2015.04.006
Zhao, J., Yang, X., Liu, Z., Lv, S., Wang, J., and Dai, S. (2016). Variations in the potential climatic suitability distribution patterns and grain yields for spring maize in Northeast China under climate change. Clim. Change 137 (1), 29–42. doi:10.1007/s10584-016-1652-y
Zhao, T., Shen, X., Yang, D., and Ma, X. (2003). Effects on chlorophyll content and photosynthetic rate of maize leaves under water stress and rewatering. Rain Fed. Crops 23 (1), 33–35. doi:10.3969/j.issn.2095-0896.2003.01.012
Zheng, S., Hu, Q., He, H., Xing, M., Gao, H., Liu, Y., et al. (2022). Temporal and spatial variation characteristics of radiation in winter wheat-summer maize growing season in the North China Plain during 1961-2020. J. China Agric. Univ. 27 (01), 26–37. doi:10.11841/j.issn.1007-4333.2022.01.03
Zhu, J., Zhang, M., Zhang, Y., Zeng, X., and Xiao, X. (2018). Response of tropical terrestrial gross primary production to the super El Niño event in 2015. J. Geophys. Res. Biogeosciences 123 (10), 3193–3203. doi:10.1029/2018JG004571
Keywords: climate change, CMIP6, maize yield, soil moisture, VPD, yield prediction
Citation: Zhao F, Wang G, Li S, Hagan DFT and Ullah W (2023) The combined effects of VPD and soil moisture on historical maize yield and prediction in China. Front. Environ. Sci. 11:1117184. doi: 10.3389/fenvs.2023.1117184
Received: 06 December 2022; Accepted: 10 February 2023;
Published: 20 February 2023.
Edited by:
Xi Zhang, Louisiana State University Agricultural Center, United StatesCopyright © 2023 Zhao, Wang, Li, Hagan and Ullah. This is an open-access article distributed under the terms of the Creative Commons Attribution License (CC BY). The use, distribution or reproduction in other forums is permitted, provided the original author(s) and the copyright owner(s) are credited and that the original publication in this journal is cited, in accordance with accepted academic practice. No use, distribution or reproduction is permitted which does not comply with these terms.
*Correspondence: Guojie Wang, Z3dhbmdAbnVpc3QuZWR1LmNu