
94% of researchers rate our articles as excellent or good
Learn more about the work of our research integrity team to safeguard the quality of each article we publish.
Find out more
ORIGINAL RESEARCH article
Front. Environ. Sci., 12 May 2023
Sec. Soil Processes
Volume 11 - 2023 | https://doi.org/10.3389/fenvs.2023.1116930
This article is part of the Research TopicCarbon and Nitrogen Cycling in Grassland EcosystemsView all 6 articles
 Rajendra Kumar Yadav1†
 Tapan Jyoti Purakayastha2*†
 Dhiraj Kumar3†
 Prakash Kumar Jha4†
 Deep Mohan Mahala5
 Dinesh Kumar Yadav3
 M. A. Khan2
 Surendra Singh6
 Shikha Singh7
 P. V. Vara Prasad4,8
Introduction: Soil organic matter (SOM) quality is the major driving force for nutrient cycles impacting the productivity of cropping systems. Identification of sensitive indicators and developing metrics to assess SOM quality is a major challenge under field conditions.
Methods: Data from a continuing long-term experiment since 2005 at Modipuram, India, were analyzed with key objectives to 1) observe the long-term effect of vermicompost/crop residues alone or in conjunction with NPK chemical fertilizers on crop yield and quality of SOM, 2) identify and develop SOM quality indicators (SOMQI) by encompassing sensitive indicators, and 3) predict system productivity by using SOMQI under rice (Oryza sativa L.)–potato (Solanum tuberosum L.)–wheat (Triticum aestivum L.) (RPW) and maize (Zea mays L.)–potato–onion (Allium cepa L.) (MPO) cropping systems. The treatments comprised of 100% NPK fertilizer; 100% N from vermicompost (N-VC); 50% NPK from fertilizer + 50% N from VC; 100% NPK from fertilizer + crop residue (CR); 100% N from VC + CR.
Results: Results showed that continuous application of 100% N-VC and 100% N-VC+CR for eight years considerably increased the soil’s particulate organic matter carbon (POM-C), light fraction organic matter carbon (LFOM-C), and nitrogen (LFOM-N), dissolved organic carbon (DOC) and nitrogen (DON), as well as the available N (AN), available P (AP) and available S (AS) over control. Principal component analysis (PCA) identified AN, POM-C, LFOM-C: N, and DON in RPW and AN, POM-C, microbial biomass carbon (MBC), and LFOM-C: N in MPO cropping system as sensitive SOM quality indicators for the development of SOMQI. Under the MPO cropping system, results were more pronounced with 100% N-VC and 50% NPK+50% N-VC at 0–15 cm soil depth. Furthermore, at 15–30 cm depth, the effect was more prominent in 100% NPK + CR over other treatments.
Discussion: Overall MPO cropping system exhibited better SOMQI than the RPW system. Rice, wheat, and maize yields increased significantly under different fertilizer treatments with organic or inorganic amendments. Substitution of fertilizer N with organic sources showed comparable yields obtained under 100% NPK treatment. Partial substitution of chemical fertilizers either by VC and/or CR enhanced the SOM quality and productivity under both cropping systems. The use of PCA-based SOMQI can be helpful in assessing SOM quality and predicting the productivity of cropping systems.
The most prevalent cropping system in north-western India is the rice (Oryza sativa L.)–wheat (Triticum aestivum L.) cropping system (RWCS), which is prone to deterioration of soil health and overexploitation of underground water resources (Parihar et al., 2016). In the northern Indian plains, certain practices, such as intensive rice cultivation using a traditional paddy rice method over an extended period, have been linked to severe degradation of natural resources, declining productivity, multiple nutrient deficiencies, groundwater depletion, labor shortages, and higher cultivation costs, raising concerns about the sustainability of RWCS. Some of the most important solutions to address these issues in rice cultivation are varietal development, efficient soil and water management, and implementation of resource conservation technologies. Through policy interventions, it is crucial to promote the cultivation of less water-intensive crops to replace rice in rainfed areas and light texture soil (Sharma et al., 2012). Therefore, RWCS diversification is crucial for reducing the problems caused by the rice–wheat monoculture. The diversification of RW systems with maize (Zea mays L.)-based systems and adopting alternative soil and crop management strategies could enhance the system productivity, maintain environmental quality (Parihar et al., 2016; Kumar et al., 2022) and soil health, save irrigation water, and reduce labor costs (Aulakh and Grant, 2008). The introduction of potato/onion as a cash crop after wet season rice in either the RWCS or maize-based cropping system might enhance productivity, income, and sustainability. However, maintaining or enhancing soil organic matter (SOM) is a vital component of soil fertility and productivity of intensive cropping systems like rice–potato (Solanum tuberosum L.)–wheat (RPW) or maize–potato–onion (Allium cepa L.) (MPO) because of high nutrient demand. Numerous studies showed that better fertilizer management, residue incorporation, reduced tillage, manuring, compost application, green manures, crop rotation, and efficient irrigation methods improved soil organic carbon (SOC) build-up and storage (Rudrappa et al., 2006; Purakayastha et al., 2008; Nayak et al., 2012; Das et al., 2019; Ghosh et al., 2019). Among these, the addition of organic material is one of the key strategies which can improve soil quality and SOC.
In developing countries, the price of inorganic fertilizer is relatively high but the supply of local organic resources is available. Incorporation/retention of the crop residues into soil is an environment-friendly option to utilize the residues and minimize straw burning which causes environmental pollution (Purakayastha et al., 2008). Straw and stubble burning is a major concern in India, although the Indian government has taken few steps to curtail this in recent years (Porichha et al., 2021). Maintenance of SOM, particularly its quality, is crucial for the supply of nutrients to the plant and improving soil quality (Nayak et al., 2012). The quality of SOC is the capability of organic C to release carbon dioxide (CO2) through metabolic pathways and to provide organic substances. Low-quality organic C is associated with organic C molecules that require a lot of enzymatic processes to release CO2 (Ladha et al., 2003). Measuring variations in the amount of total SOC, especially labile forms of SOM (Wiaux et al., 2014), helps in identifying changes in soil quality brought on by the management (Tisdall and Oades, 1982). Due to their faster recycling and ability to promote nutrient release, soil microbial biomass C and water-soluble C are significant SOM quality metrics (Janzen et al., 1992; Manna et al., 2013). Although several studies have been conducted worldwide to identify the best management techniques that improve soil quality (Karlen et al., 1994; Andrews et al., 2004; Bhaduri and Purakayasth, 2014; Biswas et al., 2017), studies on the effects of SOM quality-based management methods on crop yields are scarce. Moreover, there are limited metrics available for measuring the quality of SOM.
Through this study, we intend to assess the SOM quality under different management practices and develop a soil organic matter quality index (SOMQI) for monitoring changes in the SOM quality under the soil management assessment framework (SMAF). We hypothesized that the SOM quality, nutrient availability, and crop yields would be significantly affected by the long-term addition of organic matter and nutrients by either vermicompost or crop residues, or their combinations. The study objectives were to 1) observe the long-term effect of vermicompost/crop residues alone or in conjunction with NPK chemical fertilizers on the crop yield and quality of SOM, 2) identify the sensitive SOM quality indicators and develop SOMQI by encompassing these indicators, and 3) predict the system productivity by using SOMQI under RPW and MPO cropping systems.
The experimental field was at Modipuram (latitude: 28°99″ and longitude: 77°71"; 300 m above mean sea level) in the upper Gangetic alluvial plains. The area has a semi-arid and subtropical climate. The average annual rainfall was 863 mm, of which 80% received from the south-west monsoon between July and September. The experimental soil was designated as typic haplustept and had a pH of 7.5 and sandy loam texture, which consist of 25.5% clay, 23% silt, and 51.5% sand. The soil was analyzed using standard methods and had available N (165.8 kg ha-1) (Subbiah and Asija, 1956), P (65 kg ha-1) (Olsen, 1954), and K (210.6 kg ha-1) (Hanway and Heidel, 1952) components, respectively, while its organic C level was 0.5% (Walkley and Black, 1934).
The field experiment on maize–potato–onion (MPO) and rice–potato–wheat (RPW) systems started in the year 2005, under a randomized block design with three replications. Each plot had dimensions of 5 m by 3 m. The treatment included control (no inorganic or organic fertilizer), 100% NPK from fertilizer, 100% N from vermicompost (VC), 50% NPK-fertilizer +50% N-VC, 100% NPK-fertilizer + crop residue (CR), and 100% N-VC + CR. In 100% N-VC and 100% N-VC + CR treatments, the whole amount of N (120 kg N ha-1 each in maize, rice, and wheat, and 180 kg N ha-1 each in onion and potato), and in 50% NPK-fertilizer +50% N-VC, half of the N, were applied through VC (1.0% N, 0.75% P2O5, and 0.75% K2O). The residues of the earlier crop were incorporated into the 100% NPK + crop residue and 100% N-VC + CR treatments. The scheduling of the chemical fertilizer in each crop was carried out as per the recommendations (Yadav et al., 2017).
Soil samples were collected from 0 to 15 and 15 to 30 cm depths at five randomly selected points in each replicated plot by using a core sampler after the harvest of wheat and onion in the RPW and MPO cropping systems, respectively, in the year 2014. The composite samples were prepared by mixing soils collected from different points in each plot. To measure microbiological parameters, a batch of soil samples were kept in a refrigerator (≤4 °C temperature) and the remaining soil was air dried and put through a 2-mm sieve to measure various chemical properties. The analysis included dissolved organic carbon (DOC), dissolved organic nitrogen (DON) (Jones and Willett, 2006), particulate organic matter (POM) (Camberdella and Elliot, 1992), light fraction organic matter (LFOM) (Von Lutzow et al., 2007), microbial biomass carbon (MBC), and microbial biomass nitrogen (MBN) (Jenkinson and Powlson, 1976). The ratio of carbon mineralized between days 56 and 63 and MBC was used to compute the microbial metabolic quotient (MMQ). Available nitrogen (AN) (Subbiah and Asija, 1956), available phosphorus (AP) (Olsen, 1954), and available sulfur (AS) (Williams and Steinbergs, 1959) levels in soil were also determined.
After the harvest of crops in the years 2014 and 2015, the yields of maize (grain), onion (bulb), and potato (tuber) in the MPO cropping system, and wheat (grain), rice (grain), and potato (tuber) in the RPW cropping system were recorded. The system productivity was calculated as a rice equivalent yield (REY). The REY of the RPW and MPO cropping systems was calculated using the economic yields of the component crops by considering the current market prices (in Indian rupees per kg) for onion (15.0), wheat (14.50), rice (20.0), maize (13.10), and potato (15.0).
A principal component analysis (PCA) (SPSS 16.0) of 16 SOM quality parameters (POM-C, POM-N, POM-C: N, LFOM-C, LFOM-N, LFOM-C:N, DOC, DON, DOC:N, MBC, MBN, MBC:N, MMQ, AN, AP, and AS) was performed to create a minimum dataset (MDS). According to Brejda et al. (2000), the principal components (PCs) with high eigenvalues and variables with high factor loadings were chosen (Eigenvector more ≥1). Hence, only PCs with high eigenvalues that could represent at least 5% of the variation in the data were investigated (Wander and Bollero, 1999). The correlations among the variables selected in each PC were performed to avoid redundancy and be eliminated from the SOM quality index (SOMQI) (Andrews et al., 2001). The variable with the highest factor loading (magnitudes) among significantly correlated variables was adopted for the SOMQI (Masto et al., 2008). The non-correlated factors were considered important, and thus, retained in the SOMQI (Andrews et al., 2001). The nonlinear scoring function equation was used to convert the (MDS) of SOM quality parameters selected from the PCA analysis into a unitless score (Wymore, 2018).
Non-linear score (Y) = 1/[1 + e–b(X-A)],
where X is the value of the soil attribute and A is its baseline value, where 0.5 is the score and b is the slope of the curve. Threshold values are soil property values where the score equals one (upper threshold) when the measured soil property is at an optimum level or equals zero (lower threshold) when the soil property is at an unacceptable level. Baseline values are the soil property values between which the midpoints may or may not lie when the scoring function is equal to 0.50. Each indicator’s slope (b) was either calculated from the existing literature or slightly altered to improve curve fitting.
The following equation was used to estimate the SOMQI based on PCA:
where W is the weighing factor obtained from PCA by dividing the variation in a PC by the sum of variations in all PCs, S is the score for the subscripted variable, and SOMQI is the soil organic matter quality index. Here, the assumption is that the higher index scores meant better SOM quality or greater performance of soil nutrient cycling.
Utilizing SPSS version 16.0 for Windows, the one-way analysis of variance (ANOVA) of the experimental data was carried out. The means were separated using Duncan’s multiple range test with a probability of 5%. The same method was used to calculate the correlation and regression between the SOMQI and REY.
In both the RPW and MPO cropping systems, POM-C was the highest in 100% N-VC at 0–15 cm soil depth, while the POM-N was equally higher in both 100% N-VC and 100% N-VC + CR (Table 1). In the case of subsurface soil depth (15–30 cm), POM-C and POM-N in the RPW system were higher in 100% N-VC + CR and 100% NPK + CR, respectively. In both cropping systems, the POM-C:N ratio was consistently wider in organic treatments but becomes narrower as the soil depth increases.
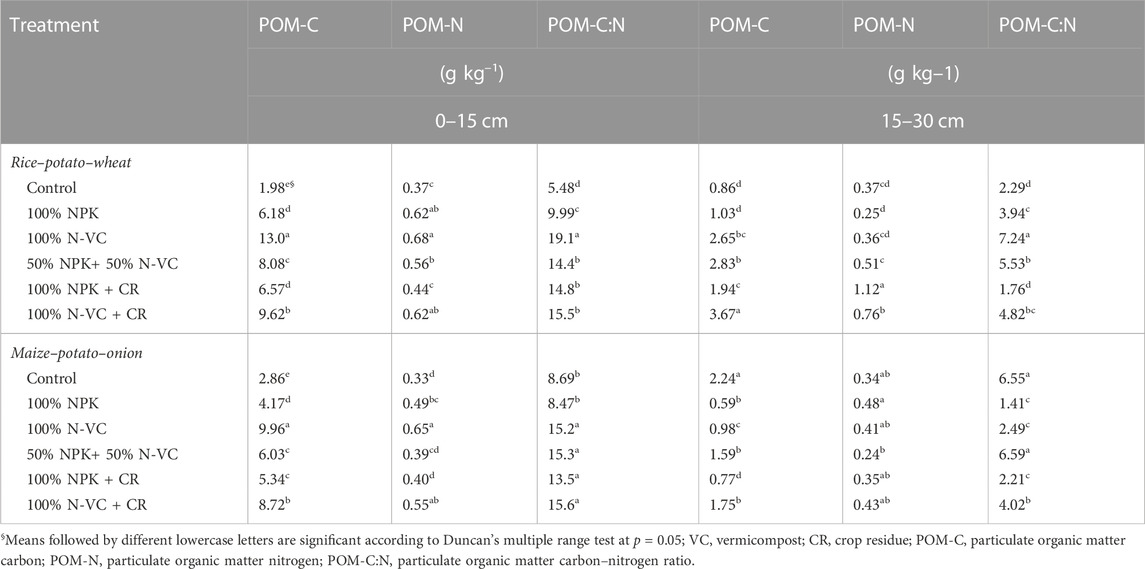
TABLE 1. Long-term effects of manuring and fertilization on particulate organic matter carbon and nitrogen (POM-C and POM-N) (g kg–1), and the C:N ratio of soil under rice–potato–wheat and maize–potato–onion cropping systems.
In both RPW and MPO cropping systems, the 100% N-VC and 50% NPK+ 50% N-VC treatments had high LFOM-C values at a soil depth of 0–15 cm (Table 2). In both cropping systems, the 100% N-VC + CR had a high value of LFOM-N. At 15–30 cm soil depth, 100% N-VC showed the highest LFOM-C in the RPW system, while in the MPO system, all the organic treatments were at par with each other and, however, showed a significantly superior value of LFOM-N over the control treatment. Overall, the organic treatments showed higher LFOM-C: N in both the cropping systems.
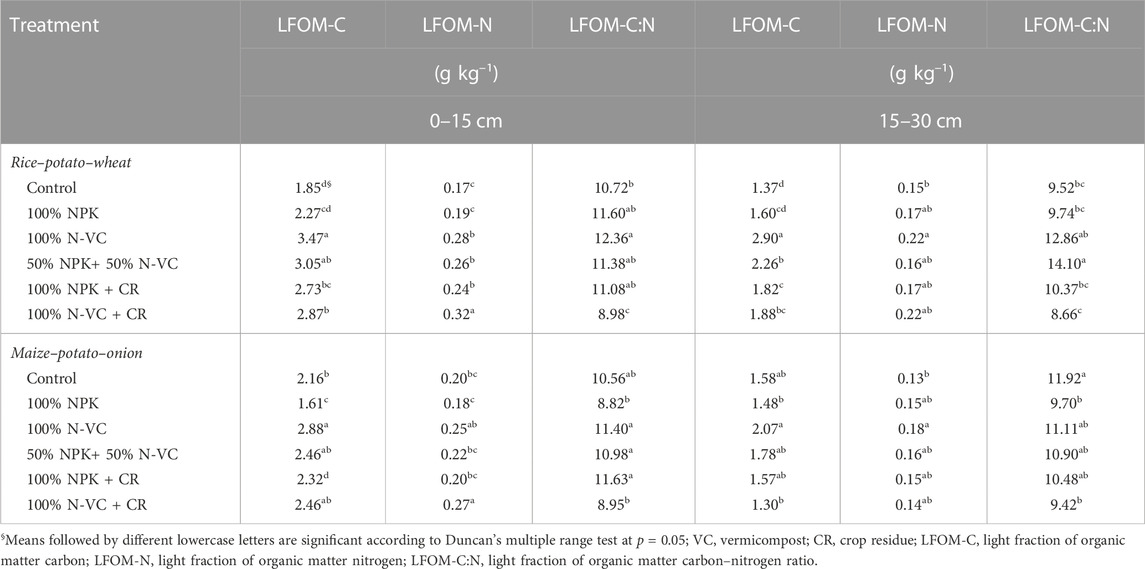
TABLE 2. Long-term impact of manuring and fertilization on the light fraction of organic matter (LFOM) and LFOM-associated carbon (C) (g kg–1) and nitrogen (N) (g kg–1), and the LFOM-C:N ratio of soil under rice–potato–wheat and maize–potato–onion cropping systems.
The LFOM-C resembles the density floatation method, which is used to remove POM-C from the soil. Less of the LFOM-C than the POM was recovered from our soil. Since the LFOM is produced from plants, it may be the main source of C and N. The regular application of organic manure and crop residues in these treatments may be the cause for the enrichment of LFOM-C and LFOM-N in 100% N-VC and 100% N-VC + CR treatments.
Irrespective of the soil depth, 100% N-VC + CR, 100% NPK + CR, and 100% NPK treatments had considerably greater DOC in both cropping systems (Table 3). Although DON, under various treatments, did not vary significantly in the RPW system. However, in the MPO system, it was significantly superior under 100% NPK + CR and 100% N-VC + CR. DOC: N was maximum in 100% NPK + CR at both the soil depths under the RPW system, while in the MPO system, it was higher in all other treatments than that in the control.
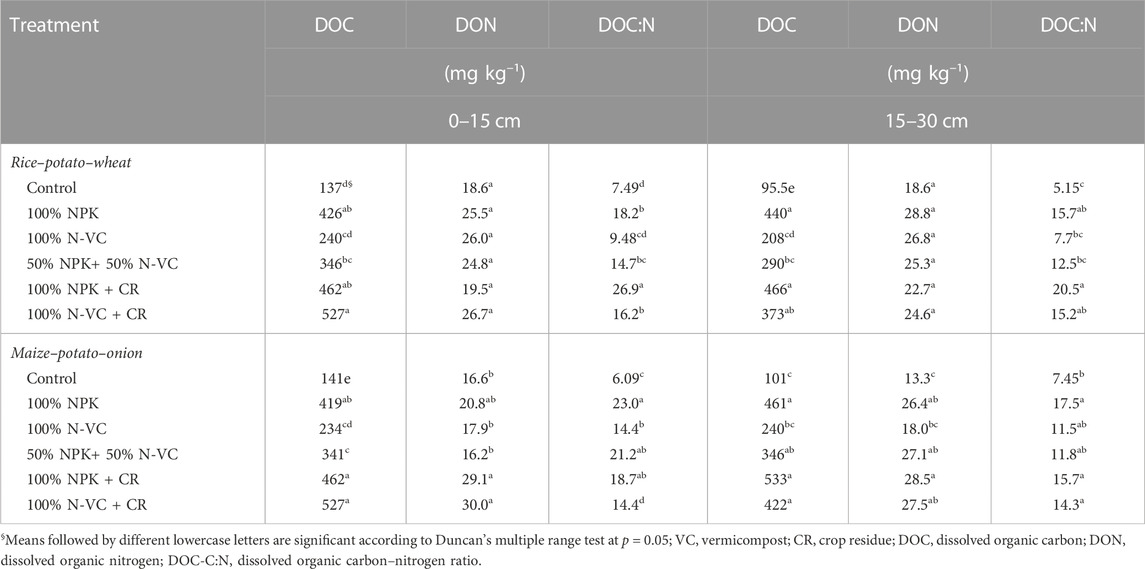
TABLE 3. Long-term impact of manuring and fertilization on dissolved organic carbon (DOC) and nitrogen (DON) fraction (mg kg–1), and the DOC:N ratio of soil under rice–potato–wheat and maize–potato–onion cropping systems.
In the RPW system, 50% NPK+ 50% N-VC and 100% NPK + CR had considerably greater MBC in the 0–15 cm soil depth, while in the MPO system, all of the treatments had higher MBC over the 100% NPK + CR (Table 4). In lower soil depth (15–30 cm), the MBC was statistically higher in 100% N-VC + CR, 50% NPK +50% N-VC, and 100% NPK + CR over other treatments in the MPO system. In the MPO system, MBN in different treatments did not vary significantly. MBC: N was wider in organic treatments in the RPW system, but in the MPO system, it was conspicuously lower in 100% NK + CR and 50% NPK+ 50% N-VC. MMQ was significantly lower under 100% NPK + CR in the RPW system in both soil depths. Contrarily, in the MPO system, the MMQ was lowest in 100% N-VC + CR and 100% N-VC and under both depths (0–15 and 15–30 cm), respectively.
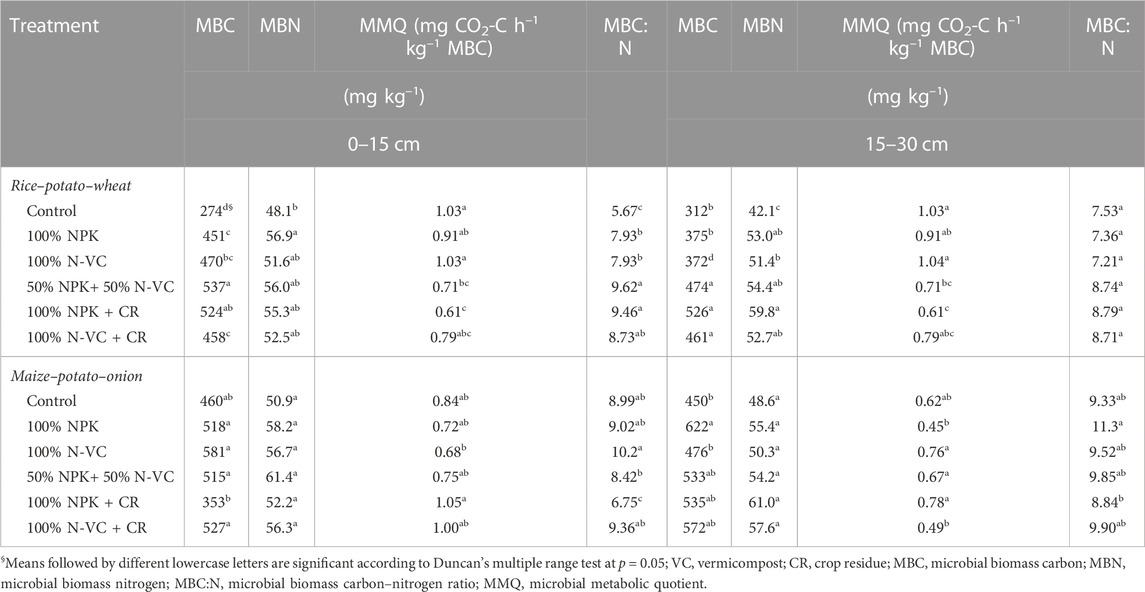
TABLE 4. Long-term impact of manuring and fertilization on soil microbial biomass carbon (MBC) and microbial biomass nitrogen (MBN) fraction (mg kg–1), and the MBC:N ratio under rice–potato–wheat and maize–potato–onion cropping systems.
Available nitrogen (AN), available P (AP), and available S (AS) levels were higher in 100% NPK + CR, followed by either 50% NPK +50% N-VC or 100% NPK in both the cropping systems. The control treatment showed the lowest values for AN, AP, and AS (Table 5). AP and AS were reduced when VC was placed over 100% N-VC but not AN in surface soil with the RPW system only except AS in the upper layer soil depth (0–15 cm) in the MPO system. The AN, AP, and AS levels were generally lower in various combinations of organic treatments than those in inorganic treatments. Surface soil had higher AN, AP, and AS levels than subsurface soil.
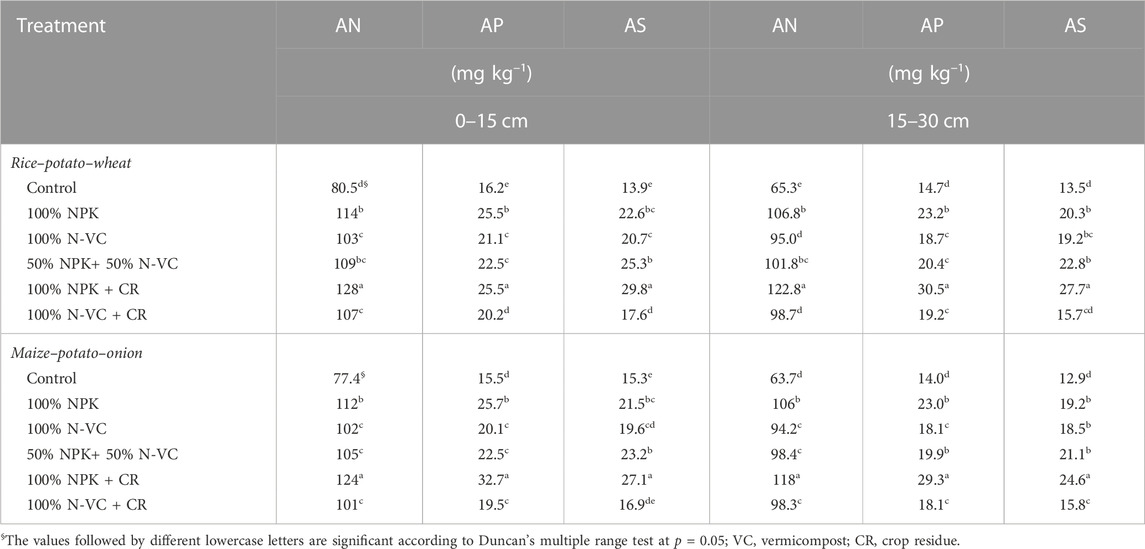
TABLE 5. Long-term impact of manuring and fertilization on available nitrogen (AN), phosphorous (AP), and sulfur (AS) of soil under rice–potato–wheat and maize–potato–onion cropping systems.
When compared to the control, the rice grain yield in the RPW cropping system was significantly greater in all of the treatments (Table 6). The 100% NPK + CR treatment had the highest grain yield (4.96 t ha-1), although it was at par with the 100% N-VC, 50% NPK +50% N-VC, and 100% N-VC + CR treatments (Table 6). The potato tuber yield was found at par in treatment combinations with each other but significantly higher potato tuber yield over the control. The highest wheat grain yield was observed in 100% NPK + CR. The rice equivalent yield (REY) obtained from all the treatments was significantly higher than that of the control.
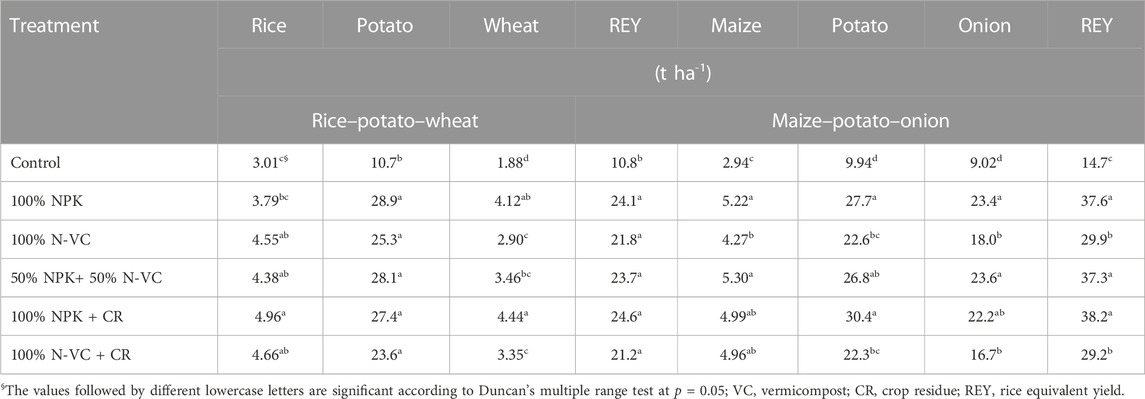
TABLE 6. Long-term impact of manuring and fertilization on the yield of rice–potato–wheat and maize–potato–onion cropping systems.
Four principal components (PCs) (out of 16) were selected by the PCA method based on the eigenvalue > 1. In the RPW and MPO cropping systems, the total variances were 88.4% and 89.3%, respectively. In the RPW cropping system, the PC1 identified AN, MBC, and MBN due to their higher factor loadings (within 5% variation); ultimately, AN with the highest factor loading of 0.953 was selected for indexing due to its significant correlations with MBC (r = 0.83**) and MBN (r = 0.92) (Figure 1A). POM-C (0.797), LFOM-C:N (0.934), and DON (0.839) emerged as sensitive SOM quality indicators from PC2, PC3, and PC4, respectively. In the MPO cropping system, PC1 identified AN, AP, and AS as important indicators, and finally, AN with the highest factor loading (0.916) was retained for indexing purposes due to its significant correlations with AP (r = 0.91**) and AS (r = 0.88**) (Figure 1B). In the same cropping system, POM-C, MBC, and LFOM-C:N emerged from PC2, PC3, and PC4, respectively (Figure 1). With the use of a nonlinear scoring function, the PCA screened MDS of SOM quality indicators, normalizing them to a scale of 0–1 and fixing the lower and upper threshold values, base line, and slope at the baseline curve, as shown in Table 7. The scoring of data pertaining to AN, POM-C, LFOM-C:N, and DON in the RPW system (Figure 2), and AN, POM-C, MBC, and LFOM-C:N in the MPO (Figure 3) cropping system was carried out by a non-linear scoring curve. SOMQI, as developed by encompassing the aforementioned MDS indicators, increased dramatically due to long-term application of manures and fertilizer in both the cropping systems (Figure 4). Under the RPW cropping system, inorganic fertilizer applications alone or in combination with different organic sources were comparable in terms of SOMQI, whereas in the MPO cropping system, organic fertilizer applications (100% N-VC) and integration of organic and inorganic fertilizer (50% NPK+ 50% N-VC) showed significantly higher SOMQI over 100% NPK, 100% NPK + CR, or 100% N-VC + CR in the upper soil depth (0–15 cm). In the lower soil depth (15–30 cm), 100% NPK + CR emerged to be significant, showing the highest SOMQI.
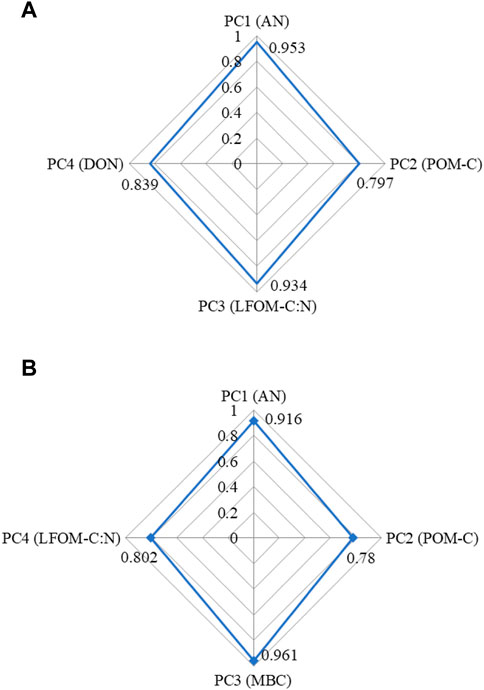
FIGURE 1. Results of principal component analysis of soil organic matter quality indicators under (A) rice–potato–wheat and (B) maize–potato–onion cropping systems. Note: POM-C, particulate organic matter carbon; DON, dissolved organic nitrogen; AN, available nitrogen; LFOM-C: N, light fraction of organic matter carbon and nitrogen ratio; MBC, microbial biomass nitrogen.
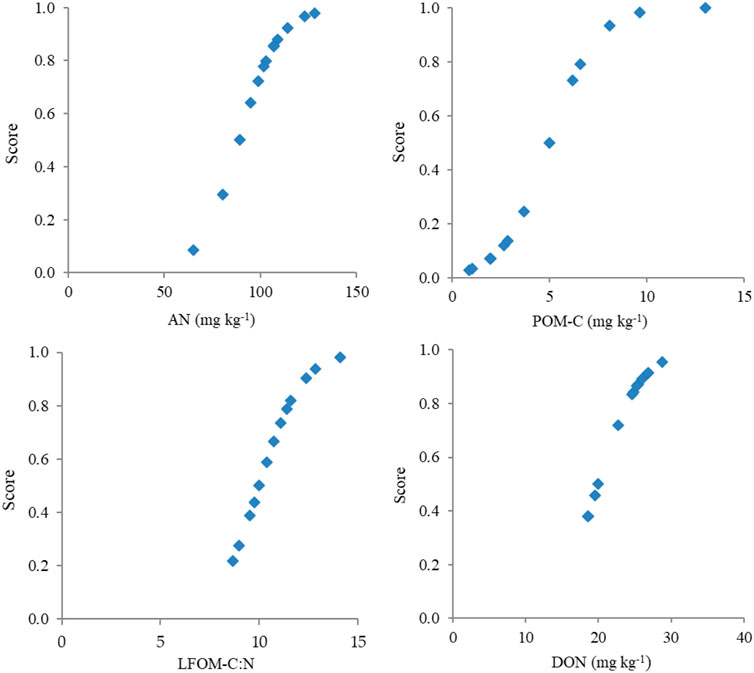
FIGURE 2. Non-linear scoring functions of the minimum dataset under the rice–potato–wheat cropping system. Note: AN, available nitrogen; POM-C, particulate organic matter carbon; LFOM-C: N, light fraction of organic matter carbon; DON, dissolved organic nitrogen.
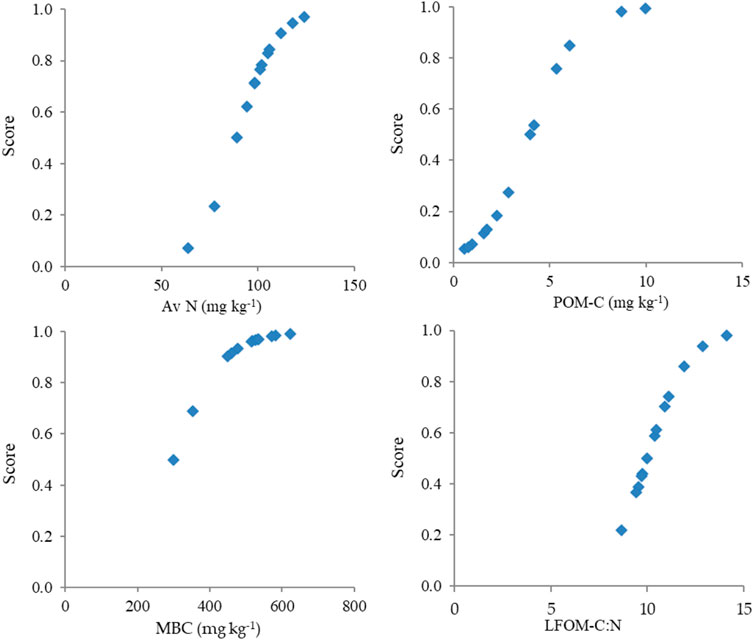
FIGURE 3. Non-linear scoring functions of the minimum dataset under the maize–potato–onion cropping system. Note: AN, available nitrogen; POM-C, particulate organic matter carbon; MBC, microbial biomass nitrogen; LFOM-C: N, light fraction of organic matter carbon.
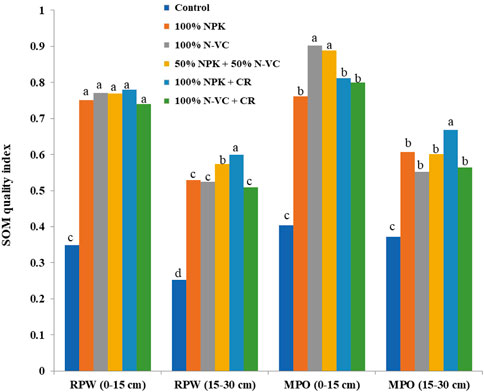
FIGURE 4. Long-term effects of manuring and fertilization on the soil organic matter quality index (SOMQI) in 0–15 cm and 15–30 cm soil depth under rice–potato–wheat (RPW) and maize–potato–onion (MPO) cropping systems.
The regression of REY with the SOMQI showed that the degree of association was greater in the RPW cropping system (R2 = 0.95) than that in the MPO cropping system (R2 = 0.70) (Table 8). The correlation between REY with the SOMQI was highly significant for the RPW system (r = 0.97) compared to that in the MPO cropping systems (r = 0.82). The REY, being the dependent parameter, could be predicted by the SOMQI in both the cropping systems.

TABLE 8. Relationship of system productivity of rice–potato–wheat and maize–potato–onion cropping systems with different soil organic matter quality parameters and the soil organic matter quality index.
Soil organic matter (SOM) quality is judged by the presence of a labile part of the SOM, which might be easily mineralized and take part in nutrient cycling, thus supplying C, energy, and nutrients to the microbes. This implies that low-quality organic C corresponds to organic C molecules that require a high number of enzymatic steps to release CO2. The nutrients, thus, mineralized in this process are also utilized by the crops. Soil organic matter quality was studied by estimating different fractions of C, e.g., POM−C and N, LFOM−C and N, DOC and DON, MBC and MBN, C mineralization (C min), and microbial metabolic quotient (qCO2).
Particulate organic matter C (POMC), which is predominantly composed of plant-derived residues (Gregorich et al., 1995) and is used as a measure of labile SOM, is closely related to the availability of biologically mediated C, N, and in some soils, P levels (Gregorich et al., 1994; Wander and Bollero, 1999). In our study, it was clearly observed that groups receiving 100% N-VC, 50% NPK+ 50% N-VC, and 100% N-VC + CR had much stronger correlations of POMC and POMN for top (0–15 cm) soil for both cropping systems (Table 1; Supplementary Figure S1). Similar outcomes have been noted when maize, wheat, and cowpea (Vigna unguiculata L.) are grown together (Rudrappa et al., 2006). The POM often has a smaller range of C: N ratios than the plant leftovers from which it is formed (Molloy and Speir, 1977). In this study, the average POM C: N ratio ranged from 14:1 to 19:1. In the 100% N-VC treatment, the POM-C: N ratio was higher, indicating a possible source of mineralized C and nutrients. The POM C: N ratio decreased when only inorganic fertilizers were used. This may be because plant-derived C mineralizes more quickly when inorganic fertilizer N is present. However, other studies have found greater POM-C: N ratios when inorganic fertilizers are used primarily or solely in the cultivation of grain crops (Gregorich et al., 1998; Nissen and Wander, 2003).
The density floatation method was used to remove soil from LFOM-C, which is similar to POM-C (Cambardella and Elliott, 1992). The recovery of LFOM-C from our soil was less than the recovery of POM. Since LFOM is a short-term reservoir of plant nutrients and the primary fraction for soil C formation (Neff et al., 2002; Song et al., 2012), it may be a major source of C and N. The persistent application of organic manure and crop residues in these treatments may be responsible for the enrichment of LFOM-C and LFOM-N in the 100% N-VC and 100% N-VC + CR treatments. Our research supported the findings of others who noted a 53% and 56% increase in LFOMC in NPK + FYM (farmyard manure) and FYM plots, respectively, compared to control treatments, and a 30% increase with inorganic fertilizers alone (Janzen et al., 1992). In our soil, the LFOM C:N ratio was lower than the POM C: N ratio, indicating that the LFOM fraction is more stable than the POM fraction. The main source of energy for soil microbes is DOC, which is also used as an indicator of how much C is available to them (Stevenson, 1994). The amount of DOC and DON in soil was dramatically raised by the incorporation of either VC or CR. In the 0–15 cm soil layer, the DOC: N ratio in the RPW and MPO cropping systems, respectively, ranged from 8:1 to 27:1 and 6:1 to 23:1. According to the works of Liu et al. (2014), the wider DOC: N ratios, particularly in organic treatments, indicate their potential as a source of C and N for both microorganisms and plants. In 15–30 cm of soil depth, the DOC: N ratio fell, indicating that the soil was less mineralizable.
The microbial biomass, which is referred to as the living component of the SOM (Sparling et al., 1997), makes up 1%–5% (w/w) of the SOC (Jenkinson and Ladd, 1981). MBC and MBN were higher in the 50% NPK+ 50% N-VC, 100% NPK + CR in RPW, and 100% NPK, 100% N-VC, 100% NPK + CR, and 100% N-VC + CR in MPO cropping systems. This might be because labile C accumulated and supported the development and growth of microbial populations. Das et al. (2017) reported that the integrated plant nutrient supply system increased the MBC more than sole fertilizer treatments. The incorporation of CR slows mineralization processes; hence, microbes take a longer time to decompose the residue and use released nutrients. On the other hand, when CR and the chemical fertilizer were applied together, the C: N ratio decreased, which may have sped up the breakdown and supported increased MBC. According to the works of Hao et al. (2008), adding rice straw to soil increased MBC and SOC contents. The microbial metabolic quotient (qCO2) is a crucial measure for determining how effectively microorganisms mineralize C. For quicker mineralization of C and other nutrients like N, P, and S, higher values of qCO2 are preferred. In the RPW system, the 100% N-VC treatment had higher qCO2, indicating improved soil C and nutrient availability. Long-term N applications or animal manure applications have been linked to high qCO2, while recent N applications have been linked to slower qCO2 (Fauci and Dick, 1994). The greater preservation of C in soil was evidenced by the decreased qCO2 in 100% NPK + CR.
As large amounts of nutrients are present in an organic form and become available throughout the mineralization process, the availability of N, P, and S is directly related to the quality of the SOM. AN, AP, and AS levels were higher in the 100% NPK + CR treatment in both cropping systems. On the other hand, under sole organic treatments like 100% NPK-VC or 100% N-VC + CR, AN, AP, and AS were comparatively lower due to the slow mineralization of organic matter (Yadvinder-Singh et al., 2004). Treatments combining inorganic with organic sources resulted in higher AN, AP, and AS, possibly due to the residual effect of fertilizer nutrients (N, P, and S) applied annually and lowering of C:N, C:S, and C:P ratio for faster mineralization (Biswas and Benbi, 1997; Moharana et al., 2012). Nevertheless, the labile C component in soil was greater in organic treatments that impacted the mineralization of soil C-N (Gunapala and Scow, 1998), S (Banerjee and Chapman, 1996), and P (Jenkinson and Ladd, 1981; Roy et al., 2001).
Identification of sensitive SOM quality indicators was a prerequisite for the development of SOMQI. In this respect, the PCA tool successfully screened AN, POM-C, LFOM-C:N, and DON in the RPW cropping system, and AN, POM-C, MBC, and LFOM-C:N in the MPO cropping system. Among the screened indicators, AN, POM-C, and LFOM-C:N were common to both the cropping systems because of their higher sensitivity. The contribution of AN to the overall SOMQI was found to be highest. In this regard, it was identified as one of the key indicators of soil quality in the RWCS of semi-arid subtropical India, possibly mineralizable N (Manna et al., 2013; Bhaduri and Purakayastha, 2014). Dissolved organic N is considered a very labile fraction. Its fast conversion cycle might contribute to the immediate N demand of the crop. The SOM fractions such as POM-C, MBC, and DOC were reported to be more sensitive indicators than the total SOC (Saviozzi et al., 2001; Haynes, 2005; Dong et al., 2009) and their direct role in enhancing microbial activities in soil (Kalibitz and Kaiser, 2008). LFOM-C:N indicates the ability of mineralizing C and N in soil (Manna et al., 2013), which is dictated by the optimum C:N in this fraction (10-12:1) (Table 2), and therefore, it could be an important sensitive parameter of the SOM quality. The addition of C, N, P, S, and other nutrients from organic sources and inorganic fertilizer resulted in a consistent increase in the SOMQI in comparison to the control under the treatments of varied sources, i.e., vermicompost, CR, and fertilization. Overall, SOMQI was higher in the MPO cropping system than that in the RPW cropping system. This might be due to the accumulation of more labile C in the former system than in the latter, as reported by Brar et al. (2015). The RPW cropping system encounters an anaerobic phase in soil during rice cultivation, which might be the reason for better stabilization of C in this system than that in the MPO system (Yadav et al., 2017) which accumulated more labile C, contributing to higher SOMQI.
This study showed that the REY under completely organic treatments was at par with 100% NPK in the RPW cropping system, while in the MPO cropping system, REY of 50% NPK+ 50% N-VC and 100% NPK + CR was at par with 100% NPK. Unlike the RPW cropping system, 100% N-VC + CR and 100% N-VC showed significantly lower REY than the aforementioned treatments in the MPO cropping system. The anaerobic soil conditions prevailing in rice crops might be responsible for the higher build of SOM in an organically managed system responsible for yield comparable with 100% NPK fertilizer. This suggests that the current rate of application may not be sufficient to achieve the yield potential of 100% NPK in the MPO cropping system when N is fully replaced by VC. However, to achieve the desired yield target, a 50% substitution of N by VC may be a better strategy. In the MPO cropping system, 100% NPK treatment yield was at par with 50% NPK +50% N-VC and 100% NPK + CR. Moreover, other SOM quality parameters were higher in 50% NPK +50% N- VC, which facilitates nutrient availability and helps in achieving yield potential. The SOMQI indices developed by encompassing various organic matter quality parameters, thus, significantly correlated with REY of both the cropping systems, especially the level of prediction was higher in the RPW system. There was commonality between the SOM quality indicators, e.g., AN, POM-C, and LFOM-C:N emerged from the PCA analysis performed for both the cropping systems. This confirms the robustness of the PCA approach while identifying the sensitive SOM quality indicators. The inclusion of PCA-screened indicators into unified SOMQI had advantages over individual SOM quality indicators while assessing the quality of SOM and its function in estimating the production of both potato-based cropping systems. The robustness of the PCA approach for screening soil quality characteristics has been demonstrated in other studies (Masto et al., 2007; Bhaduri and Purakayastha, 2014; Biswas et al., 2017).
The potential management strategy for improving the SOM quality in Inceptisol under the RPW and MPO cropping systems of semi-arid sub-tropical India has been the whole or partial substitution of the chemical fertilizer with VC. However, the complete substitution of the chemical fertilizer with VC or CR residues might limit the productivity of RPW and MPO cropping systems. In terms of better REY and improved SOM quality, the MPO cropping system could be a better substitute for the RPW cropping system. The PCA analysis emerged as a useful tool for screening sensitive SOM quality indicators for the creation of MDS, which had a direct relationship with the management goal of improved crop yield. The PCA-screened MDS comprising AN, POM-C, LFOM-C:N, DON, and MBC could be used to develop a unified SOMQI. Such SOMQI could be used for assessing both the SOM quality and predicting the system productivity (rice equivalent yield) and identification of appropriate soil and crop management strategies. The aforementioned PCA-based approach or protocol can be extended in a similar soil type, climate, and cropping systems in other agro-ecoregions for assessing the SOM quality after appropriate validation.
The original contributions presented in the study are included in the article/Supplementary Material; further inquiries can be directed to the corresponding author.
Conceptualization: RY and TP. Methodology: RY, TP, MK, DK, and DY. Formal analysis: RY, TP, PJ, MK, DK, DY, PJ, and PV. Investigation: RY, TP, MK, DK, DY, and PJ. Resources: RY, TP, MK, PJ, and PV. Data curation: RY, TP, MK, DK, DY, PJ, and PV. Writing—original draft: RY, TP, PJ, MK, DK, and DY. Review and editing: TP, PJ, DK, DY, SuS, ShS, and PV. All authors have read and agreed to the published version of the manuscript. All authors contributed to the article and approved the submitted version.
The authors declare that the research was conducted in the absence of any commercial or financial relationships that could be construed as a potential conflict of interest.
All claims expressed in this article are solely those of the authors and do not necessarily represent those of their affiliated organizations, or those of the publisher, the editors, and the reviewers. Any product that may be evaluated in this article, or claim that may be made by its manufacturer, is not guaranteed or endorsed by the publisher.
The Supplementary Material for this article can be found online at: https://www.frontiersin.org/articles/10.3389/fenvs.2023.1116930/full#supplementary-material
Andrews, S. S., Karlen, D. L., and Cambardella, C. A. (2004). The soil management assessment framework: A quantitative soil quality evaluation method. Soil Sci. Soc. Am. J. 68, 1945–1962. doi:10.2136/sssaj2004.1945
Andrews, S. S., Mitchell, J. P., Mancinelli, R., Karlen, D. L., Hartz, T. K., Horwath, W. R., et al. (2001). On-farm assessment of soil quality in California’s central valley. Agron. J. 94, 12–23. doi:10.2134/agronj2002.0012
Aulakh, M. S., and Grant, C. A. (2008). Integrated nutrient management for sustainable crop production. New York, USA: The Haworth Press, Taylor and Francis Group, 619.
Banerjee, M. R., and Chapman, S. J. (1996). The significance of microbial biomass sulphur in soil. Biol. Fertil. Soils 22, 116–125. doi:10.1007/bf00384442
Bhaduri, D., and Purakayastha, T. J. (2014). Long-term tillage, water and nutrient management in rice–wheat cropping system: Assessment and response of soil quality. Soil till. Res. 144, 83–95. doi:10.1016/j.still.2014.07.007
Biswas, C. R., and Benbi, D. K. (1997). Sustainable yield trends of irrigated maize and wheat in a long-term experiment on a loamy sand in semi-arid India. Nutr. Cycl. Agroecosyst. 46, 225–234. doi:10.1007/bf00420557
Biswas, S., Hazra, G. C., Purakayastha, T. J., Saha, N., Mitran, T., Singha Roy, S., et al. (2017). Establishment of critical limits of indicators and indices of soil quality in rice-rice cropping systems under different soil orders. Geoderma 292, 34–48. doi:10.1016/j.geoderma.2017.01.003
Brar, B. S., Dheri, G. S., Lal, R., Singh, K., and Walia, S. S. (2015). Cropping system impacts on carbon fractions and accretion in Typic Ustochrept soil of Punjab, India. J. Crop Improv. 29, 281–300. doi:10.1080/15427528.2015.1016251
Brejda, J. J., Karlen, D. L., Smith, J. L., and Allan, D. L. (2000). Identification of regional soil quality factors and indicators: II northern mississipi loess hills and pallouse prairie. Soil Sci. Soc. Am. J. 64, 2125–2135. doi:10.2136/sssaj2000.6462125x
Cambardella, C., and Elliott, E. (1992). Particulate soil organic-matter changes across a grassland cultivation sequence. Soil Sci. Soc. Am. J. 56, 777–783. doi:10.2136/sssaj1992.03615995005600030017x
Das, D., Dwivedi, B. S., Singh, V. K., Datta, S. P., Meena, M. C., Chakraborty, D., et al. (2017). Long-term effects of fertilisers and organic sources on soil organic carbon fractions under a rice–wheat system in the Indo-Gangetic Plains of north-west India. Soil Res. 55, 296–308. doi:10.1071/sr16097
Das, R., Purakayastha, T. J., Das, D., Ahmed, N., Kumar, R., Biswas, S., et al. (2019). Long-term fertilization and manuring with different organics alter stability of carbon in colloidal organo-mineral fraction in soils of varying clay mineralogy. Sci. Total Environ. 684, 682–693. doi:10.1016/j.scitotenv.2019.05.327
Dong, W., Hu, C., Chen, S., and Zhang, Y. (2009). Tillage and residue management effects on soil carbon and CO2 emission in a wheat–corn double-cropping system. Nutr. Cycl. Agroecosyst. 83, 27–37. doi:10.1007/s10705-008-9195-x
Fauci, M. F., and Dick, R. (1994). Soil microbial dynamics: Short-and long-term effects of inorganic and organic nitrogen. Soil Sci. Soc. Am. J. 58, 801–806. doi:10.2136/sssaj1994.03615995005800030023x
Ghosh, A., Bhattacharyya, R., Dey, A., Dwivedi, B. S., Meena, M. C., Manna, M. C., et al. (2019). Long-term fertilisation impact on temperature sensitivity of aggregate associated soil organic carbon in a sub-tropical inceptisol. Soil till. Res. 195, 104369. doi:10.1016/j.still.2019.104369
Gregorich, E. G., Greer, K. J., Anderson, D. W., and Liang, B. C. (1998). Carbon distribution and losses: Erosion and deposition effects. Soil till. Res. 47, 291–302. doi:10.1016/s0167-1987(98)00117-2
Gregorich, E. G., Monreal, C. M., Carter, M. R., Angers, D. A., and Ellert, B. (1994). Towards a minimum data set to assess soil organic matter quality in agricultural soils. Can. J. Soil Sci. 74, 367–385. doi:10.4141/cjss94-051
Gregorich, E. G., Monreal, C. M., and Ellert, B. H. (1995). Turnover of soil organic matter and storage of corn residue carbon estimated from natural 13C abundance. Can. J. Soil Sci. 75, 161–167. doi:10.4141/cjss95-023
Gunapala, N., and Scow, K. M. (1998). Dynamics of soil microbial biomass and activity in conventional and organic farming systems. Soil Biol. biochem. 30, 805–816. doi:10.1016/s0038-0717(97)00162-4
Hanway, J. J., and Heidel, H. (1952). Soil analysis methods as used in Iowa state college soil testing laboratory IA, USA: Iowa State College of Agriculture.
Hao, X. H., Liu, S. L., Wu, J. S., Hu, R. G., Tong, C. L., and Su, Y. Y. (2008). Effect of long-term application of inorganic fertilizer and organic amendments on soil organic matter and microbial biomass in three subtropical paddy soils. Nutr. Cycl. Agroecosyst. 81, 17–24. doi:10.1007/s10705-007-9145-z
Haynes, R. J. (2005). Labile organic matter fractions as central components of the quality of agricultural soils: An overview. Adv. Agron. 85, 221–268. doi:10.1016/S0065-2113(04)85005-3
Janzen, H. H., Campbell, C. A., Brandt, S. A., Lafond, G. P., and Townley-Smith, L. (1992). Light-fraction organic matter in soils from long-term crop rotations. Soil Sci. Soc. Am. 56, 1799–1806. doi:10.2136/sssaj1992.03615995005600060025x
Jenkinson, D., and Ladd, J. (1981). Microbial biomass in soil: Measurement and turnover. Soil Biol. biochem. 25, 1755–1762.
Jenkinson, D., and Powlson, D. (1976). The effects of biocidal treatments on metabolism in soil-I. fumigation with chloroform. Soil Biol. biochem. 8, 167–177. doi:10.1016/0038-0717(76)90001-8
Jones, D. L., and Willett, V. B. (2006). Experimental evaluation of methods to quantify dissolved organic nitrogen (DON) and dissolved organic carbon (DOC) in soil. Soil Biol. biochem. 38, 991–999. doi:10.1016/j.soilbio.2005.08.012
Kalbitz, K., and Kaiser, K. (2008). Contribution of dissolved organic matter to carbon storage in forest mineral soils. J. Plant Nutr. Soil. Sci. 171, 52–60. doi:10.1002/jpln.200700043
Kant, P. C., Bhadraray, S., Purakayastha, T. J., Jain, V., Pal, M., and Datta, S. C. (2007). Active carbon-pools in rhizosphere of wheat (Triticum aestivum L) grown under elevated atmospheric carbon dioxide concentration in a Typic Haplustept in sub-tropical India, Environ. Pollut. 147, 273–281. doi:10.1016/j.envpol.2006.07.018
Karlen, D. L., Wollenhaupt, N. C., Erbach, D. C., Berry, E. C., Swan, J. B., Eash, N. S., et al. (1994). Crop residue effects on soil quality following 10-years of no-till corn. Soil till. Res. 31, 149–167. doi:10.1016/0167-1987(94)90077-9
Kumar, N., Chhokar, R. S., Meena, R. P., Kharub, A. S., Gill, S. C., Tripathi, S. C., et al. (2022). Challenges and opportunities in productivity and sustainability of rice cultivation system: A critical review in Indian perspective. Cereal Res. Commun. 50, 573–601. doi:10.1007/s42976-021-00214-5
Ladha, J. K., Dawe, D., Pathak, H., Padre, A. T., Yadav, R. L., Singh, B., et al. (2003). How extensive are yield declines in long-term rice–wheat experiments in Asia? Field Crops Res. 81, 159–180. doi:10.1016/s0378-4290(02)00219-8
Liu, E., Teclemariam, S. G., Yan, C., Yu, J., Gu, R., Liu, S., et al. (2014). Long-term effects of no-tillage management practice on soil organic carbon and its fractions in the northern China. Geoderma 213, 379–384. doi:10.1016/j.geoderma.2013.08.021
Manna, M. C., Bhattacharyya, P., Adhya, T. K., Singh, M., Wanjari, R. H., Ramana, S., et al. (2013). Carbon fractions and productivity under changed climate scenario in soybean–wheat system. Field Crops Res. 145, 10–20. doi:10.1016/j.fcr.2013.02.004
Masto, R. E., Chhonkar, P. K., Purakayastha, T. J., Patra, A. K., and Singh, D. (2008). Soil quality indices for evaluation of long-term land use and soil management practices in semi-arid sub-tropical India. Land Degrad. Dev. 19, 516–529. doi:10.1002/ldr.857
Masto, R. E., Chhonkar, P. K., Singh, D., and Patra, A. K. (2007). Soil quality response to long-term nutrient and crop management on a semi-arid Inceptisol. Agric. Ecosyst. Environ. 118, 130–142. doi:10.1016/j.agee.2006.05.008
Moharana, P. C., Sharma, B. M., Biswas, D. R., Dwivedi, B. S., and Singh, R. V. (2012). Long-term effect of nutrient management on soil fertility and soil organic carbon pools under a 6-year-old pearl millet–wheat cropping system in an Inceptisol of subtropical India. Field Crops Res. 136, 32–41. doi:10.1016/j.fcr.2012.07.002
Molloy, L., and Speir, T. (1977). Studies on a climosequence of soils in tussock grassland 12 Constituents of the soil light fraction, N. Z. J. Soil Sci. 20, 167–177.
Nayak, A. K., Gangwar, B., Shukla, A. K., Mazumdar, S. P., Kumar, A., Raja, R., et al. (2012). Long-term effect of different integrated nutrient management on soil organic carbon and its fractions and sustainability of rice–wheat system in Indo Gangetic Plains of India. Field Crops Res. 127, 129–139. doi:10.1016/j.fcr.2011.11.011
Neff, J. C., Townsend, A. R., Gleixner, G., Lehman, S. J., Turnbull, J., and Bowman, W. D. (2002). Variable effects of nitrogen additions on the stability and turnover of soil carbon. Nature 419, 915–917. doi:10.1038/nature01136
Nissen, T. M., and Wander, M. M. (2003). Management and soil-quality effects on fertilizer-use efficiency and leaching. Soil Sci. Soc. Am. J. 67, 1524–1532. doi:10.2136/sssaj2003.1524
Olsen, S. R. (1954). Estimation of available phosphorus in soils by extraction with sodium bicarbonate Washington DC, USA: US Department of Agriculture.
Parihar, C. M., Jat, S. L., Singh, A. K., Kumar, B., Singh, Y., Pradhan, S., et al. (2016). Conservation agriculture in irrigated intensive maize-based systems of north-western India: Effects on crop yields, water productivity and economic profitability. Field Crops Res. 193, 104–116. doi:10.1016/j.fcr.2016.03.013
Porichha, G. K., Hu, Y., Rao, K. T. V., and Xu, C. C. (2021). Crop residue management in India: Stubble burning vs. other utilizations including bioenergy. Energies14 14, 4281. doi:10.3390/en14144281
Purakayastha, T. J., Huggins, D., and Smith, J. (2008). Carbon sequestration in native prairie, perennial grass, no-till, and cultivated Palouse silt loam. Soil Sci. Soc. Am. J. 72, 534–540. doi:10.2136/sssaj2005.0369
Roy, S. K., Sharma, R. C., and Trehan, S. P. (2001). Integrated nutrient management by using farmyard manure and fertilizers in potato–sunflower–paddy rice rotation in the Punjab. J. Agric. Sci. 137, 271–278. doi:10.1017/s0021859601001472
Rudrappa, L., Purakayastha, T. J., Singh, D., and Bhadraray, S. (2006). Long-term manuring and fertilization effects on soil organic carbon pools in a Typic Haplustept of semi-arid sub-tropical India. Soil till. Res. 88, 180–192. doi:10.1016/j.still.2005.05.008
Saviozzi, A., Levi-Minzi, R., Cardelli, R., and Riffaldi, R. (2001). A comparison of soil quality in adjacent cultivated, forest and native grassland soils. Plant Soil 233, 251–259. doi:10.1023/a:1010526209076
Sharma, A. R., Jat, M. L., Saharawat, Y. S., Singh, V. P., and Singh, R. (2012). Conservation agriculture for improving productivity and resource-use efficiency: Prospects and research needs in Indian context. Indian J. Agron. 57, 131–140.
Song, B., Niu, S., Zhang, Z., Yang, H., Li, L., Wan, S., et al. (2012). Light and heavy fractions of soil organic matter in response to climate warming and increased precipitation in a temperate steppe. PLoS One 7, e33217.
Sparling, G. P., Pankhurst, C., Doube, B. M., and Gupta, V. V. S. R. (1997). “Soil microbial biomass, activity, and nutrient cycling as indicators of soil health,” in Biological indicators of soil health. Editors C. Pankhurst, B. M. Doube, and V. V. S. R. Gupta (Wallingford, UK: CAB International), 97–119.
Stevenson, F. J. (1994). Humus chemistry: Genesis, composition, reactions. New York, USA: John Wiley and Sons.
Subbiah, B., and Asija, G. (1956). A rapid procedure for the estimation of available nitrogen in soils. Curr. Sci. 25, 259–260.
Tisdall, J., and Oades, J. M. (1982). Organic matter and water-stable aggregates in soils. J. Soil Sci. 33, 141–163. doi:10.1111/j.1365-2389.1982.tb01755.x
von Lützow, M., Kögel-Knabner, I., Ekschmitt, K., Flessa, H., Guggenberger, G., Matzner, E., et al. (2007). SOM fractionation methods: Relevance to functional pools and to stabilization mechanisms. Soil Biol. biochem. 39, 2183–2207. doi:10.1016/j.soilbio.2007.03.007
Walkley, A., and Black, I. A. (1934). An examination of the Degtjareff method for determining soil organic matter, and a proposed modification of the chromic acid titration method. Soil sci. 37, 29–38.
Wander, M., and Bollero, G. (1999). Soil quality assessment of tillage impacts in Illinois. Soil Sci. Soc. Am. J. 63, 961–971. doi:10.2136/sssaj1999.634961x
Wiaux, F., Cornelis, J. T., Cao, W., Vanclooster, M., and Van Oost, K. (2014). Combined effect of geomorphic and pedogenic processes on the distribution of soil organic carbon quality along an eroding hillslope on loess soil. Geoderma 216, 36–47. doi:10.1016/j.geoderma.2013.10.013
Williams, C., and Steinbergs, A. (1959). Soil sulphur fractions as chemical indices of available sulphur in some Australian soils. Crop Past. Sci. 10, 340–352. doi:10.1071/ar9590340
Yadav, R. K., Purakayastha, T. J., Khan, M. A., and Kaushik, S. C. (2017). Long-term impact of manuring and fertilization on enrichment, stability, and quality of organic carbon in Inceptisol under two potato-based cropping systems. Sci. Total Environ. 609, 1535–1543. doi:10.1016/j.scitotenv.2017.07.128
Keywords: soil organic matter quality, microbial biomass carbon, microbial biomass nitrogen, microbial metabolic quotient, principal component analysis, cropping system
Citation: Yadav RK, Purakayastha TJ, Kumar D, Jha PK, Mahala DM, Yadav DK, Khan MA, Singh S, Singh S and Vara Prasad PV (2023) Long-term impact of manuring on soil organic matter quality indicators under field cropping systems. Front. Environ. Sci. 11:1116930. doi: 10.3389/fenvs.2023.1116930
Received: 06 December 2022; Accepted: 20 April 2023;
Published: 12 May 2023.
Edited by:
Qian Zhang, Chinese Academy of Forestry, ChinaReviewed by:
Byju Gangadharan, Central Tuber Crops Research Institute (ICAR), IndiaCopyright © 2023 Yadav, Purakayastha, Kumar, Jha, Mahala, Yadav, Khan, Singh, Singh and Vara Prasad. This is an open-access article distributed under the terms of the Creative Commons Attribution License (CC BY). The use, distribution or reproduction in other forums is permitted, provided the original author(s) and the copyright owner(s) are credited and that the original publication in this journal is cited, in accordance with accepted academic practice. No use, distribution or reproduction is permitted which does not comply with these terms.
*Correspondence: Tapan Jyoti Purakayastha, dHB1cmFrYXlzdGhhQGlhcmkucmVzLmlu
†These authors have contributed equally to this work
Disclaimer: All claims expressed in this article are solely those of the authors and do not necessarily represent those of their affiliated organizations, or those of the publisher, the editors and the reviewers. Any product that may be evaluated in this article or claim that may be made by its manufacturer is not guaranteed or endorsed by the publisher.
Research integrity at Frontiers

Learn more about the work of our research integrity team to safeguard the quality of each article we publish.