 Yutong Chen1,2,3
 Gang Huang
 Ya Wang
 Weichen Tao
 Kai Yang
94% of researchers rate our articles as excellent or good
Learn more about the work of our research integrity team to safeguard the quality of each article we publish.
Find out more
ORIGINAL RESEARCH article
Front. Environ. Sci., 08 February 2023
Sec. Atmosphere and Climate
Volume 11 - 2023 | https://doi.org/10.3389/fenvs.2023.1116672
This article is part of the Research TopicClimate-Environment Interactions under Global WarmingView all 25 articles
Weather forecasting has been playing an important role in socio-economics. However, operational numerical weather prediction (NWP) is insufficiently accurate in terms of precipitation forecasting, especially for heavy rainfalls. Previous works on NWP bias correction utilizing deep learning (DL) methods mostly focused on a local region, and the China-wide precipitation forecast correction had not been attempted. Meanwhile, earlier studies imposed no particular focus on strong rainfalls despite their severe catastrophic impacts. In this study, we propose a DL model called weighted U-Net (WU-Net) that incorporates sample weights for various precipitation events to improve the forecasts of intensive precipitation in China. It is found that WU-Net can further improve the forecasting skill of heaviest rainfall comparing with the ordinary U-Net and ECMWF-IFS. Further analysis shows that this improvement increases with growing lead time, and distributes mainly in the eastern parts of China. This study suggests that a DL model considering the imbalance of the meteorological data could further improve the precipitation forecasting generated by numerical weather prediction.
Weather forecast has been playing an important role in socio-economics, covering many areas such as agriculture, transportation, business and energy management. Accurate weather forecast, especially rainfall prediction, is essential to the well-operation of society. Precipitation exerts significant impacts on socio-economics, for example, extreme precipitation events usually induce severe disasters such as floods and mudslides (Easterling et al., 2000; Changnon et al., 2000; Wang and Yuan, 2018; Tao et al., 2020; Wang et al., 2021). However, current operational weather forecast and seasonal prediction of precipitation is not satisfying yet (Wang and Yuan, 2018; Cloke and Pappenberger, 2009; Siddique et al., 2015; Kobold and Sušelj, 2005). There is intrinsic uncertainty in operational weather forecast based mainly on numerical weather prediction (NWP) models, due to the approximation in representing atmospheric dynamics and physics (Buizza et al., 1999; Palmer, 2000; Slingo and Palmer, 2011). Post-processing methods to correct NWP have been found to be effective in improving the forecast skill for decades (e.g., Glahn and Lowry, 1972; Wilks, 2009).
Model output statistics (MOS) method, as a traditional post-processing method, is highly utilized to promote forecast skills by establishing a linear relationship between model outputs and predictands (Glahn and Lowry, 1972; Wilks, 2009; Marzban et al., 2006). The Kalman filter approach is another bias correction method, which is able to update the real-time correction, while MOS is not (Homleid, 1995). Moreover, Robertson et al. (2013) utilized a Bayesian joint probability model approach, which joined the predictands and the model predictors into a joint probability distribution, to generate predicted probability distributions from the NWP of rainfall by Bayesian inference. However, most of these approaches are specific to individual observation stations.
Recently, deep learning (DL) techniques have been successfully applied in atmospheric and environmental research, owing to explosive computing resource and increasing amounts of meteorological datasets (Shen, 2018; Boukabara et al., 2019). DL is a kind of data-driven approaches that can extract features from big data on its own, for example, detecting spatial structures in grided data automatically, which is difficult to do with traditional methods. Furthermore, DL models are comprised of much more parameters than traditional ones, leading to more sophisticated results. Convolutional neural network (CNN) is widely used in meteorological and climatological applications for its capacity in processing images, which is a lot in common with processing grided data (e.g., Ham et al., 2019; Lagerquist et al., 2019; Wen et al., 2019; Weyn et al., 2020). Ham et al. (2019) constructed a statistical forecast model using CNN, which produced skillful ENSO forecast. Lagerquist et al. (2019) employed a CNN to identify Synoptic-Scale Fronts. Weyn et al. (2020) designed CNNs operating on cubed sphere to improve data-driven global weather prediction.
CNN-based architectures, together with other DL approaches, are also utilized in the post-processing of NWP (Rasp and Lerch, 2018; Han et al., 2021; Hu et al., 2021). U-Net is a CNN-based architecture first proposed for biomedical segmentation, and has acquired some achievements in the estimate of weather factors (Ronneberger et al., 2015; Larraondo et al., 2019). In this study, we will further explore its application in forecast correction of precipitation.
This paper demonstrates a deep learning method to correct grided precipitation forecast data from NWP using U-Net models. We selected a domain covering the whole of China, which has not been studied on in existing work, as previous researches usually focused on local regions (Han et al., 2021; Han et al., 2022). NWP data from the European Center for Medium-range Weather Forecast Integrated Forecasting System (ECMWF-IFS) was adopted to be corrected, and the ECMWF Fifth-generation Reanalysis (ERA-5) was used as the ground truth. Notably, DL is essentially a statistical approach so that its performance is highly dependent on sample sizes. As precipitation is subject to skewed distribution with a long tail at the big end, the amount of large precipitation sample would be considerably smaller than that of tiny small precipitation, which could influence the performance of DL on extreme rainfalls (Tan et al., 2021; Yang et al., 2022; Fu et al., 2022). Therefore, we adopted a strategy of assigning heavier weights to larger precipitation grids, and investigated its improvement in forecasting heavy rainfalls.
The remainder of this paper is as follows. Section 2 introduces the employed dataset and methodology. Section 3 presents the experiment results, and finally, Section 4 concludes this work.
In this study, we employed the NWP data from the ECMWF-IFS in the range of 2017–2022, at a resolution of 0.25° × 0.25°. The forecast issued twice a day at 0000 UTC and 1200 UTC, respectively, with a lead time from 6 to 72 h. The ground truth used in supervised learning is the ERA-5 dataset, which is often seen as the actual condition in bias correction. Additionally, elevation data from the ETOPO1 is also involved as correction factor. These data can be downloaded from https://www.ecmwf.int and https://www.ncei.noaa.gov/products/etopo-global-relief-model (Hersbach et al., 2020; Amante and Eakins, 2009). The study domain is located at 15°–54.75°N, 70°–134.75°E, which covers the whole of China.
This study used 16,000 instances from the ECMWF-IFS and the ERA-5, which were split into training (12000 instances) and testing datasets (4000 instances). The models are trained with data in all lead times to increase the sample size. Nevertheless, the sample size is somewhat small due to data incompleteness. The limited data size may affect our evaluation of models, but does not affect our cross-sectional comparison of WU-Net and U-Net performance. The inputs of the correction models include forecasted precipitation, 2 m-temperature, 10 m-wind, 500 hPa-geopotential height, sea-level pressure and relative humidity from the ECMWF-IFS, precipitation at the issue time, land-sea distribution, lake cover, high vegetation cover and low vegetation cover from the ERA-5 and elevation from the ETOPO1. The variables involved have been listed in Table 1. The original precipitation data has been converted to 6 h cumulative precipitation, and divided into five levels as shown in Table 2.
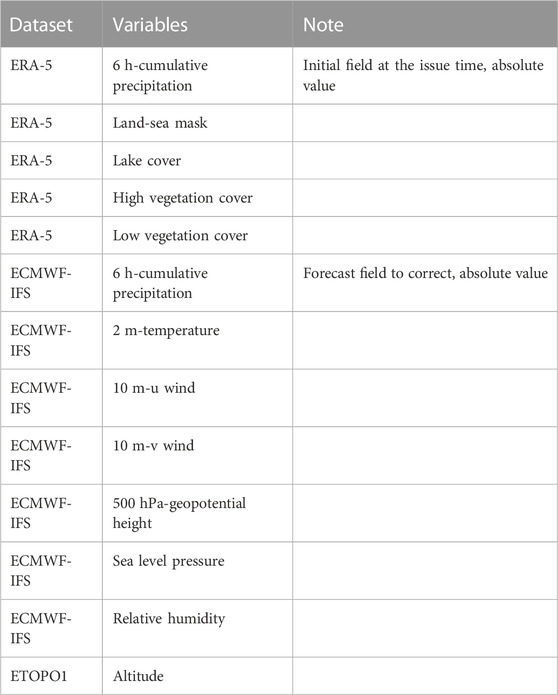
TABLE 1. The input variables of the correction model.
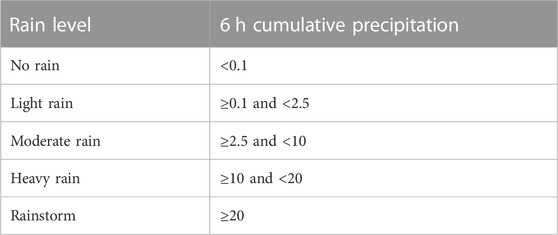
TABLE 2. The gradation of precipitation. Unit: mm.
We applied U-Net (Figure 1) to realize the mapping from the input variables to the output correction field (Ronneberger et al., 2015). U-Net is a deep learning architecture consisting of a down-sampling encoder and a symmetrical up-sampling decoder. The encoder uses convolution and max-pooling layers to extract features at different levels, while the decoder is a reverse process using the same layers besides up-sampling layers to decode the features into correction fields. Recently, U-Net has been utilized in atmospheric science and proved to be effective and promising in weather prediction (Larraondo et al., 2019; Han et al., 2021; Hu et al., 2021).
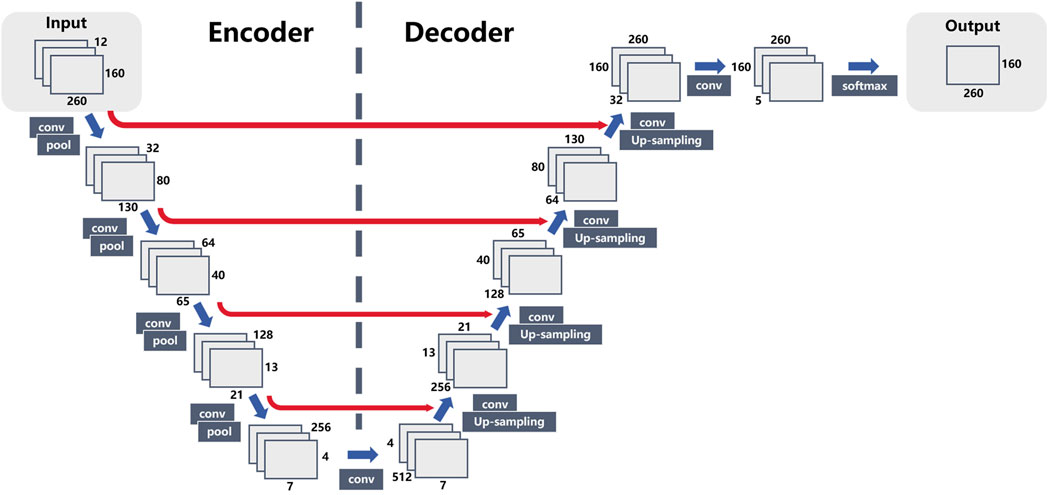
FIGURE 1. The architecture of the U-Net using in this study.
Figure 1 illustrates the structure of the U-Net utilized in this investigation. The blue arrows depict the flow within the encoder and the decoder. The red arrows represent skip connections, which concatenate features from different levels of the encoder to the decoder counterpart, providing detailed information of different resolution. In this paper, the input is consisted of 13 2D-fields concatenated along channel, which are listed in Table 1, and the models would output a single-channel 2D-field of precipitation level. We blended all the lead time from 6 to 72 h together in the dataset, so there would not be the problem of cumulative errors generated from iteration.
We mainly adopted Threat Score (TS) to evaluate the model results, which can be calculated as follows:
and False Alarm Rate (FAR) was also used, for comprehensive knowledge, which is defined as:
where
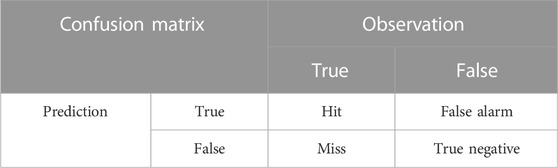
TABLE 3. Confusion matrix to calculate metrics. True or False is determined by the chosen thresholds of 0.1, 2.5, 10, and 20 mm.
Given the fact that precipitation quantity is not normally distributed, with severe rainfall comprising a small proportion of all sample points (Figure 2), ordinary models are unable to effectively distill signals about heavy rainfalls, which are of interest to us. Thus, we assigned a weight to each sample point according to its precipitation level when training the model. The weights were calculated by the formula:
where
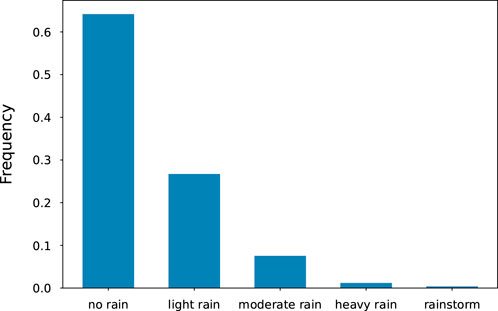
FIGURE 2. The occurrence of each precipitation level in the dataset.
Among which
Figure 3 displays the relative quantile error (RQE) of the ECMWF-IFS relative to the ERA-5, using
where
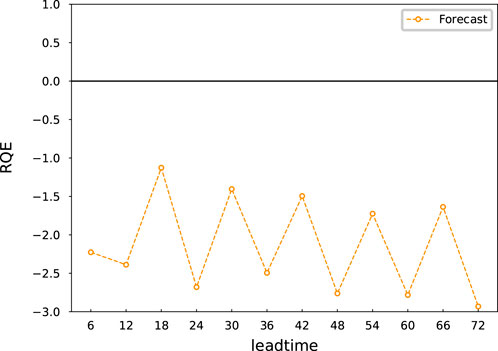
FIGURE 3. Relative quantile error (RQE) of the ECMWF-IFS.
Figure 4A presents the TS of the ECMWF-IFS, U-Net and WU-Net, respectively. The TS rapidly decreases as the threshold increases for the ECMWF-IFS, from 0.65 to 0.18, indicating its limitation in heavy rainfall forecast. Compared to the NWP model, the two deep learning models outperform it at all precipitation levels. The U-Net model improves the forecast for each gradation by greater than 0.1, particularly for that with a threshold of 20 mm, whose TS increases from 0.18 to 0.34. By considering the sample weights, WU-Net further improves the heavy rainfall forecast relative to U-Net, with a TS of 0.53, which is a 194.4% improvement over the ECMWF-IFS and a 55.9% improvement over U-Net. Note that the TS of WU-Net model is marginally inferior to U-Net at forecasting light precipitation. This difference is mostly due to the reduced weight of light precipitation which has large sample sizes. FAR is similar to TS, as shown in Figure 4B. U-Net performs better than the ECMWF-IFS under all the four thresholds. WU-Net, though beaten by U-Net at the first three precipitation level, achieves a maximum improvement under threshold 20 mm, with a 62.5% reduction over ECMWF-IFS and a 41.3% reduction over U-Net. Overall, the results illustrate that adding a higher weight on the large precipitation events which seldom happen can make a great improvement on the forecast skill of them.
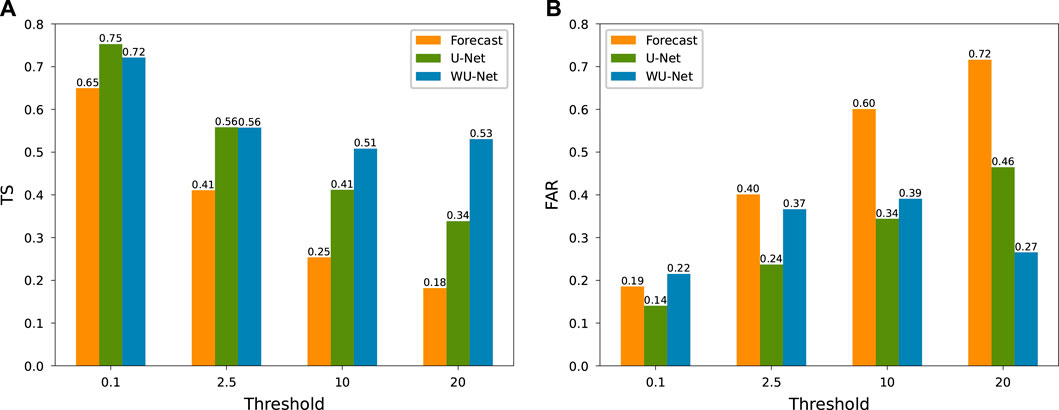
FIGURE 4. (A) TS and (B) FAR of the ECMWF-IFS, U-Net and WU-Net, respectively, under the thresholds of 0.1, 2.5, 10, and 20 mm. The orange, green, and blue represent the ECMWF-IFS, U-Net and WU-Net, respectively.
This improvement can also be seen in different seasons (Figure 5). For TS, WU-Net and U-Net both do better than NWP model at all rainfall levels in all seasons. WU-Net gets even higher scores for stronger rainfall (under thresholds 10 and 20 mm), but a slightly lower score for light rain relative to U-Net. The biggest change happens in spring, with improvements of 25.9%, 54.1%, 87.0%, and 112.5% for U-Net and 19.0%, 51.4%, 130.4%, and 256.3% for WU-Net compared to the ECMWF-IFS under thresholds 0.1, 2.5, 10, and 20 mm, respectively. As to FAR, WU-Net makes the greatest improvement for the highest precipitation level in all seasons, reaching 37.0%, 68.6%, 67.6%, and 64.1% for winter, spring, summer, autumn, respectively.
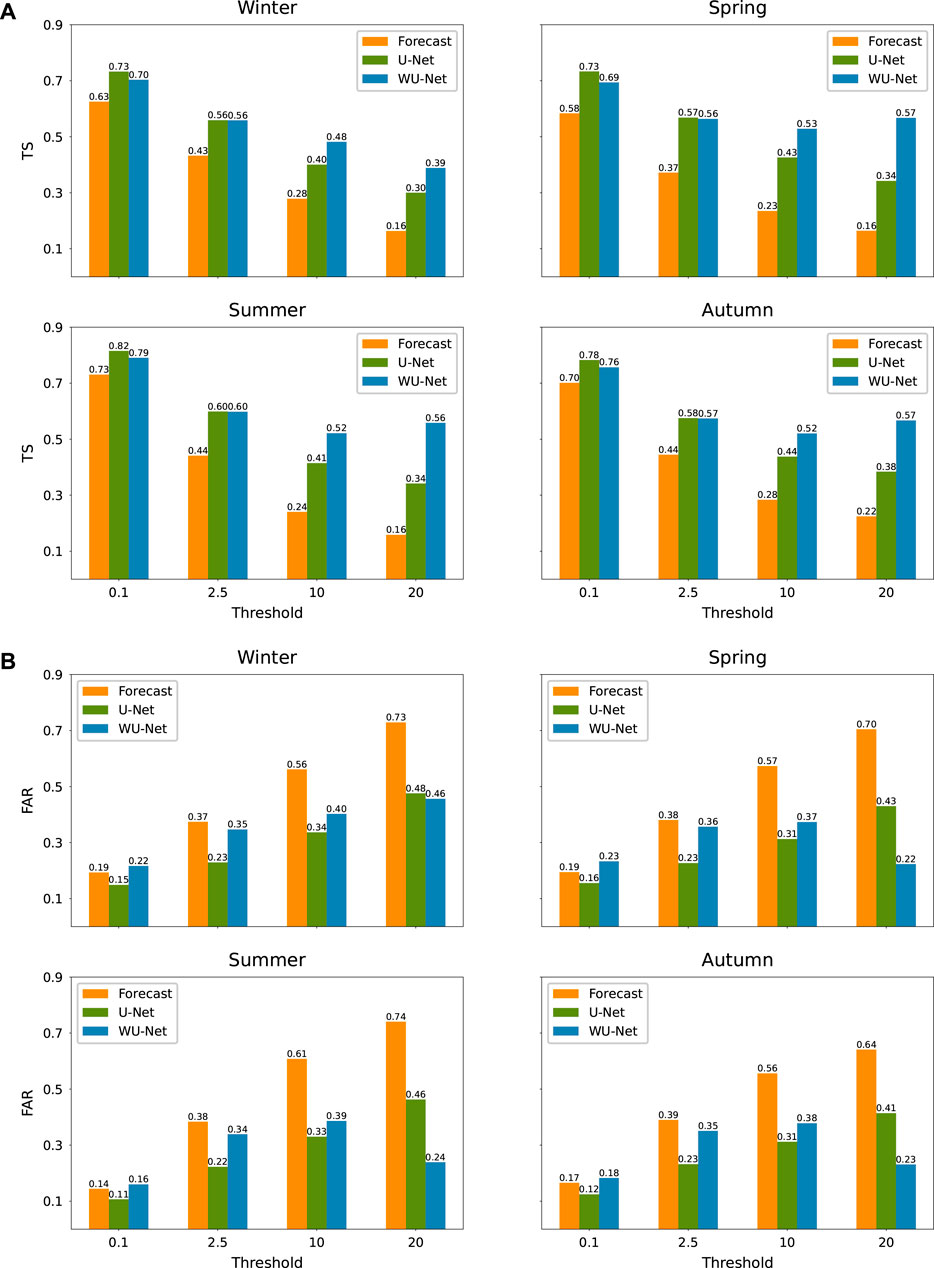
FIGURE 5. (A) TS and (B) FAR as Figure 4, but for different seasons.
In addition to the improvement in different seasons throughout a year, the two deep learning models have significantly enhanced the forecasting skill on daily scale (Figure 6). For the maximum level of rainfall, the highest TS occurs at 0 and 6 o’clock, generated by WU-Net, 0.39 points higher than the ECMWF-IFS and 0.21 points higher than U-Net. The lowest FAR also occurs at 0 o’clock, achieving 0.22.
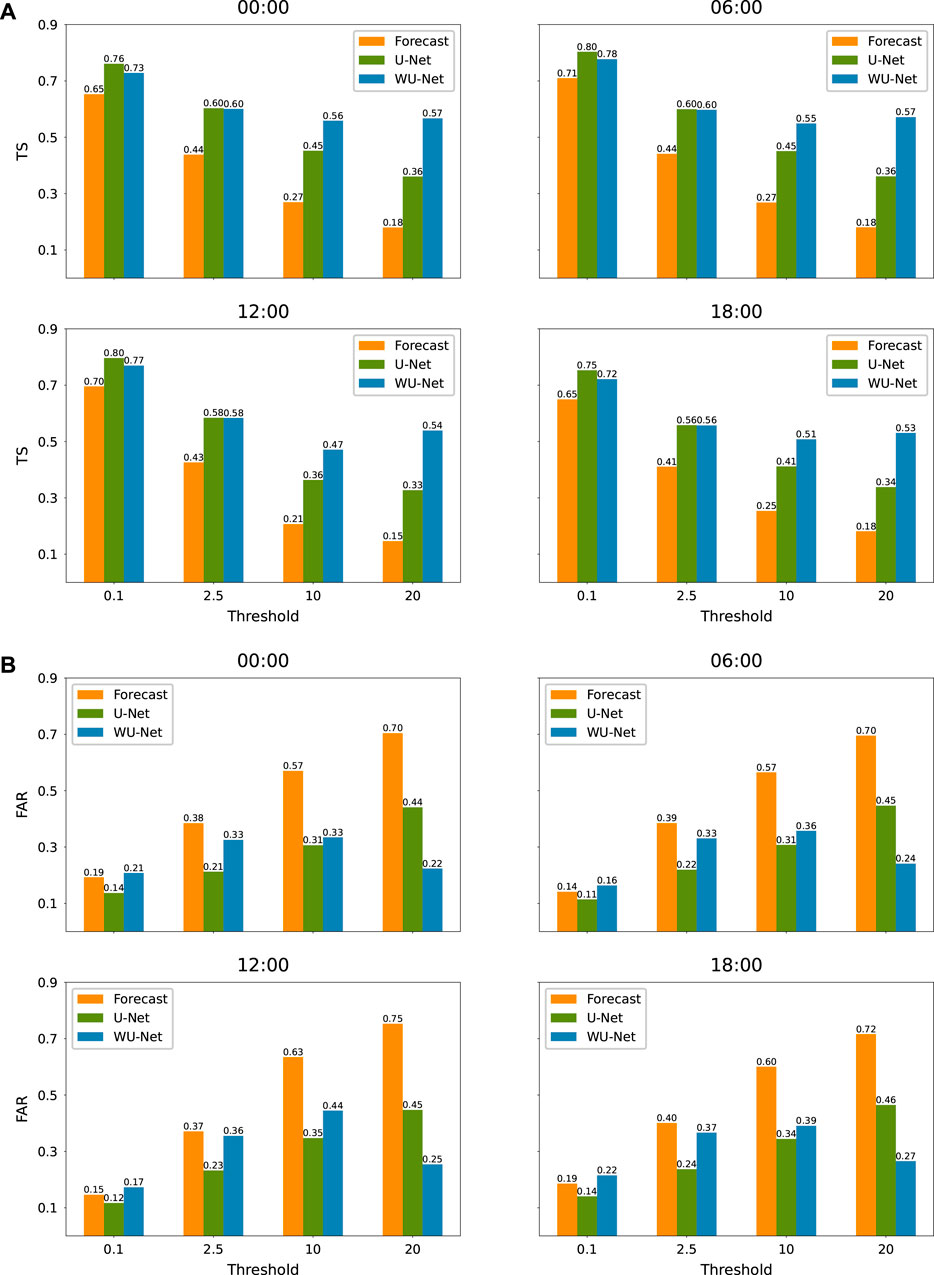
FIGURE 6. (A) TS and (B) FAR as Figure 4, but for different time.
Figure 7A shows the variation of TS over increasing lead time. The forecast skill of the ECMWF-IFS diminishes rapidly as lead time increases, due to the chaotic effect of the atmosphere. In contrast, the other two deep learning models exhibit a less pronounced decreasing trend and higher TS. Comparison of the two suggests that WU-Net outperforms U-Net for all lead time when the threshold is greater than 2.5 mm, but receives a slightly lower score when the threshold is less than 2.5 mm. The comparison is generally consistent with Figure 4, which suggests that WU-Net has a better forecast skill for heavier rainfall, but a slightly lower skill for lighter rainfall. Figure 7B shows the TS improvement of WU-Net and U-Net on the ECMWF-IFS. The enhancement in forecasting skill of the two deep learning models relative to the ECMWF-IFS does not diminish as lead time grows, but rather increases gradually, especially for WU-Net. This increase suggests that WU-Net and U-Net can not only enhance the overall forecast performance, but also the upper forecast limit.
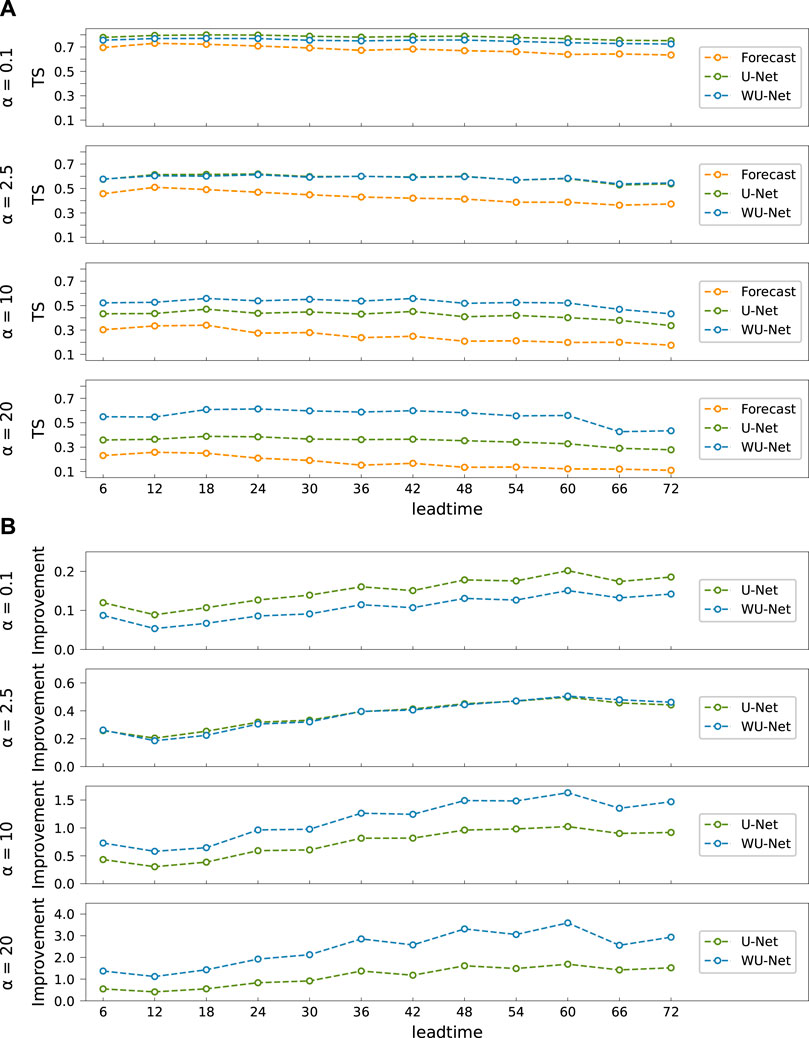
FIGURE 7. (A) The variation of TS for the ECMWF-IFS, U-Net and WU-Net, from top to bottom: thresholds 0.1, 2.5, 10, and 20 mm. (B) The TS improvement of U-Net and WU-Net on the ECMWF-IFS as percentage, from top to bottom: thresholds 0.1, 2.5, 10, and 20 mm. The orange, green and blue represent the ECMWF-IFS, U-Net and WU-Net, respectively.
Figure 8 displays the horizontal distribution of TS. For small precipitation, all three models have better forecasts in East China, North China, and South China, and inferior forecasts for Northwest China, which may be related to the sparse observations there. For stronger precipitation, the forecast skill is higher in eastern China than in western China, which may be related to more observations in the East and more complex and large topography (e.g., Tibetan Plateau) in the West. Compared with the ECMWF-IFS, WU-Net and U-Net have a substantial improvement in overall light rain forecast. For stronger precipitation, the greater improvement of the deep learning models is distributed in the eastern parts of China. As the threshold rises, Northwest China gets great improvement under thresholds 0.1 and 2.5 mm, but misses value for heavier rainfall. It may be because that precipitation above 10 mm per 6 h rarely happens in these areas.
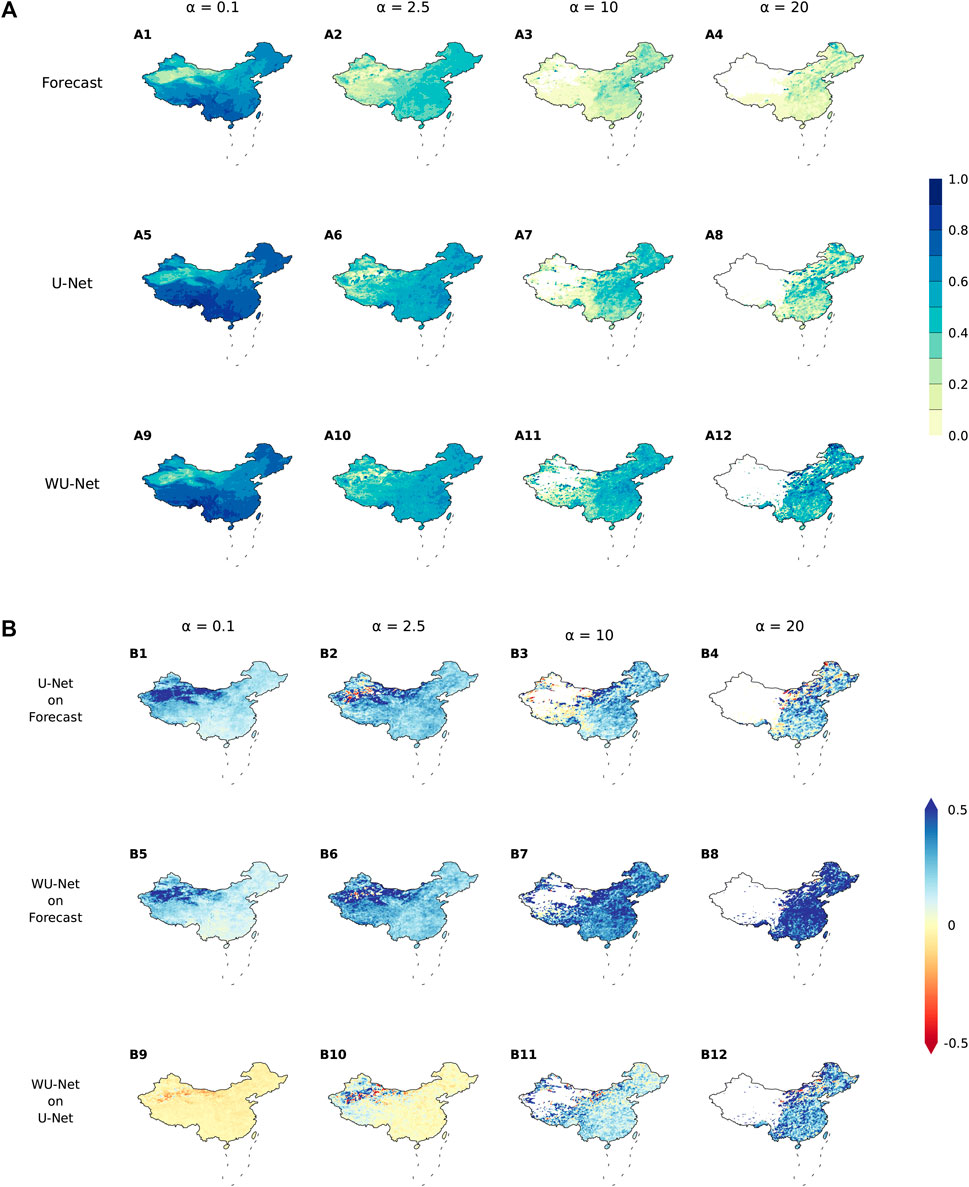
FIGURE 8. (A) TS distribution, from top to bottom: the ECMWF-IFS, U-Net and WU-Net, and from left to right: thresholds 0.1, 2.5, 10, and 20 mm. (B) Spatial improvement of TS as percentage, from top to bottom: U-Net on the ECMWF-IFS, WU-Net on the ECMWF-IFS and WU-Net on U-Net, and from left to right: thresholds 0.1, 2.5, 10, and 20 mm. The blank areas derive from the denominator of zero when calculating the TS, due to all the samples on the grids are True Negative (to see in Table 3). The areas out of China have been masked out.
Figure 9 provides three cases from the validation dataset, and case 1 occurred during the process of the severe rainstorm disaster in Henan province on July 21, 2021. The ERA-5 precipitation field, the ECMWF-IFS output, the U-Net and WU-Net correction are presented sequentially. In these cases, the distribution and intensity accuracy are enhanced after correction. More specifically, for light rainfall, both the U-Net and the WU-Net correction fields are more related to the ERA-5 than the ECMWF-IFS, but WU-Net tends to extend the precipitation areas, which is consistent with the relatively high FAR on light rainfall for WU-Net. For heavy rainfall, WU-Net outperforms other models, as the distribution of “heavy rain” and “rainstorm” is very close to those in ERA-5.
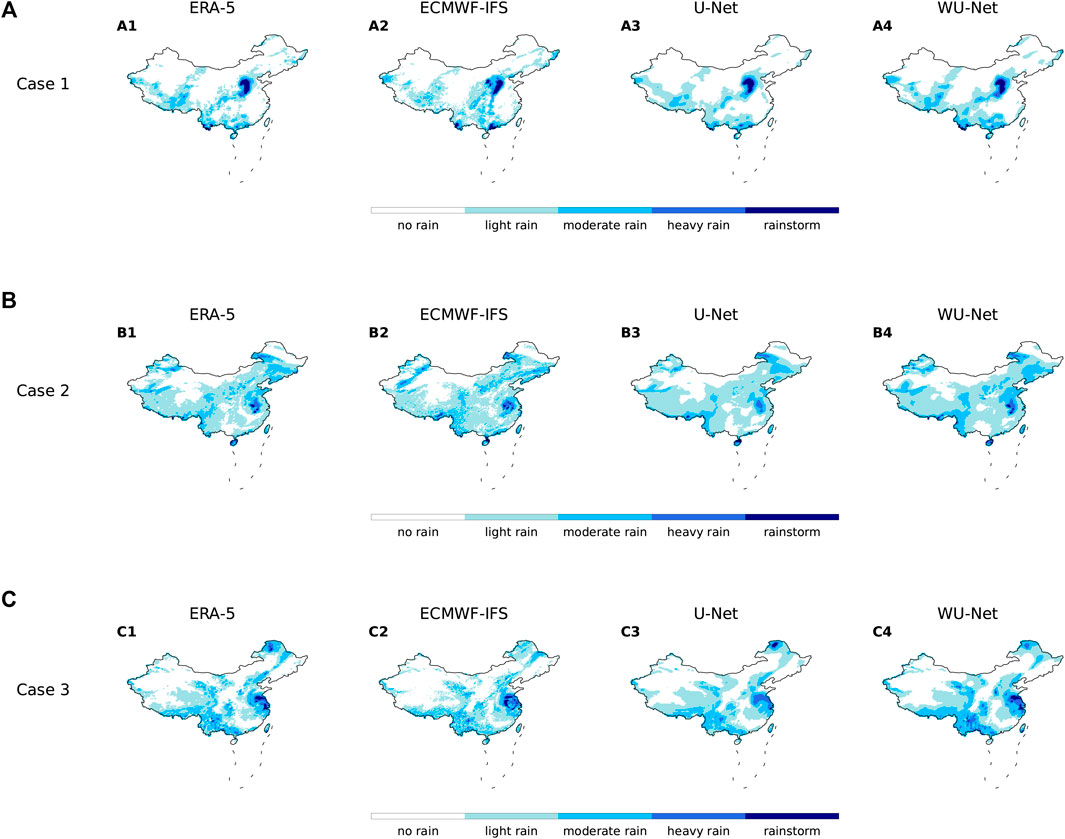
FIGURE 9. Examples of precipitation forecasts by different models. (A) 21/07/2021 0000 UTC, lead time 48 h. (B) 13/08/2018 0600 UTC, lead time 42 h. (C) 27/07/2021 1200 UTC, lead time 36 h.
In this paper, we used U-Net based models to correct the ECMWF-IFS forecast for 6 h cumulative precipitation, and evaluated their performance. Via assigning larger weights to heavier rainfall events, we partly solved the problem of imbalanced data distribution.
The results present that both U-Net and WU-Net can improve the ECMWF-IFS forecast significantly, while WU-Net outperforms U-Net with regarding to intensive precipitation, by considering the sample weights. Specifically, U-Net improves the forecast for each gradation by greater than 0.1 in TS, particularly for heavy rainfall. The WU-Net model does even better on the heaviest precipitation level, as is triple the ECMWF-IF and 55.9% higher than the ordinary U-Net. Moreover, the improvement increases with growing lead time, indicating an extended upper forecast limit.
The quantitative results in the article should be treated with caution due to sample limitations, but this does not prevent the conclusion that WU-Net has the potential to enhance heavy rainfall forecasting skills. The capacity of WU-Net should be further validated in the future using a more complete and larger dataset.
Considering the normalcy, integrity, and accessibility of the data, the study uses the reanalysis dataset as the ground truth which is common in previous studies (e.g., Larraondo et al., 2019; Han et al., 2021; Hu et al., 2021). Given that there are still discrepancies between the reanalyzed precipitation data and observations, we will employ the observed data for additional testing and modeling in the future. Moreover, it is worthwhile to investigate how to integrate two deep learning models (U-Net and WU-Net) to further improve forecasting skill.
Publicly available datasets were analyzed in this study. ECMWF-IFS is on the page: https://www.ecmwf.int/en/forecasts/dataset/thorpex-interactive-grand-global-ensemble. ERA-5 can be found here: https://www.ecmwf.int/en/forecasts/dataset/ecmwf-reanalysis-v5. And EPOTO1 can be downloaded from: https://www.ncei.noaa.gov/products/etopo-global-relief-model.
YC: Conceptualization, methodology, data curation, investigation, formal analysis, visualization, writing—original draft; GH: Funding acquisition, resources, supervision; YW: Conceptualization, methodology, funding acquisition, resources, supervision, writing—review and editing; WT: Supervision; QT: Resources; KY: Supervision; JZ: Supervision; HH: Supervision.
This work was supported by the Second Tibetan Plateau Scientific Expedition and Research (STEP) program (grant no. 2019QZKK0102) and the National Natural Science Foundation of China (42141019, 41831175, 91937302 and 41721004) and the Strategic Priority Research Program of Chinese Academy of Sciences (XDA20060501).
Author QT was employed by the company CMA; Author JZ was employed by the company Shanghai Investigation, Design and Research Institute Co., Ltd.; Author HH was employed by the company Zhejiang Institute of Communications Co., Ltd.
The remaining authors declare that the research was conducted in the absence of any commercial or financial relationships that could be construed as a potential conflict of interest.
All claims expressed in this article are solely those of the authors and do not necessarily represent those of their affiliated organizations, or those of the publisher, the editors and the reviewers. Any product that may be evaluated in this article, or claim that may be made by its manufacturer, is not guaranteed or endorsed by the publisher.
Amante, C., and Eakins, B. (2009). ETOPO1 1 Arc-Minute Global Relief Model: procedures, data sources and analysis. doi:10.7289/V5C8276M
Bi, K., Xie, L., Zhang, H., et al. (2022). Pangu-Weather: A 3D High-Resolution Model for Fast and Accurate Global Weather Forecast.
Boukabara, S.-A, Krasnopolsky, V., Stewart, J. Q, Maddy, E. S., Shahroudi, N., and Hoffman, R. N. (2019). Leveraging Modern Artificial Intelligence for Remote Sensing and NWP: Benefits and Challenges. Bulletin of the American Meteorological Society 100, ES473–ES491. doi:10.1175/BAMS-D-18-0324.1
Buizza, R., Milleer, M., and Palmer, T. N. (1999). Stochastic representation of model uncertainties in the ECMWF ensemble prediction system. QJR Meteorol. Soc. 125, 2887–2908. doi:10.1002/qj.49712556006
Changnon, S. A., Pielke, R. A., Changnon, D., et al. (2000). Human Factors Explain the Increased Losses from Weather and Climate Extremes. Bull. Amer. Meteor. Soc.81, 437–442. CO;2 doi:10.1175/1520-0477(2000)081<0437:HFETIL>2.3
Cloke, H. L., and Pappenberger, F. (2009). Ensemble flood forecasting: A review. Journal of Hydrology 375, 613–626. doi:10.1016/j.jhydrol.2009.06.005
Easterling, D. R., Meehl, G. A., Parmesan, C., Changnon, S. A., Karl, T. R., and Mearns, L. O. (2000). Climate Extremes: Observations, Modeling, and Impacts. Science 289, 2068–2074. doi:10.1126/science.289.5487.2068
Fu, Y., Xiang, L., Zahid, Y., Ding, G., Mei, T., Shen, Q., et al. (2022). Long-tailed visual recognition with deep models: A methodological survey and evaluation. Neurocomputing 509, 290–309. doi:10.1016/j.neucom.2022.08.031
Glahn, H. R., and Lowry, D. A. (1972). The Use of Model Output Statistics (MOS) in Objective Weather Forecasting. Journal of Applied Meteorology and Climatology. 11, 1203–1211. TUOMOS>2.0.CO;2 doi:10.1175/1520-0450(1972)011<1203
Ham, Y.-G., Kim, J.-H., and Luo, J.-J. (2019). Deep learning for multi-year ENSO forecasts. Nature 573, 568–572. doi:10.1038/s41586-019-1559-7
Han, L., Chen, M., Chen, K., Chen, H., Zhang, Y., Lu, B., et al. (2021). A Deep Learning Method for Bias Correction of ECMWF 24–240 h Forecasts. Adv. Atmos. Sci. 38, 1444–1459. doi:10.1007/s00376-021-0215-y
Han, L, Liang, H, Chen, H, Zhang, W., and Ge, Y. (2022). Convective Precipitation Nowcasting Using U-Net Model. IEEE Transactions on Geoscience and Remote Sensing 60, 1–8. doi:10.1109/TGRS.2021.3100847
Hersbach, H., Bell, B., Berrisford, P., Hirahara, S., Horanyi, A., Munoz-Sabater, J., et al. (2020). The ERA5 global reanalysis. Quarterly Journal of the Royal Meteorological Society 146, 1999–2049. doi:10.1002/qj.3803
Homleid, M. (1995). Diurnal Corrections of Short-Term Surface Temperature Forecasts Using the Kalman Filter. Weather and Forecasting. 10, 89–707. DCOSTS>2.0.CO;2 doi:10.1175/1520-0434(1995)010<0689
Hu, Y., Yin, F., and Zhang, W. (2021). Deep learning-based precipitation bias correction approach for Yin–He global spectral model. Meteorol. Appl. 28. doi:10.1002/met.2032
Kobold, M., and Sušelj, K. (2005). Precipitation forecasts and their uncertainty as input into hydrological models. Hydrol. Earth Syst. Sci. 9, 322–332. doi:10.5194/hess-9-322-2005
Lagerquist, R., McGovern, A., and Ii, D. J. G. (2019). Deep Learning for Spatially Explicit Prediction of Synoptic-Scale Fronts. Weather and Forecasting 34, 1137–1160. doi:10.1175/WAF-D-18-0183.1
Larraondo, P. R., Renzullo, L. J., Inza, I., and Lozano, J. A. (2019). A data-driven approach to precipitation parameterizations using convolutional encoder-decoder neural networks.
Marzban, C., Sandgathe, S., and Kalnay, E. (2006). MOS, Perfect Prog, and Reanalysis. Monthly Weather Review 134, 657–663. doi:10.1175/MWR3088.1
Palmer, T. N. (2000). Predicting uncertainty in forecasts of weather and climate. Rep. Prog. Phys. 63, 71–116. doi:10.1088/0034-4885/63/2/201
Pathak, J., Subramanian, S., Harrington, P., et al. (2022). FourCastNet: A Global Data-driven High-resolution Weather Model using Adaptive Fourier Neural Operators.
Rasp, S., and Lerch, S. (2018). Neural Networks for Postprocessing Ensemble Weather Forecasts. Mon. Weather. Rev. 146, 3885–3900. doi:10.1175/MWR-D-18-0187.1
Robertson, D. E., Shrestha, D. L., and Wang, Q. J. (2013). Post-processing rainfall forecasts from numerical weather prediction models for short-term streamflow forecasting. Hydrol. Earth Syst. Sci. 17, 3587–3603. doi:10.5194/hess-17-3587-2013
Ronneberger, O., Fischer, P., and Brox, T. (2015). “U-Net: Convolutional Networks for Biomedical Image Segmentation,” in Medical Image Computing and Computer-Assisted Intervention – MICCAI 2015. Editors N. Navab, J. Hornegger, W. M. Wells, and A. F. Frangi (Cham: Springer International Publishing), 234–241.
Shen, C. (2018). A Transdisciplinary Review of Deep Learning Research and Its Relevance for Water Resources Scientists. Water Resour. Res. 54, 8558–8593. doi:10.1029/2018WR022643
Siddique, R., Mejia, A., Brown, J., Reed, S., and Ahnert, P. (2015). Verification of precipitation forecasts from two numerical weather prediction models in the Middle Atlantic Region of the USA: A precursory analysis to hydrologic forecasting. Journal of Hydrology 529, 1390–1406. doi:10.1016/j.jhydrol.2015.08.042
Slingo, J., and Palmer, T. (2011). Uncertainty in weather and climate prediction. Phil. Trans. R. Soc. A. 369, 4751–4767. doi:10.1098/rsta.2011.0161
Tan, J., Lu, X., Zhang, G., et al. (2021). Equalization Loss v2: A New Gradient Balance Approach for Long-tailed Object Detection.
Tao, W., Huang, G., Dong, D., Wang, P., Yu, T., and Gong, H. (2020). Dominant modes of interannual variability in precipitation over the Hengduan Mountains during rainy seasons. Int. J. Climatol. 41, 2795–2809. doi:10.1002/joc.6990
Wang, Y., Hu, K., Huang, G., and Tao, W. (2021). Asymmetric impacts of El Niño and La Niña on the pacific–north american teleconnection pattern: the role of subtropical jet stream. Environmental Research Letters 16 (11), 114040. doi:10.1088/1748-9326/ac31ed
Wang, S., and Yuan, X. (2018). Extending seasonal predictability of Yangtze River summer floods. Hydrology and Earth System Sciences 22, 4201–4211. doi:10.5194/hess-22-4201-2018
Wen, C., Liu, S., Yao, X., Peng, L., Li, X., Hu, Y., et al. (2019). A novel spatiotemporal convolutional long short-term neural network for air pollution prediction. Science of The Total Environment 654, 1091–1099. doi:10.1016/j.scitotenv.2018.11.086
Weyn, J. A., Durran, D. R., and Caruana, R. (2020). Improving Data-Driven Global Weather Prediction Using Deep Convolutional Neural Networks on a Cubed Sphere. Journal of Advances in Modeling Earth Systems 12, e2020MS002109. doi:10.1029/2020MS002109
Wilks, D. S. (2009). Extending logistic regression to provide full-probability-distribution MOS forecasts. Met. Apps. 16, 361–368. doi:10.1002/met.134
Keywords: bias correction, deep learning, extremely heavy rainfall, imbalanced data, ECMWF, Henan
Citation: Chen Y, Huang G, Wang Y, Tao W, Tian Q, Yang K, Zheng J and He H (2023) Improving the heavy rainfall forecasting using a weighted deep learning model. Front. Environ. Sci. 11:1116672. doi: 10.3389/fenvs.2023.1116672
Received: 05 December 2022; Accepted: 04 January 2023;
Published: 08 February 2023.
Edited by:
Zhiyuan Hu, School of atmospheric sciences, Sun Yat-sen University, ChinaCopyright © 2023 Chen, Huang, Wang, Tao, Tian, Yang, Zheng and He. This is an open-access article distributed under the terms of the Creative Commons Attribution License (CC BY). The use, distribution or reproduction in other forums is permitted, provided the original author(s) and the copyright owner(s) are credited and that the original publication in this journal is cited, in accordance with accepted academic practice. No use, distribution or reproduction is permitted which does not comply with these terms.
*Correspondence: Gang Huang, aGdAbWFpbC5pYXAuYWMuY24=; Ya Wang, d2FuZ3lhQG1haWwuaWFwLmFjLmNu
Disclaimer: All claims expressed in this article are solely those of the authors and do not necessarily represent those of their affiliated organizations, or those of the publisher, the editors and the reviewers. Any product that may be evaluated in this article or claim that may be made by its manufacturer is not guaranteed or endorsed by the publisher.
Research integrity at Frontiers
Learn more about the work of our research integrity team to safeguard the quality of each article we publish.