 Jiandong Yu
 Shouchao Yu2
 Hengjia Zhang
 Zeyi Wang
 Chenli Zhou
95% of researchers rate our articles as excellent or good
Learn more about the work of our research integrity team to safeguard the quality of each article we publish.
Find out more
ORIGINAL RESEARCH article
Front. Environ. Sci. , 23 February 2023
Sec. Freshwater Science
Volume 11 - 2023 | https://doi.org/10.3389/fenvs.2023.1116633
This article is part of the Research Topic Hydrological Connectivity and Sustainable Watershed Management in a Changing Environment View all 13 articles
Given the threats to the regional river ecological flow, including the sharp increase in per capita water demand, the increase in the number of hydraulic engineering, and the strong seasonal runoff of rainfall recharge channels, we clarified the appropriate ecological flow thresholds for the middle reaches of Bailong River of northwest China. Based on the monthly runoff data in the Wudu Hydrological Station of Bailong River from 1990 to 2020, seven suitable hydrological methods were used to couple the estimation of the ecological flow in the middle reaches of Bailong River, which were tested by runoff satisfaction level analysis, using quadratic fit and 95% confidence interval to determine the monthly ecological flow and threshold of the river in the study area. The results by using the single hydrological methods showed that the calculation results from the monthly minimum ecological runoff calculation method, the improved RVA method, the Tennant method, and the DC method were four better estimation methods, which had a satisfaction level of more than 90% in the whole year. The improved RVA method and the Tennant method were more suitable for the diversion power station whose main task aimed at power generation. Although the economic benefits of hydropower stations were better when the improved RVA method was used to calculate ecological flow, the calculation results from the improved RVA method were tested and analyzed by the Tennant method, which were extremely poor from November to April in the following year, and could not meet the minimum ecological water requirements for the biological community in the river channel. While the other five methods all meet this requirement. We suggest that the minimum ecological flow in the middle reaches of the Bailong River maintained at 27.28 m3⁄s, and the maximum retained at 116.33 m3⁄s. The calculation results were in line with the dynamics of runoff in the study area, which could improve the accuracy of water ecological protection. The calculation results of this study could be used for the middle reaches of the Bailong River and may provide a reference for follow-up ecological restoration research and management in similar ecological zones.
With the population growth as well as economic and social development, human intervention in regional soil and water resource and the surrounding ecological environment has been continuously intensified, among which human activities such as damming, sand panning, and shipping have significantly changed the hydrological situation of rivers, leading to increasingly prominent problems such as river drying, aquatic species extinction and ecological environment degradation (Angus Webb et al., 2013; Brown et al., 2015; Ren et al., 2018; Harper et al., 2022). As the main living water source for most urban and village residents, the reasonable and accurate measurement of ecological flow within inland river channels has become an important part of protecting the ecological security of rivers and lakes and promoting regional coordinated sustainable development (Wu and Chen, 2018; Hairan et al., 2021). According to incomplete statistics, about 1/3 of global inland river runoff originates from recent rainfall recharge, and in the global warming environment, extreme weather is occurring frequently. The intensity (duration) of these precipitation extremes is intensifying (decreasing), persistent high temperatures, droughts and erratic rainfall are becoming increasingly synchronised, and a sense of crisis is increasingly evident in the process of balancing the relationship between water allocation, use and ecological and economic development (Bevacqua et al., 2022; Yin et al., 2022; Yin et al., 2023). This general environment will result in frequent intra- and inter-annual instability in rainfall-supplemented river runoff, which greatly affects the accuracy of rivers and lakes even ecological protection decisions in the basin (Wu and Chen, 2018; Kang et al., 2020). Therefore, how to accurately determine the ecological flow of rivers, then scientifically allocate water rights, rationally develop water resources, and protect water ecological security has become a hot global research topic and an urgent problem to be solved (Bhaduri et al., 2016).
The research on river ecological flow began in the early 1940s (Poff and Matthews, 2013), and the concept of basic ecological environment water demand was proposed by Gleick at the end of the last century (Gleick, 1998), after which he deepened and enriched this concept. At the beginning of this century, with the “European Union Water Framework Directive,” The Nature Conservancy of the United States, China’s “Guidelines for Ecological Water Demand Assessment of Rivers and Lakes (Trial) (SL/Z 479-2010)” and other relevant authorities and provisions promulgated as well as the definition and further analysis on the concept of Environmental Water Demand (or Ecological Water Demand) proposed and promoted, domestic and foreign research on the ecological water demand of rivers and lakes began to develop rapidly (Poff and Matthews, 2013). At present, there are more than 200 methods for calculating ecological flow in rivers worldwide (Tharme, 2003), mainly including: i) The hydrological methods (Shaeri Karimi et al., 2012; Abdi and Yasi, 2015; Dai et al., 2019), through which are simple and convenient to calculate the ecological flow, such as the Tennent method, Average Flow method of the Driest Month in the Last 10 Years (Ministry of Water Resources of the People’s Republic of China, 2015), and Typical Hydrological Frequency Year method (Yao et al., 2021), etc.; ii) The hydrodynamic methods, which takes hydraulic elements (or hydraulic parameters) as influencing factors (also called hydraulic index methods) (Abdi and Yasi, 2015; Książek et al., 2019), such as Wet Cycle method (Gippel and Stewardson, 1998), R2CROSS method (Mosley, 1982), etc.; iii) The habitat simulation methods (also known as habitat quorum methods, or habitat simulation methods) that relate biological communities in the region with hydrological information, such as IFIM method (Instream Flow Incremental Methodology) (PHABSIM for Windows User’s Manual and Exercises, 2022), etc.; iv) The holistic or integrated analysis methods that combines multiple natural information in the area, such as BBM method (Building Block Methodology) (Hughes, 2001), Overall Research method (Liu et al., 2016), etc.
Different estimation methods of river ecological flow have corresponding proposed backgrounds and application scopes. Among them, the hydrological methods are based on multi-year hydrological elements of the river. It is simple to calculate and has strong operability, and is widely used by scholars and institutions in many developing countries (Shaeri Karimi et al., 2012; Abdi and Yasi, 2015). However, different hydrological methods have a different focus when calculating ecological flow in different rivers. For rainfall recharge rivers, due to the influence of extreme weather such as heavy rainfall and continuous drought, the inter-annual fluctuation of runoff is big, resulting in great differences in the final calculation results (Zhang et al., 2022). Therefore, the objectives of the present study were to determine: 1) To compare the differences in the calculation results of seven hydrological methods for calculating ecological flow applied in the study area; 2) To establish a set of hydrological methods by coupling a variety of methods that were consistent with the calculation of rainfall supplementary runoff ecological flow. 3) Using the combining polynomial fitting method and 95% confidence interval to explore the threshold range of ecological flow value. It is worth mentioning that the seven hydrological methods applied in this study are very applicable to calculating the ecological flow of rainfall supplemental runoff. Unfortunately, the selection of the most appropriate calculation methods requires a comprehensive analysis of the study area and is also beyond the scope of this study. Thereby, this methodological study is to provide a reference for accurate and scientific analysis and calculation of ecological flow in rainfall supplemental runoff-type channels.
The middle reaches of Bailong River basin were selected as the study area, which is located between the 103°30′E and 105°40′E and between the 32°20′N and 34°10′N (Zhou, 2014). The Bailong River is the largest tributary of the Jialing River, a first-class tributary of the Yangtze River. It originates from Langmu Temple, Luqu County, Gansu Province, China. The total length of the river is 576 km, the drop between the river source and estuary is 3,607 m, and the average ratio drop of the river is 0.54%. The river runoff is mainly recharged by rainfall, and the average annual runoff is 389 m3⁄s. There are abundant hydraulic resources available for development, and many hydropower stations have been put into operation, such as the Qilin Temple Hydropower Station and the Bikou Hydropower Station, etc. The general situation of the water system and the distribution of hydrological stations in Bailong River Basin were shown in Figure 1.
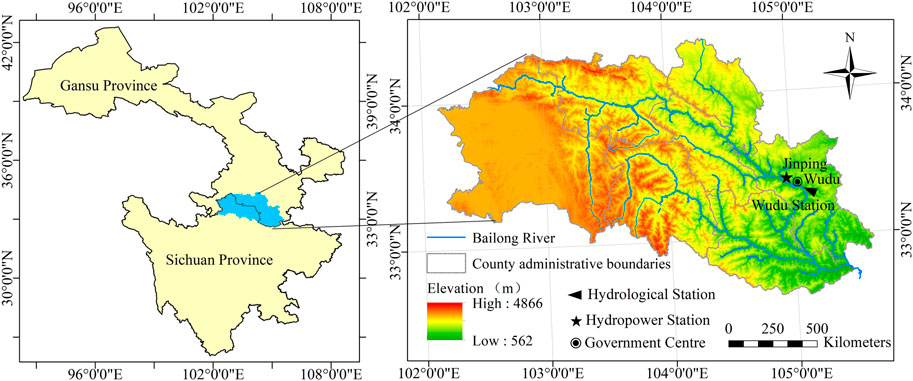
FIGURE 1. Overview of the water system and hydrological station distribution in Bailong River Basin, China.
In this study, the Wudu Hydrological Station in Bailong River was selected as the study hydrological station, which is located in the urban area of Longnan City with a large population and a high level of hydropower development, a more important hydrological control station in the Bailong River basin. The basic data sources mainly originated from “Gansu Provincial Water Resources Bulletin” (Gansu Provincial Water Resources Department, 2020) and the actual measurement data by the Wudu Hydrological Station. Additionally, a total of 31 years of runoff data from 1990 to 2020 and those of multi-year average monthly runoff from 1956 to 2020 were also obtained.
This study refers to the relevant research in the same type of area and selects the following seven methods based on the local hydrological conditions as the assessment methods to determine the ecological flow in the middle reaches of the Bailong River.
The NGPRP method (Northern Great Plains Resource Program method) calculates the ecological flow in the river channel as follows: i) Dividing the known historical runoff data in the study area into three groups: wet years, normal years, and dry years; ii) Regarding the runoff in the normal year corresponding to the 90% guarantee rate as the ecological flow (Dai et al., 2019).
Use the percentage of anomalies to determine the wet, normal and dry years of a long series of historical runoff data. The calculation equation was as following:
where:
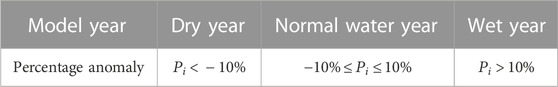
TABLE 1. Classification basis of the year types.
The percentage of anomalies and average annual flows for each of the year in the normal flow year group (a total of 9 years) were shown in Table 2, and the year corresponding to the 90% cumulative frequency was 1998. The final ecological flow values were obtained for each month of the year.
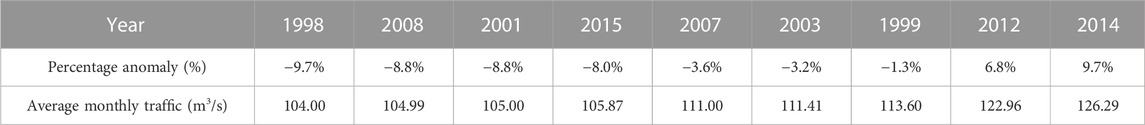
TABLE 2. Percentage of anomalies and average annual flow in each year’s group.
The dynamic calculation method introduces the contemporaneous mean ratio as an index to calculate the ecological water demand of the river, which is more suitable for the natural runoff characteristics of the river (Pan et al., 2013). In the original method, the improved dynamic calculation method introduces the mean ratio of annual runoff to the multi-year average method runoff under the 90% guarantee rate corresponding to the P-III curve. This method reduces the influence of decreasing or increasing ratio in the same season in the calculation process due to the increase or decrease of the runoff data time series, thus reducing the error of the ecological flow value (Zhao et al., 2018). The calculating steps of the improved dynamic calculation method are as follows.
① According to the known long series of historical runoff data, the average monthly flow for a long time was calculated, and the calculation equation was as following:
② The P-III curve adaptation method was used to determine the annual runoff value of the river under a 90% guarantee rate, and the alignment results were shown in Figure 2. The results of the multi-year monthly mean flow (
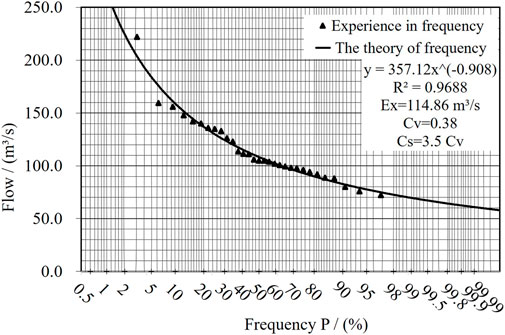
FIGURE 2. Historical flow-frequency curve of Wudu Hydrological Station.

TABLE 3. P-III curve wiring results.
③ The mean value ratio in the same season was obtained using the annual runoff value ratio
④ The ecological flow in the river in this study area was calculated for each month, and the equation was as following:
where:
The ecological flow of the river at Wudu Hydrological Station was calculated according to Eq. 4; Table 3, and the calculation results in ③.
The RVA method (Range of Variability Approach method), also known as the range of variation method or the range of variability method, was proposed by Richter et al. (1997), which considers the changes in hydrological elements such as flow, duration, and frequency before and after human impact (construction of hydraulic engineering, etc.) on the river and its environment as well as stipulates that 25% and 75% of the incoming water frequencies are the upper and lower limits of the estimated river ecological flow, that is, the RVA threshold. Many scholars have continuously improved and revised the RVA method. Zhang et al. (2017) proposed the improved RVA method to divide the annual rainfall into four seasons including the non-flood season, pre-flood season, main flood season, and post-flood season, and calculated the ecological flow, respectively. To a certain extent, the improvement reduced the influence of the small ecological flow value calculated in the dry season due to the small range of the RVA threshold values in the same season. The minimum ecological flowvalue of the river for the non-flood, pre-flood, and post-flood seasons in the study area were calculated according to Eq. 5, while that for the main flood season was calculated by Eq. 6. The results of the calculations were shown in Table 4.
where:
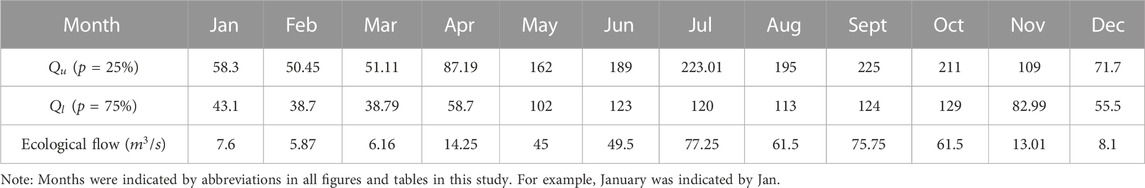
TABLE 4. Ecological Flow values calculated by the improved RVA method for each month at Wudu station.
This method reduces the errors in ecological flow calculation due to uneven distribution of precipitation in each month of the year with seasonal characteristics, and the calculated value fits the characteristics of intra-annual variation of river runoff, which is more consistent with the calculation of the river ecological flow based on rainfall recharge (Wu et al., 2020).
The calculating steps are as follows: 1) From the known historical long series runoff data, pool the runoff volume of January each year and take the minimum value as the ecological flow of January; 2) Obtaining a total of 12 ecological flow values in February, March, ....., and December following above method.
The DC method (Duration Curve method) (Tharme, 2003) is an improved method of the Flow Duration Curve (FDC) method (Men et al., 2012). Various indexes can be obtained in the calculation of river ecological flow by the DC method: multi-year average minimum ecological flow, typical annual minimum ecological flow, minimum ecological flow in four seasons, and monthly ecological flow. Therefore, the flow rate
Firstly, sorting the long series of historical runoff data of no less than 20 years from the maximum to minimum recorded as
where:
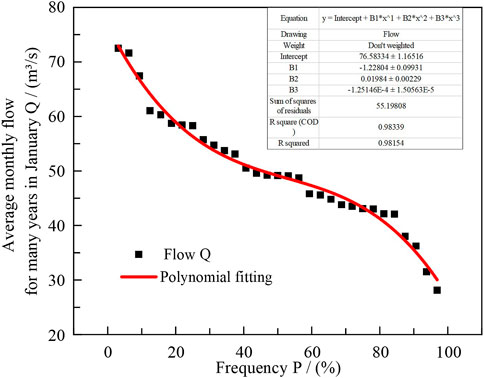
FIGURE 3. Cumulative frequency corresponding to multi-year average runoff in January.
By accurately fitting the cumulative frequency curve corresponding to the multi-year average runoff in January (Figure 3), the runoff corresponding to a cumulative frequency of 95% was selected to calculate the ecological flow value using the DC method.
The monthly frequency calculation method divides the month of the year into three seasons (wet water season, 50% guaranteed rate; normal water season, 70% guaranteed rate; and dry water season, 90% guaranteed rate). The runoff obtained under the guaranteed rate for these three seasons are always used as the ecological flowvalue of the river (Dong et al., 2012). To avoid the lack of ecological flowvalues when seasonal river breaks occurred, we did not divide the season of the year in the improved monthly frequency method and took 50% as the guaranteed rate for each month within the year to calculate the corresponding ecological flow values (Chen, 2005).
The Tennant method, also known as the Montana method, uses the percentage of the average annual runoff in a river as a benchmark for evaluating the biological ecological water demand (Karakoyun et al., 2018) and is one of the most widely used methods for calculating river ecological flow through hydrology (Tennant, 1976). Around 1974, Donald Leroy Tennant (1976) conducted the “Montana method” test and the correlation analysis by the “Montana method” under different flow regimes in hundreds of rivers of 24 states in the United States (Hamidifar et al., 2022), and the results showed that: i) The minimum instantaneous flow to maintain the survival conditions of aquatic organisms in the habitat for a short season was 10% of the annual average flow; ii) The base flow in maintaining good living conditions for most aquatic organisms in the habitat was 30% of the annual average flow; iii) The flow used to provide excellent biological habitat for most aquatic organisms in the habitat during the main growing season and the rest of the resting phase was 60% of the average annual flow.
The Tennant method calculation steps are as follows: firstly, dividing the months of the year into the dry season (general water use season: October–March of the next year) and the wet season (fish spawning and rearing season: April–September), and then the ecological flow of this river stretch was calculated according to the Tennant method assessment criteria. The evaluation criteria of the Tennant method were shown in Table 5.
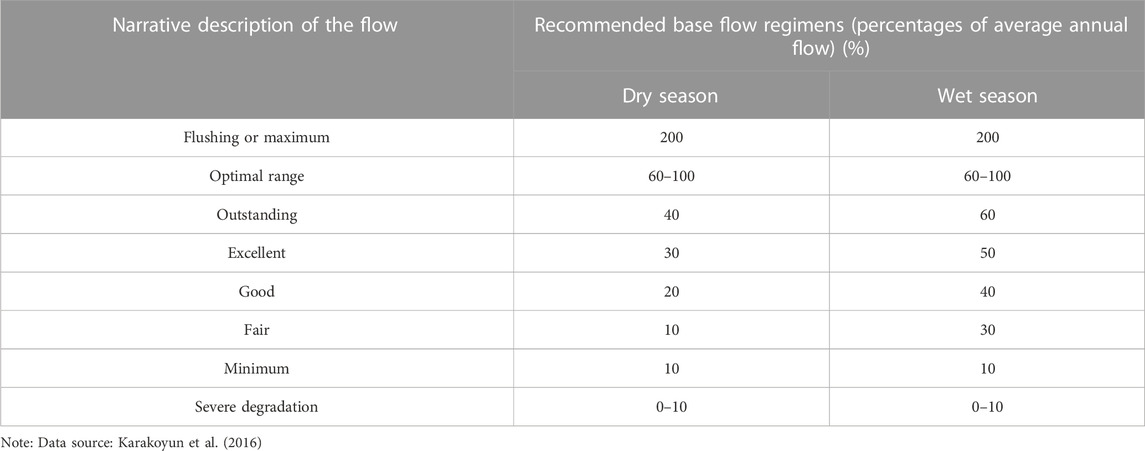
TABLE 5. Calculating ecological flow assessment criteria in the Tennant method.
Since the Tennant method has more typical data characteristics when calculating ecological flow values in rivers, it was used in this study as a comparative method to test and analyze the results of ecological flow calculation by various hydrological methods (Guo et al., 2009). According to the characteristics of runoff and rainfall distribution in the study area, the months of the year are divided into the dry season (general water use season: November–April of the following year) and the wet season (fish spawning and fattening season: May to October), and the 10% of the average annual flow during the dry season and 30% of the average annual flow during the wet season were selected as the ecological flow of the river.
Taking the middle reaches of Bailong River basin as the study area, the river ecological flow was calculated, and the historical hydrological data of the Wudu Hydrological Station were analyzed and calculated according to the previous seven methods. The results were shown in Figure 4A.
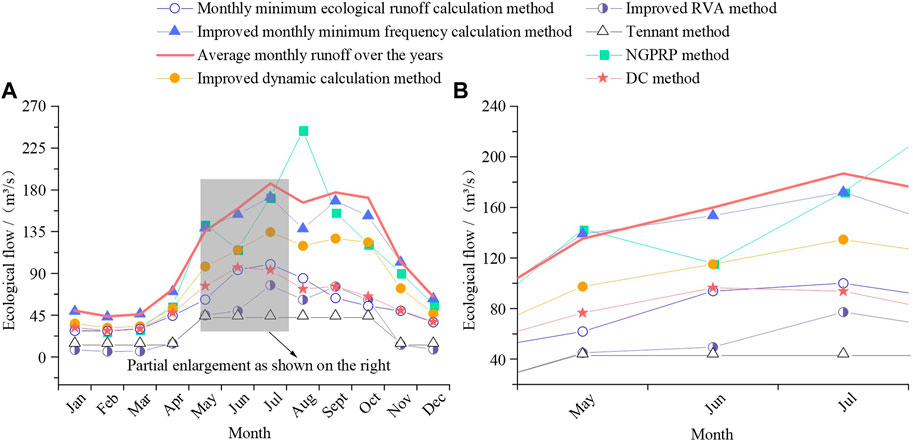
FIGURE 4. Ecological flow for each month of the year calculated by various methods at Wudu Hydrological Station. (A) shows the ecological flow values calculated by seven methods. (B) shows the ‘abrupt change’ in ecological flow calculated by various methods for the months of May-July.
On the whole, the distribution patterns of the ecological flow values calculated by each hydrological methods were consistent with the multi-year monthly average flow (1956–2020), not only reflecting the change of ecological flow with seasonal rainfall replenishment or deficit of runoff but also conforming to the variation of the actual survival water demand of biological communities in the rivers during the reproductive season (fish spawning and nursery season) and the general water use season described in the Tennant method.
Taking the multi-year average monthly runoff curve and the Tennant method calculation results curve were used as a reference, the calculation results for the seven methods selected for this study were grouped into three categories: i) The results were closed to multi-year average monthly runoff. Includes the improved monthly frequency calculation method. Due to the high demand for domestic water and agricultural irrigation on both sides of the Wudu Hydrological Station, the ecological flow should be less than the average monthly runoff, so this method calculation results were on the large side; ii) The results were closed to the Tennant method calculation results. Includes the improved RVA method. The results obtained by this method were calculated based on the minimum ecological flow in the river. Therefore, it could be used as a lower limit for the ecological flow of the river in this study. However, the determination of a lower limit ecological flow requires further analysis and calculation; iii) The results lay between the multi-year average monthly runoff curve and the Tennant method calculation results curve. A total of four methods, including the DC method, the NGPRP method, the Improved Dynamic Calculation method, and the Monthly minimum ecological runoff calculation method. All four methods focus on the study of the guaranteed rate of runoff for each month of the year and had similar calculation principles. Although the calculations were superior, further analysis was required to avoid sudden changes in ecological flow caused by extreme weather, as shown in Section 3.2 of this study.
As shown in Figure 4B, the results of the NGPRP method had an “inflection point” in May. Comparison with multi-year average monthly runoff, which was no non-linear change from May to June. On the one hand, as the NGPRP method was used to calculate, 1998 was the year corresponding to the 90% guarantee rate of the normal water year group, while the low rainfall, relatively high evaporation capacity and water demand in June of that year, and the predominance of rainfall recharge for river runoff in this study area, resulted in a smaller runoff volume in that month than the multi-year average monthly runoff volume, as well as a dramatically smaller ecological flowvalue. On the other hand, for all six methods except the NGPRP method, the results in June follow the same trend as the multi-year average monthly runoff. Therefore, compared to the calculation results of the remaining six methods, the NGPRP method calculation results had another “inflection point” in August for similar reasons as described above. To sum up, the occurrence of the “inflection point” was an accidental phenomenon, which had no significant impact on the calculation of the river ecological flow values in the study area.
As shown in Figure 4A, the ecological flow values calculated by the various methods varied from 11.12 to 62.69 in standard deviations within the same month, with a large level of dispersion. To determine the river ecological flow values at Wudu Hydrological Station of Bailong River Basin with a more scientific and reasonable way, it was necessary to further analyze the accuracy of the calculation results using above mentioned methods, as shown in Section 3.2 and Section 3.3 of this study.
The ecological flow satisfactory level analysis of each method to calculate ecological flow values is a frequent evaluation method often used by many scholars and management agencies in the process of determining the ecological flow (Ge et al., 2019). The evaluation method is based on the preliminary calculation of ecological flow values for each month of the year by each method compared with historical data of monthly runoff, which is calculated as follows:
where:
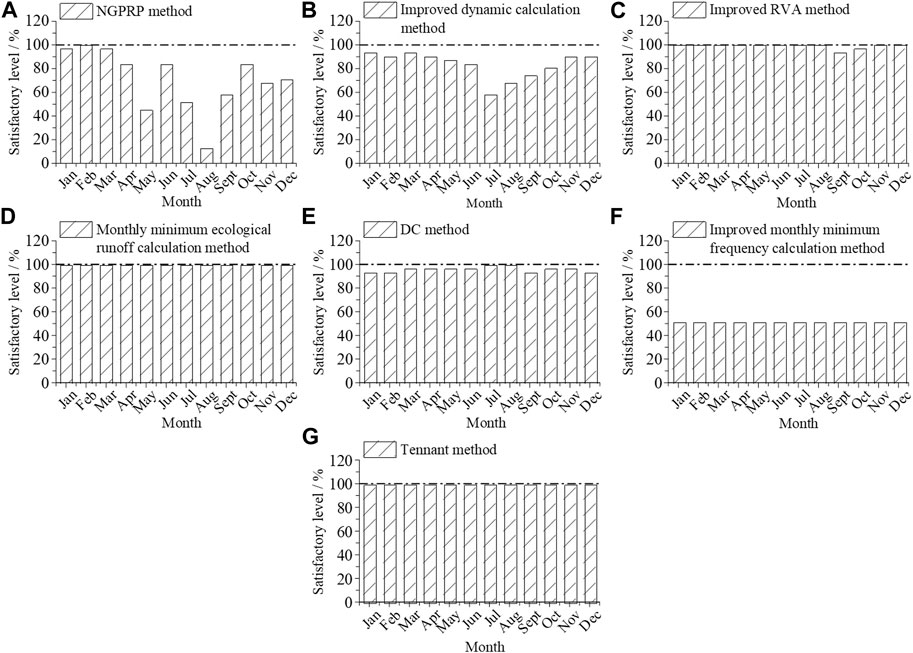
FIGURE 5. Monthly ecological flow satisfactory level within the year. (A) shows the Satisfactory level of ecological flow calculated according to the NGPRP method. (B) shows the Satisfactory level of ecological flow values calculated according to the Improved dynamic calculation method. (C) shows the Satisfactory level of ecological flows calculated according to the Improved RVA method. (D) shows the Satisfactory level of ecological flows calculated according to the Monthly minimum ecological runoff calculation method. (E) shows the Satisfactory level of ecological flows calculated according to the DC method. (F) shows the Satisfactory level of ecological flows based on the Improved monthly minimum frequency calculation method. (G) shows the Satisfactory level of the ecological flow calculated according to Tennant’s method.
As can be seen from Figure 5, the Tennant method, the monthly minimum ecological runoff calculation method, the DC method, and the improved RVA method had satisfactory levels of more than 90% in each month of the year. However, under the improved monthly frequency calculation method, since the ecological flow value in each month was calculated according to the monthly runoff corresponding to the 50% guarantee rate, the calculated satisfactory level was 51.61%. The other two methods (the NGPRP method and the improved DC method) showed a low or extremely low level of satisfaction in the rest of the months, although the satisfactory levels were higher in January, February, and March, with more than 90%. Taking the NGPRP method as an example, this was mainly due to the representative year selected in the calculation process. The ratios of annual mean ecological flow values in May and August exceed 85%, thus showing a low-level ecological flow satisfaction in Figure 5, a phenomenon that also fully illustrates the disadvantages in the single hydrological method calculation of river ecological flow values the occasional extreme deviation (Liu et al., 2016).
The unique geological resources and water resources conditions of Bailong River basin promoted the development and construction of many large, medium, and small hydroelectric projects in the study area, among which most of the hydropower stations took power generation as their main task, often leading to the economic benefits and ecological protection conflict (Shen and Xie, 2020). Therefore, we conducted the economic benefit analysis on river ecological flow to provide theoretical analysis for the determination of ecological flow, but the main research object of the economic benefit test analysis was the diverse type power station taking power generation as the main or only task. The principle of this method was in line with the characteristic that the flow rate of power generation quoted by the turbine of the diverse type of power station determined the economic benefit of the power station within a certain range. In the research process of this study, we adopted Jinping Power Station close to Wudu Hydrological Station on Bailong River as the reference benchmark, which is located in Liangshui Town, Wudu District of Gansu Province and is a typical artificial open channel diversion power station, with the main design task of power generation. The flow rate used to generate electricity was 176 m3⁄s. The calculation results were shown in Figure 6.
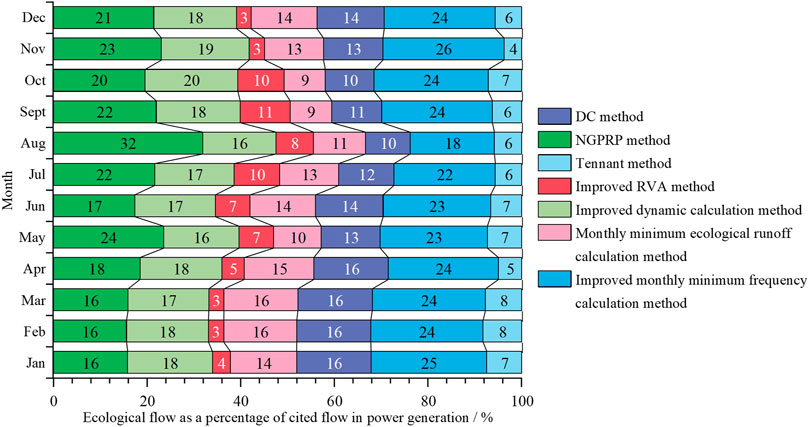
FIGURE 6. Percentage of monthly ecological flow in a generation diversion one within the year.
As shown in Figure 6, the 6 months of January–April, November and December had the lowest percentage of cited flow in power generation, calculated using the improved RVA method and Tennant method, indicating that in such case the power generation efficiency of the Jinping Hydropower Station on Bailong River was much better, while the ecological flow released from the sluice gate was less, thereby, further research was needed to determine whether the limited ecological flow could meet water demand of normal survival of the aquatic biological community in this river section. Each of the remained five methods respectively accounted for about 17% of the total calculated results of the 6 months, with no significant difference. The calculated results by the improved RVA method, DC method, monthly minimum ecological runoff method, and Tennant method from May to October accounted for about 8%, indicating that the economic benefit of the hydropower station under such flow allocation was relatively better, which could both meet the ecological flow demand in the river channel and obtain high economic benefits at the same time. From the perspective of the whole year, the calculation results by the NGPRP method and the improved monthly frequency calculation method accounted for a large proportion of each month within the year. For hydropower plants whose main task aiming at generating electricity, such flow allocation would affect the profitability of hydropower plants to a greater extent. Therefore, it is necessary to further balance the relation-ship between environmental protection and economic benefits.
The Tennant method test analysis was introduced to determine the mean ratio of ecological flow in each category to annual average monthly runoff (Table 5), and the comparative analysis was carried out during the breeding season of aquatic organisms (fish spawning and nursery season) and general water use season in the river channel. The calculated results were shown in Table 6.
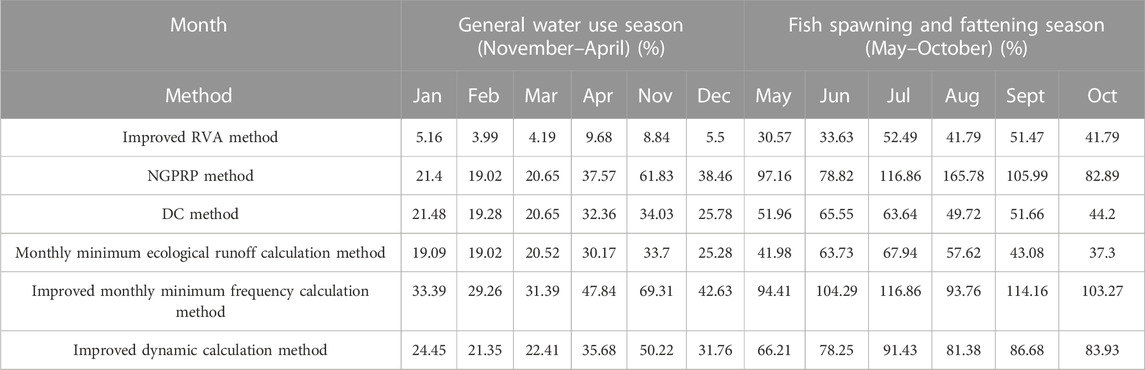
TABLE 6. Tennant method analysis of monthly ecological flow within the year.
Table 6 revealed that the calculated results from the improved RVA method showed extremely poor performance in January, February, March, April, November, and December, which could not meet the minimum instantaneous flow rate for aquatic organisms to maintain habitat survival conditions in a short season of the river, so that the ecological function of this river section could not maintained. Therefore, these data should be excluded from the subsequent overall analysis of the river ecological flow, which could reduce the error of the overall analysis.
In determining the reasonable thresholds for river ecological water demand, it is necessary to clarify the variability characteristics of natural runoff (As shown in Figure 4) to meet the specific ecological function objectives in various reaches of the river at different times within a year (Pan et al., 2013). To reduce the influence on the river ecological flow calculation results due to the extreme rainfall conditions within a year, the satisfactory level of ecological flow, economic benefit, and Tennant method analysis were combined, and the Origin 2021 software was applied in fitting comparison analysis of the monthly ecological flow obtained by each method within a year. Simulation analysis showed that the final fitted equation was optimally simulated by a quartic polynomial, with R2 marked as the maximum and the reliability the highest. The specific fitting results were shown in Figure 7.
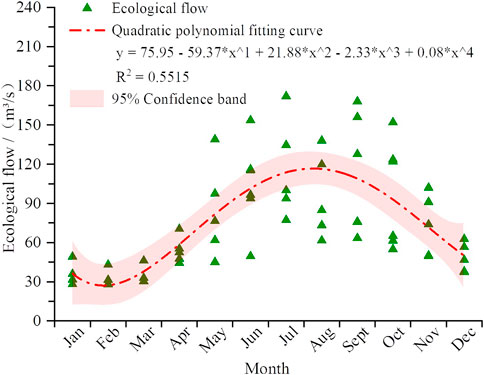
FIGURE 7. Ecological flow threshold fitting analysis.
Related studies had shown that the 95% Confidence Interval (CI) was often used as a reference value to determine the interval for estimating the overall parameters of hydrological sample statistics (Babbar, 2014; Jiang et al., 2015; Wang et al., 2018). In the present study, this method was also used to quantify the upper and lower limits of the ecological flow of the river. The month ecological flow threshold interval of Wudu Hydrological Station in Bailong River Basin was shown in Table 7.
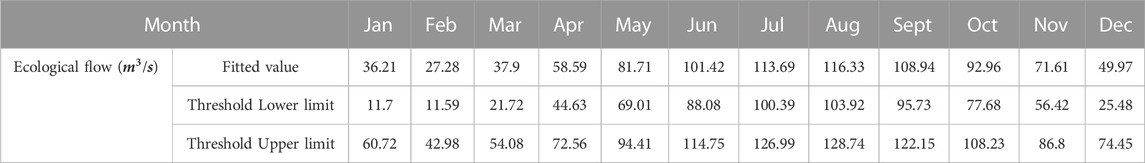
TABLE 7. Upper and lower threshold of the ecological flow.
To ensure the reliability and reasonableness of the fitted results, we once again analyzed the satisfactory level and Tennant method for fitted values of each month’s ecological flow, and the specific calculation results were shown in Table 8.
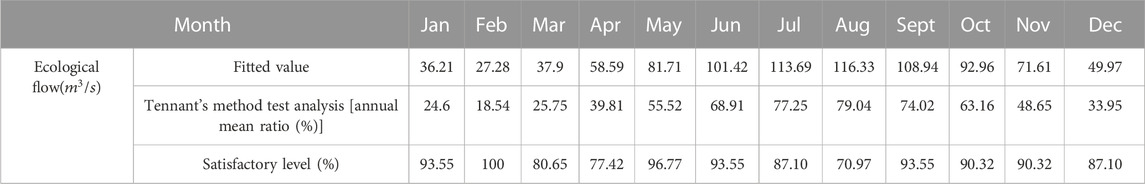
TABLE 8. Evaluation of fitted monthly ecological flow.
The results of ecological flow calculated based on one hydrological method have low confidence, but after coupling multiple hydrological developments and taking 95% confidence intervals, all the ecological flow values were satisfied to a high level (McCluney et al., 2014). As shown in Table 8. It could be seen that the monthly ecological flow values in the middle reaches of Bailong River basin (Wudu Hydrological Station) might meet the requirements of the inter-annual variation of monthly runoff and had a relatively high satisfactory level for the monthly runoff in the last 31 years, which were also sufficient for the minimum ecological water demand of the aquatic communities in the river during the dry and wet seasons. Thus, the results could be used as a reference value for the ecological flow at Wudu Hydrological Station in Bailong River Basin, providing theoretical reference for relevant research and management institutions.
The calculation results showed a high satisfactory level for the survival needs of the runoff and biological communities, which was mainly because the coupled assessment ecological flow of multiple hydrological methods established a threshold range for the survival needs of aquatic species at different times in the study area. Firstly, the selection of the calculation method was mainly in line with the river runoff types of rainfall recharge, meeting the characteristics of the temporal and spatial variation of river runoff with rainfall (Han et al., 2012). Secondly, when coupling multiple hydrological methods were applied to evaluate the ecological flow threshold in Bailong river middle reaches, the data that were beyond the evaluation range in the preliminary calculation results from the seven calculation methods were deleted, making this data more reliable overall. Finally, Origin 2021 was used to perform quadratic fitting and 95% confidence interval threshold calculations obtained from the three test methods, making the model more generalizable and better fitting, thus reducing the underfitting impact on the calculated results and improving fitting accuracy and science (Li and Lin, 2022).
In this study, our work was consistent with the characteristics of runoff changes in Bailong River’s middle reaches, and the satisfactory level of water ecological protection was maintained at a relatively high level, which was of great significance for water ecology management and protection in Bailong River’s middle reaches. Domestic and foreign research on ecological water demand has undergone nearly half a century of development. Although some studies have been conducted in some regions using related methods, due to the influence of uncertain factors such as the large span of river basins, runoff variation population dynamics, and the prevalence of specific case studies and analyses, the concept and connotation of ecological flow has not been uniformed, although many countries have issued corresponding regulations on ecological civilization at national levels (Han et al., 2012; Chen et al., 2016). As the largest tributary in Jialing River, Bailong River has an abundant water volume, which is responsible for various major tasks such as residential water demand in southern Gansu Province and northern Sichuan Province, ecological water demand and hydroelectric power generation, among others. Previous research found that protecting river water ecological security and biodiversity was of great significance for maintaining regional coordination and unity, as well as green and healthy development (Shenton et al., 2012; Wang et al., 2017). We used the multi-year average monthly runoff from 1956 to 2020 as a comparison and made a comparison description of the preliminary calculation results of ecological flow in the middle reaches of Bailong River. The inadequacy of this study is that the known hydrological data has not been analyzed by proper methods such as models or empirical formulas, thereby further re-searches on this aspect need to have proceeded in the future.
The coupling of multiple hydrological methods to calculate ecological flow is mainly applied to water ecology restoration and water resource allocation management in some of the basins in China (Wu et al., 2022). The amount of inland river water resources has gradually become a major influencing factor for regional economic development, and in order to avoid over-exploitation of water resources and to protect aquatic biodiversity and the original ecological structure of the river, rational allocation of water resources has gradually been emphasized, and government agencies have developed mechanisms for dividing water rights of watershed water resources to balance water for domestic, agricultural irrigation, hydropower generation and ecological water demand (Liu, 2012). Taking the Yellow River as an example, over-exploitation of river water will not only affect the normal survival of aquatic organisms in the river, but also cut off the flow of the river downstream (Yin, 2002). As the ecological flow of the river is related to the normal survival of aquatic organisms and regional water resources distribution, and the hydrological method to calculate ecological flowis a low-cost, simple and fast method, many scholars have conducted research in this area, but there are differences in the ecological flow calculation methods and evaluation methods for different types of rivers (Ma et al., 2019). Su et al. (2022) used six hydrological methods to calculate the ecological flow in Dahuangkou estuary of the Xi River based on the hydrological data of the river before the anthropogenic disturbance, and the calculated results were compared with those based on the simulation of the fish spawning habitat in this river section in related studies, and the satisfactory level was high. Ren et al. (2018) proposed a complex ecological flow study framework, which considered the impact of intra and inter-annual variation of runoff caused by climate change on ecological flow, but the final calculated ecological flow values were not analyzed in terms of the satisfactory level, and their generalizability needs further analysis. The ecological flow threshold calculation method proposed in this study not only took into account the influence of river type on the calculation method, but also removed the data with low satisfactory levels from the calculation results through various satisfactory level analysis methods, effectively improving the accuracy of the calculation of ecological flow thresholds in rivers, which can provide a reference for the calculation of ecological water demand in watershed water management for rivers where rainfall is the main form of recharge runoff.
In this study, we assessed the performance of ecological flow in river by comparing multiple hydrological methods, using multiple hydrological methods coupled to assess ecological flow, while evaluating the results, and applied it to the Jinping Hydropower Station, where the Wudu Hydrological Station of Bailong River is located, to obtain ecological flow thresholds for each month of the year at the Wudu Hydrological Station. The coupling of multiple hydrological methods to assess river ecological flow took into account the differences between inter-annual monthly variations in river runoff, primarily in the form of rainfall rechange runoff, and the single hydrological method when calculating river ecological flow, and took into account the analysis of ecological flow satisfactory level, the analysis of economic benefits of hydropower station. The Tennant’s method test analysis and the comprehensive analysis, the overall satisfactory level of the calculation results was higher than the satisfactory level of the single hydrological method results, and the results were more practical than the results of the Tennant method test analysis alone, in line with the ecological meaning, and meet the water needs of the biological communities within the river, which could be used as a reference value for the ecological flow threshold in the river of study area. Furthermore, the conflict between power generation benefits and ecological protection during fish spawning and growth seasons would have an impact on the guaranteed rate of ecological flow, necessitating gradient cooperation, joint scheduling, and reasonable development of water conservancy projects upstream and downstream of the river.
The datasets presented in this study can be found in online repositories. The names of the repository/repositories and accession number(s) can be found in the article/Supplementary Material.
JY prepared the data, calculated the methodology, conceptualized and drafted the article. HZ performed the funding acquisition. SY and HZ wrote-reviewed and edited. SY and HZ supervised, reviewed and edited. ZW validated and investigated. CZ performed the visualization, and XC organized the data. All authors have read and agreed to the published version of the manuscript.
This work was supported by the National Natural Science Foundation of China (No. 51669001, 52269008), the Industrial Support Plan Project of the Gansu Provincial Department of Education (No. 2022CYZC-51), and the Key Research and Planning Projects of Gansu Province (No. 18YF1NA073).
The authors would like to thank the National Natural Science Foundation of China (No. 51669001, 52269008), the Industrial Support Plan Project of the Gansu Provincial Department of Education (No. 2022CYZC-51), and the Key Research and Planning Projects of Gansu Province (No. 18YF1NA073) for the funding and lab facilities. We also thank the editor and two referees for careful reading and comments which will greatly improve the paper.
The authors declare that the research was conducted in the absence of any commercial or financial relationships that could be construed as a potential conflict of interest.
All claims expressed in this article are solely those of the authors and do not necessarily represent those of their affiliated organizations, or those of the publisher, the editors and the reviewers. Any product that may be evaluated in this article, or claim that may be made by its manufacturer, is not guaranteed or endorsed by the publisher.
CI, Confidence Interval; IFIM, Instream Flow Incremental Methodology; BBM, Building Block Methodology; NGPRP, Northern Great Plains Resource Program; RVA, Range of Variability Approach; DC, Duration Curve; FDC, Flow Duration Curve.
Abdi, R., and Yasi, M. (2015). Evaluation of environmental flow requirements using eco-hydrologic–hydraulic methods in perennial rivers. Water Sci. Technol. 72, 354–363. doi:10.2166/wst.2015.200
Angus Webb, J., Miller, K. A., King, E. L., Little, S. C., Stewardson, M. J., Zimmerman, J. K. H., et al. (2013). Squeezing the most out of existing literature: A systematic re-analysis of published evidence on ecological responses to altered flows. Freshw. Biol. 58, 2439–2451. doi:10.1111/fwb.12234
Babbar, R. (2014). Pollution risk assessment based on QUAL2E-UNCAS simulations of a tropical river in Northern India. Environ. Monit. Assess. 186, 6771–6787. doi:10.1007/s10661-014-3888-1
Bevacqua, E., Zappa, G., Lehner, F., and Zscheischler, J. (2022). Precipitation trends determine future occurrences of compound hot–dry events. Nat. Clim. Change 12, 350–355. doi:10.1038/s41558-022-01309-5
Bhaduri, A., Bogardi, J., Siddiqi, A., Voigt, H., Vörösmarty, C., Pahl-Wostl, C., et al. (2016). Achieving sustainable development goals from a water perspective. Front. Environ. Sci. 4, 64. doi:10.3389/fenvs.2016.00064
Brown, C. M., Lund, J. R., Cai, X., Reed, P. M., Zagona, E. A., Ostfeld, A., et al. (2015). The future of water resources systems analysis: Toward a scientific framework for sustainable water management: The future of water resources systems analysis. Water Resour. Res. 51, 6110–6124. doi:10.1002/2015WR017114
Chen, A., Wu, M., Chen, K., Sun, Z., Shen, C., and Wang, P. (2016). Main issues in research and practice of environmental protection for water conservancy and hydropower projects in China. Water Sci. Eng. 9, 312–323. doi:10.1016/j.wse.2017.01.008
Chen, Z. Q. (2005). Ecological flow requirements for the middle and lower reaches of the Yangtze River. Nanjing: Hohai Univ. Available at: https://kns.cnki.net/KCMS/detail/detail.aspx?dbcode=CMFD&dbname=CMFD0506&filename=2005074300.nh&v=.
Dai, L., Fang, G., Huang, X., and Zhong, J. (2019). Ecological flow process evaluation of a hydropower STATION’S dehydration river. Appl. Ecol. Environ. Res. 17. doi:10.15666/aeer/1703_57075722
Dong, Z.-H., Yang, X. H., Guo, Y. N., Mei, Y., Li, Y. Q., and Li, J. Q. (2012). Modified frequency computation method for optimal environmental flows. Therm. Sci. 16, 1539–1543. doi:10.2298/TSCI1205539D
Gansu Provincial Water Resources Department (2020). Gansu provincial water resour. Lanzhou: Bulletin. Available at: http://slt.gansu.gov.cn/slt/index.shtml (Accessed October 14, 2021).
Ge, J. J., Peng, W. Q., Zhang, W. H., and Qu, X. D. (2019). Comparison of several hydrological methods to determine the ecological flow for instream river一A case study of Zhoukou hydrological station in Shaying River. South-to-North Water Divers. Water Sci. Technol. 17, 75–80. doi:10.13476/j.cnki.nsbdqk.2019.0036
Gippel, C. J., and Stewardson, M. J. (1998). . Use of wetted perimeter in defining minimum environmental flows. River Res. Appl. 14, 53–67. doi:10.1002/(sici)1099-1646(199801/02)14:1<53::aid-rrr476>3.0.co;2-z
Gleick, P. H. (1998). Water in crisis: Paths to sustainable water use. Ecol. Appl. 8, 571–579. doi:10.1890/1051-0761(1998)008[0571:WICPTS]2.0.CO;2
Guo, L. D., Xia, Z. Q., Lin, H., and Wang, Y. (2009). Researches on application of the tennant method in ecological flow evaluention. Acta Ecol. Sin. 29, 1787–1792. doi:10.3321/j.issn:1000-0933.2009.04.020
Hairan, M. H., Jamil, N. R., Azmai, M. N. A., Looi, L. J., and Camara, M. (2021). Environmental flow assessment of a tropical river system using hydrological index methods. Water 13, 2477. doi:10.3390/w13182477
Hamidifar, H., Akbari, F., and Rowiński, P. M. (2022). Assessment of environmental water requirement allocation in anthropogenic rivers with a hydropower dam using hydrologically based methods—case study. Water 14, 893. doi:10.3390/w14060893
Han, S. M., Yang, Y. H., Fan, T., Xiao, D. P., and Moiwo, J. P. (2012). Precipitation-runoff processes in Shimen hillslope micro-catchment of Taihang Mountain, north China. Hydrol. Process 26, 1332–1341. doi:10.1002/hyp.8233
Harper, M., Rytwinski, T., Taylor, J. J., Bennett, J. R., Smokorowski, K. E., Olden, J. D., et al. (2022). How do changes in flow magnitude due to hydropower operations affect fish abundance and biomass in temperate regions? A systematic review. Environ. Evid. 11, 3. doi:10.1186/s13750-021-00254-8
Hughes, D. A. (2001). Providing hydrological information and data analysis tools for the determination of ecological instream flow requirements for South African rivers. J. Hydrol. 241, 140–151. doi:10.1016/S0022-1694(00)00378-4
Jiang, S., Jomaa, S., Büttner, O., Meon, G., and Rode, M. (2015). Multi-site identification of a distributed hydrological nitrogen model using Bayesian uncertainty analysis. J. Hydrol. 529, 940–950. doi:10.1016/j.jhydrol.2015.09.009
Kang, S. C., Guo, W. Q., Zhong, X. Y., and Xu, M. (2020). Change in the mountain cryosphere ang their impacts and measures. Clim. Chang. Res. 16, 143–152. doi:10.12006/j.issn.1673-1719.2019.257
Karakoyun, Y., Yumurtaci, Z., and Dönmez, A. H. (2016). Environmental flow assessment for energy generation sustainability employing different hydraulic evaluation methods: Çambaşi hydropower plant case study in Turkey. Clean. Technol. Environ. Policy 18, 583–591. doi:10.1007/s10098-015-1023-9
Karakoyun, Y., Dönmez, A. H., and Yumurtacı, Z. (2018). Comparison of environmental flow assessment methods with a case study on a runoff river–type hydropower plant using hydrological methods. Environ. Monit. Assess. 190, 722. doi:10.1007/s10661-018-7107-3
Książek, L., Woś, A., Florek, J., Wyrębek, M., Młyński, D., and Wałęga, A. (2019). Combined use of the hydraulic and hydrological methods to calculate the environmental flow: Wisloka river, Poland: Case study. Environ. Monit. Assess. 191, 254. doi:10.1007/s10661-019-7402-7
Li, Y., and Lin, J. (2022). Calculation of minimum ecological flow in dewatering section of small hydropower stations: Taking Panxi cascade hydropower stations as an example. South-to-North Water Divers. Water Sci. Technol. 20, 536–543. doi:10.13476/j.cnki.nsbdqk.2022.0054
Liu, J. (2012). A tentative analysis of the concept and system of water rights: From the perspective of the division of resource water and product water. Nanchang: Contemporary Finance & Economics, 26–34. Available at: https://kns.cnki.net/KCMS/detail/detail.aspx?dbcode=CJFD&dbname=CJFD2012&filename=DDCJ201206002&v=.
Liu, Y. Y., Zhu, J. F., and Zhao, J. S. (2016). Development history and frontiers of river environmental flow research. J. Hydroe. Eng. 35, 23–34. doi:10.11660/slfdxb.20161203
Ma, D. Y., Luo, W. G., Yang, G. L., Lu, J., and Fan, Y. Z. (2019). A study on a river health assessment method based on ecological flow. Ecol. Model. 401, 144–154. doi:10.1016/j.ecolmodel.2018.11.023
McCluney, K. E., Poff, N. L., Palmer, M. A., Thorp, J. H., Poole, G. C., Williams, B. S., et al. (2014). Riverine macrosystems ecology: Sensitivity, resistance, and resilience of whole river basins with human alterations. Front. Ecol. Environ. 12, 48–58. doi:10.1890/120367
Men, B. H., Lin, C. K., Li, Z. F., and Sun, B. Y. (2012). Application of flow duration curve method in calculating instream minimum ecological water demand in guanting gorge of yongding river. South-to-North Water Divers. Water Sci. Technol. 10, 52–56+92. doi:10.3724/SP.J.1201.2012.02052
Ministry of Water Resources of the People's Republic of China (2015). Ministry of Water Resources on the approval of the release of water industry standards announcement (Specification of calculation of environmental flow in rivers and lakes). Tech. Superv. Water Resour. 23, 90.
Mosley, M. P. (1982). Analysis of the effect of changing discharge on channel morphology and instream uses in a Braided River, Ohau River, New Zealand. Water Resour. Res. 18, 800–812. doi:10.1029/WR018i004p00800
Pan, Z. R., Ruan, X. H., and Xu, J. (2013). A new calculation method of instream basic ecological water demand. J. Hydrau. Eng. 44, 119–126. doi:10.13243/j.cnki.slxb.2013.01.005
PHABSIM for Windows User’s Manual and Exercises (2022). PHABSIM for Windows User’s manual and Exercises. Available at: https://pubs.er.usgs.gov/publication/ofr2001340 (Accessed December 1, 2022).
Poff, N. L., and Matthews, J. H. (2013). Environmental flows in the anthropocence: Past progress and future prospects. Curr. Opin. Environ. Sustain. 5, 667–675. doi:10.1016/j.cosust.2013.11.006
Ren, K., Huang, S., Huang, Q., Wang, H., and Leng, G. (2018). Environmental flow assessment considering inter- and intra-annual streamflow variability under the context of non-stationarity. Water 10, 1737. doi:10.3390/w10121737
Richter, B., Baumgartner, J., Wigington, R., and Braun, D. (1997). How much water does a river need? Freshw. Biol. 37, 231–249. doi:10.1046/j.1365-2427.1997.00153.x
Shaeri Karimi, S., Yasi, M., and Eslamian, S. (2012). Use of hydrological methods for assessment of environmental flow in a river reach. Int. J. Environ. Sci. Technol. 9, 549–558. doi:10.1007/s13762-012-0062-6
Shen, M. H., and Xie, H. M. (2020). Transboundary ecological compensation in the Xin'an River Basin and its institutional arrangement of sustainability. China Popul. Resour. Environ 30, 156–163. doi:10.12062/cpre.20200304
Shenton, W., Bond, N. R., Yen, J. D. L., and Mac Nally, R. (2012). Putting the “ecology” into environmental flows: Ecological dynamics and demographic modelling. Environ. Manage. 50, 1–10. doi:10.1007/s00267-012-9864-z
Su, H., Xu, Z. X., Li, P., Ye, C. L., and Wang, J. J. (2022). Estimation of ecological baseflow with several hydrological methods at the Dahuangjiangkou reach of the Xijiang River. J. Beijing Normal Univ. Nat. Sci.) 58, 269–276. doi:10.12202/j.0476-0301.2021229
Tennant, D. L. (1976). Instream flow regimens for fish, wildlife, recreation and related environmental resources. Fisheries 1, 6–10. doi:10.1577/1548-8446(1976)001<0006:IFRFFW>2.0.CO;2
Tharme, R. E. (2003). A global perspective on environmental flow assessment: Emerging trends in the development and application of environmental flow methodologies for rivers. River Res. Appl. 19, 397–441. doi:10.1002/rra.736
Wang, Y., Wang, D., Lewis, Q. W., Wu, J., and Huang, F. (2017). A framework to assess the cumulative impacts of dams on hydrological regime: A case study of the Yangtze river. Hydrol. Process 31, 3045–3055. doi:10.1002/hyp.11239
Wang, J., Forman, B. A., and Davis, A. P. (2018). Probabilistic stormwater runoff and water quality modeling of a highway in suburban Maryland. J. Hydrol. Eng. 23, 05017034. doi:10.1061/(ASCE)HE.1943-5584.0001600
Wu, M., and Chen, A. (2018). Practice on ecological flow and adaptive management of hydropower engineering projects in China from 2001 to 2015. Water Policy 20, 336–354. doi:10.2166/wp.2017.138
Wu, X. J., Lenon, G. P., and Dong, Y. (2020). The calculation of riverine ecological instream flows and runoff profit-loss analysis in a coal mining area of northern China. River Res. Appl. 36, 760–768. doi:10.1002/rra.3594
Wu, C. X., Bo, Y., Du, Y. Y., and Zhou, F. (2022). Ecological flow requirement deficit in the Songliao River Basin and its key drivers. Acta Sci. Circumstantiae 42, 151–159. doi:10.13671/j.hjkxxb.2021.0470
Yao, Y. Z., Jiang, C. L., and Wan, F. T. (2021). Research on ecological base flow of classical sections in the Luan River using various hydrology methods. South-to-North Water Divers. Water Sci. Technol. 19, 941–949. doi:10.13476/j.cnki.nsbdqk.2021.0098
Yin, G. K. (2002). Reflections on the environmental tolerance of water resources development in the Yellow River Basin. Acta Geogr. Sin. 224-231. Available at: https://kns.cnki.net/KCMS/detail/detail.aspx?dbcode=CJFD&dbname=CJFD2002&filename=DLXB200202013&v=. doi:10.3321/j.issn:0375-5444.2002.02.013
Yin, J., Slater, L., Gu, L., Liao, Z., Guo, S., and Gentine, P. (2022). Global increases in lethal compound heat stress: Hydrological drought hazards under climate change. Geophys. Res. Lett. 49. doi:10.1029/2022GL100880
Yin, J., Guo, S., Wang, J., Chen, J., Zhang, Q., Gu, L., et al. (2023). Thermodynamic driving mechanisms for the formation of global precipitation extremes and ecohydrological effects. Sci. China Earth Sci. 66, 92–110. doi:10.1007/s11430-022-9987-0
Zhang, Z. G., Jin, Y., Li, K. F., Li, Y., and He, F. F. (2017). RVA method-based study on river ecological baseflow hydrograph. Water Resour. hydrop. Eng. 48, 155–160. doi:10.13928/j.cnki.wrahe.2017.09.024
Zhang, H., Zeng, C. J., Li, T., He, S. F., Mo, K. L., Yang, P. S., et al. (2022). Ecological flow in the mid-lower hanjiang River based on spawning demands of the four major Chinese carps. J. Hydroe. 43, 1–8. doi:10.15928/j.1674-3075.202101190013
Zhao, R. H., Peng, T., Wang, H. F., Gao, F., and Qi, Z. (2018). Study on instream basic ecological water demand based on the improved dynamic calculation method. South-to-North Water Diversion. Water Sci. Technol. 16, 114–119. doi:10.13476/j.cnki.nsbdqk.2018.0104
Keywords: ecological flow threshold, rainfall recharge runoff, hydrological method, middle reaches of Bailong River, 95% confidence intervals
Citation: Yu J, Yu S, Zhang H, Wang Z, Zhou C and Chen X (2023) Determination of ecological flow thresholds for rainfall-recharging rivers based on multiple hydrological methods. Front. Environ. Sci. 11:1116633. doi: 10.3389/fenvs.2023.1116633
Received: 05 December 2022; Accepted: 15 February 2023;
Published: 23 February 2023.
Edited by:
Yang Yu, Beijing Forestry University, ChinaReviewed by:
Jiabo Yin, Wuhan University, ChinaCopyright © 2023 Yu, Yu, Zhang, Wang, Zhou and Chen. This is an open-access article distributed under the terms of the Creative Commons Attribution License (CC BY). The use, distribution or reproduction in other forums is permitted, provided the original author(s) and the copyright owner(s) are credited and that the original publication in this journal is cited, in accordance with accepted academic practice. No use, distribution or reproduction is permitted which does not comply with these terms.
*Correspondence: Hengjia Zhang, NTk2MDg4NjgzQHFxLmNvbQ==
Disclaimer: All claims expressed in this article are solely those of the authors and do not necessarily represent those of their affiliated organizations, or those of the publisher, the editors and the reviewers. Any product that may be evaluated in this article or claim that may be made by its manufacturer is not guaranteed or endorsed by the publisher.
Research integrity at Frontiers
Learn more about the work of our research integrity team to safeguard the quality of each article we publish.