 Zhonglin Tang
 Min Fu2
95% of researchers rate our articles as excellent or good
Learn more about the work of our research integrity team to safeguard the quality of each article we publish.
Find out more
ORIGINAL RESEARCH article
Front. Environ. Sci. , 12 January 2023
Sec. Environmental Economics and Management
Volume 11 - 2023 | https://doi.org/10.3389/fenvs.2023.1115067
This article is part of the Research Topic Resources and Environmental Management for Green Development View all 26 articles
As the core carrier and organizational bodies of the regional industrial space, the study of the location of industrial enterprises and the formation of their economic location is related to the rational development of regional industries, the coordination of humans and the environment, and the effective allocation of resources. Taking Chongqing, one of the six old industrial bases in China, as an example, this study analyzed the spatial distribution characteristics, economic location characteristics, and formation laws of industrial enterprises based on the Points of interest data (POI), and investigation data. The results showed that industrial enterprises in Chongqing show obvious spatial clustering characteristics. About 93.50%, 60.34%, 96.67%, 97.57%, 73.57%, 64.83% of industrial enterprises were distributed within the spatial range of 10 Km from the motorways, national highways, provincial highways, county highways, main streams of rivers and central towns, and 93.48% of industrial enterprises were distributed at an altitude of 800 m or less. In order to further reveale the economic location characteristics of industrial enterprises in Chongqing, this study further quantified the spatial differentiation law of industrial economic location based on Geographically weighted regression (GWR). The results showed that factors such as the Distance to National Highways (DNH), Distance to County Highways (DCH), Distance to Central Towns (DCC), Distance to River systems (DR), and Population Density (POP) had significant positive impacts on the formation of economic locations of industrial enterprises, while the Distance to Motorway (DMW) exerted a certain negative influence, but the effectiveness sees strong spatial heterogeneity according to the type of industry and the actual regional industrial development, with factors such as transportation accessibility, environment, and labor force playing a moderating role.
Industrial development is the main driving force of the regional economy. Research on the location characteristics and formation of industrial enterprises, the core carriers and organizing bodies of the regional industrial space, are concerned with the regional industrial spatial layout and effective resource allocation (Helsley, 2003; Ottaviano, 1999). Studies on the spatial distribution of industrial enterprises can be traced back to Ebenezer Howard’s (1889) discussion about the layout of industrial land in cities in his theory of Garden City. Isard (1956) developed and constructed a research framework of industrial space, and started the research of regional science from the perspectives of the spatial layout of industry and the relationship between location and market. Regarding administrative units, the existing studies on the spatial distribution of industrial enterprises cover multiple levels including national, provincial, municipal, and urban agglomeration (Helsley, 2003; Mohan, 1997; Viladecans-Marsal, 2004; Peneder, 2015; Wang K. et al., 2020). In terms of industry, most of the research focuses on the overall study of the secondary industry, with studies relatively concentrated on single industrial categories or single enterprises such as heavy industry and chemical industry (Baykov, 2010; Ottaviano, 1999; Yong, 2012; Cheng et al., 2018; Wu et al., 2021). For instance, Wu conducted a study on the investment location differences and changing dynamics of Chinese chemical companies using the database of capacity investment of Chinese listed chemical companies, revealing the north-south differences in location choices of chemical companies whether it is State-owned or not (Wu et al., 2021). In terms of research methods, distance-based industrial agglomeration measurement methods such as DO index and M function, and quantitative identification methods of industrial clusters such as location entropy, factor analysis, and cluster analysis are widely used (Gu and Ding, 2022; Rikalovic, 2015; Spinola et al., 2015; Zeng et al., 2008).
The economic location characteristics presented by the spatial distribution of industrial enterprises have long been a research focus in the fields of industrial planning and regional planning. The economic location of an industrial enterprise is a choice made according to the principles of economics (Wu and Shi, 1997). The formation of industrial enterprises’ economic locations is closely related to the comprehensive exploitation and utilization of natural, social, and economic resources. Currently, a variety of factors, including the economy, market, transportation, communication, policy, and physical geography are widely discussed in terms of the formation of the economic locations of industrial enterprises (Nguyen and Diez, 2017; Pe'Er and Vertinsky, 2006; Renfeng et al., 2018; Sun et al., 2014; Zhang et al., 2021). For example, Aviad Pe’er (Pe'Er and Vertinsky, 2006) discussed the influence of location characteristics, such as agglomeration, competition, deterrence, and sunk costs, on location choices Using data about all de novo entrants into the Canadian manufacturing sectors during 1984-1998, revealing the preference characteristics of location choice of different enterprises. At the same time, Sun et al. (2014) portrayed the preference characteristics of various types of enterprises in Shenyang for public facilities and water conservancy facilities in their economic location choice through a potential model. Regarding research methods, quantitative analysis methods such as ordinal categorical logistic regression models and SLM are also widely adopted. However, due to the limitations of analysis methods and data of industrial enterprises, the current research on the economic locations of industrial enterprises is mostly focused on single industries or single enterprises, with a dearth of in-depth studies on industrial enterprises in general within certain administrative units and functional units. As a result, it is difficult to obtain reliable conclusions that can reflect the overall regional development, thus making it hard to provide valuable references for the industrial development of the regions, which to a certain extent, also restricts the development of the economic location theory. The advancing big data and spatial information technology can bridge this gap in some ways, but there have been few similar attempts in the research on industrial economic location.
Therefore, this study took Chongqing, one of China’s six old industrial bases, as an example, and carried out a study of the economic locations of industrial enterprises within the city based on POI, API. As the only municipality directly under the central government in Western China, Chongqing witnessed rapid industrial development in the early years due to its advantageous water transport conditions. With the transformation of China’s economic structure in recent years, however, the spatial contradiction between its economic development and ecological protection has intensified and the livelihood, economic, and environmental problems caused by factors such as poor topographical conditions, simplistic industrial structure, and unreasonable industrial layout have gradually stood out. Hence, it is of great practical significance to explore the spatial distribution and economic location characteristics of industrial enterprises in Chongqing at the spatial level and understand the laws of the formation of the economic locations for formulating reasonable industrial spatial planning, guiding industrial development, and alleviating urban problems.
Chongqing, also known as Mountain City, is located in southwest China (Figure 1). It is the economic center of the upper reaches of the Yangtze River, the financial center of Western China, and an important national center for advanced manufacturing. In addition, it is the only municipality directly under the central government in Western China and one of the cores in constructing the Chengdu-Chongqing economic circle. Chongqing covers an area of 82,400 square kilometers. It has 26 districts and 12 counties, of which Yuzhong District, Dadukou District, Jiangbei District, Shapingba District, Jiulongpo District, Nanan District, Beibei District, Yubei District, and Banan District are traditionally known as the central urban areas (also called the nine districts of the central city). According to the space function planning of the land, Chongqing is divided into three major functional areas: the central city metropolitan area, the urban cluster of the Three Gorges Reservoir area in northeast Chongqing, and the urban cluster of the Wuling Mountain area in southeast Chongqing. Chongqing has undulating topography and multiple geomorphic types, with many sloping fields. Specifically, mountains, hills, river valleys, and flat areas account for 76%, 22%, and 2% of the land respectively. The city boasts dense river networks, with the mainstream of the Yangtze River running through it from west to east.
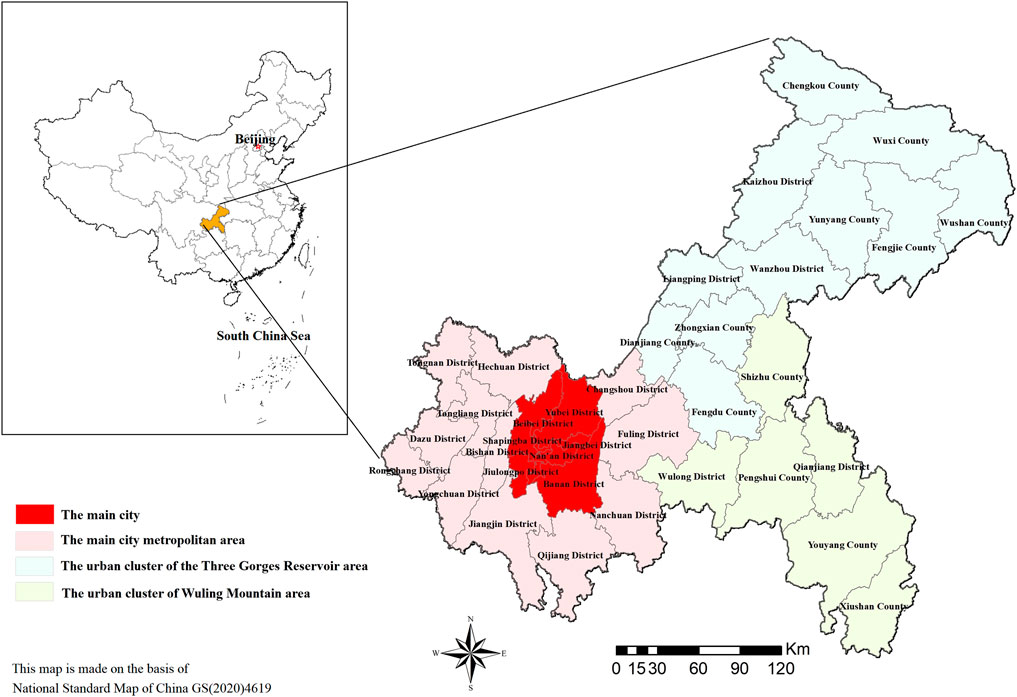
FIGURE 1. Administrative divisions and functional divisions of Chongqing.
The industrial enterprises involved in this study are mainly industrial enterprises registered and operating in Chongqing, referring to enterprises covered by industrial sectors such as mining, manufacturing, electricity, heat, gas and water production, and supply as classified in the Industrial Classification for National Economic Activities (GB/T 4754–2017). The data on industrial enterprises in this study are mainly obtained from the data collation of enterprise directories, including the China Business Directory and the China Manufacturing Enterprise Directory, while the data on enterprise attributes such as industry classification and registered capital are obtained by comparing the information on enterprise attributes provided by authoritative websites such as Gaode Map’s POI data and Tianyancha. Taking into account the actual situation of the study, only enterprises with a registered capital of more than one million were selected as research objects, and a total of 10,469 cases of enterprise data were obtained. Based on the enterprise directory data, this study acquired the spatial coordinate information of each industrial enterprise from Baidu API and constructed a spatial distribution database of industrial enterprises in Chongqing through the ArcGIS10.4 platform.
In this study, the GDP of the locations of industrial enterprises was used to represent their levels of economic location. Data on GDP, population density, topography, average annual precipitation, and accumulated temperature were obtained from the 2019 data sets of kilometer grids provided by the Resource and Environment Science and Data Centre of the Chinese Academy of Sciences (http://www.resdc.cn/), while data on rivers and road networks were collected from the National Geomatics database. Considering the representativeness of indicators, this study, based on the data of the kilometer grids, divided 2km×2 km grids according to the average floor area of medium and large industrial enterprises, and obtained the average values of factors such as average annual precipitation, population density, GDP, and elevation of the grids according to the geographical coordinates of industrial enterprises, with the values corresponding to the target industrial enterprises. The distance to national highways, county highways, and the city center were all calculated based on the neighborhood analysis function of the ArcGIS10.4 platform.
Spatial auto-correlation theory can be used to solve the problem of whether industrial enterprises are clustered or not, divided into global spatial auto-correlation and local spatial auto-correlation. The global spatial auto-correlation describes the overall distribution of a phenomenon and determines whether there is agglomeration of this phenomenon in the region. According to the purpose of the study, only the existence of spatial agglomeration of industrial enterprises and the overall degree of agglomeration need to be clarified, without knowing the exact location where the agglomeration occurs, so Moran’s I index is chosen to measure the global spatial auto-correlation characteristics.
Where,
When cross-sectional data is used to establish econometric models, due to its spatial complexity, auto-correlation and variability, the influence of explanatory variables over the explained variables may vary between different regions. Therefore, it is more realistic to assume that the economic behavior between regions has spatial heterogeneity and difference. Geographically weighted regression models are usually used to address this issue McMillen (2004).
Where: x and y are independent variables and dependent variables respectively, k is the number of independent variables, j is the sample point,
Baidu Maps provides developers with rich interfaces such as JavaScript, iframe, WebService and httpandxml, covering positioning, mapping, search, eagle-eye tracks, navigation routes, road conditions, and other functions. Developers can access Baidu’s services and data to create fully functional and interactive map applications. It supports browser-based map application development for PC and mobile, and supports map development with HTML5 features. The forward/reverse geo-coding function can be used to obtain the latitude and longitude of the corresponding location, which can be used at any time by requesting the Baidu Map application using Python’s requests module. The development documentation of Baidu Maps can be found at http://lbsyun.baidu.com/index.php. title = webapi/guide/webservice-geocode-ing.
ArcGIS10.4 was used to visualize the spatial distribution of industrial enterprises in Chongqing, and the kernel density analysis method was used to draw a density distribution map of industrial enterprises in the city (Figure 2). At the municipal level, industrial enterprises in Chongqing are mainly concentrated in the nine districts of the central city, accounting for 49.67% of the total. The distribution of kernel density shows a single-kernel aggregation pattern, with the distribution declining from the high-density areas to the periphery.
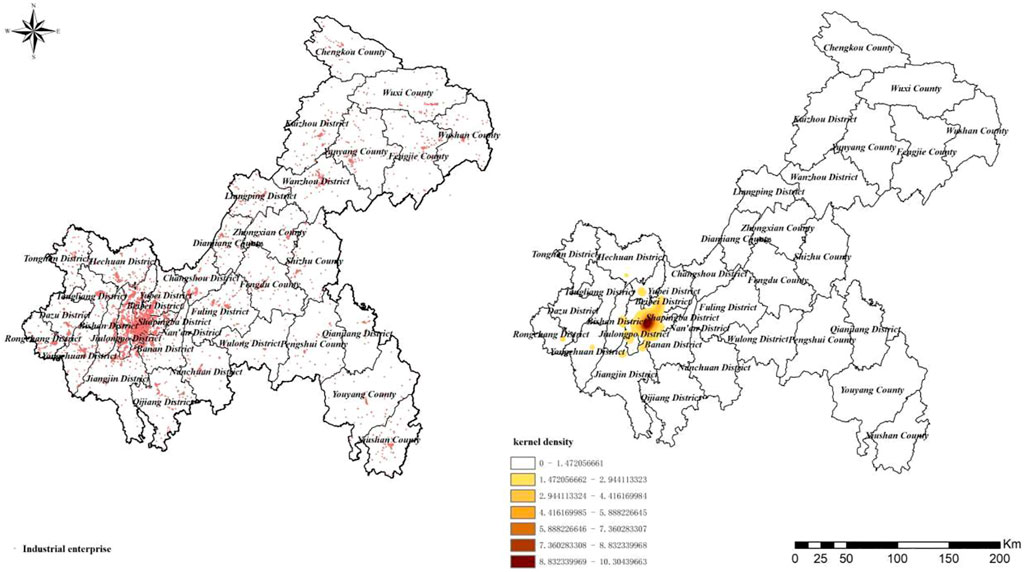
FIGURE 2. Spatial distribution and kernel density distribution of industrial enterprises.
At the county level, industrial enterprises are also concentrated in the counties or traditional regional central towns, such as the central urban areas of Wanzhou and Fuling Districts (Figure 3). In terms of urban functional zoning, 81.29% of industrial enterprises are distributed in the central city metropolitan area of Chongqing, with Jiulongpo, Yubei, and Shapingba Districts making up the largest proportions of 12.70%, 9.10%, and 6.89% respectively. 12.71% of industrial enterprises are located in the urban cluster of the Three Gorges Reservoir area in northeast Chongqing, with Wanzhou District, Fengjie County, and Yunyang County accounting for the largest proportions of 1.55%, 1.45%, and 1.44% respectively. 6.00% of industrial enterprises are distributed in the urban cluster of the Wuling Mountain area in southeast Chongqing.

FIGURE 3. Regional distribution of industrial enterprises in Chongqing.
The spatial distribution characteristics of the economic location levels of industrial enterprises in Chongqing are shown in Figure 4, showing obvious clustering characteristics in space. According to the spatial autocorrelation analysis, the Moran’s I value for the economic location levels of industrial enterprises in Chongqing is .4233, the Z score is 5.956, and the p-value is .00, indicating that the spatial combined effect is relatively significant and has a strong positive correlation. However, there are certain differences. For example, industrial enterprises in the nine districts of the central city perform significantly better than those in other districts and counties in terms of the economic location level.
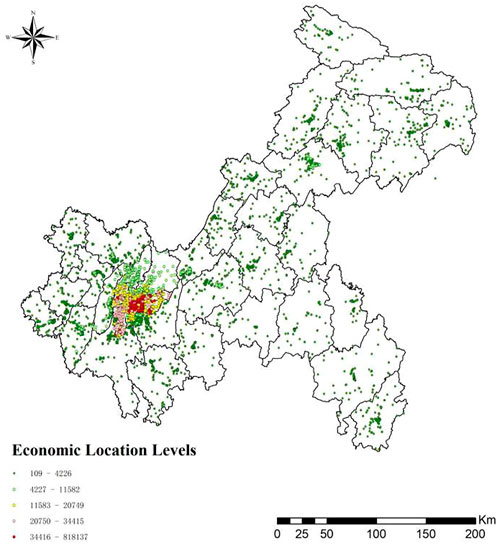
FIGURE 4. Economic location levels distribution of industrial enterprises in Chongqing.
Natural and unnatural factors such as transportation, climate, topography, and the level of economic development all have an impact on the location choice and economic location formation of industrial enterprises. Therefore, this study describes the location characteristics of industrial enterprises in Chongqing from the following aspects.
Transportation accessibility, the shortest traffic route to a place, is an essential factor for the production and operation of industrial enterprises. To investigate the spatial heterogeneity of industrial enterprises’ distribution in terms of transportation accessibility, this study firstly calculated the spatial distances between industrial enterprises from road networks at different levels and conducted an overlay analysis of industrial enterprises and road networks (Figure 5). The results showed that about 93.50%, 60,34%, 96.67%, and 97.57% of industrial enterprises in Chongqing have distributed within a 10 km range away from the motorway networks, national highways, provincial highways, and county highways respectively, among which about 22.33%, 16.29%, 54.15%, and 43.39% of industrial enterprises are located in the 1 km buffer zone of the motorway networks, national highways, provincial highways, and county highways respectively (Figure 6). The accessibility is closely related to the spatial distribution of industrial enterprises. As better transportation accessibility facilitates the smooth circulation of production factors and goods such as raw materials, energy resources, and labor force, more industrial enterprises are located close to road networks, with higher levels of clustering and lower costs of industrial production.
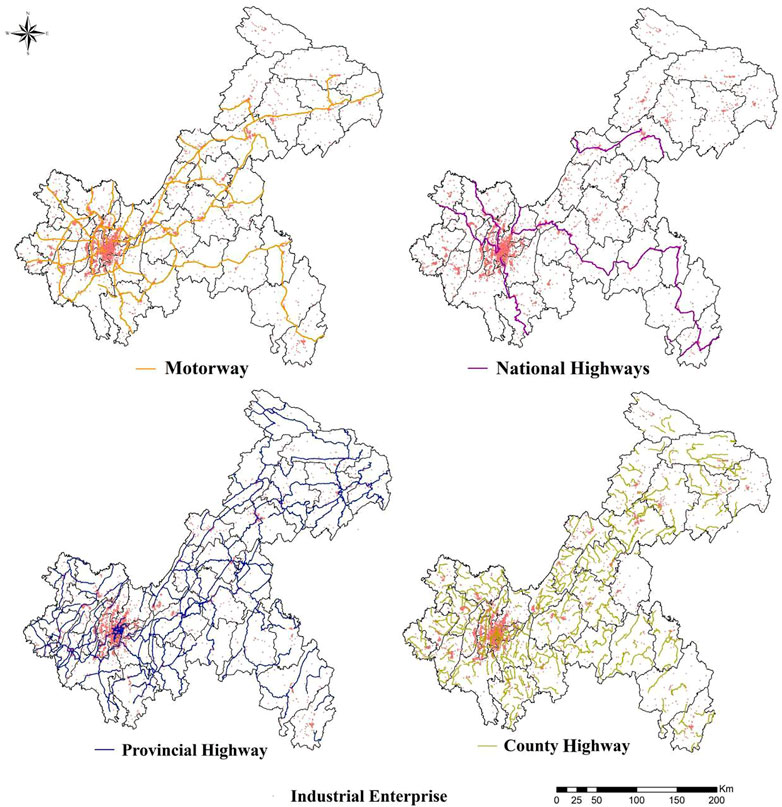
FIGURE 5. Transportation Accessibility characteristics of industrial enterprises in Chongqing.
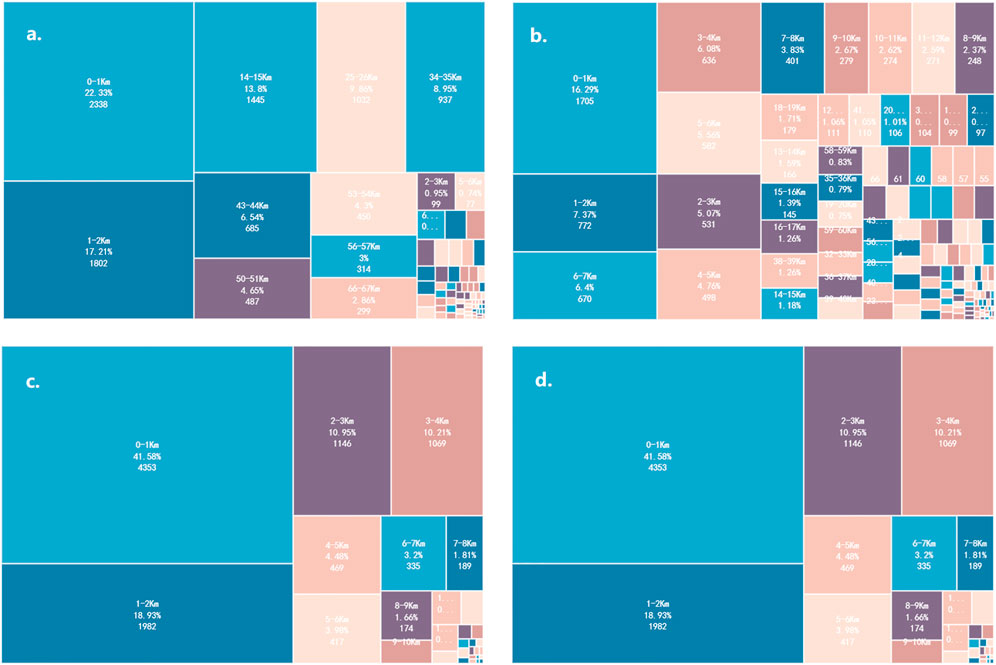
FIGURE 6. Distribution of the number of industrial enterprises in different buffer zones (1). (in which, (A–D) denotes radius buffer zones for motorway, national highways, provincial highways, and county highways respectively).
Chongqing has a dense network of rivers, with the upper reaches of the Yangtze River and its major tributaries such as the Jialing River, the WuJiang River, and the QiJiang River flowing through. Industrial enterprises in the city are mostly located along rivers due to production and business needs, such as energy consumption, water transportation, water drawing, and pollution discharge. This study calculated the spatial distances between industrial enterprises and the Yangtze River and its important tributaries and conducted an overlay analysis of the industrial enterprises and the river system (Figures 7, 8). The results show that about 73.57%, 56.72%, and 19.42% of industrial enterprises in Chongqing are distributed within the 10km, 5km, and 1 km buffer zones of the Yangtze River and its major tributaries, respectively, and these enterprises show prominent characteristic of being located along rivers.
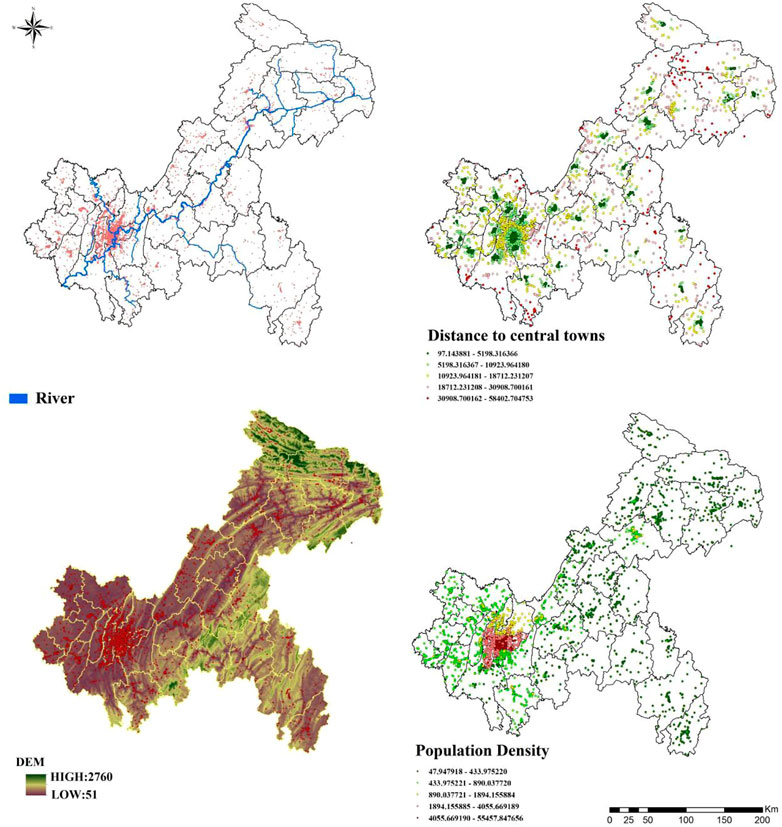
FIGURE 7. Spatial characteristics of the distribution of industrial enterprises in Chongqing.
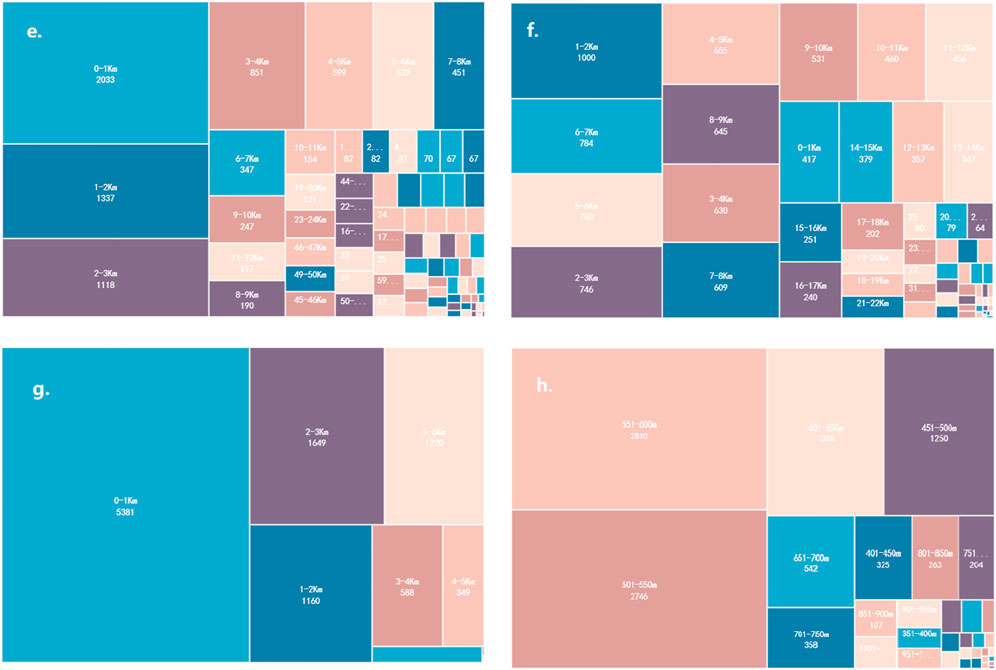
FIGURE 8. Distribution of the number of industrial enterprises in different buffer zones (2). (in which, (E–H) denotes radius buffer zones for river, central towns, population density, and DEM respectively).
Traditional central towns in various regions are, on the one hand, important places for the procurement and trading of production and living goods for the production and operation of industrial enterprises, and market for leisure and consumption on the other. The distance to central towns influences the economic location selection of industrial enterprises to a certain extent. Therefore, this study measured the shortest spatial distances between industrial enterprises and traditional regions and conducted a spatial overlay analysis. The results showed that about 64.83%, 33.36%, and 4.63% of the industrial enterprises are located within the spatial buffer zones that are 10 km, 5 km, and 1 km away from the central towns, respectively (Figures 7, 8).
Chongqing has strongly undulating topography and diverse geomorphic features, with an average altitude of 734 m. While the west part of the city is low-lying, the east part has a higher altitude. Topographic conditions play a significant play in the location selection of industrial enterprises. This study conducted statistics on the altitudes of industrial enterprises and found that 93.48% of the enterprises are located below 800 m above sea level, and 49.82% of industrial enterprises have an altitude ranging from 500 to 600 m above sea level (Figures 7, 8).
The labor force is a crucial input factor for industrial production, and population density is a strong attraction for industrial enterprises that are about to choose a location. According to the kilometer grid map of population density and the spatial overlay analysis of industrial enterprises in 2020, about 52.36% of industrial enterprises are located in areas with a population density of 50-150 people/km2, about 21.06% in areas with a population density of 3051-7050 people/km2, and 11.47% in areas with a relatively high population density of 5051-6050 people/km2 (Figures 7, 8).
To further explore the formation and constraints of the economic locations of industrial enterprises in Chongqing, this study took GDP, which reflects the economic locations of industrial enterprises in Chongqing, as the dependent variable, and selected, based on the bibliographic index, factors related to the location selection of industrial enterprises, such as transportation accessibility, distance to river systems, distance to central towns, population density, topography, precipitation, air temperature, and accumulated temperature, as the dependent variables, and selected, through correlation test, tolerance test, and VIF test, six indicators including the DMW,DNH,DCH, DCC, DR, and POP, to construct a spatial regression model (Table 1). Meanwhile, the GWR model and ordinary least squares (OLS) model were compared to avoid the possible contingency of a single model.
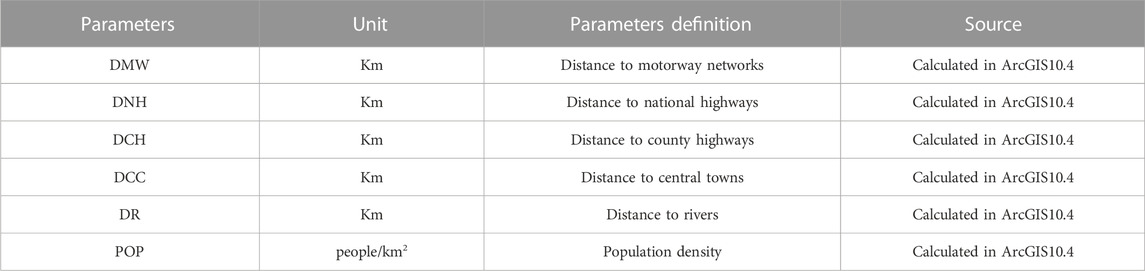
TABLE 1. Model parameters description.
The parameter estimation of the OLS model (Table 2) shows that the VIF values are all less than 7.5, indicating low multicollinearity of the explanatory variables. According to the T statistic and p-value, DMW, DNH, DCH, DCC, DR, and POP exceed the 1% significance level, and all have significant impacts on the economic location distribution of industrial enterprises. In terms of the coefficient of influence, except for DMW, all other factors show the same trend as the economic location distribution of industrial enterprises. In other words, the shorter the distance to national highways, county highways, river systems, and central towns and the higher the population density is, the higher the GDP of the economic location is, while DMW shows a reverse trend, indicating that a longer distance from highways means better economic location conditions of industrial enterprises, which is consistent with the distribution trend of highways far from towns and cities.
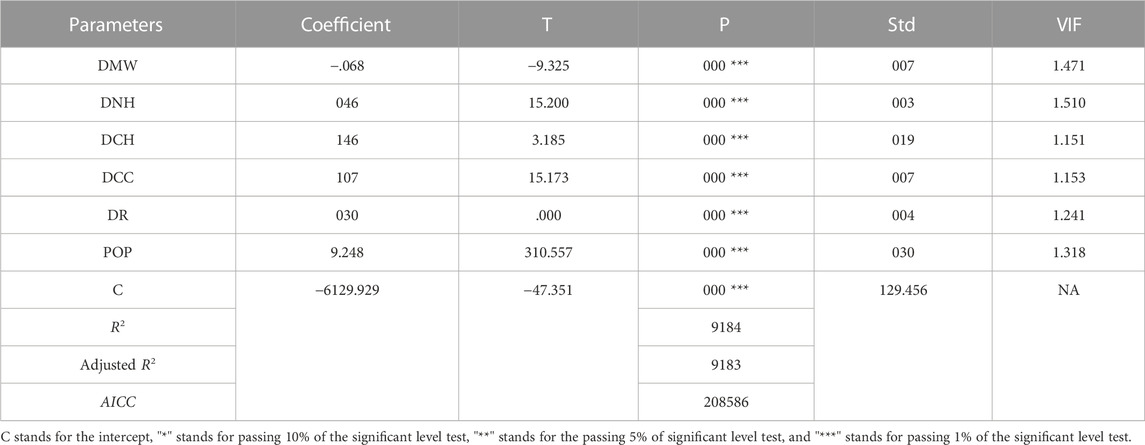
TABLE 2. Model parameters of the OLS model.
The OLS model considers space to be homogeneous and only considers the global characteristics of the regression coefficients, ignoring the spatial differences at each local regional level. Therefore, this study constructed a GWR model based on GWR4.0 to analyze the spatial differences in the formation of the economic locations of industrial enterprises in Chongqing from the perspective of spatial heterogeneity.
The results of the model calculations (Table 3) show that the AICC value of the GWR model is much smaller than that of a general OLS regression, and the GWR model regression has higher adjusted goodness of fit than the general OLS model. In summary, the importance and necessity of using the GWR model estimation in this study can be verified.
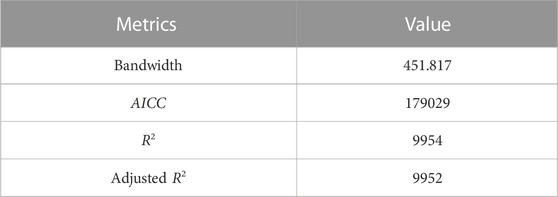
TABLE 3. Model parameters of the GWR model.
Meanwhile, considering that the impact of each influencing factor on the economic location levels of industrial enterprises varies with spatial location, this study further visualized the regression results of the GWR model coefficients to highlight the hysteresis effect and spillover effect of its regression coefficients in geographic space.
As shown in Figure 9, DMW is negatively correlated with the economic location levels of industrial enterprises (i.e. a shorter distance to the highway network corresponds to a lower economic location level). The high and low values of the regression coefficients are mainly concentrated in the nine districts of the central city, among which Yuzhong and Nanan Districts, both located in the center of Chongqing and are the economic and financial centers of the city, are typical low-value districts. With GDP per unit area of land much higher than that of other districts and counties, these two districts have a long history of urban construction and road construction. They are far away from motorway networks, so they present low regression coefficients. Jiangbei and Yubei Districts, as new economic zones drastically developed in Chongqing in recent years, have a higher demand for the accessibility and efficiency of logistics, so they have the densest motorway networks in all districts and counties. Therefore, their regression coefficients are mainly positive values (i.e. a shorter distance to the highway network corresponds to a higher economic location level). Transportation accessibility indicators such as DNH, DR, and DCH are mainly positively correlated with the spatial distribution of industrial enterprises. Similar differences in regression coefficients caused by urban construction, road construction, and industrial development are also reflected in DNH and DR. For example, districts and counties such as Shapingba, Jiulongpo, and Nanan have a long history of development and prospered thanks to major transportation routes such as national highways, provincial highways, and the Yangtze River water system in the early days. Therefore, the spatial distribution of industrial enterprises in these regions is closely related to these transportation routes, and the economic location level presents the distribution characteristics of “a shorter distance to the main transportation routes corresponding to a higher regression coefficient’’. In addition, regarding urban functional zoning, the regression coefficients of the central city metropolitan area are higher than those of other functional areas. In terms of the impact of DCH, Jiangbei District, Yubei District, and some emerging regions, such as Fengdu District and Qijiang District, show relatively low densities of national highways and provincial highways due to their relatively late urban development, but their transportation lines densities are higher, specifically reflected in more well-distributed and dense county highway networks, so the regression coefficients of DCH of these districts and counties show greater differences than those of DR.

FIGURE 9. Spatial distribution of the regression coefficients of various influencing factors Estimated by the GWR model.
The DCC indicator measures the extent to which the economic location of an industrial enterprise is away from central towns, and its regression coefficient is mainly positive. From the perspective of urban functional zoning, the economic locations of industrial enterprises in the urban cluster of the Three Gorges Reservoir area in northeast Chongqing and the urban cluster of the Wuling Mountain area in southeast Chongqing have a tendency of being close to central towns, where shorter distances to central towns of the regions correspond to better economic location conditions of industrial enterprises. Regions in the central city metropolitan area, by contrast, present drastic spatial differences. The distribution of industrial enterprises in Yubei, Nanan, and Yuzhong Districts is entirely different from that in Jiulongpo and Shapingba Districts. The former shows a significant positive correlation, while the latter shows a significant negative correlation, which is closely related to the industrial categories of the industries enterprise in those regions. Environment-friendly industries, such as precision instruments and high-tech industries, tend to cluster in central urban areas such as Nanan District and Yubei District. In contrast, Jiulongpo District houses a lot of high-energy consuming and polluting medium and large industrial enterprises such as Chongqing Power Plant and Jiulongpo Power Plant that both big consumers of coal. As these enterprises are generally far away from the central towns, the regression coefficients for the nine districts of the central city greatly vary. In general, POP positively impacts the economic location levels of industrial enterprises in a significant manner, except in very few districts. In particular, the impacts of POP on the economic location levels of industrial enterprises are the most significant in the nine districts of the central city, while the traditional central towns in various regions, such as Wanzhou, Yongchuan, and Fuling Districts all represent relatively high regression coefficient, indicating that places that are more densely populated can better economic location conditions of industrial enterprises and the population factor drastically drives the selection and formation of enterprise locations.
The spatial heterogeneity of industrial enterprises and the formation of their economic locations are jointly caused by natural, social, economic, and policy factors that are acting together and accumulating in cycles, and the formation of micro enterprises’ economic locations is also a specific manifestation of regional economic and industrial development (Chisholm, 1971; Golley, 2002; Uwe Deichmann et al., 2008; Zhang et al., 2021). Existing studies on the distribution and economic locations of industrial enterprises are mostly focused on micro individuals, such as the location formation of single industrial enterprises, such as Chemical industry and steel industry (Abrudan et al., 2016; Powe and Willis, 1998; Wu and Yang, 2018), or on regions from a macro and holistic perspective (Rayp, 2015; Wang Q. et al., 2020). The research data are mainly based on micro-surveys and statistical yearbooks, and the research conclusions generally face the problem of poor spatial heterogeneity. This study, integrating the two dimensions, started from the micro individuals of industrial enterprises in Chongqing and discussed the spatial distribution of these enterprises and the formation of their economic locations based on text data mining, POI, and spatial information technologies, revealing the spatial differences in the formation of the economic locations of industrial enterprises, and to a certain extent bridging the gap between the “micro-individual” and “macro-whole” studies in research on industrial location.
In the industrial development layout of most cities, industrial enterprises tend to expand along primary transportation routes to enjoy more favorable economic locations. For example, industries in Houston, United State, develop along the highway axis of the Gulf of Mexico; heavy chemical industries in the Ruhr industrial region, Germany, concentrate along the Rhine River; heavy industries in the old industrial bases in Northeast China are distributed and expand along railways (Bremer and Sander, 2004; Can-Fei et al., 2008). This study used the GWR model to study the formation of the economic locations of industrial enterprises in Chongqing through transportation accessibility indicators such as DNH, DCH, and DR. The results showed that DNH, DCH, and DR have significant positive impacts on the formation of the economic locations of industrial enterprises, and DMW has a certain negative impact. There is strong spatial heterogeneity in the impacts according to the type of industry and the actual situation of road traffic in various regions. DNH and DR show significant spatial differences. Specifically, as the urban construction and industrial enterprises in Chongqing were mostly distributed along the main tributaries of the Yangtze River and main transportation routes such as national and provincial highways in the early years, the economic locations of industrial enterprises in the traditional agglomeration areas of such enterprises such as Jiulongpo and Nanan Districts show a strong positive spatial correlation with DNH, DCH, and DR, while new economic development zones or hi-tech development zones have new manufacturing industries and export-oriented economies and higher requirements for logistics accessibility and efficiency for industrial development (A et al., 2014; Chen et al., 2022), such as Yubei and Jiangbei Districts, which also attach great importance to transportation location conditions, as shown by the extremely high regression coefficients of enterprises in these regions in terms of DMW, coupled with denser county highway networks.
The environment is a pivotal factor in the formation of economic locations of industrial enterprises. Tian constructed the regional-industrial interaction model and used a panel data model to demonstrate that the inhibiting effects of environmental factors on polluting industries have become increasingly obvious in recent years (Tian et al., 2018). Liu further studied the effect of environmental regulation on the spatial spillover of industrial pollution and found that environmental regulation has a significant inhibiting effect on the spillover of industrial pollution (Liu et al., 2021). This is reflected in whether the economic locations of industrial enterprises in Chongqing are close or far from central towns. For example, in traditional old industrial areas such as Jiulongpo and Shapingba Districts, polluting enterprises including Chongqing Power Plant and Jiulongpo Power Plant are located far from central towns (i.e. a longer distance to central towns corresponds to better economic location conditions). This is contrary to the expected effect of the OLS global regression but also more in line with the reality of industrial development. Taking Jiulongpo District as an example, it is currently vigorously carrying out industrial structure upgrading, eliminating and relocating a number of high energy-consuming enterprises. With the further implementation of China’s Yangtze River protection strategy, similar high polluting and energy-intensive enterprises will move further away from the central towns and the main tributaries of the Yangtze River (Hou et al., 2021). In addition, the population factor has been widely discussed in studies on industrial economic location. Generally speaking, higher population densities mean more abundant labor resources and vast product consumption markets and lead to better economic location conditions for enterprises. Through the relationship between population mobility and economic growth in Chongqing, Li showed that the population factor has a significant inhibiting effect on regional economic growth, and the driving effect of industrial investment on the economy is more obvious in densely populated areas than in sparsely populated areas (Xiao-Yang et al., 2018). Yang also showed, through the study on population density and enterprise productivity, that population density, when it exceeds a certain threshold, has a significant promoting effect on enterprise productivity (Yang et al., 2018). In the conclusion of this study, the high regression coefficients of high population densities in the nine districts of the central city on enterprises’ economic locations are consistent with the research conclusions to a certain extent.
Based on spatial information technologies such as POI and API, as well as GWR, this study, taking Chongqing, a municipality directly under the central government in Western China, as an example, investigated the characteristics of spatial distribution and economic locations of industrial enterprises in the city, as well as how these characteristics took shape. The results showed that factors such as DNH, DCH, DR, DCC, and POP have significant positive impacts on the formation of economic locations of industrial enterprises, while DMW exerts a certain negative influence. There is strong spatial heterogeneity in the impacts according to the type of industry and the actual situation regional industrial development in various regions. In addition, factors related to transportation accessibility, environment, and labor force play a moderating role in the formation of economic locations of industrial enterprises. In a nutshell, it provides some theoretical and practical basis for formulating reasonable industrial spatial planning, guiding industrial development, and alleviating urban problems to explore the spatial distribution and economic location characteristics of industrial enterprises in Chongqing at the spatial level.
This study has the following main limitations. Firstly, in terms of the selection of industrial enterprises, only ones with a registered capital of more than one million were selected, which may not be representative enough. Secondly, in terms of the factors related to the formation of economic locations, the indicators, restricted by the availability of micro-data, are not comprehensive enough, and there is a lack of sufficient verification of the data accuracy. In the follow-up work, we will further strengthen the discussion and research on the above issues.
The original contributions presented in the study are included in the article/supplementary material, further inquiries can be directed to the corresponding author.
ZT conceived and designed the experiments; ZT, MF performed the experiments; ZT, YW analyzed the data; ZT contributed materials/analysis tools; ZT, MF, YZ, and YW wrote the paper, ZT reviewed drafts of the paper.
We gratefully acknowledge the Supported by National Social Science Fund of China (20CJL022).
The authors declare that the research was conducted in the absence of any commercial or financial relationships that could be construed as a potential conflict of interest.
All claims expressed in this article are solely those of the authors and do not necessarily represent those of their affiliated organizations, or those of the publisher, the editors and the reviewers. Any product that may be evaluated in this article, or claim that may be made by its manufacturer, is not guaranteed or endorsed by the publisher.
Abrudan, M. M., Abrudan, L. C., and Roman, T. (2016). The investment location decisions in the steel industry. Metal. -Sisak then Zagreb- 55, 263–266.
Baykov, A. (2010). The location of heavy industry in the U.S.S.R. Oxf. Bull. Econ. Statistics 3, 252–256. doi:10.1111/j.1468-0084.1941.mp3011004.x
Bremer, S., and Sander, H. (2004). View from the road: Environmental simulation for the fractal city of rhine Ruhr. Neurobiol. Aging 18, 423.
Can-Fei, H. E., Xiu-Zhen, X., and Feng-Hua, P. (2008). Locational studies of Chinese manufacturing industries. Geogr. Res. 27, 3.
Chen, W., Su, Z., Wang, Y., Wang, Q., and Zhao, G. (2022). Do the rank difference of industrial development zones affect land use efficiency? A regional analysis in China. Socio-Economic Plan. Sci. 80, 101168. doi:10.1016/j.seps.2021.101168
Cheng, W., Tian, Y., Yan, Y., Junjie, L. I., Yang, J., Zheng, X. U., et al. (2018). Construction and analysis of location index of coal chemical industry in China under multi-objectives constraints. Int. Pet. Econ. 219.
Chisholm, M. (1971). Spatial policy problems of the British economy: Freight transport costs, industrial location and regional development. Oxford, UK: University Press.
Golley, J. (2002). Regional patterns of industrial development during China’s economic transition. Econ. Transition 10, 761–801. doi:10.1111/1468-0351.t01-1-00133
Gu, Y., and Ding, J. (2022). Analysis of the spatial characteristics and influencing factors of e-commerce industrial chains from the perspective of embeddedness: Taking xiong'an new area in China as an example. Complexity 2022, 1–15. doi:10.1155/2022/7135969
Helsley, R. W. (2003). Economics of agglomeration: Cities, industrial location and regional growth. Econ. J. 35, 584–592.
Hou, Y., Zhang, K., Zhu, Y., and Liu, W. (2021). Spatial and temporal differentiation and influencing factors of environmental governance performance in the Yangtze River Delta, China. Sci. Total Environ. 801, 149699. doi:10.1016/j.scitotenv.2021.149699
Liu, M. F., Chen, H. M., and Y, X. (2021). Study on the effect of environmental regulation on industrial pollution spillover:empirical evidence from 285 cities nationwide. Econ. Geogr. 9. doi:10.15957/j.cnki.jjdl.2021.02.021
McMillen, D. P. (2004). Geographically weighted regression: The analysis of spatially varying relationships. Am. J. Agric. Econ. 86, 554–556. doi:10.1111/j.0002-9092.2004.600_2.x
Mohan, R. (1997). Industrial location policies and their implications for India. Urbanization in Large Developing Countries China Indonesia Brazil and India. Oxford, UK: Clarendon Press.
Nguyen, T., and Diez, J. R. (2017). Multinational enterprises and industrial spatial concentration patterns in the red river delta and southeast vietnam. Ann. regional Sci. 59, 101–138. doi:10.1007/s00168-017-0820-y
Ottaviano, M., and I.P. Ottaviano, G. (1999). Growing locations: Industry location in a model of endogenous growth. Eur. Econ. Rev. 43, 281–302. doi:10.1016/s0014-2921(98)00031-2
Pe'Er, A., and Vertinsky, I. (2006). Who enters, where, and why? The influence of capabilities and initial resource endowments on the location choices of de novo enterprises. Strateg. Organ. 6. doi:10.2139/ssrn.885690
Peneder, M. (2015). Entrepreneurial competition and industrial location. Cheltenham, UK: Edward Elgar Publishing.
Powe, N. A., and Willis, K. G. (1998). Industrial location and residential disamenity: A case study of the chemical industry in castleford, england. J. Environ. Manag. 53, 17–29. doi:10.1006/jema.1998.0193
Rayp, G. (2015). What determined the location of industry in Belgium, 1896–1961? J. Interdiscip. Hist. 46, 393–419. doi:10.1162/jinh_a_00869
Renfeng, M. A., Wang, T., Zhang, W., and Xueli, L. I. (2018). Location model of cultural and creative industry and its application in Zhejiang. Geogr. Res. 37 (2), 3379–3390. doi:10.11821/dlyj201802011
Rikalovic, A. (2015). A fuzzy expert system for industrial location factor analysis. Acta Polytech. Hung. 12, 33–51. doi:10.12700/APH.12.2.2015.2.3
Spinola, N., Spinola, C., and Pereira, A. (2015). Business location: strategic factor for the development of regions? One approach on industrial location policy of Bahia. ERSA conference papers. Louvain-la-Neuve: European Regional Science Association (ERSA).
Sun, P., Song, W., and Xiu, C. (2014). Geographic clustering of sector enterprises and urban form in Shenyang. Geogr. Res. 142 (4), 05016006. doi:10.11821/dlyj201410005
Tian, G., Miao, C., Hu, Z., and Miao, J. (2018). Environmental regulation, local protection and the spatial distribution of pollution-intensive industries in China. Acta Geogr. Sin. 73 (10), 1954–1969. doi:10.11821/dlxb201810010
Uwe Deichmann, S. V. L., Redding, Stephen J., and Venables, A. J. (2008). Industrial location in developing countries. World Bank Res. Observer. 23, 219–246. doi:10.1093/wbro/lkn007
Viladecans-Marsal, E. (2004). Agglomeration economies and industrial location: City-level evidence. J. Econ. Geogr. 4, 565–582. doi:10.1093/jnlecg/lbh040
Wang, K., Li, G., and Liu, H. (2020). Location choice of industrial land reduction in metropolitan area: Evidence from shanghai in China. Locat. choice industrial land Reduct. Metropolitan Area Evid. Shanghai China Growth Change 51, 1837–1859. doi:10.1111/grow.12418
Wang, Q., Wang, Y., Chen, W., Zhou, X., Zhao, M., and Zhang, B. (2020). Do land price variation and environmental regulation improve chemical industrial agglomeration? A regional analysis in China. Land Use Policy 94, 104568. doi:10.1016/j.landusepol.2020.104568
Wu, S., and Yang, Z. (2018). Locating manufacturing industries by flow-capturing location model – case of Chinese steel industry. Transp. Res. Part E Logist. Transp. Rev. 112, 1–11. doi:10.1016/j.tre.2018.01.017
Wu, W., Shi, S. Q., and Shi, Q. (1997). The tracing research of industrial location. Chin. Geogr. Sci. 7, 59–67. doi:10.1007/s11769-997-0073-2
Wu, Y., Miao, C., Wei, Y. D., and Miao, J. (2021). Investment location dynamics and influencing factors of pollution-intensive industries in China: A study of chemical firms. Growth Change 52, 1997–2015. doi:10.1111/grow.12537
Xiao-Yang, L. I., Zhao, H. L., and Zhang, Q. (2018). On population aging, labor mobility and economic growth——based on the panel data of ten provinces in China's western region. J. Southwest Univ. Sci. Ed. 40 (4), 76–84.
Yang, B. J., Huang, H. S., Economics, S. O., and University, J. (2018). Urban population density, thick labor market and firm productivity of development zone. China Ind. Econ. doi:10.19581/j.cnki.ciejournal.2018.08.005
Yong, L. (2012). The impacts of heavy chemical industry on sustainable development and its solutions. Urban Insight 5 (1), 45–49. doi:10.3969/j.issn.1674-7178.2012.01.004
Zeng, S. X., Liu, H. C., Tam, C. M., and Shao, Y. K. (2008). Cluster analysis for studying industrial sustainability: An empirical study in shanghai. J. Clean. Prod 16, 1090–1097. doi:10.1016/j.jclepro.2007.06.004
Keywords: industrial location, economic location, spatial heterogeneity, GWR, Chongqing
Citation: Tang Z, Fu M, Wang Y and Zhao Y (2023) Spatial characteristics of industrial economic location and its formation in Chongqing, China. Front. Environ. Sci. 11:1115067. doi: 10.3389/fenvs.2023.1115067
Received: 03 December 2022; Accepted: 02 January 2023;
Published: 12 January 2023.
Edited by:
Fengtai Zhang, Chongqing University of Technology, ChinaReviewed by:
Kai Liu, Shandong Normal University, ChinaCopyright © 2023 Tang, Fu, Wang and Zhao. This is an open-access article distributed under the terms of the Creative Commons Attribution License (CC BY). The use, distribution or reproduction in other forums is permitted, provided the original author(s) and the copyright owner(s) are credited and that the original publication in this journal is cited, in accordance with accepted academic practice. No use, distribution or reproduction is permitted which does not comply with these terms.
*Correspondence: Zhonglin Tang, dGFuZ3psQGN0YnUuZWR1LmNu
Disclaimer: All claims expressed in this article are solely those of the authors and do not necessarily represent those of their affiliated organizations, or those of the publisher, the editors and the reviewers. Any product that may be evaluated in this article or claim that may be made by its manufacturer is not guaranteed or endorsed by the publisher.
Research integrity at Frontiers
Learn more about the work of our research integrity team to safeguard the quality of each article we publish.